Embed Size (px)
DESCRIPTION
Analysis of the Mauritian tourism sector outlook for 2012.
Citation preview

Disclaimer: Information has been collected from sources believed to be reliable and in good faith by the company, but no representation or warranty, expressed or implied, is made as to their accuracy, completeness or correctness. Information contained therein does not represent the views of Credit Guarantee Insurance Co. Ltd or its executives. Credit Guarantee Insurance Co. Ltd disclaims all liability as regards to its content.
MARKET MONITOR
Tourism Authors:
Zayd Soobedar – Credit Risk Manager
Vibha Ramdhony – Trainee Underwriter
September 2012

2
OUTLOOK FOR DOMESTIC TOURISM SECTOR 2012
Dark clouds looming over the horizon…
The economic turmoil in Europe has taken its toll on tourist
arrivals. Statistics for the period of January-July 2012 are portraying
a gloomy outlook for the tourism sector for the current year.
Tourist arrivals rose marginally by only 0.1% yoy for the first 7
months of 2012 driven by the adverse outlook and slowdown in
our main source destinations and the Central Statistics Office has
reviewed its forecast of 980,000 tourist arrivals for the year 2012
to 960,000, representing a decrease of 0.5% over the figure of
964,642 in 2011. Our forecast for the year is close to the CSO
figure and stands around 959,000 tourists (representing a mild
drop of 0.6% yoy).
… mired with escalating downside risks…
The outlook for the domestic tourism sector 2012 is likely to be
adversely affected by the following downside risks:
Further economic slowdown in European economies and the
dependence of our domestic market on this region
The weakening of the Euro vis-à-vis the Mauritian rupee
implying lower revenues for the sector
Increased regional competition especially with Maldives,
Seychelles and Sri Lanka
Lower investment in the domestic tourism industry
Declining risk appetite of domestic
commercial banks regarding tourism-
sector related projects due to higher
credit risk
Sustainability of the high debt levels for
the main hotel groups
Excess room supply
… especially with a downturn in our
main markets…
More alarmingly, tourists from Europe (our
main market) have declined by 7.1% yoy to
316,213 for the period under review.
Further breakdown reveals that arrivals
from France, UK, Germany and Italy have
plummeted.
Arrivals from our leading source market
(France) experienced a sharp drop of 11.2%
yoy for the period of January to July 2012
and the same negative trend was present in
the number of tourists from Italy falling
from 30,379 for the same period in 2011 to
23,058 in the first 7 months of 2012. The
UK market, which already shrunk in recent
years, was faced with only a 3.8% yoy drop.
The outlook for European markets for the
year 2012 is bleak as the statistics are
clearly suggesting the persisting impact of
the recession in Europe. Another adverse
Table 1: Tourist Arrivals by Country of Residence, January - July of 2011 and
2012
Country Jan-July
% Growth yoy
2011 2012 2011/2012
EUROPE 340,227 316,213 -7.1
France 172,306 153,045 -11.2
United Kingdom 47,383 45,574 -3.8
Italy 30,379 23,058 -24.1
AFRICA 131,341 146,366 11.4
Reunion 68,826 80,574 17.1
South Africa 45,257 45,771 1.1
Malagasy Rep. 6,232 7,307 17.2
ASIA 53,094 60,559 14.1
India 33,954 34,199 0.7
P. Rep. of China 7,647 11,441 49.6
United Arab Emirates 1,918 2,696 40.6
OCEANIA 8,946 9,763 9.1
Australia 8,380 9,265 10.6
Other Oceanian 566 498 -12.0
AMERICA 8,295 10,049 21.1
USA 3,889 4,093 5.2
Canada 2,431 2,686 10.5
Other American 1,975 3,270 65.6
OTHER & N.STATED 735 369 -49.8
ALL COUNTRIES 542,638 543,319 0.1
THE BOX: Economic performance outlook for 2012 in our main tourist generating
countries
France: For the whole of 2011, GDP rose by 1.7% yoy. However, growth for 2012 is
expected to be only by 0.3 % yoy. Despite the fact that inflation is expected to remain contained for 2012, the rise in unemployment together with the tightening in budget policy and likely decrease in purchasing power, consumer confidence remains low. [Outlook: Fair]
United Kingdom: The UK economy expanded by only 0.7% yoy in 2011 and the growth for 2012 is forecasted to be even lower during 2012 at only 0.2% yoy. Economic activity has again contracted in the 1Q12 (-0.3% q/q) and the 2Q12 growth could be shrinking again.
Declining wages, worsening unemployment and heavy debt burden are not helping to build British household confidence. Inflationary pressures have nonetheless decreased to 3.2 % since January from the 5.2 % peak in September 2011. With bank lending being more and more restricted and
rising bankruptcies, the conditions remain gloomy. [Outlook: Gloomy]
India: Economic activity slowed down slightly in India with a hike of 7.1% yoy in 2011
and the trend is expected to linger during 2012 with estimated 2012 growth to be around 6.1%
yoy. Inflation is expected to remain high though its fundamentals remain strong such as high savings
and investment rates and moderate foreign debt. [Outlook: Good]
South Africa: The South African economy after a growth of 3.1% yoy in 2011 is
projected to experience milder expansion of 2.6% yoy this year. The general trend of low interest rates is driving consumption however its growth is being restricted by the high unemployment rate of 25% and slow growth in wages. The manufacturing sector of the country is being affected by the weak demand from the European Union. Its mining sector is also being affected due to a lack of
investment and strikes. Moreover, inflation has risen from 5% in 2011 to 6% in 2012. [Outlook: Fair]
Table 2: Economic outlook in main markets, 2010 to 2013
Country/Region 2010 2011 2012F 2013F Advanced Economies 3.2 1.6 1.4 1.9 US 3.0 1.7 2.0 2.3
Germany 3.6 3.1 1.0 1.4 France 1.7 1.7 0.3 0.8 UK 2.1 0.7 0.2 1.4 Sub Saharan Africa 5.3 5.2 5.4 5.3
South Africa 2.9 3.1 2.6 3.3 China 10.4 9.2 8.0 8.5 India 10.8 7.1 6.1 6.5
World Output 5.3 3.9 3.5 3.9
Source: IMF World Economic Outlook

3
OUTLOOK FOR DOMESTIC TOURISM SECTOR 2012
factor that could contribute to further decline in tourist arrivals from European countries is the reduction in the number of seats
by Air Mauritius (around 87,000 between 2006 and 2012) on European routes in an attempt to discontinue unprofitable routes
(cessation of flights to Vienna, Rome and Munich) which have led to higher travel costs to our destination.
... but offset by good performance of emerging markets…
Fortunately, the downturn in the European market was
offset by tourists from other regions with the number
of tourists from non-European countries soaring by
12.2% yoy for the period under review. A shift, though
marginal, from the Eurocentricity of the local tourism
industry can be noted with the good performance of
non-European regions (Figure 1). Africa and Asia, which
accounted for 27% and 11% of total tourist arrivals
respectively, displayed favourable results for January-
July 2012.
African tourists increased considerably by 11.2% yoy
reaching 146,666, driven by the excellent upsurge in the
number of tourists from Reunion Island (80,574 for the
period under review against 68,826 in 2011). The
South African market was less active with a mild
increment (+1.1% yoy) experienced in arrivals.
The Mauritius Tourism Promotion Authority’s (MTPA)
strategy to develop alternative markets like India and
China has yielded positive results so far but requires
further development. Tourist arrival from India rose
slightly by 0.7% yoy to hit 34,199 for the period. On the
other hand, Chinese tourists, albeit having a low
contribution to overall tourist arrivals for January-July
2012, grew significantly by 49.6% yoy to 11,441.
Other countries representing a small part of the market
have realised excellent results for the period explained
by the efforts from the government with its past
national budgets focussing on diversifying our client
base. Statistics show a significant boost in tourist arrivals
from Russia (+89.4% yoy), Kenya (+47.9% yoy) and
Hong Kong which has more than doubled in size
(+119%). Arrivals from the UAE were also on a rise
with a growth of 40.6% yoy. Despite their considerable
expansion, their current market share remains minor. However, these
emerging countries have potential for further growth in the long term
for the domestic tourism sector.
... yet overall occupancy rates stagnating…
The average room occupancy rate for “Large hotels” for 1H12 stagnated
at 64% in line with the figure achieved in the same period last year. A
similar trend was observed in bed occupancy rate which averaged 56%
during the first semester of 2012.
On the other hand, average occupancy rate for “All hotels” for the first
semester of 2012 (62%) was lower than the 2011 mid-year
performance of 65%. Bed occupancy rate was also inferior to 1H11 and
stood at 55% compared to 57% in the previous year. The presence of
non-hotel accommodation facilities are proving to be strong competitors causing hotels to gradually lose their market share
Table 3: Other hotel operational statistics, 2009 to 2012
Year Number as at end of period
Hotels Rooms Bedplaces
2009
Q1 102 11,444 23,148
Q2 97 10,486 21,362
Q3 100 11,102 22,530
Q4 102 11,456 23,235
2010
Q1 105 11,564 23,547
Q2 104 11,362 23,168
Q3 104 11,383 23,296
Q4 112 12,075 24,698
2011
Q1 112 12,082 24,664
Q2 111 11,999 24,493
Q3 109 11,816 24,018
Q4 109 11,925 24,242
2012 Q1 110 12,027 24,446
Q2 107 11,822 24,089
50,000
100,000
150,000
200,000
250,000
300,000
350,000
400,000
EUROPE AFRICA ASIA OCEANIA AMERICA
Num
ber
of
Touri
sts
Region
Figure 1: Tourist Arrivals, January to July 2011/12
Jan-July 2011 Jan-July 2012
0 10 20 30 40 50 60 70 80
2010
2011
2012
2010
2011
2012
All
hote
lsLarg
e h
ote
ls
Room occupancy rate (%)
Type
Figure 2: Room occupancy rate, Quarterly analysis 2010-2012
Q4
Q3
Q2
Q1

4
OUTLOOK FOR DOMESTIC TOURISM SECTOR 2012
(reflected by the decrease in occupancy rates). With an excess in room supply, hotels are implementing aggressive marketing
strategies by lowering prices and providing special packages to increase demand.
At the end of June 2012, there were 113 registered hotels of which 107 were in operation, with a total room capacity of 11,822
and 24,089 bedplaces. “Large hotels”, i.e. well-established beach hotels with more than 80 rooms, numbered 47 (44% of all
registered hotels in operation). These hotels had a combined room capacity of 8,613 with 17,667 bedplaces, representing 73% of
both total room capacity and total bedplaces respectively.
… leading to macroeconomic forecasts being revised downwards…
In June 2012, the CSO forecasted a growth of around 1.6% based on a forecast of 980,000 tourist arrivals in 2012 compared to
964,642 in 2011. However, factoring the revised tourist arrival figures and gloomy outlook in main markets, we project sectoral
growth of Hotels and Restaurants to be nil or negative.
The Bank of Mauritius has also revised its forecast for tourism receipts for the year 2012 to be around Rs 42,542 million (-0.4 %
yoy) compared to Rs 42,717 million in 2011.
…slowdown also impacting on the financial performance of main hotel groups…
The table below shoes the financial performance of listed hotel groups for 2011 and 2012. Apart from Lux Island Resorts Ltd,
the remaining groups are facing difficulties for a sustainable growth in net profit despite the general growth in revenue. By
considering issues regarding rupee strength, economic turmoil in Europe and shrinkage of air access capacity, our hotels are still
operating in unfavourable market conditions.
Table 4: Financial performance for main hotel groups in Mauritius
Hotel Group Revenue results (Rs Million) Net Profit results (Rs Million)
30th June 2011 30th June 2012 Growth yoy 30th June 2011 30th June 2012 Growth yoy
New Mauritius Hotels Ltd 5,961.2 6,445.2 8.1% 801.9 754.5 -5.9%
Sun Resorts Ltd 1,746.2 1,789.9 2.5% 56.5 3.7 -93.5%
Constance Hotel Services Ltd 1,011.6 1,032.4 2.1% (82.5) (81.6) 1.1%
Hotel Group 31st March
2011 31st March
2012 Growth yoy
31st March 2011
31st March 2012
Growth yoy
Lux Island Resorts Ltd 2,865.0 3,259.7 13.8% 303.9 382.7 25.9%
…contributing to higher credit risk associated with market players…
In general, the credit risk level associated with market players is escalating day-by-day and a radical change in the trend is not
expected soon especially with the gloomy outlook for the year. A large number of stakeholders have over recent years
(especially prior to the 2008 financial crisis)
contracted financing for expansion projects.
With drastic declines in profitability, interest-
bearing debt to equity ratio is on the high side
and is close to or greater than 1 time.
On average, this financial leverage ratio is
deteriorating for most businesses in this
industry causing the general Insolvency Risk of
this sector to be Moderate (previously Low).
Waning operating profit of these firms and
soaring debt-servicing pressures, have
contributed to fuel alarming drops in the
interest cover ratio for many tourism-related
businesses, thus causing upward pressures on the Insolvency Risk parameter. However, the high level of non-current assets
(especially land and buildings) provides some reasonable degree of comfort regarding this financial element.
On the other hand, lower revenues due to a weak Euro and slowdown in tourist arrivals have negatively impacted on the
general Default Risk of the domestic tourism sector actors. Many hotels and other tourism-based businesses like restaurants are
mired in a liquidity trap stemming from sharp drops in margins as well as high finance costs and reduced access to finance with
reduced risk appetite of banks/other financial institutions.
Very low
Low
Moderate
High
Very high
Default Risk
Very low
Low
Moderate
High
Very high
Insolvency Risk
5
OUTLOOK FOR DOMESTIC TOURISM SECTOR 2012
Qualitative and quantitative information gathered from several suppliers for
tourism-related businesses confirm a general deterioration in the Payment
Behaviour of some market players (shifting from Normal to nearly Poor). On
average, hotels and restaurants take more time to pay. In 2011, the average
repayment period amounted to around 60 days. For the first half of 2012, the
figure stood around 75 days. There are some specific cases where some hotels
are taking nearly 120 days to pay.
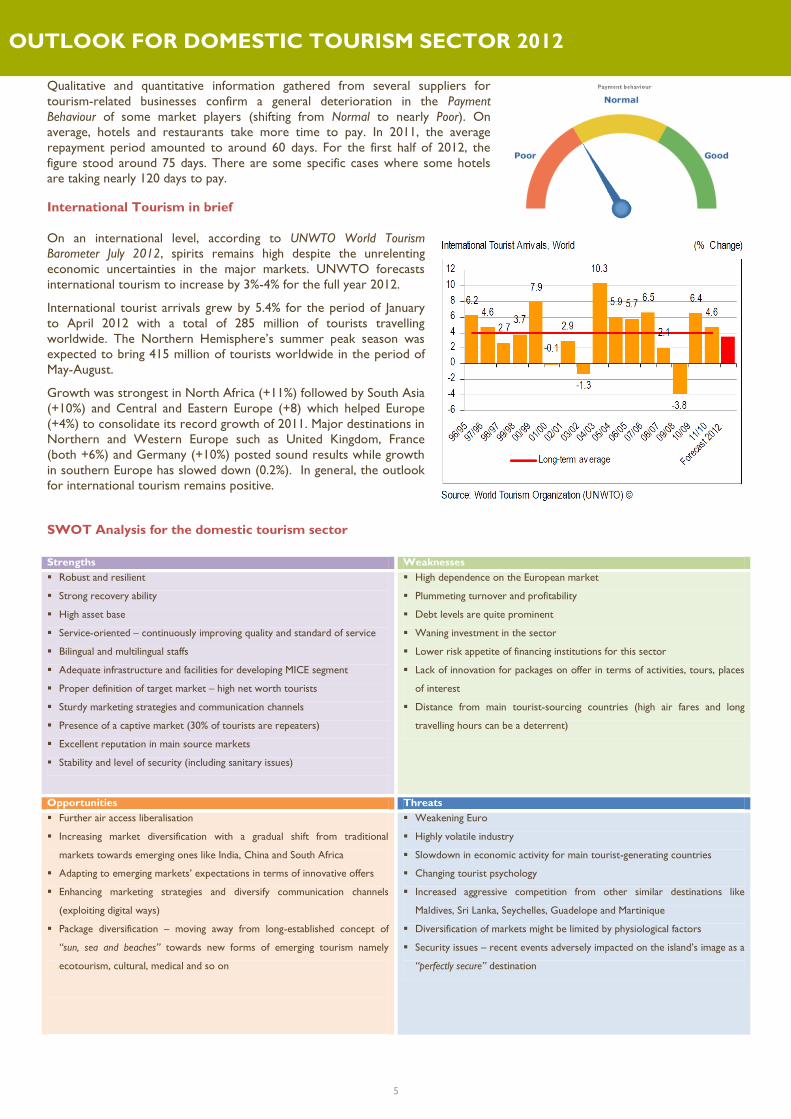
International Tourism in brief
On an international level, according to UNWTO World Tourism
Barometer July 2012, spirits remains high despite the unrelenting
economic uncertainties in the major markets. UNWTO forecasts
international tourism to increase by 3%-4% for the full year 2012.
International tourist arrivals grew by 5.4% for the period of January
to April 2012 with a total of 285 million of tourists travelling
worldwide. The Northern Hemisphere’s summer peak season was
expected to bring 415 million of tourists worldwide in the period of
May-August.
Growth was strongest in North Africa (+11%) followed by South Asia
(+10%) and Central and Eastern Europe (+8) which helped Europe
(+4%) to consolidate its record growth of 2011. Major destinations in
Northern and Western Europe such as United Kingdom, France
(both +6%) and Germany (+10%) posted sound results while growth
in southern Europe has slowed down (0.2%). In general, the outlook
for international tourism remains positive.
SWOT Analysis for the domestic tourism sector
Strengths Weaknesses
Robust and resilient
Strong recovery ability
High asset base
Service-oriented – continuously improving quality and standard of service
Bilingual and multilingual staffs
Adequate infrastructure and facilities for developing MICE segment
Proper definition of target market – high net worth tourists
Sturdy marketing strategies and communication channels
Presence of a captive market (30% of tourists are repeaters)
Excellent reputation in main source markets
Stability and level of security (including sanitary issues)
High dependence on the European market
Plummeting turnover and profitability
Debt levels are quite prominent
Waning investment in the sector
Lower risk appetite of financing institutions for this sector
Lack of innovation for packages on offer in terms of activities, tours, places
of interest
Distance from main tourist-sourcing countries (high air fares and long
travelling hours can be a deterrent)
Opportunities Threats
Further air access liberalisation
Increasing market diversification with a gradual shift from traditional
markets towards emerging ones like India, China and South Africa
Adapting to emerging markets’ expectations in terms of innovative offers
Enhancing marketing strategies and diversify communication channels
(exploiting digital ways)
Package diversification – moving away from long-established concept of
“sun, sea and beaches” towards new forms of emerging tourism namely
ecotourism, cultural, medical and so on
Weakening Euro
Highly volatile industry
Slowdown in economic activity for main tourist-generating countries
Changing tourist psychology
Increased aggressive competition from other similar destinations like
Maldives, Sri Lanka, Seychelles, Guadelope and Martinique
Diversification of markets might be limited by physiological factors
Security issues – recent events adversely impacted on the island’s image as a
“perfectly secure” destination

6
OUTLOOK FOR DOMESTIC TOURISM SECTOR 2012
Conclusion
The domestic tourism sector is currently facing daunting challenges especially with the downturn in our main source markets.
Other factors like eroding market share, weakening of the Euro, reduced risk appetite of banks to lend to tourism-based
businesses and changing consumer dynamics are hanging like the sword of Damocles over the industry. These market drivers are
pinning down even more the recovery scenario.
In addition, intrinsic growth parameters of market players are being hindered by toppling margins, debt-servicing burdens and
liquidity problems of our tourism-based businesses. These could jeopardise the existence of several hotels and restaurants in the
country, even though the sector is known to be robust and resilient. The credit risk associated with these businesses has
drastically deteriorated (low mid-2008 before the crisis and moderate to high in 2012). The long-term well-being of the industry
is also at stake with an astonishing deceleration of investment in the sector with very few new hotel projects and existing hotels’
renovation in the pipeline.
Solutions to these hardships are not readily available, but involve a proper soul-searching for all the stakeholders in the industry
with a lengthy timeframe for the necessary reforms to yield results. These changes would have to be across all levels ranging
from marketing strategies, communication channels, and air access to the quality of service and is the sine qua non condition for
changing the market dynamics. On a long-term perspective, the restructuring must be even carried at a higher echelon involving
strategic plans (e.g. mandatory learning of languages like Afrikaans, Mandarin, Hindi, etc in the curriculum of schools) to prepare
the new generation to cater for the needs of what might be our driving markets (mainly India, South Africa and China) in the
future. Of course, existing clients should not be neglected in the process (Europe accounts for 58% of arrivals and Reunion
Island 15% for the period January-July 2012).
Re-thinking the existing industry model (which has certainly generated positive results in the past, but alas gradually losing pace
and alarmingly starting to lose breath) would be the way for our flagship sector to navigate safely out of the storm!