Embed Size (px)
Citation preview
To: Australian Securities Exchange1
London Stock Exchange
cc: New York Stock Exchange JSE Limited
BARCLAYS ENERGY-POWER CONFERENCE
BHP Billiton President, Petroleum and Potash, Tim Cutt, will present at the Barclays Energy-Power Conference in New York today. A copy of the presentation is attached.
Further information on BHP Billiton can be found at: www.bhpbilliton.com.
Nicole Duncan Company Secretary
1 This release was made outside the hours of operation of the ASX market announcements office.
2 September 2014
BHP Billiton Limited BHP Billiton Plc 171 Collins Street Neathouse Place Melbourne Victoria 3000 Australia London SW1V 1LH UK GPO BOX 86 Tel +44 20 7802 4000 Melbourne Victoria 3001 Australia Fax + 44 20 7802 4111 Tel +61 1300 55 47 57 Fax +61 3 9609 3015 bhpbilliton.com bhpbilliton.com
For
per
sona
l use
onl
y
NEWS RELEASE Release Time IMMEDIATE
Date 2 September 2014
Number 16/14
BHP BILLITON PETROLEUM PRIMED TO DELIVER SIGNIFICANT GROWTH IN
FREE CASH FLOW BHP Billiton President Petroleum and Potash, Tim Cutt, will present today at the Barclays CEO Energy-Power Conference in New York City, where he will reaffirm BHP Billiton’s commitment to a strategy focused on value over volume.
Mr Cutt will highlight the positive outlook for the Onshore US business, underpinned by the outstanding performance of the Black Hawk and the Company’s confidence in its strong acreage position in the Permian.
“BHP Billiton is a top producer in the Eagle Ford with investment prioritised on its liquids-rich Black Hawk acreage. This acreage generates EBITDA margins of over 75 per cent at current prices and is expected to be the single largest producer in our Petroleum portfolio in the 2015 financial year.”
Mr Cutt will also say that the Permian remains an exciting area for BHP Billiton. “We increased our position within our focus area in the Permian by 25 per cent in the 2014 financial year and remain on track to build a 100 kboe/d business by the end of the 2018 financial year. The well results to date are positive and repeatable and there is additional upside to the development program given our longer-term outlook for the field.
“The repetitive nature of shale is ideally suited to BHP Billiton’s productivity agenda and we have seen drilling times in the Black Hawk improve by 21 per cent in the last financial year. The application of technologies including restricted flows of initial production ensures we achieve the best recoveries while being cost effective.
“We plan to invest approximately US$4 billion per annum in our Onshore US business and expect it to be strongly EBIT positive in the 2015 financial year. Free cash flow is expected to be positive by the 2016 financial year and approach US$3 billion per annum by the end of the decade. We reaffirm our plans to deliver approximately 200 kboe/d of liquids by the 2017 financial year from the Eagle Ford and the Permian.
“In our Conventional business, high-return infill drilling and brownfield extensions will maintain stable volumes and largely offset natural field decline, while longer term we have attractive development options that are competing for capital within the Group.
“Our exploration program will continue to focus on large tier-one conventional oil opportunities. In Trinidad and Tobago, where we have our shallow water Angostura asset, we are excited about the potential of the deepwater and have established a significant ‘early-mover’ position.”
For
per
sona
l use
onl
y

Further information on BHP Billiton can be found at: www.bhpbilliton.com.
Media Relations Australia Emily Perry Tel: +61 3 9609 2800 Mobile: +61 477 325 803 email: [email protected] Paul Hitchins Tel: + 61 3 9609 2592 Mobile: + 61 419 315 001 email: [email protected] Eleanor Nichols Tel: +61 3 9609 2360 Mobile: +61 407 064 748 email: [email protected] United Kingdom Ruban Yogarajah Tel: +44 20 7802 4033 Mobile: +44 7827 082 022 email: [email protected] Jennifer White Tel: +44 20 7802 7462 Mobile: +44 7827 253 764 email: [email protected] Americas Ruban Yogarajah Tel: +44 20 7802 4033 Mobile: +44 7827 082 022 email: [email protected]
Investor Relations Australia Tara Dines Tel: +61 3 9609 2222 Mobile: +61 499 249 005 email: [email protected] Jodie Phillips Tel: +61 3 9609 2069 Mobile: +61 418 710 516 email: [email protected] United Kingdom and South Africa Jonathan Price Tel: +44 20 7802 4131 Mobile: +44 7990 527 726 email: [email protected] Dean Simon Tel: +44 20 7802 7461 Mobile: +44 7717 511 193 email: [email protected] Americas James Agar Tel: +1 212 310 1421 Mobile: +1 347 882 3011 email: [email protected] Joseph Suarez Tel: +1 212 310 1422 Mobile: +1 646 400 3803 email: [email protected]
BHP Billiton Limited ABN 49 004 028 077 Registered in Australia Registered Office: Level 16, 171 Collins Street Melbourne Victoria 3000 Australia Tel +61 1300 55 4757 Fax +61 3 9609 3015
BHP Billiton Plc Registration number 3196209 Registered in England and Wales Registered Office: Neathouse Place London SW1V 1LH United Kingdom Tel +44 20 7802 4000 Fax +44 20 7802 4111
Members of the BHP Billiton Group which is headquartered in Australia
For
per
sona
l use
onl
y
Tim Cutt President, Petroleum and Potash 2 September 2014
Primed to deliver significant growth in free cash flow
Onshore US F
or p
erso
nal u
se o
nly

Disclaimer
Slide 2
Forward-looking statements This release contains forward-looking statements, including statements regarding: trends in commodity prices and currency exchange rates; demand for commodities; plans, strategies and objectives of management; closure or divestment of certain operations or facilities (including associated costs); anticipated production or construction commencement dates; capital costs and scheduling; operating costs and shortages of materials and skilled employees; anticipated productive lives of projects, mines and facilities; provisions and contingent liabilities; tax and regulatory developments. Forward-looking statements can be identified by the use of terminology such as ‘intend’, ‘aim’, ‘project’, ‘anticipate’, ‘estimate’, ‘plan’, ‘believe’, ‘expect’, ‘may’, ‘should’, ‘will’, ‘continue’, ‘annualised’ or similar words. These statements discuss future expectations concerning the results of operations or financial condition, or provide other forward-looking statements. These forward-looking statements are not guarantees or predictions of future performance, and involve known and unknown risks, uncertainties and other factors, many of which are beyond our control, and which may cause actual results to differ materially from those expressed in the statements contained in this release. Readers are cautioned not to put undue reliance on forward-looking statements. For example, our future revenues from our operations, projects or mines described in this release will be based, in part, upon the market price of the minerals, metals or petroleum produced, which may vary significantly from current levels. These variations, if materially adverse, may affect the timing or the feasibility of the development of a particular project, the expansion of certain facilities or mines, or the continuation of existing operations. Other factors that may affect the actual construction or production commencement dates, costs or production output and anticipated lives of operations, mines or facilities include our ability to profitably produce and transport the minerals, petroleum and/or metals extracted to applicable markets; the impact of foreign currency exchange rates on the market prices of the minerals, petroleum or metals we produce; activities of government authorities in some of the countries where we are exploring or developing these projects, facilities or mines, including increases in taxes, changes in environmental and other regulations and political uncertainty; labour unrest; and other factors identified in the risk factors discussed in BHP Billiton’s filings with the U.S. Securities and Exchange Commission (the “SEC”) (including in Annual Reports on Form 20-F) which are available on the SEC’s website at www.sec.gov. Except as required by applicable regulations or by law, the Group does not undertake any obligation to publicly update or review any forward-looking statements, whether as a result of new information or future events.
Non-IFRS financial information BHP Billiton results are reported under International Financial Reporting Standards (IFRS) including Underlying EBIT and Underlying EBITDA which are used to measure segment performance. This release may also include certain non-IFRS measures including Underlying attributable profit, Underlying basic earnings per share, Underlying EBITDA interest coverage, Adjusted effective tax rate, Underlying EBIT margin, Underlying EBITDA margin, Underlying return on capital, Free cash flow, Net debt and Net operating assets. These measures are used internally by management to assess the performance of our business, make decisions on the allocation of our resources and assess operational management. Non-IFRS measures have not been subject to audit or review and should not be considered as an indication of or alternative to an IFRS measure of profitability, financial performance or liquidity.
Basis of preparation Financial information for FY13 onwards has been included on the basis of IFRS 10, IFRS 11 and IFRIC 20.
No offer of securities Nothing in this release should be construed as either an offer to sell or a solicitation of an offer to buy or sell BHP Billiton securities in any jurisdiction, or be treated or relied upon as a recommendation or advice by BHP Billiton.
Reliance on third party information The views expressed in this release contain information that has been derived from publicly available sources that have not been independently verified. No representation or warranty is made as to the accuracy, completeness or reliability of the information. This release should not be relied upon as a recommendation or forecast by BHP Billiton.
Barclays CEO Energy-Power Conference, September 2014
For
per
sona
l use
onl
y

Disclaimer
Slide 3 Barclays CEO Energy-Power Conference, September 2014
Petroleum resources The estimates of petroleum reserves and contingent resources contained in this presentation are based on, and fairly represent, information and supporting documentation prepared under the supervision of Mr. A. G. Gadgil, who is employed by BHP Billiton. Mr. Gadgil is a member of the Society of Petroleum Engineers and has the required qualifications and experience to act as a qualified petroleum reserves and resources evaluator under the ASX Listing Rules. This presentation is issued with the prior written consent of Mr. Gadgil who agrees with the form and context in which the petroleum reserves and contingent resources are presented. Aggregates of reserves and contingent resources estimates contained in this presentation have been calculated by arithmetic summation of field/project estimates by category. Reserves and contingent resources estimates contained in this presentation have been estimated using deterministic methodology. The reserves and contingent resources contained in this presentation are inclusive of fuel required for operations. The respective amounts of fuel for each category are: 2P reserves 110 MMboe, 2C contingent resources 160 MMboe. The custody transfer point(s)/point(s) of sale applicable for each field or project are the reference point for reserves and contingent resources. The barrel of oil equivalent conversion is based on 6000 scf of natural gas equals 1 boe. Reserves and contingent resources estimates contained in this presentation have not been adjusted for risk. Unless noted otherwise, reserves and contingent resources are as at 30 June 2013. Where used in this presentation, the term resources represents the sum of 2P reserves and 2C contingent resources. BHP Billiton estimates proved reserve volumes according to SEC disclosure regulations and files these in our annual 20F report with the SEC. All unproved volumes are estimated using SPE-PRMS guidelines which allow escalations to prices and costs, and as such, would be on a different basis than that prescribed by the SEC, and are therefore excluded from our SEC filings. We have provided a list of resource terms along with their definitions in this presentation. Non-proved estimates are inherently more uncertain than proved.
For
per
sona
l use
onl
y
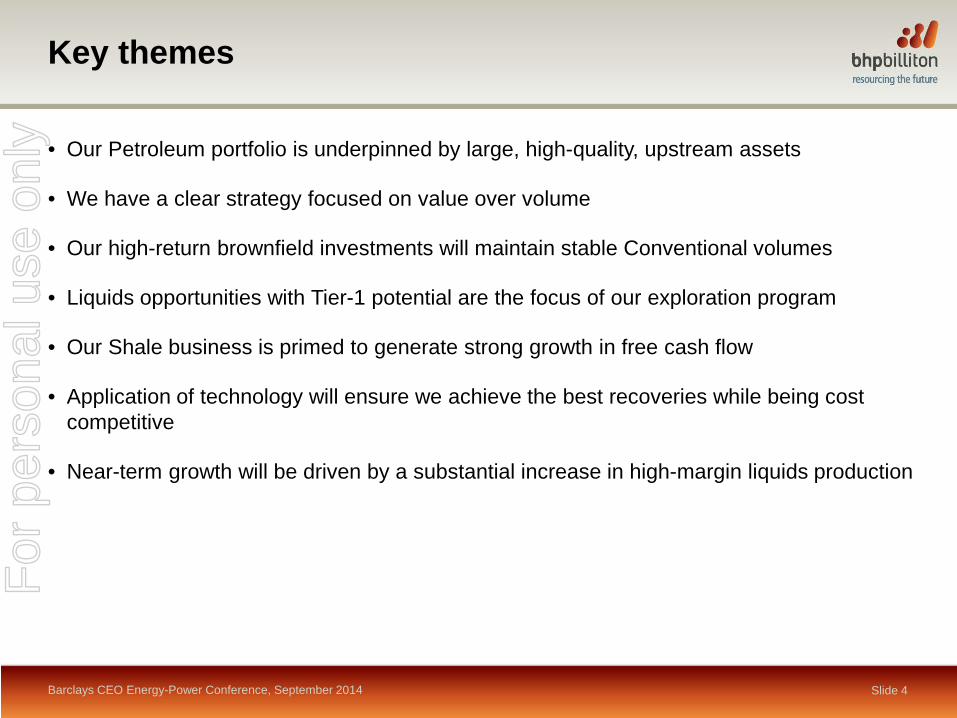
Key themes
Slide 4 Barclays CEO Energy-Power Conference, September 2014
• Our Petroleum portfolio is underpinned by large, high-quality, upstream assets
• We have a clear strategy focused on value over volume
• Our high-return brownfield investments will maintain stable Conventional volumes
• Liquids opportunities with Tier-1 potential are the focus of our exploration program
• Our Shale business is primed to generate strong growth in free cash flow
• Application of technology will ensure we achieve the best recoveries while being cost competitive
• Near-term growth will be driven by a substantial increase in high-margin liquids production
For
per
sona
l use
onl
y
Delivering on our commitments
Barclays CEO Energy-Power Conference, September 2014 Slide 5
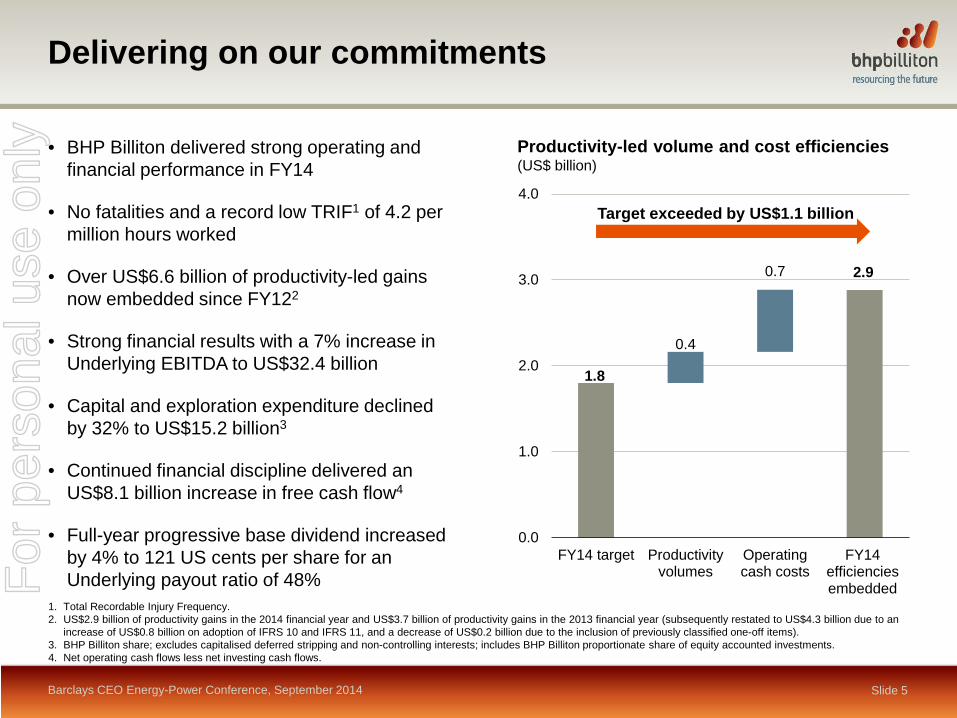
• BHP Billiton delivered strong operating and financial performance in FY14
• No fatalities and a record low TRIF1 of 4.2 per million hours worked
• Over US$6.6 billion of productivity-led gains now embedded since FY122
• Strong financial results with a 7% increase in Underlying EBITDA to US$32.4 billion
• Capital and exploration expenditure declined by 32% to US$15.2 billion3
• Continued financial discipline delivered an US$8.1 billion increase in free cash flow4
• Full-year progressive base dividend increased by 4% to 121 US cents per share for an Underlying payout ratio of 48%
1.8
2.9
0.4
0.7
0.0
1.0
2.0
3.0
4.0
FY14 target Productivityvolumes
Operatingcash costs
FY14efficienciesembedded
Productivity-led volume and cost efficiencies (US$ billion)
Target exceeded by US$1.1 billion
1. Total Recordable Injury Frequency. 2. US$2.9 billion of productivity gains in the 2014 financial year and US$3.7 billion of productivity gains in the 2013 financial year (subsequently restated to US$4.3 billion due to an
increase of US$0.8 billion on adoption of IFRS 10 and IFRS 11, and a decrease of US$0.2 billion due to the inclusion of previously classified one-off items). 3. BHP Billiton share; excludes capitalised deferred stripping and non-controlling interests; includes BHP Billiton proportionate share of equity accounted investments. 4. Net operating cash flows less net investing cash flows.
For
per
sona
l use
onl
y
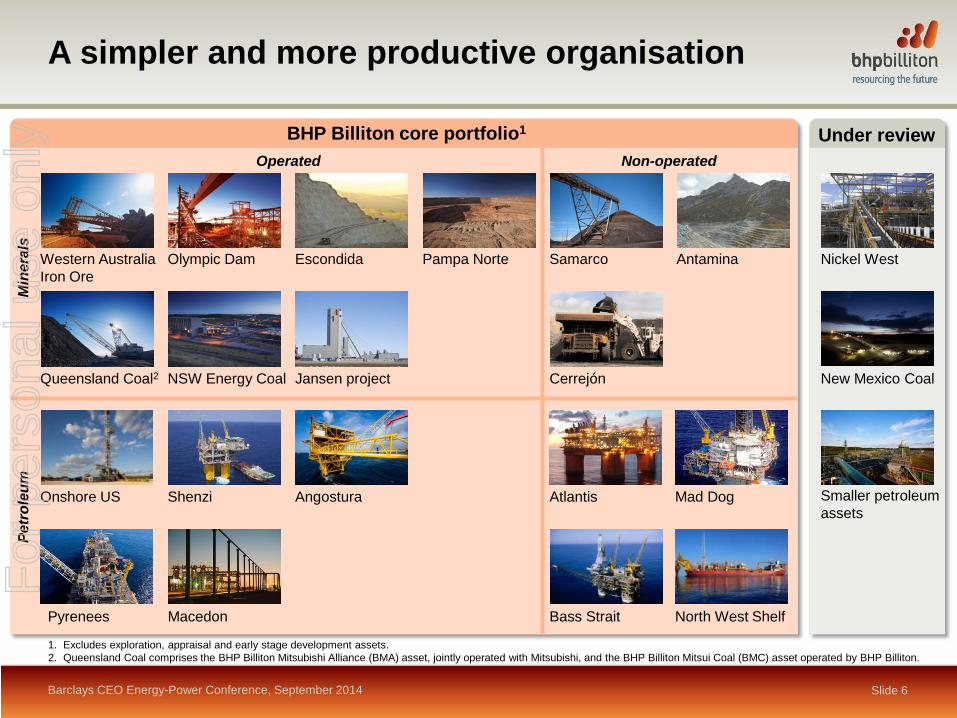
1. Excludes exploration, appraisal and early stage development assets. 2. Queensland Coal comprises the BHP Billiton Mitsubishi Alliance (BMA) asset, jointly operated with Mitsubishi, and the BHP Billiton Mitsui Coal (BMC) asset operated by BHP Billiton.
A simpler and more productive organisation
Barclays CEO Energy-Power Conference, September 2014 Slide 6
Nickel West
Smaller petroleum assets
New Mexico Coal
Under review
Min
eral
s Pe
trol
eum
Western Australia Iron Ore
Escondida Pampa Norte Olympic Dam
Queensland Coal2 NSW Energy Coal Jansen project
Operated
Onshore US Shenzi
Pyrenees Macedon
Angostura
BHP Billiton core portfolio1
Non-operated
Mad Dog Atlantis
Bass Strait North West Shelf
Samarco Antamina
Cerrejón
For
per
sona
l use
onl
y
Delivering stronger growth and margins
Slide 7
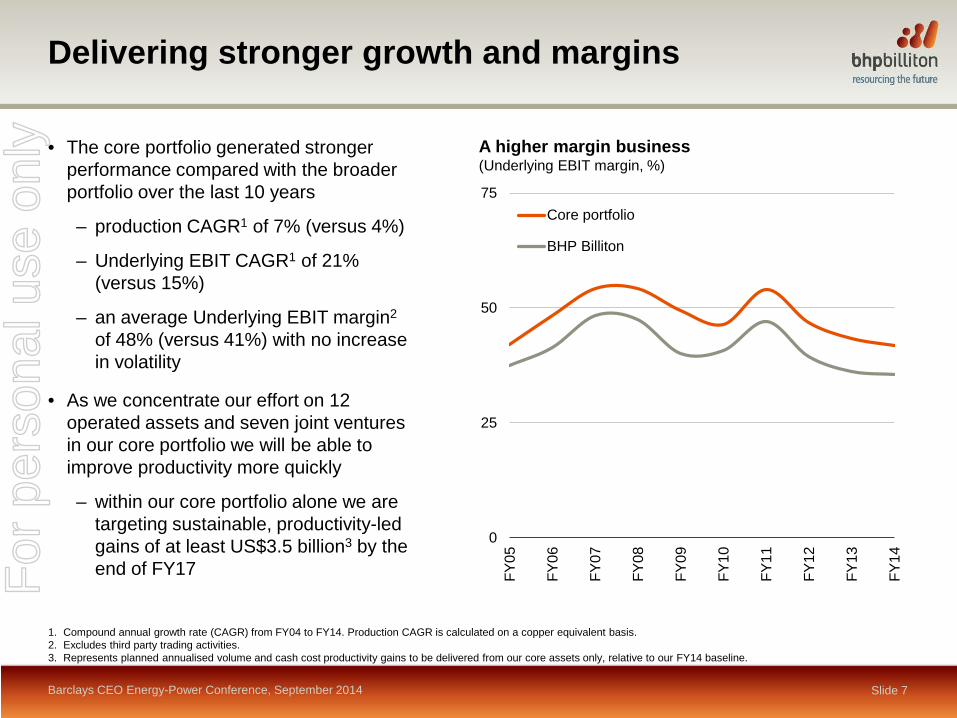
1. Compound annual growth rate (CAGR) from FY04 to FY14. Production CAGR is calculated on a copper equivalent basis. 2. Excludes third party trading activities. 3. Represents planned annualised volume and cash cost productivity gains to be delivered from our core assets only, relative to our FY14 baseline.
• The core portfolio generated stronger performance compared with the broader portfolio over the last 10 years
– production CAGR1 of 7% (versus 4%)
– Underlying EBIT CAGR1 of 21%
(versus 15%)
– an average Underlying EBIT margin2 of 48% (versus 41%) with no increase in volatility
• As we concentrate our effort on 12 operated assets and seven joint ventures in our core portfolio we will be able to improve productivity more quickly
– within our core portfolio alone we are targeting sustainable, productivity-led gains of at least US$3.5 billion3 by the end of FY17
0
25
50
75
FY05
FY06
FY07
FY08
FY09
FY10
FY11
FY12
FY13
FY14
Core portfolio
BHP Billiton
Barclays CEO Energy-Power Conference, September 2014
A higher margin business
(Underlying EBIT margin, %)
For
per
sona
l use
onl
y

Focusing on value over volume in our Petroleum business
Slide 8
• Prioritising the highest return investment opportunities in our Petroleum business
– investment in our shale liquids acreage (tight oil) generates strong returns
– we are preserving the value of our dry gas shale acreage
– deepwater infill drilling and brownfield expansions will maximise the value of our Conventional business
• We will continue to simplify the portfolio for value
– divested our interests in Liverpool Bay and South Midland acreage in the Permian in FY14
– we are actively marketing our Pakistan gas operation and will continue to review other smaller petroleum assets
Barclays CEO Energy-Power Conference, September 2014
0
5
10
15
20
25
30
0 100 200 300 400 500
BHP Billiton near-term focus
BHP Billiton long-term value
creation
BHP Billiton development options must
compete within the portfolio
Source: Wood Mackenzie.
Greenfield project IRR (IRR, %)
Oil sands Greenfield LNG
Shale gas Conventional
Tight oil Deepwater
Capital investment in greenfield projects 2006-2020 (US$ billion)
For
per
sona
l use
onl
y
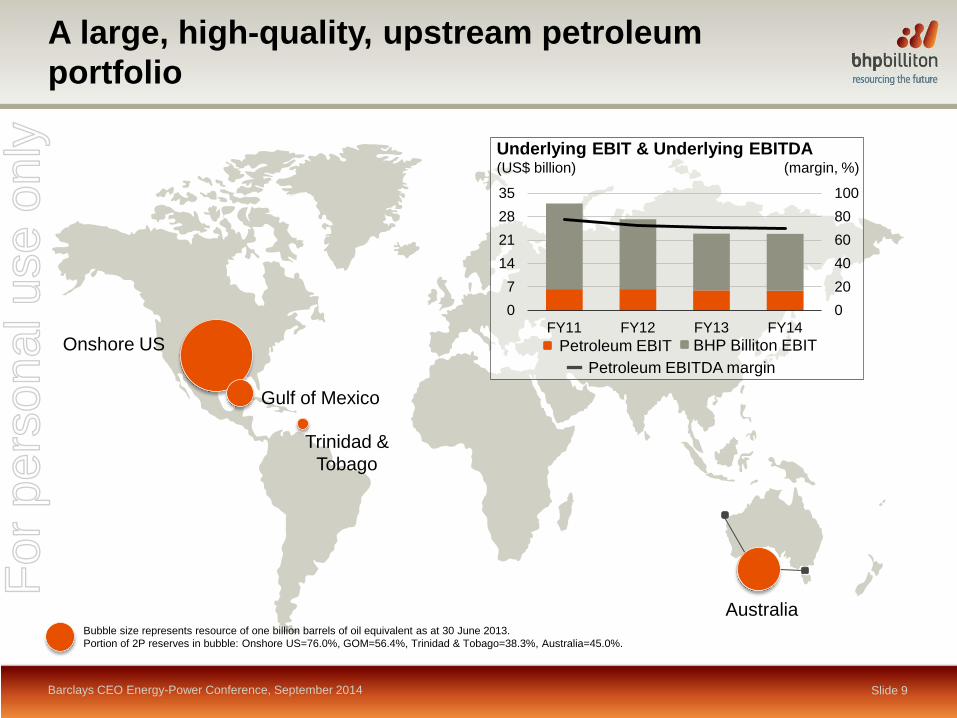
A large, high-quality, upstream petroleum portfolio
Slide 9 Barclays CEO Energy-Power Conference, September 2014
020406080100
07
14212835
FY11 FY12 FY13 FY14
Underlying EBIT & Underlying EBITDA (US$ billion) (margin, %)
Petroleum EBIT BHP Billiton EBIT
Petroleum EBITDA margin
Bubble size represents resource of one billion barrels of oil equivalent as at 30 June 2013. Portion of 2P reserves in bubble: Onshore US=76.0%, GOM=56.4%, Trinidad & Tobago=38.3%, Australia=45.0%.
Trinidad & Tobago
Onshore US
Gulf of Mexico
Australia
For
per
sona
l use
onl
y
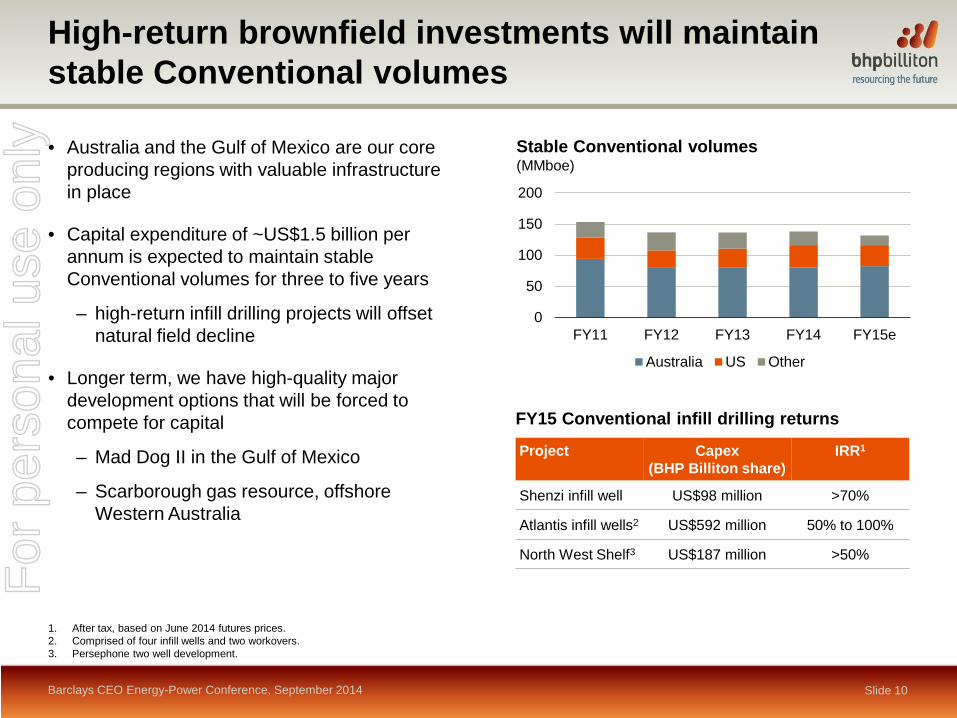
High-return brownfield investments will maintain stable Conventional volumes
Barclays CEO Energy-Power Conference, September 2014 Slide 10
• Australia and the Gulf of Mexico are our core producing regions with valuable infrastructure in place
• Capital expenditure of ~US$1.5 billion per annum is expected to maintain stable Conventional volumes for three to five years
– high-return infill drilling projects will offset natural field decline
• Longer term, we have high-quality major development options that will be forced to compete for capital
– Mad Dog II in the Gulf of Mexico
– Scarborough gas resource, offshore Western Australia
Stable Conventional volumes (MMboe)
0
50
100
150
200
FY11 FY12 FY13 FY14 FY15e
Australia US Other
FY15 Conventional infill drilling returns
1. After tax, based on June 2014 futures prices. 2. Comprised of four infill wells and two workovers. 3. Persephone two well development.
Project Capex (BHP Billiton share)
IRR1
Shenzi infill well US$98 million >70%
Atlantis infill wells2 US$592 million 50% to 100%
North West Shelf3 US$187 million >50%
For
per
sona
l use
onl
y
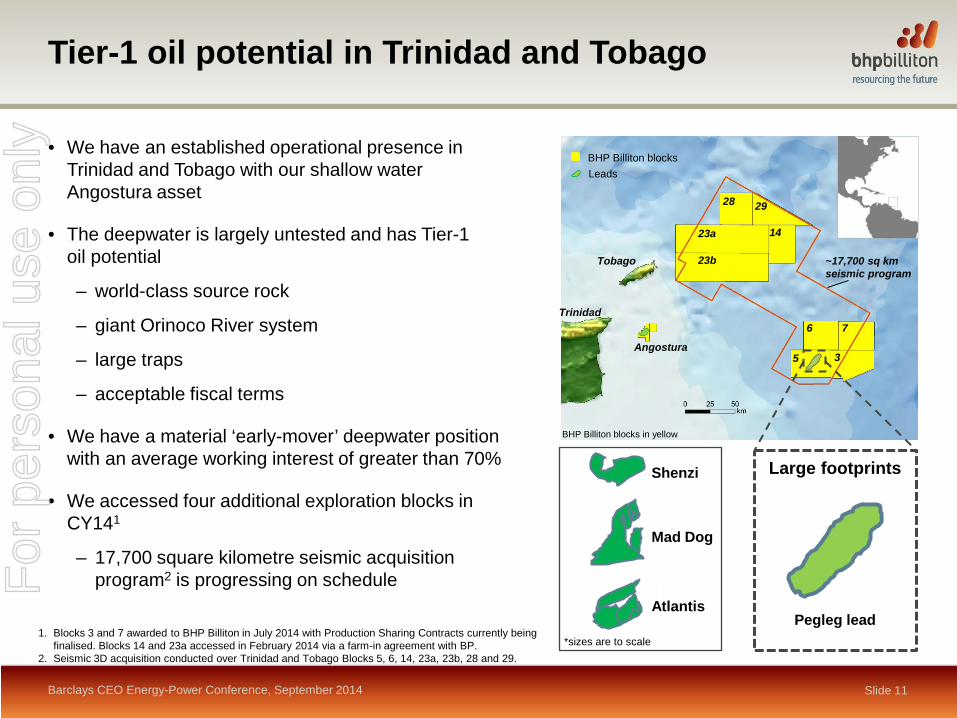
Tier-1 oil potential in Trinidad and Tobago
Barclays CEO Energy-Power Conference, September 2014 Slide 11
• We have an established operational presence in Trinidad and Tobago with our shallow water Angostura asset
• The deepwater is largely untested and has Tier-1 oil potential
– world-class source rock
– giant Orinoco River system
– large traps
– acceptable fiscal terms
• We have a material ‘early-mover’ deepwater position with an average working interest of greater than 70%
• We accessed four additional exploration blocks in CY141
– 17,700 square kilometre seismic acquisition program2 is progressing on schedule
Shenzi
Mad Dog
Atlantis
*sizes are to scale
Large footprints
Pegleg lead
Tobago
Trinidad
Angostura
6 7
3 5
23a
23b
28 29
14
~17,700 sq km seismic program
BHP Billiton blocks in yellow
BHP Billiton blocks
Leads
1. Blocks 3 and 7 awarded to BHP Billiton in July 2014 with Production Sharing Contracts currently being finalised. Blocks 14 and 23a accessed in February 2014 via a farm-in agreement with BP.
2. Seismic 3D acquisition conducted over Trinidad and Tobago Blocks 5, 6, 14, 23a, 23b, 28 and 29.
For
per
sona
l use
onl
y
Slide 12
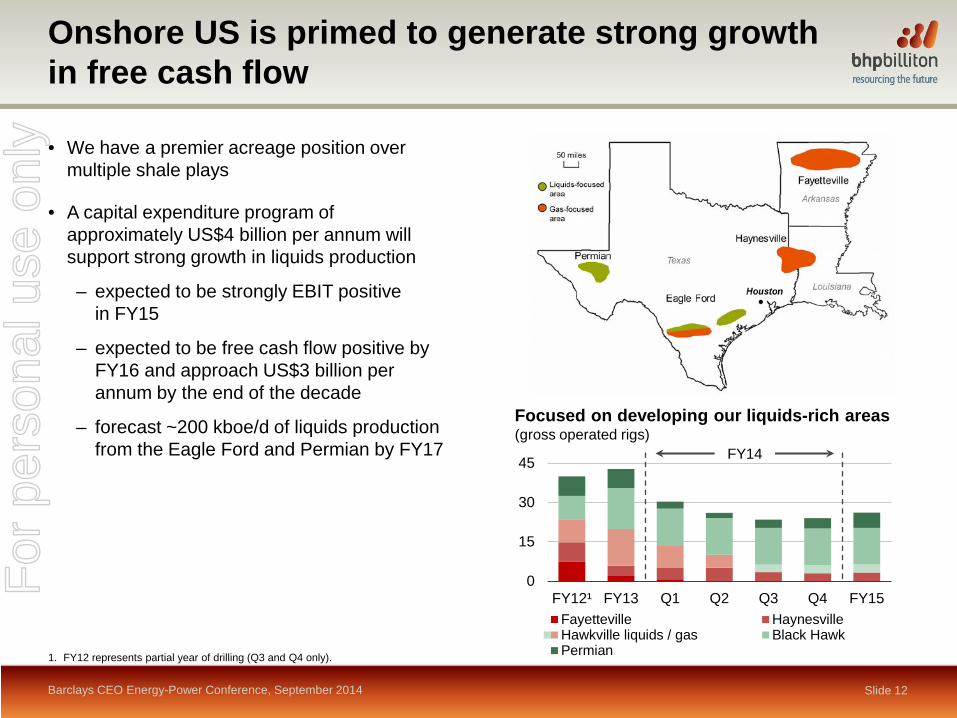
• We have a premier acreage position over multiple shale plays
• A capital expenditure program of approximately US$4 billion per annum will support strong growth in liquids production
– expected to be strongly EBIT positive in FY15
– expected to be free cash flow positive by FY16 and approach US$3 billion per annum by the end of the decade
– forecast ~200 kboe/d of liquids production from the Eagle Ford and Permian by FY17
Barclays CEO Energy-Power Conference, September 2014
Onshore US is primed to generate strong growth in free cash flow
Focused on developing our liquids-rich areas (gross operated rigs)
0
15
30
45
FY12¹ FY13 Q1 Q2 Q3 Q4 FY15Fayetteville HaynesvilleHawkville liquids / gas Black HawkPermian
FY14
1. FY12 represents partial year of drilling (Q3 and Q4 only).
For
per
sona
l use
onl
y
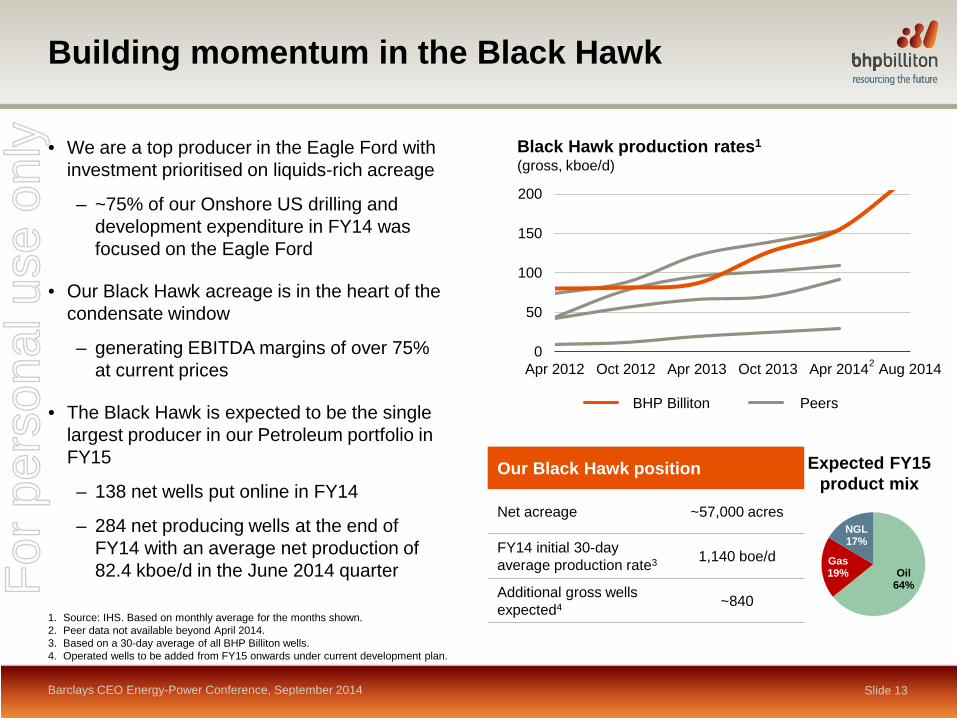
Black Hawk production rates1
(gross, kboe/d)
Slide 13 Barclays CEO Energy-Power Conference, September 2014
Building momentum in the Black Hawk
• We are a top producer in the Eagle Ford with investment prioritised on liquids-rich acreage
– ~75% of our Onshore US drilling and development expenditure in FY14 was focused on the Eagle Ford
• Our Black Hawk acreage is in the heart of the condensate window
– generating EBITDA margins of over 75% at current prices
• The Black Hawk is expected to be the single largest producer in our Petroleum portfolio in FY15
– 138 net wells put online in FY14
– 284 net producing wells at the end of FY14 with an average net production of 82.4 kboe/d in the June 2014 quarter Oil
64%
Gas 19%
NGL 17%
1. Source: IHS. Based on monthly average for the months shown. 2. Peer data not available beyond April 2014. 3. Based on a 30-day average of all BHP Billiton wells. 4. Operated wells to be added from FY15 onwards under current development plan.
Expected FY15 product mix
0
50
100
150
200
Apr 2012 Oct 2012 Apr 2013 Oct 2013 Apr 2014 Aug 2014
BHP Billiton Peers
Our Black Hawk position
Net acreage ~57,000 acres
FY14 initial 30-day average production rate3 1,140 boe/d
Additional gross wells expected4 ~840
2
For
per
sona
l use
onl
y
Slide 14 Barclays CEO Energy-Power Conference, September 2014
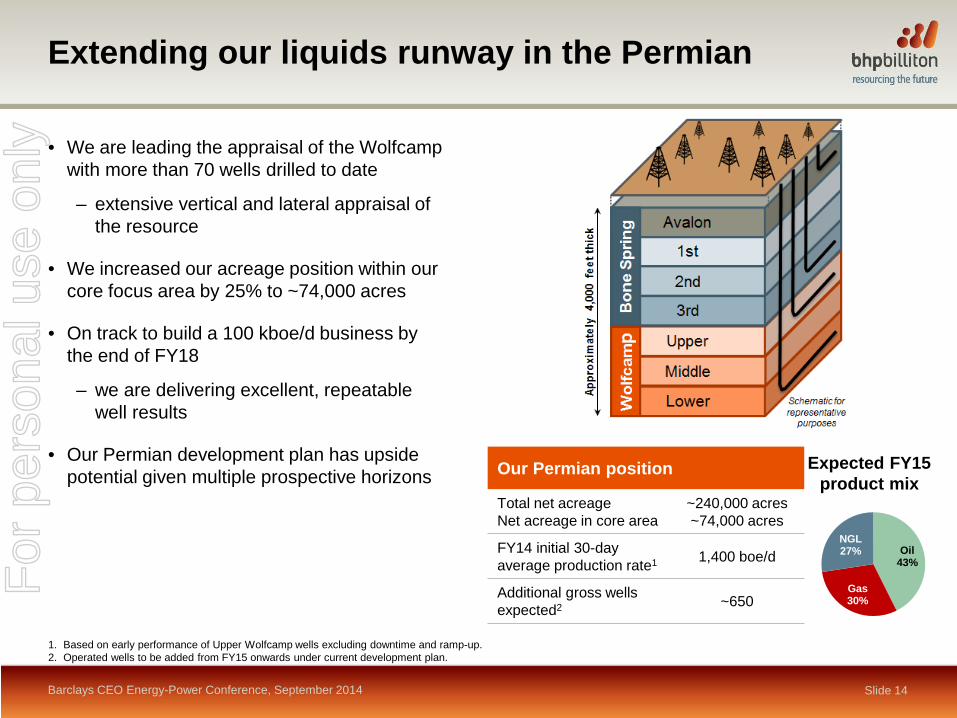
Extending our liquids runway in the Permian
• We are leading the appraisal of the Wolfcamp with more than 70 wells drilled to date
– extensive vertical and lateral appraisal of the resource
• We increased our acreage position within our core focus area by 25% to ~74,000 acres
• On track to build a 100 kboe/d business by the end of FY18
– we are delivering excellent, repeatable well results
• Our Permian development plan has upside potential given multiple prospective horizons Our Permian position
Total net acreage Net acreage in core area
~240,000 acres ~74,000 acres
FY14 initial 30-day average production rate1 1,400 boe/d
Additional gross wells expected2 ~650
Oil 43%
Gas 30%
NGL 27%
1. Based on early performance of Upper Wolfcamp wells excluding downtime and ramp-up. 2. Operated wells to be added from FY15 onwards under current development plan.
Expected FY15 product mix
For
per
sona
l use
onl
y
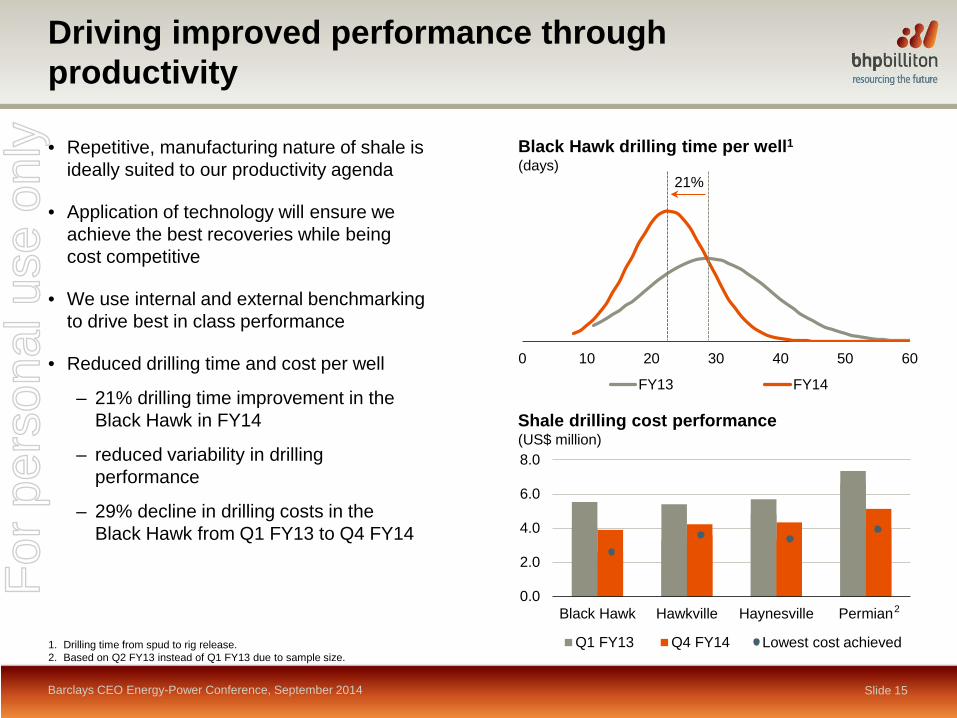
Driving improved performance through productivity
Slide 15
• Repetitive, manufacturing nature of shale is ideally suited to our productivity agenda
• Application of technology will ensure we achieve the best recoveries while being cost competitive
• We use internal and external benchmarking to drive best in class performance
• Reduced drilling time and cost per well
– 21% drilling time improvement in the Black Hawk in FY14
– reduced variability in drilling performance
– 29% decline in drilling costs in the Black Hawk from Q1 FY13 to Q4 FY14
Barclays CEO Energy-Power Conference, September 2014
1. Drilling time from spud to rig release. 2. Based on Q2 FY13 instead of Q1 FY13 due to sample size.
Shale drilling cost performance
(US$ million)
Black Hawk drilling time per well1 (days)
0 10 20 30 40 50 60
FY13 FY14
21%
-
2
4
6
8
0.0
2.0
4.0
6.0
8.0
Black Hawk Hawkville Haynesville Permian
Q1 FY13 Q4 FY14
2
Lowest cost achieved
For
per
sona
l use
onl
y
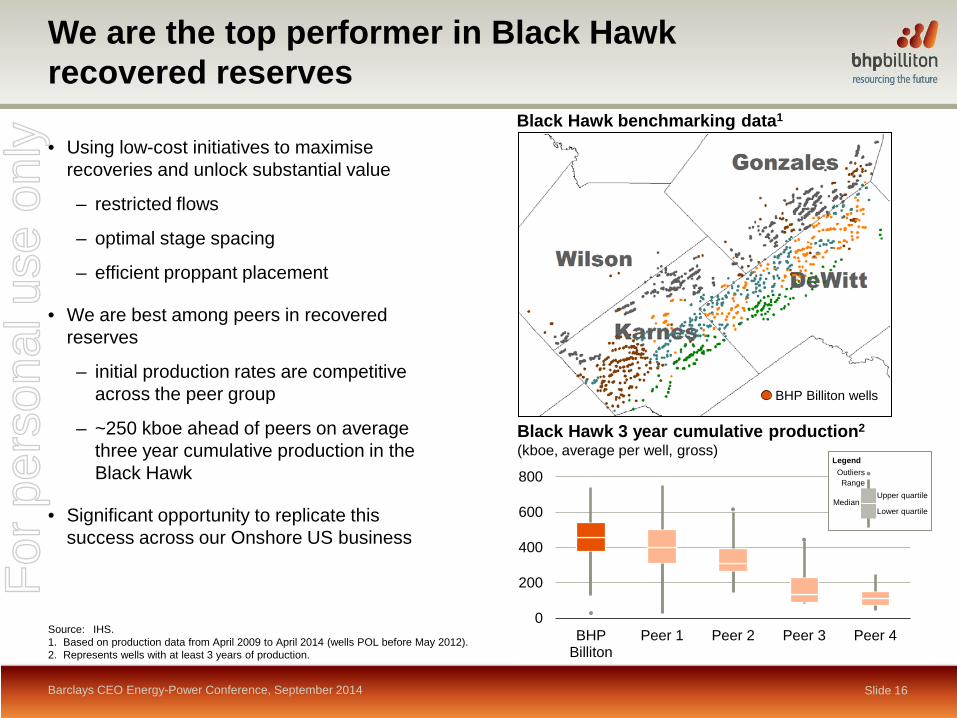
BHP Billiton wells
Slide 16
We are the top performer in Black Hawk recovered reserves
• Using low-cost initiatives to maximise recoveries and unlock substantial value
– restricted flows
– optimal stage spacing
– efficient proppant placement
• We are best among peers in recovered reserves
– initial production rates are competitive across the peer group
– ~250 kboe ahead of peers on average three year cumulative production in the Black Hawk
• Significant opportunity to replicate this success across our Onshore US business
Source: IHS. 1. Based on production data from April 2009 to April 2014 (wells POL before May 2012). 2. Represents wells with at least 3 years of production.
Barclays CEO Energy-Power Conference, September 2014
0
200
400
600
800
BHPBilliton
Peer 1 Peer 2 Peer 3 Peer 4
Black Hawk 3 year cumulative production2 (kboe, average per well, gross)
Legend Outliers Range
Upper quartile Median
Lower quartile
Black Hawk benchmarking data1
For
per
sona
l use
onl
y
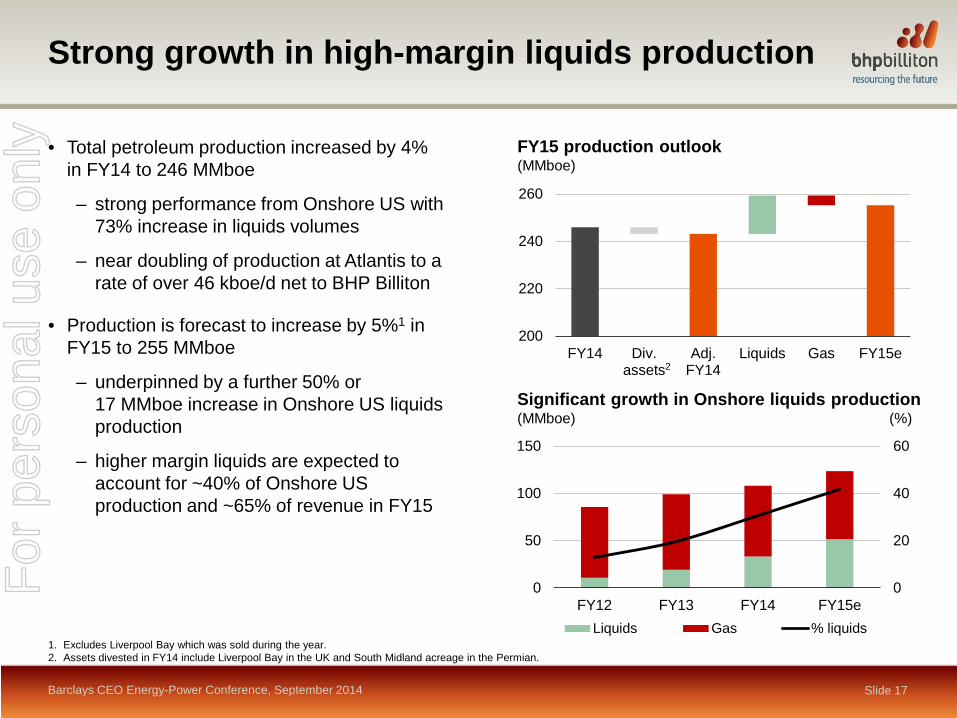
Strong growth in high-margin liquids production
Slide 17
• Total petroleum production increased by 4% in FY14 to 246 MMboe
– strong performance from Onshore US with 73% increase in liquids volumes
– near doubling of production at Atlantis to a rate of over 46 kboe/d net to BHP Billiton
• Production is forecast to increase by 5%1 in FY15 to 255 MMboe
– underpinned by a further 50% or 17 MMboe increase in Onshore US liquids production
– higher margin liquids are expected to account for ~40% of Onshore US production and ~65% of revenue in FY15
FY15 production outlook (MMboe)
200
220
240
260
FY14 Div.assets
Adj.FY14
Liquids Gas FY15e
Barclays CEO Energy-Power Conference, September 2014
Significant growth in Onshore liquids production (MMboe) (%)
0
20
40
60
0
50
100
150
FY12 FY13 FY14 FY15eLiquids Gas % liquids
1. Excludes Liverpool Bay which was sold during the year. 2. Assets divested in FY14 include Liverpool Bay in the UK and South Midland acreage in the Permian.
2
For
per
sona
l use
onl
y

Key themes
Slide 18 Barclays CEO Energy-Power Conference, September 2014
• Our Petroleum portfolio is underpinned by large, high-quality, upstream assets
• We have a clear strategy focused on value over volume
• Our high-return brownfield investments will maintain stable Conventional volumes
• Liquids opportunities with Tier-1 potential are the focus of our exploration program
• Our Shale business is primed to generate strong growth in free cash flow
• Application of technology will ensure we achieve the best recoveries while being cost competitive
• Near-term growth will be driven by a substantial increase in high-margin liquids production
For
per
sona
l use
onl
y

For
per
sona
l use
onl
y
Appendix F
or p
erso
nal u
se o
nly

Glossary of selected terms
Reserves Those quantities of petroleum anticipated to be commercially recoverable by application of development projects to known accumulations from a given date forward under defined conditions. Reserves must further satisfy four criteria: They must be discovered, recoverable, commercial, and remaining (as of a given date) based on the development project(s) applied. 1P 1P is equivalent to proved reserves and is also commonly called P1. It denotes a low estimate scenario of petroleum reserves. 2P 2P is equivalent to the sum of proved reserves plus probable reserves. It denotes the best estimate scenario of petroleum reserves. P2 P2 is equivalent to probable reserves.
Contingent Resources Those quantities of petroleum estimated, as of a given date, to be potentially recoverable from known accumulations by application of development projects but which are not currently considered to be commercially recoverable due to one or more contingencies. Contingent Resources are a class of discovered recoverable resources. 1C Denotes the low estimate scenario of contingent resources. 2C Denotes the best estimate scenario of contingent resources.
Deterministic Methodology A discrete value or array of values for each parameter is selected based on the estimator’s choice of the values that are most appropriate for the corresponding resource category. A single outcome of recoverable quantities is derived for each deterministic increment or scenario.
Probabilistic Methodology A distribution representing the full range of possible values for each input parameter is developed and a range of outcomes are statistically derived for each scenario.
Barclays CEO Energy-Power Conference, September 2014 Slide 21
For
per
sona
l use
onl
y
For
per
sona
l use
onl
y