Embed Size (px)
Citation preview
ii
WORKING PAPER
Beyond the Overall Economic Downturn: Evidence on Sector-specific Effects of Violent Conflict from Indonesia
Marc Vothknecht DIW Berlin–German Institute for Economic Research
Sudarno Sumarto The SMERU Research Institute
DECEMBER 2012
WORKING PAPER
Beyond the Overall Economic Downturn: Evidence of the Sector-specific Effects of Violent Conflict
in Indonesia
Marc Vothknecht DIW Berlin–German Institute for Economic Research
Sudarno Sumarto
The SMERU Research Institute
EDITOR:
Stephen Girschik
The SMERU Research Institute Jakarta
December 2012
Vothknecht, Marc Beyond the Overall Economic Downturn: Evidence on Sector-specific Effects of Violent Conflict from Indonesia/
Marc Vothknecht and Sudarno Sumarto. -- Jakarta: SMERU Research Institute, 2012. iii, 25 p. ; 30 cm. -- (SMERU Working Paper, December 2012) ISBN 978-602-7901-01-8 1. Violent I. SMERU 2. Conflict II. Vothknecht, Marc 3. Economic Growth III. Sumarto, Sudarno 338.9/DDC 22
The SMERU Research Institute i
ABSTRACT
Beyond the Overall Economic Downturn: Evidence of the Sector-specific Effects of Violent Conflict
in Indonesia Marc Vothknecht (DIW Berlin–German Institute for Economic Research) and
Sudarno Sumarto (The SMERU Research Institute) This paper analyzes the impact of violent conflict on economic activity using micro level data sources from Indonesia. The study compiled a panel dataset at the kabupaten level for the period 2002-2008, and attempted to disentangle the overall negative effect of violent conflict on economic growth into its sectoral components. We find substantial differences across sectors, with the most detrimental impact evident in manufacturing industries and the service sector. Furthermore, the short-run impacts on growth appear to be only temporal and some evidence of the "phoenix effect" in the ready post-conflict period is found. The construction sector, in particular, recovers quickly once the conflict ends, while manufacturing industries and the finance sector appear especially reliant on a lasting peace. The results therefore reveal the substantial effects of violent conflict on the structure of the economy and hence its longer-term growth trajectory. A series of alternative specifications confirm the main findings of the analysis. Keywords: violent conflict, economic growth, Indonesia JEL Codes: 011, F51
The SMERU Research Institute ii
TABLE OF CONTENTS ABSTRACT i TABLE OF CONTENTS ii LIST OF TABLES iii I. INTRODUCTION 1 II. EXISTING EVIDENCE ON SECTOR-SPECIFIC CONFLICT IMPACTS 3 III. CONFLICT AND DATA DESCRIPTION 4
3.1 Background to the Violence 4 3.2 Growth Data 6 3.3 Podes Data 6
IV. ECONOMETRIC APPROACH 9 4.1 Regression Setup 9 4.2 Endogeneity of Conflict Variables 9
V. EMPIRICAL RESULTS 10 5.1 Descriptive Statistics 10 5.2 Regression Results 13
VI. CONCLUSION 20 LIST OF REFERENCES 22 APPENDIX 25

The SMERU Research Institute iii
LIST OF TABLES Table 1. Summary Statistics 7 Table 2. Violent Conflict–Descriptive Statistics 12 Table 3. Base FE Regression Result 14 Table 4. Regressions Results for Subsectors 15 Table 5. Regression Results–Resolved vs. Ongoing Conflicts 16 Table 6. Robustness Tests 18
The SMERU Research Institute 1
I. INTRODUCTION Incidences of mass violence constitute a major obstacle to economic and social prosperity in many developing countries. While the pivotal need to stabilize fragile regions is explicitly stressed by the World Development Report 2011 (World Bank, 2011), our understanding of the complex processes that lead to and result from violent conflict is, in many respects, still incomplete. In this paper, we address one of the gaps in the report by examining the sector-specific economic effects of conflict and the consequential changes in the structure of the economy. Existing evidence on the economic impact of violent conflict mostly comes from cross-country studies that investigate the aggregate effects of armed conflict. Collier's (1999) analysis establishes a substantially negative link between the duration of a civil war and economic growth. His approach, however, is criticized for not considering variations in the scale and scope of conflict. Imai and Weinstein (2000) stress the importance of the geographical spread of conflicts, and conclude that wide-spread civil wars affect economic growth five times more than conflicts fought in small parts of a country. Bodea and Elbadawi (2008) distinguish different levels of political violence and find particularly negative growth impacts for civil wars, relative to the less severe effects resulting from riots or coups. Consistent with this, Koubi (2005) finds the impact of civil war on long-run economic growth to be proportional to conflict severity in terms of conflict-related human losses. As cross-country studies generally do, these findings suffer from the implicit assumption of a universal growth process and homogeneous growth parameters. With most samples consisting of very heterogeneous countries at different stages of development and with diverse economic structures, cross-country parameter estimates, at best, display inter-country averages (Bos et al., 2010). Country-level case studies are therefore more appropriate for analyzing specific growth experiences, as common institutional and legal frameworks and the consistency of data sources contribute to a higher comparability of growth processes. Such single country evidence on the growth impact of mass violence is relatively scarce. Abadie and Gardeazabal (2003) show a negative impact of the ETA terrorist conflict on economic growth in the Basque Country. Dependent on the intensity of terrorism, Basque per capita GDP declined, on average, by 10 percentage points relative to other Spanish regions. Lopez and Wodon (2005) use time series data to estimate the impact of the 1994 genocide on the evolution of Rwanda's per capita GDP. Based on outlier detection and correction, their results indicate a significant loss in GDP in the short term, though no impact is found on post-genocide growth rates. Last, but not least, Arunatilake, Jayasuriya, and Kelegama (2001) assess the direct and indirect costs of the Sri Lankan civil war between 1983 and 1996, with their estimates of total costs adding up to twice the country's 1996 GDP.1
1For Indonesia, Garcia and Soelistianingsih (1998) analyzed the evolution of provincial incomes under the New Order regime and found that poorer provinces catch up, especially through investments in human capital. Using district-level data for the period 1993–2005, McCulloch and Sjahrir (2008) confirmed the hypothesis of relative convergence and the positive growth impact of a better educated labor force. None of these studies accounts for the effects of violent conflict on the local economy. Existing literature on Indonesian conflicts mostly deals with the socioeconomic determinants of violent conflict and not with its consequences (Tadjoedin and Murshed, 2007). Anecdotal evidence reveals that the economic potential of conflict prone areas is not fully realized due to conflicts. Most production in these areas is disrupted and those who are trying to export products face barriers such as illegal taxes or fees imposed by civil servants and military personnel (Mawardi, 2006).
The SMERU Research Institute 2
Al these studies point to severely negative output effects in economies plagued by violent conflict. It is thereby assumed that the growth impact of conflict is most detrimental in the period immediately after the outbreak of violence. Cerra and Saxena (2008) show that the initial economic decline in countries affected by civil war is substantial, but find that at least partial recovery of output levels occurs after a relatively short period of time. When war ends, the post-conflict restoration of economic activities is—with reference to the Phoenix factor theory (Organiski and Kugler, 1977)—even expected to spark economic growth. For instance, this is backed up by Chen, Loayza, and Reynal-Querols (2008) event study analysis of countries emerging from internal conflict, which reports above average growth rates of total GDP in the early post conflict years. Still, and contrary to the convergence predictions of neoclassic growth models, Cerra and Saxena (2008) do not observe a complete catch-up to pre-war levels in the post–conflict period. Hence, the over evolution of economic output at the different stages of violent conflict is comparably well-documented. Empirical evidence on the underlying transmission mechanisms from conflict to growth, however, is very scarce. In particular, little is known about how the occurrence of conflict alters the structure of an economy. Conflict-related distortions of private investment, pubic spending, labor availability, market access and exchange, or internal and external demands are all likely to affect different economic activities in a heterogeneous way. A sector's particular vulnerability to mass violence would then not only affect its short–run production and employment prospects, but may as well distort the structure and hence the longer-term growth trajectory of the whole economy. Despite the need to understand the sectoral effects of conflict for the promotion of post–conflict recovery processes, the few existing empirical studies in this field are mostly confined to the effects of violence on single industries. To the best of our knowledge, this paper is the first that goes beyond the overall negative impact of war and provides a holistic assessment of how armed conflict affects different economic sectors. To do so, we combine exceptionally detailed data on kabupaten-level GDP composition from Indonesia with information on conflict occurrence at the village level in the years 2002, 2005, and 2008. The resulting panel analysis provides in-depth insights into sector-specific vulnerabilities during violent conflict and in the early recovery phase. Our results show that activities depending on capital and transactions are particularly affected during violent conflict. The persistence of these conflict-related shortfalls in economic growth then varies significantly in the post-conflict period. While some areas of the economy recover quickly once fighting stops, other industries are shown to be more permanently affected. Further, the results confirm that the scale of the economic downturn depends on the intensity and type of violence, rather than the mere existence of mostly non-violent or low intensity conflicts. Spillover effects from violence in neighboring regions are less clear and appear to only affect transaction-intensive sectors, most notably transport industries and financial services. The paper is structured as follows. The next section discusses the transmission channels from violence to growth and derives some hypotheses on the sector-specific impacts of violent conflict. We then provide background information to the conflicts under consideration, present the data along with our estimation and identification strategy. This is followed by descriptive statistics and the presentation of the results from the regression analysis. The final section concludes with potential policy implications of our findings.
The SMERU Research Institute 3
II. EXISTING EVIDENCE ON SECTOR-SPECIFIC CONFLICT IMPACTS
Violent conflicts affect economic outcomes mainly through the destruction of human and physical capital, shifts in pubic spending and private investment, as well as the disruption of economic activities and social life (see Blattman and Miguel (2010) for a summary). Having these substantial and diverse effects of violent conflict in mind, we expect varying degrees of vulnerability across different economic sectors. Economic activities that are strategically important to the belligerent parties might also become direct targets, such as relevant production facilities or the transportation and logistics sectors. Empirical evidence on these sector-specific effects of violent conflict is generally rare and comes mostly from single-sector case studies, as disaggregated growth measures from war-torn economies are often not available. Collier (1999) argues that those activities, which supply or are intensive in either capital or transactions, are particularly vulnerable. Sectors less dependent on capital and transactions should be relatively less affected, which applies to and is confirmed by the observed rise in subsistence agricultural activities in times of conflict. The overall impact of conflict on primary sector growth, however, seems ambiguous. Destroyed assets, landmine contamination, as well as a shortage of labor and capital are likely to impede agricultural development. The production of (cash) crops and livestock requires future investments and is expected to decline due to shortened planning horizons for farmers. Dramatic losses of livestock are documented in several civil wars.2 Teodosijević (2003) compares growth rates of agricultural production in 38 conflict-affected countries and finds substantially lower outcomes during violent conflict in comparison with the pre-war period. Generally, concerns of endogenous economic outcomes with respect to violent conflict particularly apply to the primary sector. Being central to many societies in the developing world, environmental scarcities and food insecurities are among the main triggers of violent conflicts. Prospects for agricultural development might therefore be structurally lower in conflict-prone regions. Similarly, the link between natural resource wealth and violent conflict is likely to run both ways. Scholars find that the production of oil and "loot-able resources", such as gemstones and drugs, to be associated with conflict incidence, specifically separatist conflicts (see Ross (2004) for a summary) Violent conflicts, in turn, tend to increase economic dependency on natural resources: while other sectors of the economy collapse, natural resources are immobile and represent an often important source of revenue for governments and/or rebels. Official growth rates of the mineral sector then depend on the legal status of the profiteer and the perceived legitimacy of extraction. Turning to the industrial sector and applying Collier's (1999) concept of war vulnerability, we expect manufacturing and construction industries to be particularly affected. Manufacturing is often intensive in both physical and human capital, requires complex coordination with contractors and vendors, and is therefore especially reliant on the institutional environment. In their analysis of conflict-ridden developing countries, Depetris Chauvin and Rohner (2009) point to the negative effects of war for exporting industries due to conflict-related trade barriers. The collapse of domestic demand for investment goods, both from state and private
2Brück (1997) estimates a loss of 80% of the cattle stock in the Mozambican civil war. Similar devastation is found for Uganda (Annan, Blattmar, and Horton, 2006) and Rwanda (FAO, 1997).
The SMERU Research Institute 4
agents, would also, in particular, affect the construction sector. Post-conflict reconstruction efforts, however, might spark a construction boom once violence and insecurity have declined (Collier, 2009). The service sector, finally, encompasses a broad range of economic activities, ranging from traditional services—house cleaning, food services, barber shops, and the like—to trade, transport, tourism, the social sector, as well as finance and business services. Finance is expected to suffer from capital light and falling demand for transactions, with the latter also applying to trade and transport industries. Likewise, tourism is particularly sensitive to violent events: Neumayer's (2004) cross-country analysis reveals strong negative impacts of political violence on tourist arrivals, with even stronger impacts in the long term compared to contemporaneous effects. Increasing military expenditures during violent conflict involve shifts in government spending often to the detriment of social services (Gupta et al., 2004). Traditional services tend to be location-specific and are less dependent on physical capital and long-term investments. Assumed to be relatively invulnerable to war, such local services might nevertheless suffer from the overall economic decline. Generally, the lack of employment opportunities in times of conflict often leads to an increase in informal businesses. These activities, such as petty trade, peddling work, or the selling of food are generally difficult to capture in official statistics. III. CONFLICT AND DATA DESCRIPTION 3.1 Background to the Violence Before turning to the data used for our analysis, we provide a short introduction to the situation in Indonesia after the 1998 collapse of President Suharto's long and authoritarian New Order regime and briefly characterize the most severe conflicts of that era. The fall of Suharto, in the wake of the Asian financial crisis, was followed by a wave of high-profile violence, with separatist conflicts in Aceh and East Timor, religious conflicts in Maluku and Sulawesi, and ethnic conflicts in Kalimantan and Nusa Tenggara Timur. Most international attention was paid to the conflict between the Free Aceh Movement (Gerakan Aceh Merdeka, GAM) rebels in Aceh and the Indonesian government (see Reid (2006) for an in-depth analysis of the conflict). This separatist conflict began with GAM's declaration of an independent Aceh in 1976 and lasted for almost 30 years, with an estimated 12,000 killed during the conflict. As a province rich in oil and gas, with a long history of independence and a region-specific Muslim character, Acehnese aspirations for political autonomy were based on economic as well as historical and religious motivation. While the New Order regime responded to the secessionist movement with increasingly repressive measures, the fall of Suharto in 1998 increased hope for an end to the conflict. Subsequently peace talks between the democratically elected Indonesian Government and GAM were initiated. Concurrently, fighting between GAM rebels and the Indonesian military continued, and even intensified between 1999 and 2002. Growing battle fatigue among GAM members combined with the new central government's political will to end the conflict contributed to a tentative resumption of the peace process in late 2004. This was the prevailing context when Aceh was
The SMERU Research Institute 5
hit by a large and devastating tsunami in late December 2004. The tsunami struck much of the western and northern coast of the province. Both sides agreed to cease hostilities in order to facilitate the recovery process and, in the case of the GAM, to benefit from international support and attention (Beardsley and McQuinn, 2009). The subsequent peace talks resulted in the August 2005 Helsinki peace agreement. Since then, Aceh has experienced a period of relative peace. The separatist movement in Aceh has not been the only post-Suharto conflict that Indonesia has experienced. Suppressed by the New Order's military might, long-simmering tensions finally broke out into overt conflict and destructive violence during the country's decentralization process and transition to democracy. While conflicts occurred throughout the archipelago, some regions were particularly affected by violence. In the provinces of Maluku and North Maluku, tensions between religious and migrant groups caused over 7,000 deaths between 1999 and 2002 (see Brown, Wilson, and Hadi 2005) for a conflict overview). Populated by Muslims and Christians in approximately equal proportion, historical inequalities stemmed from preferential treatment of Christians during Dutch colonialism. The political, social, and economic dominance of Christians, however, began to erode under the Islamist policies during the last decade of the New Order regime. The continued influx of mostly Muslim migrants further challenged the fragile ethno-religious balance and resulting tensions over communal land and resources were aggravated by the 1997 economic crisis. These tensions escalated into wide-spread inter-communal violence in early 1999 and quickly spread across the two provinces. It was only in February 2002 that the Malino II peace agreements were signed. While this peace is fragile and occasional violence erupts, conflict has been considerably less intense (Varshney et al., 2009). Comparable patterns of violence evolved in Sulawesi, located to the west of the Maluku islands; particularly in the province of Central Sulawesi. For similar reasons,3 tensions between Christians and Muslims increased during the 1990s, giving way to severe sectarian violence in the post-Suharto period, with an estimated 1,000 killed and 100,000 displaced (see Human Rights Watch (2002) for a conflict overview). The central government's efforts to mitigate the conflict eventually led to the Malino peace declaration in December 2001. The numbers of communal clashes have since declined substantially and peace remains fragile; however, incidents of violence still sporadically occur. Conflicts reported outside these areas are spread across the entire archipelago, with more pronounced levels of violence in the Nusa Tenggara islands, parts of Java and Central Sumatra, as well as Papua. Underlying causes of these low intensity conflicts appear to be manifold and related to local circumstances (Barron, Kaiser, and Pradhan, 2009). Østby et al. (2011) establishes a link between low-intensity, communal forms violence, and the simultaneous presence of horizontal inequalities and large-scale migration. More generally, a lack of effective institutions and mechanisms of dispute resolution, local power struggles in the process of decentralization, and conflicts related to land ownership and usage seem to be the most prominent drivers of communal violence in the early post-Suharto era.
3Similarities in the underlying causes of the violence in the Moluccas and in Central Sulawesi include historical socioeconomic imbalances, shifts in local power from Christians to Muslims as a result of Suharto's "Islamic Turn" in the 1990s, spontaneous and government-led in-migration of Muslims mainly from South Sulawesi and Java, as well as economic tensions in the wake of the 1997 economic crisis.
The SMERU Research Institute 6
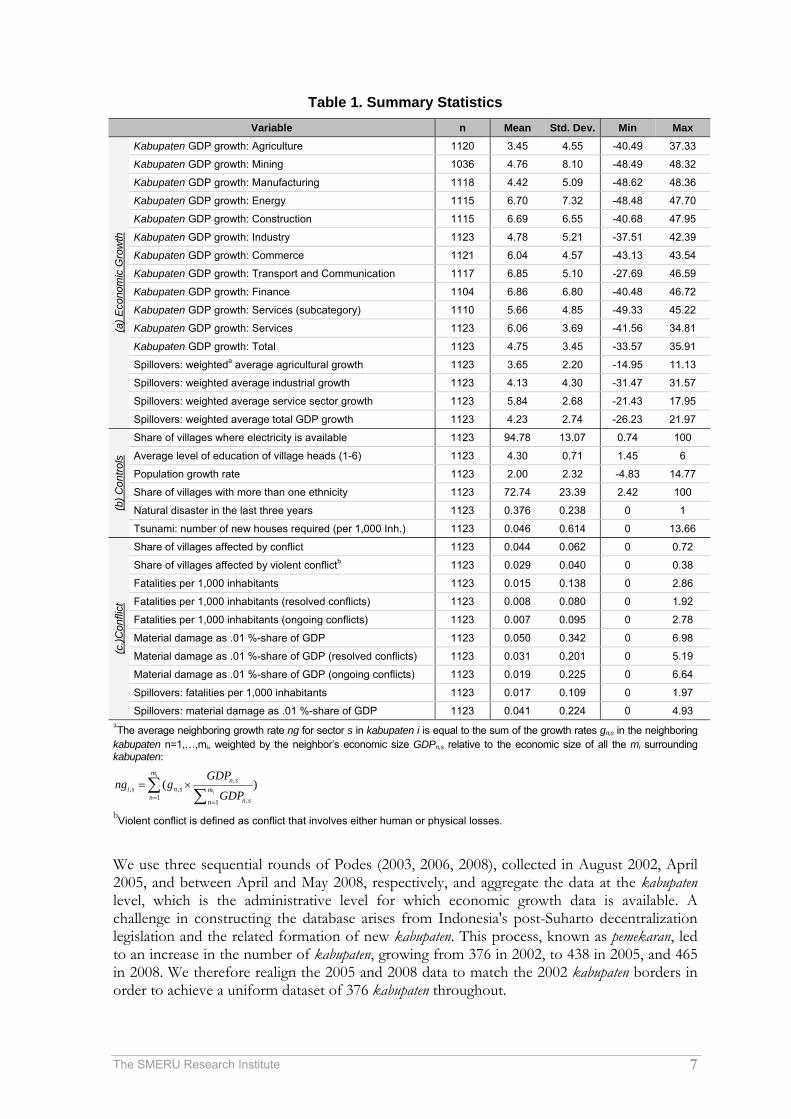
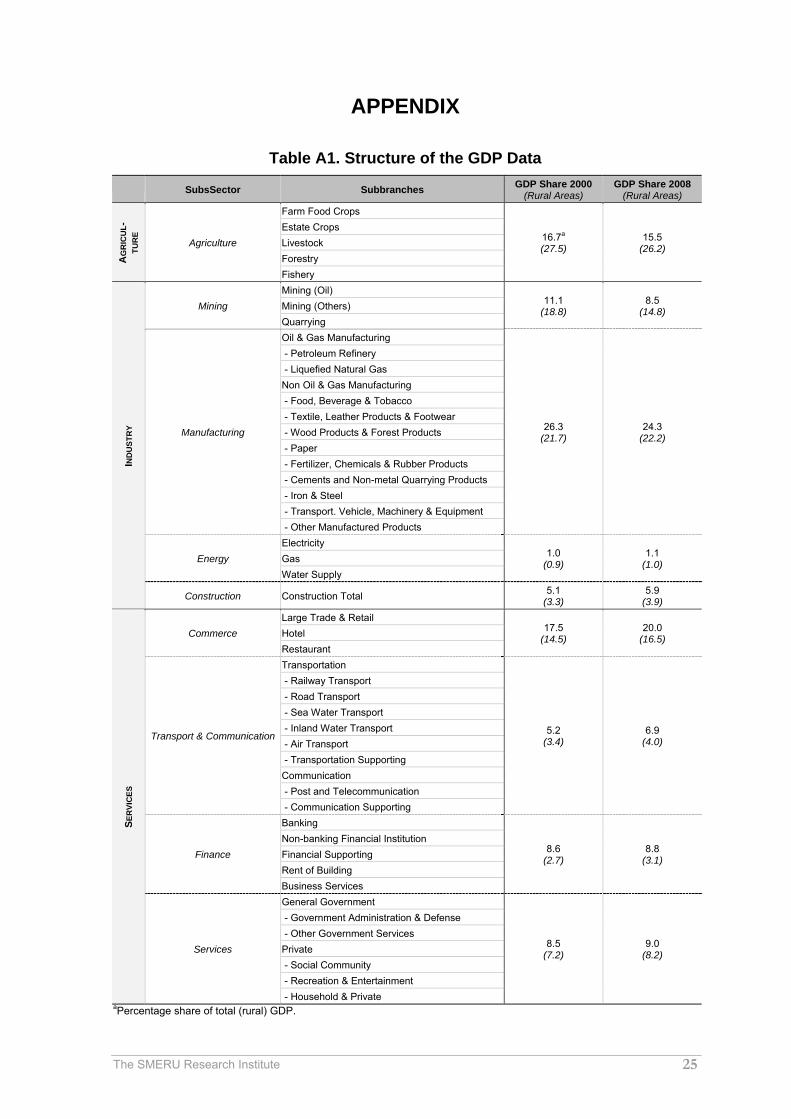
3.2 Growth Data For the empiric analysis looking at the economic consequences of these conflicts, we draw on two distinct data sources. Data on economic growth is provided by the Statistics Indonesia (Badan Pusat Statistik or BPS). The Gross Regional Domestic Product (GDRP) data are disaggregated at kabupaten (district4) and sectoral levels. Table 1 provides an overview of the different sectors, subsectors, and subcategories. This paper distinguishes between the primary, secondary, and tertiary sector, as well as additionally disaggregating into the following nine sub sectors: agriculture, mining, manufacturing, energy, construction, commerce, transport and communication, finance, and other services. For each category, we calculated the annual rate of GDP growth based on the reported value added. In order to control economic spillover effects, we also calculated the average weighted growth rate in neighboring5 kabupaten in the current and preceding year. Apart from five missing observations,6 a balanced panel is available. It is important to note that the GDP figures are compiled separately by the BPS offices at national, regional, and kabupaten levels, which is likely to result in varying qualities of the data provided. The BPS system also does not guarantee that kabupaten and provincial figures add up to provincial and national aggregates, respectively. Indeed, the sum of kabupaten GRDP deviates, on average, by around 3% from the published provincial GRDP, with the sum of district GRDP equaling 99% of the summed provincial GRDP figures. As these deviations appear random across regions affected and not affected by conflict, these weaknesses in the data are unlikely to bias the analysis. Still, in order to reduce noise in the data, we correct a few observations where the reported production values deviate extremely from the overall trend. As these extreme growth rates are distributed randomly across kabupaten and sectors,7 correction of extreme subsectoral growth rates should not involve systematic distortions of the data. We adjust "outliers" (growth rates larger than 50%) in the following way: a) in cases where the current GDP value deviates extremely from the general trend, the average annual growth rate from the previous two years is used; b) subsectors with growth rates greater than 50% are excluded from the calculation of sectoral (agriculture, industry, services) and overall growth rates. This procedure results in the adjustment of 99 subsectoral growth rates in total, which corresponds to less than 1% of the whole sample. Table 1(a) provides descriptive statistics for the variables of economic growth. For the purpose of robustness, we also ran the analysis with the original data. 3.3 Podes Data Control and conflict variables are derived from the Village Potential Statistics Survey (Potensi Desa or Podes, a village-level census that is conducted three times per decade. Also administered by BPS, Podes collects socioeconomic information from al 69,000 Indonesian rural villages and urban neighborhoods. The survey is based on responses of the village heads and includes a wide range of indicators, ranging from population characteristics to infrastructure, economic activities, and social life.
4As of 2008, Indonesia is divided into 33 provinces, which are further divided into a total of 456 kabupaten. 5Kabupaten are considered "neighboring" when sharing a common land border. 6Control variables are not available from Kabupaten Nias (North Sumatra). GDP growth rates cannot be calculated for the newly founded Kota Bengkulu (Bengkulu) and Kota Bau-Bau (South East Sulawesi) for 2002, as GDP data for 2001 is not available. 7For example, a kabupaten with very high reported growth in the transport sector shows moderate growth rates in all other sectors.
The SMERU Research Institute 7
Table 1. Summary Statistics Variable n Mean Std. Dev. Min Max
(a) E
cono
mic
Gro
wth
Kabupaten GDP growth: Agriculture 1120 3.45 4.55 -40.49 37.33
Kabupaten GDP growth: Mining 1036 4.76 8.10 -48.49 48.32
Kabupaten GDP growth: Manufacturing 1118 4.42 5.09 -48.62 48.36
Kabupaten GDP growth: Energy 1115 6.70 7.32 -48.48 47.70
Kabupaten GDP growth: Construction 1115 6.69 6.55 -40.68 47.95
Kabupaten GDP growth: Industry 1123 4.78 5.21 -37.51 42.39
Kabupaten GDP growth: Commerce 1121 6.04 4.57 -43.13 43.54
Kabupaten GDP growth: Transport and Communication 1117 6.85 5.10 -27.69 46.59
Kabupaten GDP growth: Finance 1104 6.86 6.80 -40.48 46.72
Kabupaten GDP growth: Services (subcategory) 1110 5.66 4.85 -49.33 45.22
Kabupaten GDP growth: Services 1123 6.06 3.69 -41.56 34.81
Kabupaten GDP growth: Total 1123 4.75 3.45 -33.57 35.91
Spillovers: weighteda average agricultural growth 1123 3.65 2.20 -14.95 11.13
Spillovers: weighted average industrial growth 1123 4.13 4.30 -31.47 31.57
Spillovers: weighted average service sector growth 1123 5.84 2.68 -21.43 17.95
Spillovers: weighted average total GDP growth 1123 4.23 2.74 -26.23 21.97
(b) C
ontro
ls
Share of villages where electricity is available 1123 94.78 13.07 0.74 100
Average level of education of village heads (1-6) 1123 4.30 0.71 1.45 6
Population growth rate 1123 2.00 2.32 -4.83 14.77
Share of villages with more than one ethnicity 1123 72.74 23.39 2.42 100
Natural disaster in the last three years 1123 0.376 0.238 0 1
Tsunami: number of new houses required (per 1,000 Inh.) 1123 0.046 0.614 0 13.66
(c.)C
onfli
ct
Share of villages affected by conflict 1123 0.044 0.062 0 0.72
Share of villages affected by violent conflictb 1123 0.029 0.040 0 0.38
Fatalities per 1,000 inhabitants 1123 0.015 0.138 0 2.86
Fatalities per 1,000 inhabitants (resolved conflicts) 1123 0.008 0.080 0 1.92
Fatalities per 1,000 inhabitants (ongoing conflicts) 1123 0.007 0.095 0 2.78
Material damage as .01 %-share of GDP 1123 0.050 0.342 0 6.98
Material damage as .01 %-share of GDP (resolved conflicts) 1123 0.031 0.201 0 5.19
Material damage as .01 %-share of GDP (ongoing conflicts) 1123 0.019 0.225 0 6.64
Spillovers: fatalities per 1,000 inhabitants 1123 0.017 0.109 0 1.97
Spillovers: material damage as .01 %-share of GDP 1123 0.041 0.224 0 4.93 aThe average neighboring growth rate ng for sector s in kabupaten i is equal to the sum of the growth rates gn,s in the neighboring kabupaten n=1,…,mi, weighted by the neighbor’s economic size GDPn,s relative to the economic size of all the mi surrounding kabupaten:
,, ,
1 ,1
( )i
i
mn s
i s n s mn n sn
GDPng g
GDP==
= ×∑∑
bViolent conflict is defined as conflict that involves either human or physical losses. We use three sequential rounds of Podes (2003, 2006, 2008), collected in August 2002, April 2005, and between April and May 2008, respectively, and aggregate the data at the kabupaten level, which is the administrative level for which economic growth data is available. A challenge in constructing the database arises from Indonesia's post-Suharto decentralization legislation and the related formation of new kabupaten. This process, known as pemekaran, led to an increase in the number of kabupaten, growing from 376 in 2002, to 438 in 2005, and 465 in 2008. We therefore realign the 2005 and 2008 data to match the 2002 kabupaten borders in order to achieve a uniform dataset of 376 kabupaten throughout.
The SMERU Research Institute 8
While some of the standard controls in cross-country growth regressions are not available at the kabupaten level,8 the detailed village-level information provided by the Podes data allows us to obtain a valid set of proxy variables. We used the proportion of villages with electricity and the average educational attainment of village heads in a kabupaten to proxy for infrastructure development and institutional quality, respectively. Further explanatory variables are the rate of population growth, ethnic diversity, and natural disaster events. To control for the devastating impact of the 2004 Indian Ocean tsunami that hit the northern part of Sumatra, we also included an indicator of tsunami-related physical destruction (UNORC, 2005). Basic descriptive statistics for the control variables are presented in Table 1(b). In 2003 Podes, a section on conflict has been included for the first time. The village heads report, inter alia, on incidences of conflict during the previous year, the number of conflict fatalities, the amount of conflict-related material damage, and whether the conflict has been resolved or is still ongoing. Based on this information, a series of conflict variables at the kabupaten level are derived. In order to obtain comparable indicators of conflict intensity, fatalities and material damage are set in proportion to the kabupaten’s total population and total GDP, respectively. Conflict spillover variables are computed by the ratio of the total number of fatalities (total amount of material damage) in all neighboring kabupaten to the total population (total GDP) of all neighboring kabupaten. Unlike binary indicators used in related cross-country analyses, this approach allows for the consideration of the economic impact of conflict intensity in neighboring regions. Furthermore, we aim to address potentially varying growth effects in different phases of violent conflict. As the Podes data covers conflict in the respective previous year and is conducted three times per decade, the information on the occurrence of violent conflict is not continuous. Although this prevents us from understanding the whole course of the conflict, village heads do indicate whether conflict is resolved or still ongoing. This information allows us to distinguish between active conflicts and observations from an early post-conflict situation, and we divide the indicators of relative conflict intensity accordingly. Tablet 1(c) provides descriptive statistics for all conflict variables that we use in the analysis. One concern we face is the issue of data reliability. Comparably low levels of conflict reported by Podes raises concerns of misreporting by local authorities. When conflict is perceived as the failure of local leaders, and when respondents have doubts about the purpose of the survey, violence might not be accurately reported. Comparisons with other quantitative surveys and qualitative fieldwork indeed suggest that conflict is significantly underreported by Podes.9 However, these comparisons also show such underreporting to be of similar magnitude across different regions and hence systemic, i.e. not biased by local characteristics. Podes data is therefore assumed to provide accurate information on relative levels of conflict both across kabupaten and over time. Keeping in mind that the potential underreporting would result in an attenuation bias, we expect rather conservative estimates of the economic impact of violent conflict.
8For instance, no measure of human capital is included, as data on literacy or school enrollment rates are not available for 2008. Given the relatively short time period covered by the analysis, we generally do not expect these indicators to change substantially. In fact, the variance decomposition of available literacy data from 2000 to 2006 reveals low within kabupaten variations when compared to variation across kabupaten. 9Barron and Sharpe (2008) monitored conflicts reported in local newspapers in the provinces of East Java and Nusa Tenggara Timur (NTT) during the period 2001–2003; Barron, Kaiser, and Pradhan, 2004 conducted village-level case studies in the same provinces for comparison with 2003 Podes.
The SMERU Research Institute 9
IV. ECONOMETRIC APPROACH 4.1 Regression Setup Building on standard growth regressions, the starting point of our empirical analysis is the following equation: git = Citα + Xitβ + εit, (1) where git is the total or sectoral growth rate of real GDP in kabupaten i and year t, Cit are measures of conflict, Xit is a matrix of other covariates that determine economic growth, and sit is the unobservable error term. The coefficient of interest is α, which captures the effects of conflict on GDP growth. Previous macro-level studies on the economic impacts of violent conflict have in large relied on pooled OLS estimation (Bozzoli et al., 2008). In this setting, however, the underlying assumption of independent and identically distributed errors ε is likely to be violated. When factors are omitted that affect a society's economic outcomes and its vulnerability to violent conflict at the same time, OLS estimates are inconsistent. Cultural attitudes, for instance, arc hard to measure, but potentially drive both growth and conflicts. With panel data at hand, we can address this unobserved heterogeneity by using kabupaten fixed effects (FE) to control for those kabupaten characteristics that did not change over the 2002-2008 period. This captures underlying cultural values, as well as other time-invariant or long-term, slow changing, growth determinants, such as initial wealth or geographic and climatic conditions. The variance decomposition for both the growth and conflict variables reveals larger variations over time (within variation) than across kabupaten (between variation), which confirms the accuracy and necessity of the FE model, in particular, for our focus on the role of violent conflicts. The inclusion of time dummies further accounts for overall macroeconomic trends that affect all kabupaten alike. 4.2 Endogeneity of Conflict Variables As in every empirical investigation of the conflict-growth nexus, we face concerns of endogenous conflict variables. That is, (low) economic growth is not only a result, but can also be a potential cause of violent conflict. We therefore discuss the potentiality of dual causality between economic growth and conflict for the Indonesian context in more detail. The factors that triggered and fueled the conflicts in Indonesia at the turn of the millennium are manifold and, moreover, vary across affected regions. In general, the country's transition period after the fall of Suharto was characterized by the legacies of the 1997 economic crisis, local-level struggles for political and economic power, and a lack of effective security and justice institutions. While these conditions basically held true for the whole country, some regions faced additional challenges conducive to the outbreak of violence. The processes underlying the separatist conflict in Aceh are thereby different from those that shaped the communal conflicts in particular in Central Sulawesi and the Moluccas. The Aceh conflict was driven by a long quest for (more) autonomy, and this struggle for independence intensified after Suharto's fall, encouraged further by the successful secession of East Timor in 1999. The conflict between the Indonesian military and the GAM became increasingly brutal between 1999 and 2002, with both sides being accused of regular human rights abuses. It was estimated that civilians accounted for 80% of the death toll during that
The SMERU Research Institute 10
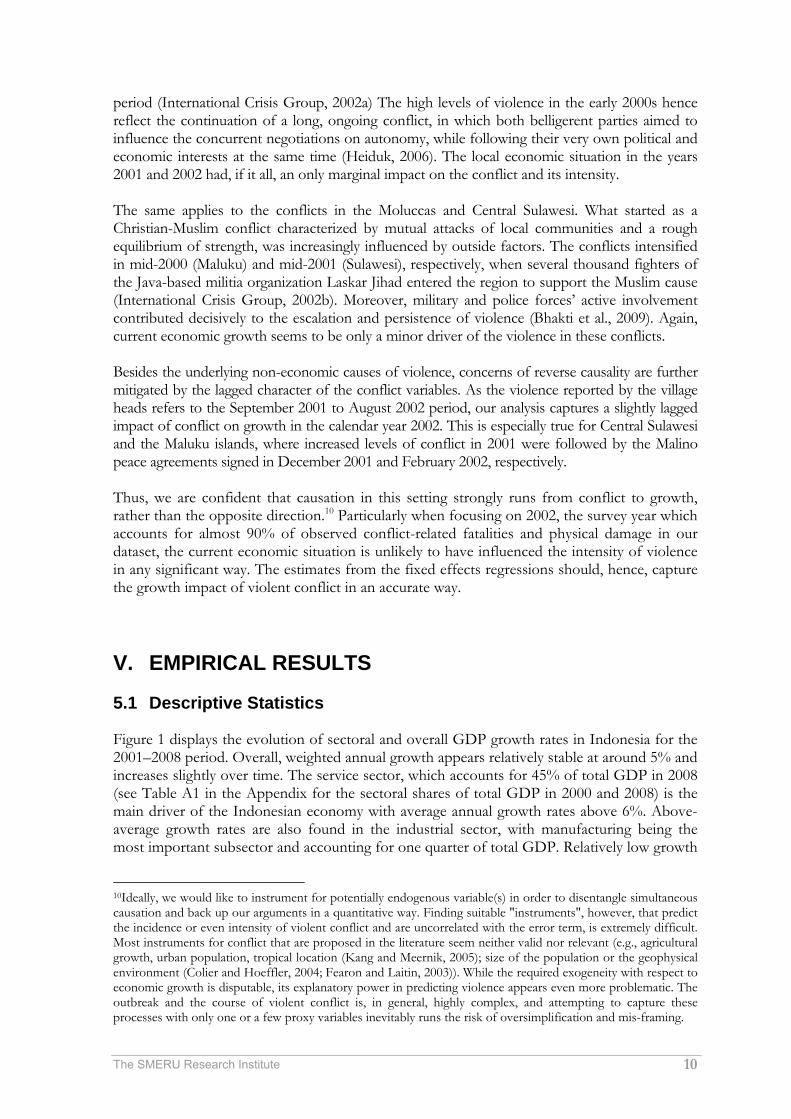
period (International Crisis Group, 2002a) The high levels of violence in the early 2000s hence reflect the continuation of a long, ongoing conflict, in which both belligerent parties aimed to influence the concurrent negotiations on autonomy, while following their very own political and economic interests at the same time (Heiduk, 2006). The local economic situation in the years 2001 and 2002 had, if it all, an only marginal impact on the conflict and its intensity. The same applies to the conflicts in the Moluccas and Central Sulawesi. What started as a Christian-Muslim conflict characterized by mutual attacks of local communities and a rough equilibrium of strength, was increasingly influenced by outside factors. The conflicts intensified in mid-2000 (Maluku) and mid-2001 (Sulawesi), respectively, when several thousand fighters of the Java-based militia organization Laskar Jihad entered the region to support the Muslim cause (International Crisis Group, 2002b). Moreover, military and police forces’ active involvement contributed decisively to the escalation and persistence of violence (Bhakti et al., 2009). Again, current economic growth seems to be only a minor driver of the violence in these conflicts. Besides the underlying non-economic causes of violence, concerns of reverse causality are further mitigated by the lagged character of the conflict variables. As the violence reported by the village heads refers to the September 2001 to August 2002 period, our analysis captures a slightly lagged impact of conflict on growth in the calendar year 2002. This is especially true for Central Sulawesi and the Maluku islands, where increased levels of conflict in 2001 were followed by the Malino peace agreements signed in December 2001 and February 2002, respectively. Thus, we are confident that causation in this setting strongly runs from conflict to growth, rather than the opposite direction.10 Particularly when focusing on 2002, the survey year which accounts for almost 90% of observed conflict-related fatalities and physical damage in our dataset, the current economic situation is unlikely to have influenced the intensity of violence in any significant way. The estimates from the fixed effects regressions should, hence, capture the growth impact of violent conflict in an accurate way. V. EMPIRICAL RESULTS 5.1 Descriptive Statistics Figure 1 displays the evolution of sectoral and overall GDP growth rates in Indonesia for the 2001–2008 period. Overall, weighted annual growth appears relatively stable at around 5% and increases slightly over time. The service sector, which accounts for 45% of total GDP in 2008 (see Table A1 in the Appendix for the sectoral shares of total GDP in 2000 and 2008) is the main driver of the Indonesian economy with average annual growth rates above 6%. Above-average growth rates are also found in the industrial sector, with manufacturing being the most important subsector and accounting for one quarter of total GDP. Relatively low growth
10Ideally, we would like to instrument for potentially endogenous variable(s) in order to disentangle simultaneous causation and back up our arguments in a quantitative way. Finding suitable "instruments", however, that predict the incidence or even intensity of violent conflict and are uncorrelated with the error term, is extremely difficult. Most instruments for conflict that are proposed in the literature seem neither valid nor relevant (e.g., agricultural growth, urban population, tropical location (Kang and Meernik, 2005); size of the population or the geophysical environment (Colier and Hoeffler, 2004; Fearon and Laitin, 2003)). While the required exogeneity with respect to economic growth is disputable, its explanatory power in predicting violence appears even more problematic. The outbreak and the course of violent conflict is, in general, highly complex, and attempting to capture these processes with only one or a few proxy variables inevitably runs the risk of oversimplification and mis-framing.
The SMERU Research Institute 11
is observed for the primary sector. It still accounts for 26% of total rural production in 2008, with its share only decreasing slowly since 2000.
Figure 1. Growth Trends 2001–2008
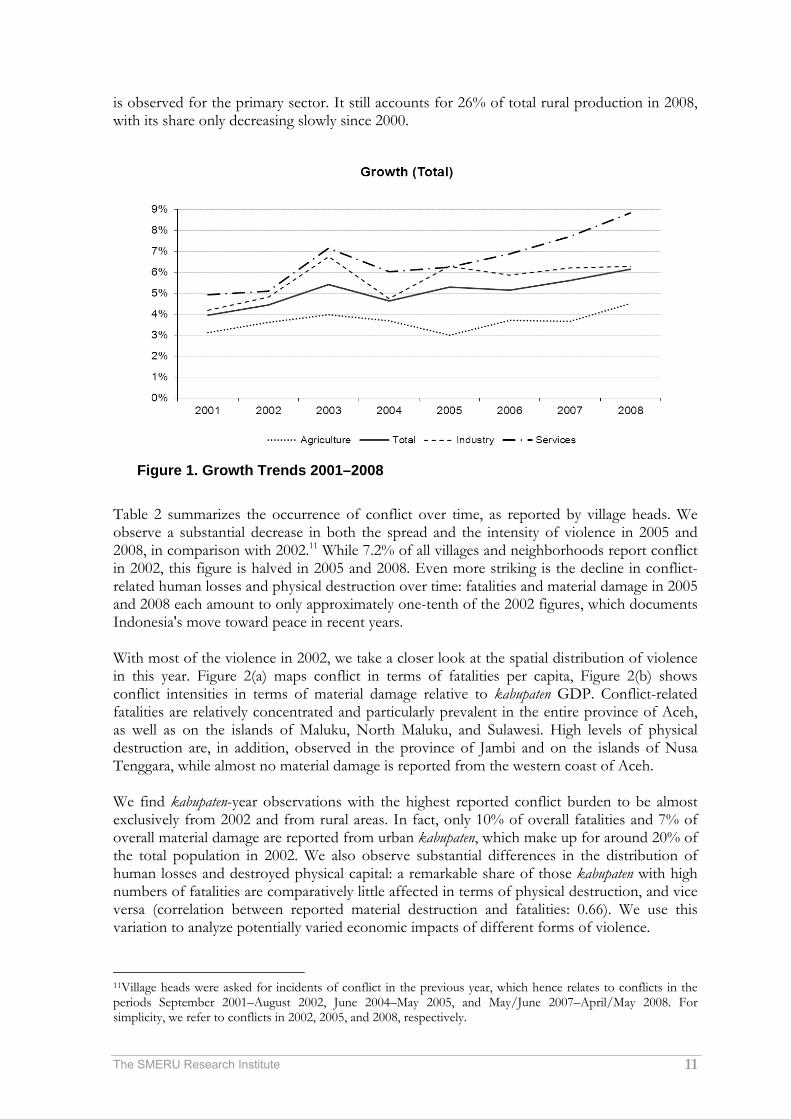
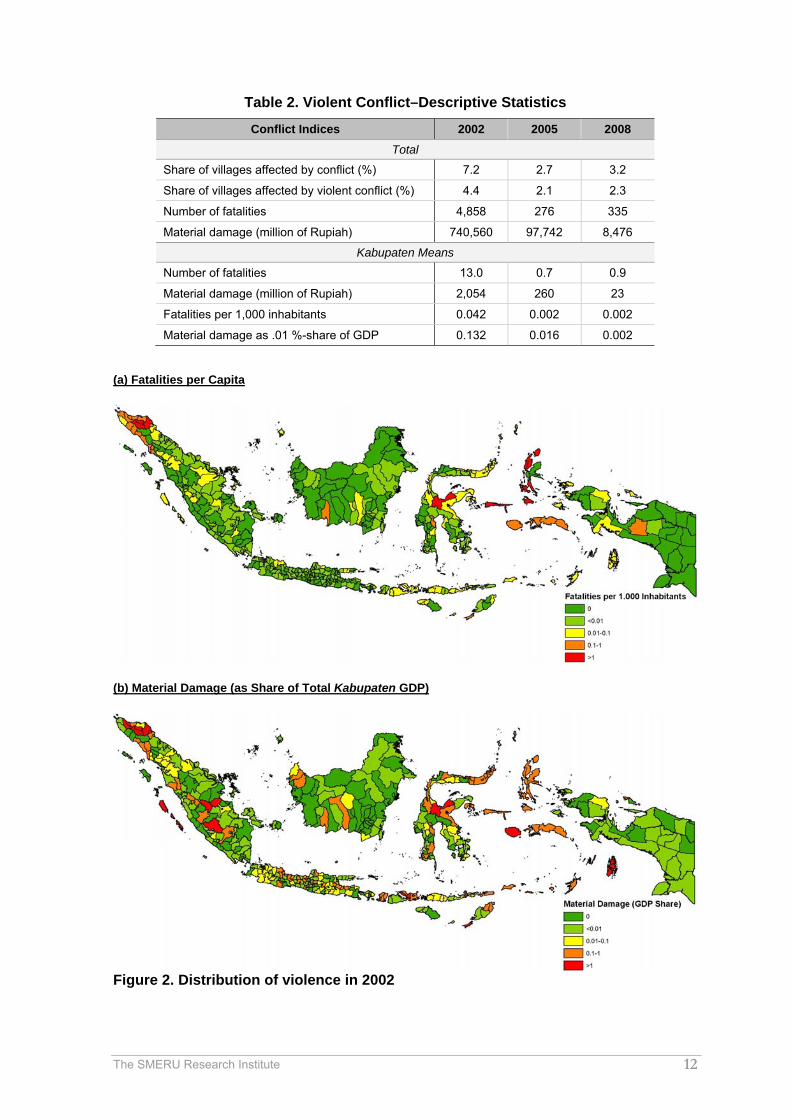
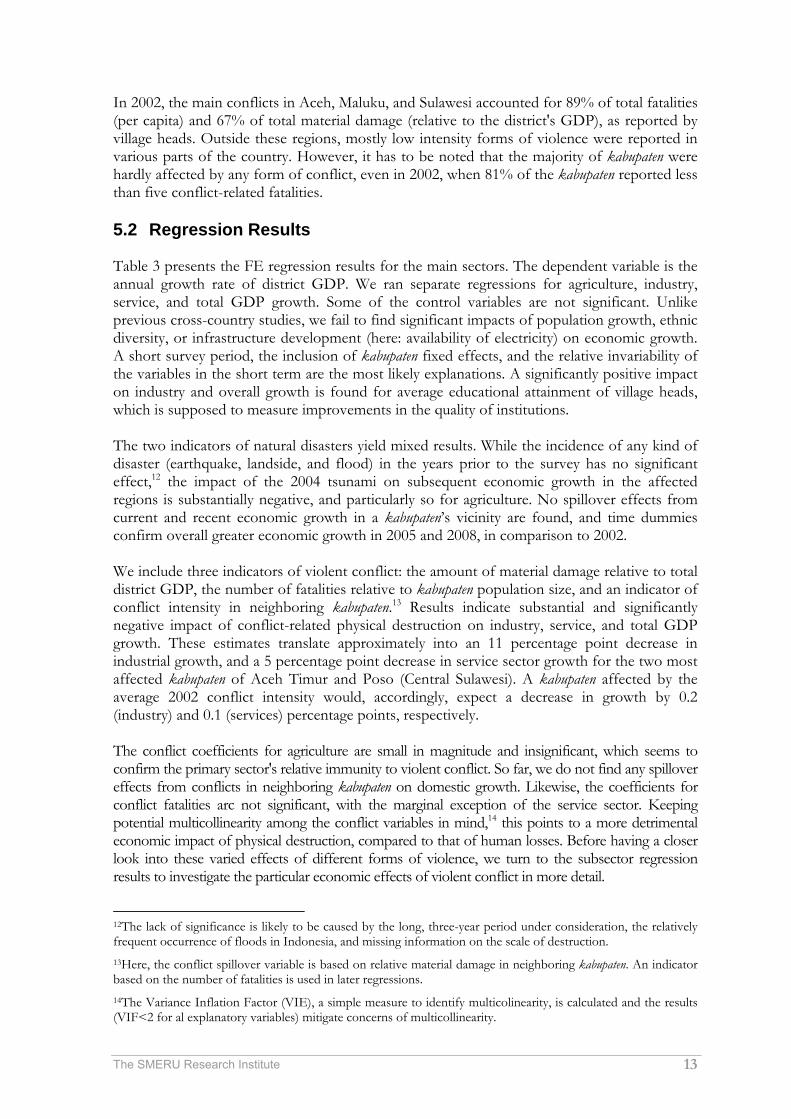
Table 2 summarizes the occurrence of conflict over time, as reported by village heads. We observe a substantial decrease in both the spread and the intensity of violence in 2005 and 2008, in comparison with 2002.11 While 7.2% of all villages and neighborhoods report conflict in 2002, this figure is halved in 2005 and 2008. Even more striking is the decline in conflict-related human losses and physical destruction over time: fatalities and material damage in 2005 and 2008 each amount to only approximately one-tenth of the 2002 figures, which documents Indonesia's move toward peace in recent years. With most of the violence in 2002, we take a closer look at the spatial distribution of violence in this year. Figure 2(a) maps conflict in terms of fatalities per capita, Figure 2(b) shows conflict intensities in terms of material damage relative to kabupaten GDP. Conflict-related fatalities are relatively concentrated and particularly prevalent in the entire province of Aceh, as well as on the islands of Maluku, North Maluku, and Sulawesi. High levels of physical destruction are, in addition, observed in the province of Jambi and on the islands of Nusa Tenggara, while almost no material damage is reported from the western coast of Aceh. We find kabupaten-year observations with the highest reported conflict burden to be almost exclusively from 2002 and from rural areas. In fact, only 10% of overall fatalities and 7% of overall material damage are reported from urban kabupaten, which make up for around 20% of the total population in 2002. We also observe substantial differences in the distribution of human losses and destroyed physical capital: a remarkable share of those kabupaten with high numbers of fatalities are comparatively little affected in terms of physical destruction, and vice versa (correlation between reported material destruction and fatalities: 0.66). We use this variation to analyze potentially varied economic impacts of different forms of violence.
11Village heads were asked for incidents of conflict in the previous year, which hence relates to conflicts in the periods September 2001–August 2002, June 2004–May 2005, and May/June 2007–April/May 2008. For simplicity, we refer to conflicts in 2002, 2005, and 2008, respectively.
The SMERU Research Institute 12
Table 2. Violent Conflict–Descriptive Statistics
Conflict Indices 2002 2005 2008 Total
Share of villages affected by conflict (%) 7.2 2.7 3.2
Share of villages affected by violent conflict (%) 4.4 2.1 2.3
Number of fatalities 4,858 276 335
Material damage (million of Rupiah) 740,560 97,742 8,476
Kabupaten Means
Number of fatalities 13.0 0.7 0.9
Material damage (million of Rupiah) 2,054 260 23
Fatalities per 1,000 inhabitants 0.042 0.002 0.002
Material damage as .01 %-share of GDP 0.132 0.016 0.002
(a) Fatalities per Capita
(b) Material Damage (as Share of Total Kabupaten GDP)
Figure 2. Distribution of violence in 2002
The SMERU Research Institute 13
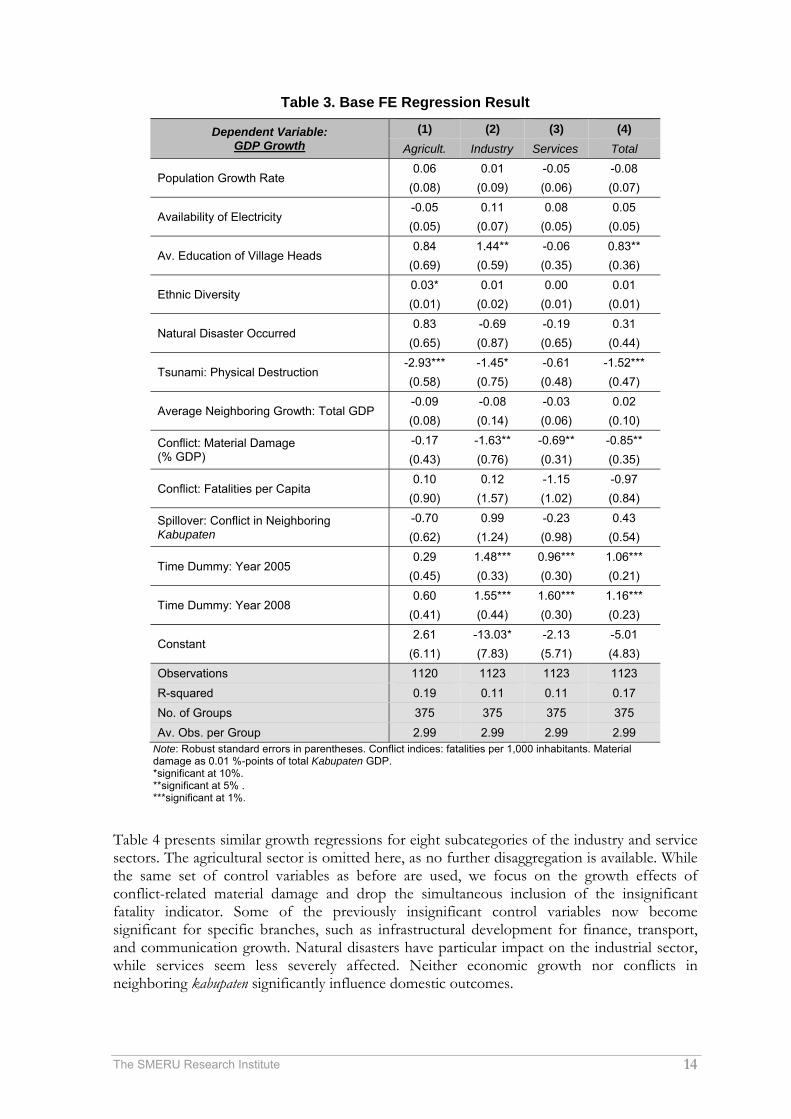
In 2002, the main conflicts in Aceh, Maluku, and Sulawesi accounted for 89% of total fatalities (per capita) and 67% of total material damage (relative to the district's GDP), as reported by village heads. Outside these regions, mostly low intensity forms of violence were reported in various parts of the country. However, it has to be noted that the majority of kabupaten were hardly affected by any form of conflict, even in 2002, when 81% of the kabupaten reported less than five conflict-related fatalities. 5.2 Regression Results Table 3 presents the FE regression results for the main sectors. The dependent variable is the annual growth rate of district GDP. We ran separate regressions for agriculture, industry, service, and total GDP growth. Some of the control variables are not significant. Unlike previous cross-country studies, we fail to find significant impacts of population growth, ethnic diversity, or infrastructure development (here: availability of electricity) on economic growth. A short survey period, the inclusion of kabupaten fixed effects, and the relative invariability of the variables in the short term are the most likely explanations. A significantly positive impact on industry and overall growth is found for average educational attainment of village heads, which is supposed to measure improvements in the quality of institutions. The two indicators of natural disasters yield mixed results. While the incidence of any kind of disaster (earthquake, landside, and flood) in the years prior to the survey has no significant effect,12 the impact of the 2004 tsunami on subsequent economic growth in the affected regions is substantially negative, and particularly so for agriculture. No spillover effects from current and recent economic growth in a kabupaten’s vicinity are found, and time dummies confirm overall greater economic growth in 2005 and 2008, in comparison to 2002. We include three indicators of violent conflict: the amount of material damage relative to total district GDP, the number of fatalities relative to kabupaten population size, and an indicator of conflict intensity in neighboring kabupaten.13 Results indicate substantial and significantly negative impact of conflict-related physical destruction on industry, service, and total GDP growth. These estimates translate approximately into an 11 percentage point decrease in industrial growth, and a 5 percentage point decrease in service sector growth for the two most affected kabupaten of Aceh Timur and Poso (Central Sulawesi). A kabupaten affected by the average 2002 conflict intensity would, accordingly, expect a decrease in growth by 0.2 (industry) and 0.1 (services) percentage points, respectively. The conflict coefficients for agriculture are small in magnitude and insignificant, which seems to confirm the primary sector's relative immunity to violent conflict. So far, we do not find any spillover effects from conflicts in neighboring kabupaten on domestic growth. Likewise, the coefficients for conflict fatalities arc not significant, with the marginal exception of the service sector. Keeping potential multicollinearity among the conflict variables in mind,14 this points to a more detrimental economic impact of physical destruction, compared to that of human losses. Before having a closer look into these varied effects of different forms of violence, we turn to the subsector regression results to investigate the particular economic effects of violent conflict in more detail.
12The lack of significance is likely to be caused by the long, three-year period under consideration, the relatively frequent occurrence of floods in Indonesia, and missing information on the scale of destruction. 13Here, the conflict spillover variable is based on relative material damage in neighboring kabupaten. An indicator based on the number of fatalities is used in later regressions. 14The Variance Inflation Factor (VIE), a simple measure to identify multicolinearity, is calculated and the results (VIF<2 for al explanatory variables) mitigate concerns of multicollinearity.
The SMERU Research Institute 14
Table 3. Base FE Regression Result
Dependent Variable: GDP Growth
(1) (2) (3) (4) Agricult. Industry Services Total
Population Growth Rate 0.06 0.01 -0.05 -0.08
(0.08) (0.09) (0.06) (0.07)
Availability of Electricity -0.05 0.11 0.08 0.05 (0.05) (0.07) (0.05) (0.05)
Av. Education of Village Heads 0.84 1.44** -0.06 0.83**
(0.69) (0.59) (0.35) (0.36)
Ethnic Diversity 0.03* 0.01 0.00 0.01 (0.01) (0.02) (0.01) (0.01)
Natural Disaster Occurred 0.83 -0.69 -0.19 0.31
(0.65) (0.87) (0.65) (0.44)
Tsunami: Physical Destruction -2.93*** -1.45* -0.61 -1.52*** (0.58) (0.75) (0.48) (0.47)
Average Neighboring Growth: Total GDP -0.09 -0.08 -0.03 0.02 (0.08) (0.14) (0.06) (0.10)
Conflict: Material Damage (% GDP)
-0.17 -1.63** -0.69** -0.85** (0.43) (0.76) (0.31) (0.35)
Conflict: Fatalities per Capita 0.10 0.12 -1.15 -0.97
(0.90) (1.57) (1.02) (0.84)
Spillover: Conflict in Neighboring Kabupaten
-0.70 0.99 -0.23 0.43 (0.62) (1.24) (0.98) (0.54)
Time Dummy: Year 2005 0.29 1.48*** 0.96*** 1.06***
(0.45) (0.33) (0.30) (0.21)
Time Dummy: Year 2008 0.60 1.55*** 1.60*** 1.16***
(0.41) (0.44) (0.30) (0.23)
Constant 2.61 -13.03* -2.13 -5.01
(6.11) (7.83) (5.71) (4.83) Observations 1120 1123 1123 1123 R-squared 0.19 0.11 0.11 0.17 No. of Groups 375 375 375 375 Av. Obs. per Group 2.99 2.99 2.99 2.99
Note: Robust standard errors in parentheses. Conflict indices: fatalities per 1,000 inhabitants. Material damage as 0.01 %-points of total Kabupaten GDP. *significant at 10%. **significant at 5% . ***significant at 1%.
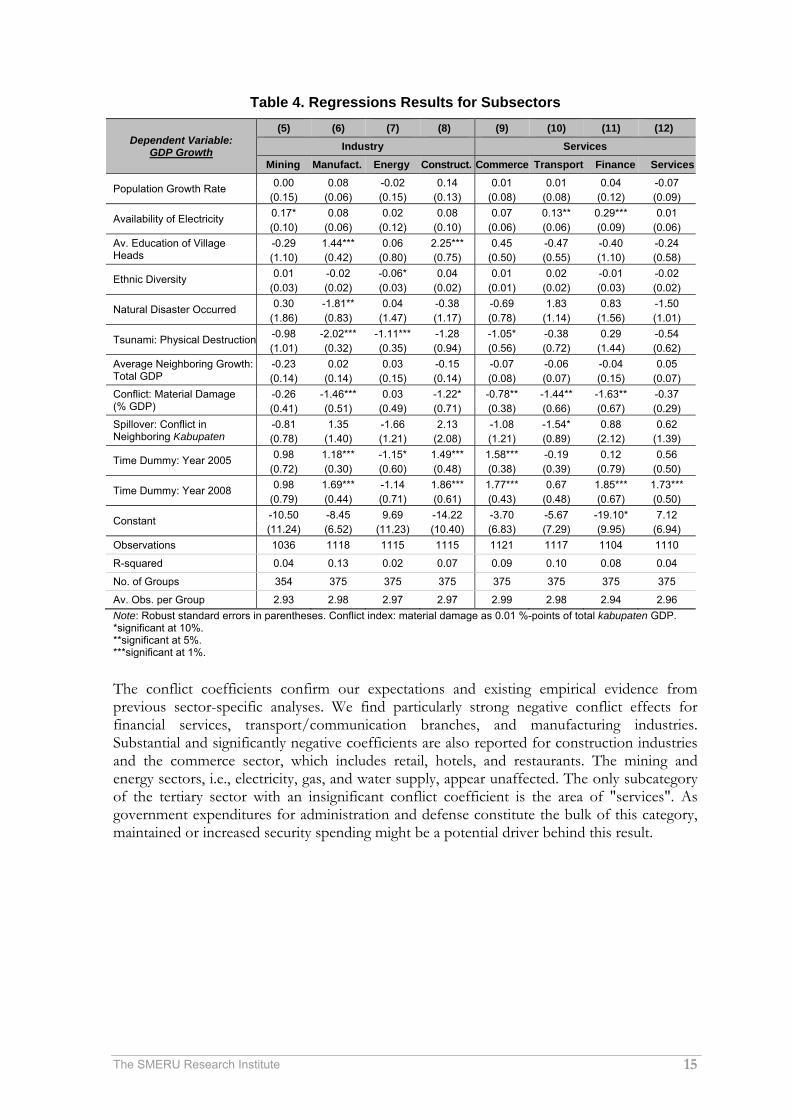
Table 4 presents similar growth regressions for eight subcategories of the industry and service sectors. The agricultural sector is omitted here, as no further disaggregation is available. While the same set of control variables as before are used, we focus on the growth effects of conflict-related material damage and drop the simultaneous inclusion of the insignificant fatality indicator. Some of the previously insignificant control variables now become significant for specific branches, such as infrastructural development for finance, transport, and communication growth. Natural disasters have particular impact on the industrial sector, while services seem less severely affected. Neither economic growth nor conflicts in neighboring kabupaten significantly influence domestic outcomes.
The SMERU Research Institute 15
Table 4. Regressions Results for Subsectors
Dependent Variable: GDP Growth
(5) (6) (7) (8) (9) (10) (11) (12) Industry Services
Mining Manufact. Energy Construct. Commerce Transport Finance Services
Population Growth Rate 0.00 0.08 -0.02 0.14 0.01 0.01 0.04 -0.07(0.15) (0.06) (0.15) (0.13) (0.08) (0.08) (0.12) (0.09)
Availability of Electricity 0.17* 0.08 0.02 0.08 0.07 0.13** 0.29*** 0.01(0.10) (0.06) (0.12) (0.10) (0.06) (0.06) (0.09) (0.06)
Av. Education of Village Heads
-0.29 1.44*** 0.06 2.25*** 0.45 -0.47 -0.40 -0.24(1.10) (0.42) (0.80) (0.75) (0.50) (0.55) (1.10) (0.58)
Ethnic Diversity 0.01 -0.02 -0.06* 0.04 0.01 0.02 -0.01 -0.02(0.03) (0.02) (0.03) (0.02) (0.01) (0.02) (0.03) (0.02)
Natural Disaster Occurred 0.30 -1.81** 0.04 -0.38 -0.69 1.83 0.83 -1.50(1.86) (0.83) (1.47) (1.17) (0.78) (1.14) (1.56) (1.01)
Tsunami: Physical Destruction -0.98 -2.02*** -1.11*** -1.28 -1.05* -0.38 0.29 -0.54(1.01) (0.32) (0.35) (0.94) (0.56) (0.72) (1.44) (0.62)
Average Neighboring Growth: Total GDP
-0.23 0.02 0.03 -0.15 -0.07 -0.06 -0.04 0.05(0.14) (0.14) (0.15) (0.14) (0.08) (0.07) (0.15) (0.07)
Conflict: Material Damage (% GDP)
-0.26 -1.46*** 0.03 -1.22* -0.78** -1.44** -1.63** -0.37(0.41) (0.51) (0.49) (0.71) (0.38) (0.66) (0.67) (0.29)
Spillover: Conflict in Neighboring Kabupaten
-0.81 1.35 -1.66 2.13 -1.08 -1.54* 0.88 0.62(0.78) (1.40) (1.21) (2.08) (1.21) (0.89) (2.12) (1.39)
Time Dummy: Year 2005 0.98 1.18*** -1.15* 1.49*** 1.58*** -0.19 0.12 0.56(0.72) (0.30) (0.60) (0.48) (0.38) (0.39) (0.79) (0.50)
Time Dummy: Year 2008 0.98 1.69*** -1.14 1.86*** 1.77*** 0.67 1.85*** 1.73***(0.79) (0.44) (0.71) (0.61) (0.43) (0.48) (0.67) (0.50)
Constant -10.50 -8.45 9.69 -14.22 -3.70 -5.67 -19.10* 7.12(11.24) (6.52) (11.23) (10.40) (6.83) (7.29) (9.95) (6.94)
Observations 1036 1118 1115 1115 1121 1117 1104 1110
R-squared 0.04 0.13 0.02 0.07 0.09 0.10 0.08 0.04
No. of Groups 354 375 375 375 375 375 375 375
Av. Obs. per Group 2.93 2.98 2.97 2.97 2.99 2.98 2.94 2.96 Note: Robust standard errors in parentheses. Conflict index: material damage as 0.01 %-points of total kabupaten GDP. *significant at 10%. **significant at 5%. ***significant at 1%.
The conflict coefficients confirm our expectations and existing empirical evidence from previous sector-specific analyses. We find particularly strong negative conflict effects for financial services, transport/communication branches, and manufacturing industries. Substantial and significantly negative coefficients are also reported for construction industries and the commerce sector, which includes retail, hotels, and restaurants. The mining and energy sectors, i.e., electricity, gas, and water supply, appear unaffected. The only subcategory of the tertiary sector with an insignificant conflict coefficient is the area of "services". As government expenditures for administration and defense constitute the bulk of this category, maintained or increased security spending might be a potential driver behind this result.
The SMERU Research Institute 16
Table 5. Regression Results–Resolved vs. Ongoing Conflicts
Dep. Var: GDP Growth
(1) (2) (3) (4) (5) (6) (7) (8) (9) (10) (11) (12)
Agricult. Mining Manufact. Energy Construct. Industry Commerce Transport Finance Services Service Total
Resolved Conflict: Material Damage
-0.40 0.36 -1.36 0.17 1.06 0.04 -0.42 0.20 -1.44 -1.01*** -0.68* 0.12
(0.60) (0.69) (0.95) (1.05) (0.89) (0.62) (0.41) (0.33) (0.89) (0.34) (0.35) (0.37)
Ongoing Conflict: Material Damage
0.07 -1.75 -1.58** -0.13 -3.22*** -3.05*** -1.10 -2.92*** -1.79 0.19 -1.26** -2.16***
(0.46) (1.50) (0.65) (0.69) (0.78) (0.52) (0.68) (0.40) (1.44) (0.34) (0.59) (0.33)
Spillover: Conflict in Neighboring Kabupaten
-0.75 -0.55 1.38 -1.62 2.67 1.39 -1.00 -1.15 0.93 0.48 -0.23 0.65
(0.64) (0.93) (1.46) (1.26) (2.14) (1.29) (1.23) (0.92) (2.16) (1.35) (0.97) (0.55)
Note: Each pair of coefficients from a different regression (control variables as in Table 4). Robust standard errors in parentheses. Conflict index: material damage as 0.01 %-points of total kabupaten GDP. *significant at 10%. **significant at 5%. ***significant at 1%.
The SMERU Research Institute 17
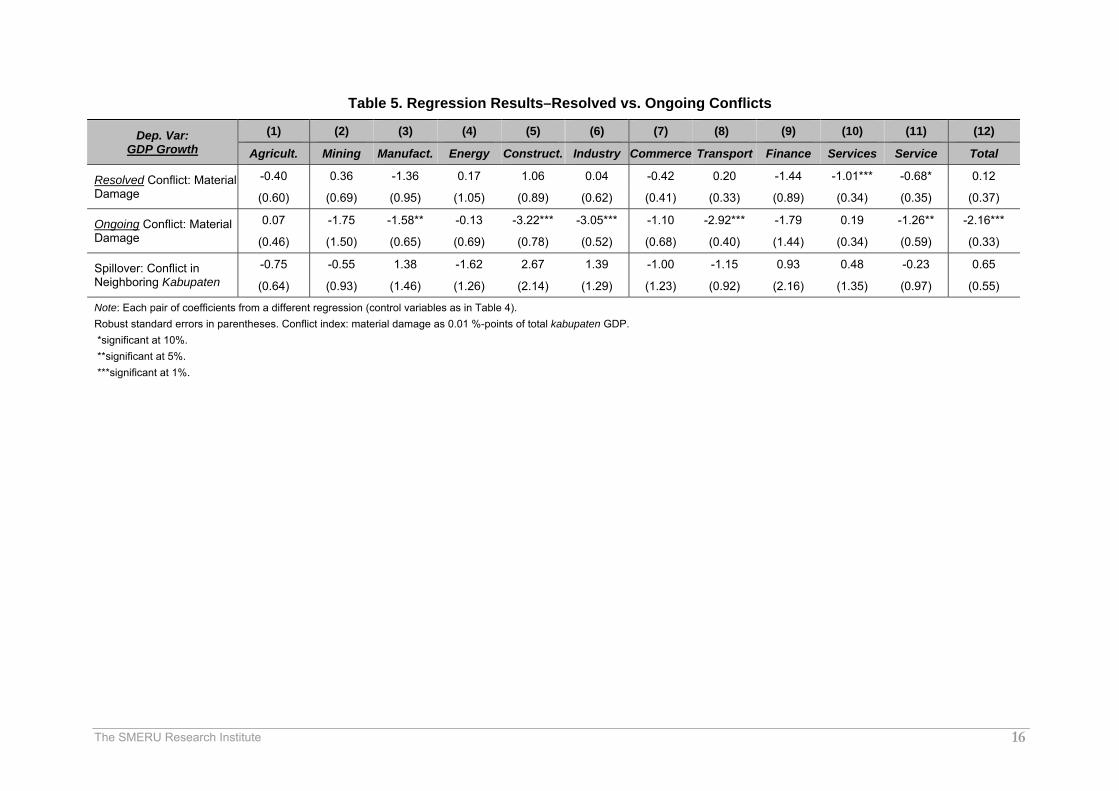
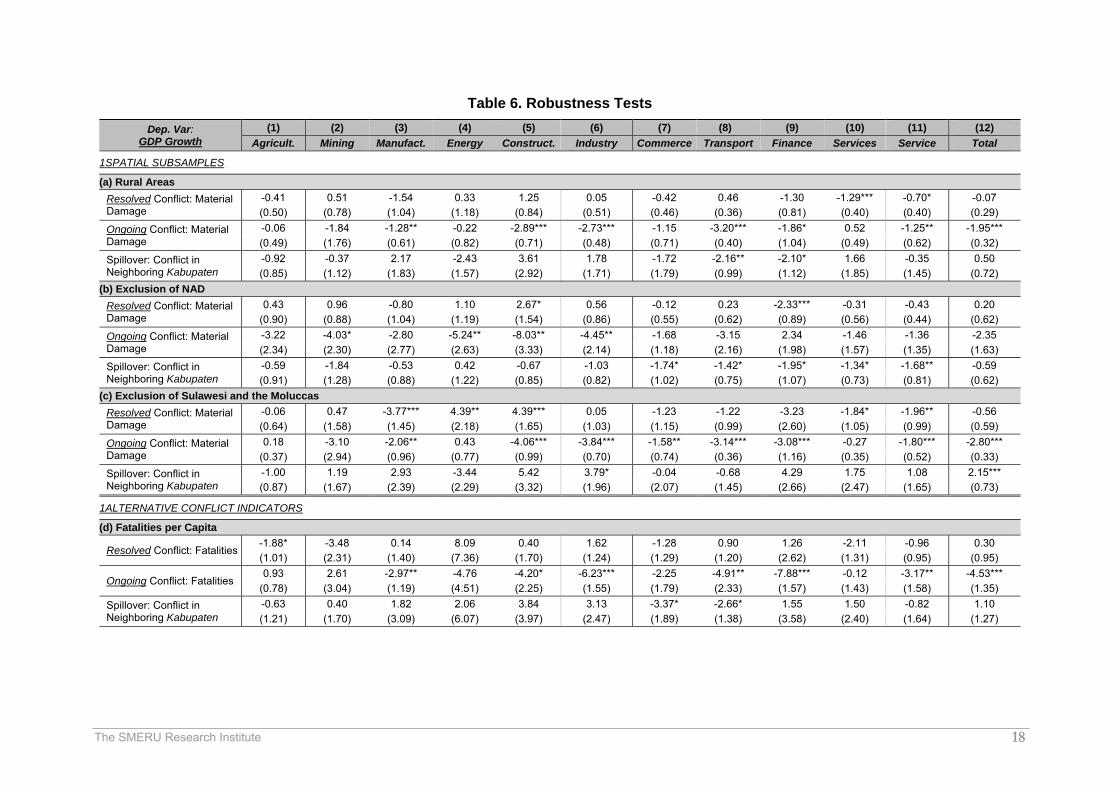
In the next step, we exploit some of the growth dynamics of violent conflict. Ceteris paribus, we spit the indicator of relative physical destruction into ongoing and recently resolved conflicts. Table 5 presents the results from separate regressions on total, sectoral, and subsectoral GDP growth. As the general regression setup has not changed, the estimates for the control variables resemble those obtained in previous regressions. We therefore only report the estimates for the conflict coefficients in what follows. Focusing on the estimated growth effects of ongoing and recent conflicts, we find clear-cut differences. For most sectors, results point to a considerably stronger decline in growth rates during ongoing conflicts than indicated by the singular indicator of conflicts that was previously used. In particular, the construction and transport/communication sectors seem to suffer most during episodes of violence. Collapsing demand for buildings and infrastructure combined with an overall decrease in business transactions potentially deepens the crisis in these sectors during times of conflict. A relatively strong negative growth impact of conflict is also found for the manufacturing and commerce industries, which is in line with both Collier's (1999) concept of war vulnerability and existing evidence on the effects of violence on tourism and hospitality industries. Turning to the growth impact for resolved conflicts, the estimates are by far less substantial and significant. The only exception is the services subcategory: including, inter alia, government defense expenditures, this is possibly related to a post-conflict cutback in pubic spending on security. Marginally negative impacts of resolved conflicts are still found for the financial sector and manufacturing, which are assumed to be particularly dependent on a stable market environment. By contrast, the even insignificantly positive "post-war" coefficients for construction and transport/communication industries seem related to pubic and private investment in reconstruction activities. 5.3 Robustness Tests A series of alternative subsamples and conflict coefficients are employed to test the robustness of our findings. As the regression set-up and the control variables remain unchanged, we only present the estimates for the conflict coefficients in what follows.15 First, the sample is restricted to rural areas, where, by far, most of the violence took place. The results, presented in Table 6(a), are close to those for the whole sample: growth rates in the fields of transport/communication, construction, finance, and manufacturing are substantially affected during ongoing conflict. We find a marginally negative impact on commerce growth, while the positive post-conflict trend for the construction sector is strengthened. In addition, the results indicate negative conflict spillover effects on finance and transport/communication, which is in line with previous evidence on negative growth impacts of conflict for contiguous neighbors, especially in the short term (Murdoch and Sandler, 2002). While the transport sector relies, almost by definition, on cross-kabupaten activities, these results also suggest that trust and transaction volume in domestic financial markets are affected by neighboring conflicts.
15The complete set of regression results is available from the authors upon request.
The SMERU Research Institute 18
Table 6. Robustness Tests Dep. Var:
GDP Growth (1) (2) (3) (4) (5) (6) (7) (8) (9) (10) (11) (12)
Agricult. Mining Manufact. Energy Construct. Industry Commerce Transport Finance Services Service Total
1SPATIAL SUBSAMPLES
(a) Rural Areas Resolved Conflict: Material Damage
-0.41 0.51 -1.54 0.33 1.25 0.05 -0.42 0.46 -1.30 -1.29*** -0.70* -0.07 (0.50) (0.78) (1.04) (1.18) (0.84) (0.51) (0.46) (0.36) (0.81) (0.40) (0.40) (0.29)
Ongoing Conflict: Material Damage
-0.06 -1.84 -1.28** -0.22 -2.89*** -2.73*** -1.15 -3.20*** -1.86* 0.52 -1.25** -1.95*** (0.49) (1.76) (0.61) (0.82) (0.71) (0.48) (0.71) (0.40) (1.04) (0.49) (0.62) (0.32)
Spillover: Conflict in Neighboring Kabupaten
-0.92 -0.37 2.17 -2.43 3.61 1.78 -1.72 -2.16** -2.10* 1.66 -0.35 0.50 (0.85) (1.12) (1.83) (1.57) (2.92) (1.71) (1.79) (0.99) (1.12) (1.85) (1.45) (0.72)
(b) Exclusion of NAD Resolved Conflict: Material Damage
0.43 0.96 -0.80 1.10 2.67* 0.56 -0.12 0.23 -2.33*** -0.31 -0.43 0.20 (0.90) (0.88) (1.04) (1.19) (1.54) (0.86) (0.55) (0.62) (0.89) (0.56) (0.44) (0.62)
Ongoing Conflict: Material Damage
-3.22 -4.03* -2.80 -5.24** -8.03** -4.45** -1.68 -3.15 2.34 -1.46 -1.36 -2.35 (2.34) (2.30) (2.77) (2.63) (3.33) (2.14) (1.18) (2.16) (1.98) (1.57) (1.35) (1.63)
Spillover: Conflict in Neighboring Kabupaten
-0.59 -1.84 -0.53 0.42 -0.67 -1.03 -1.74* -1.42* -1.95* -1.34* -1.68** -0.59 (0.91) (1.28) (0.88) (1.22) (0.85) (0.82) (1.02) (0.75) (1.07) (0.73) (0.81) (0.62)
(c) Exclusion of Sulawesi and the Moluccas Resolved Conflict: Material Damage
-0.06 0.47 -3.77*** 4.39** 4.39*** 0.05 -1.23 -1.22 -3.23 -1.84* -1.96** -0.56 (0.64) (1.58) (1.45) (2.18) (1.65) (1.03) (1.15) (0.99) (2.60) (1.05) (0.99) (0.59)
Ongoing Conflict: Material Damage
0.18 -3.10 -2.06** 0.43 -4.06*** -3.84*** -1.58** -3.14*** -3.08*** -0.27 -1.80*** -2.80*** (0.37) (2.94) (0.96) (0.77) (0.99) (0.70) (0.74) (0.36) (1.16) (0.35) (0.52) (0.33)
Spillover: Conflict in Neighboring Kabupaten
-1.00 1.19 2.93 -3.44 5.42 3.79* -0.04 -0.68 4.29 1.75 1.08 2.15*** (0.87) (1.67) (2.39) (2.29) (3.32) (1.96) (2.07) (1.45) (2.66) (2.47) (1.65) (0.73)
1ALTERNATIVE CONFLICT INDICATORS
(d) Fatalities per Capita
Resolved Conflict: Fatalities -1.88* -3.48 0.14 8.09 0.40 1.62 -1.28 0.90 1.26 -2.11 -0.96 0.30 (1.01) (2.31) (1.40) (7.36) (1.70) (1.24) (1.29) (1.20) (2.62) (1.31) (0.95) (0.95)
Ongoing Conflict: Fatalities 0.93 2.61 -2.97** -4.76 -4.20* -6.23*** -2.25 -4.91** -7.88*** -0.12 -3.17** -4.53***
(0.78) (3.04) (1.19) (4.51) (2.25) (1.55) (1.79) (2.33) (1.57) (1.43) (1.58) (1.35) Spillover: Conflict in Neighboring Kabupaten
-0.63 0.40 1.82 2.06 3.84 3.13 -3.37* -2.66* 1.55 1.50 -0.82 1.10 (1.21) (1.70) (3.09) (6.07) (3.97) (2.47) (1.89) (1.38) (3.58) (2.40) (1.64) (1.27)
The SMERU Research Institute 19
Dep. Var:
GDP Growth (1) (2) (3) (4) (5) (6) (7) (8) (9) (10) (11) (12)
Agricult. Mining Manufact. Energy Construct. Industry Commerce Transport Finance Services Service Total (e) Material Damage – Absolute Values
Resolved Conflict: Material Damage
-0.48 0.40 0.37 0.37 1.02 0.69 -0.29 -0.23 -1.64*** -1.18*** -0.66** 0.08 (0.48) (1.26) (1.06) (0.81) (1.04) (0.80) (0.32) (0.39) (0.54) (0.37) (0.25) (0.56)
Ongoing Conflict: Material Damage
0.19 -3.33 -0.65*** -0.04 -1.29*** -1.44*** -0.80*** -1.50*** -1.34*** 0.16 -0.80*** -1.09*** (0.13) (2.57) (0.22) (0.24) (0.22) (0.21) (0.13) (0.12) (0.33) (0.12) (0.11) (0.15)
Spillover: Conflict in Neighboring Kabupaten
-0.50 0.70 1.01 -1.00 1.80 1.15 -0.38 -0.50 0.99 0.29 -0.00 0.52 (0.33) (0.76) (0.95) (0.79) (1.36) (0.84) (0.74) (0.54) (1.20) (0.87) (0.58) (0.34)
(f) Fatalities – Absolute Numbers
Resolved Conflict: Fatalities -0.37 -0.84** 0.31 2.61** 0.04 0.52*** -0.39** 0.26 0.46 -0.27 -0.21 0.06 (0.23) (0.40) (0.21) (1.08) (0.37) (0.20) (0.18) (0.16) (0.44) (0.25) (0.16) (0.16)
Ongoing Conflict: Fatalities 0.23 0.14 -0.86*** -1.36 -1.24* -1.95*** -1.00*** -1.86*** -2.37*** -0.14 -1.21*** -1.50***
(0.22) (1.31) (0.29) (1.21) (0.64) (0.38) (0.35) (0.43) (0.37) (0.39) (0.26) (0.29) Spillover: Conflict in Neighboring Kabupaten
-0.24 0.30 0.23 1.23 0.73 0.67 -0.82** -0.61* 0.33 0.26 -0.28 0.16 (0.22) (0.33) (0.74) (1.52) (1.00) (0.59) (0.39) (0.32) (0.85) (0.50) (0.34) (0.33)
(g) Share of Villages Affected by Conflict
Resolved Conflict: Fatalities 0.57 0.69 0.30 0.86 0.58 0.54 -0.02 -0.24 -0.17 -0.17 -0.15 0.34
(0.47) (0.82) (0.51) (0.80) (0.63) (0.49) (0.35) (0.41) (0.61) (0.47) (0.26) (0.31)
Ongoing Conflict: Fatalities 0.31 -0.54 0.28 -1.55 0.61 -0.55 -1.48 -1.45 -2.30 0.11 -0.98 -0.51
(0.35) (0.84) (1.31) (1.30) (2.12) (1.45) (0.94) (1.15) (1.62) (0.82) (0.87) (0.91) Spillover: Conflict in Neighboring Kabupaten
0.08 0.72 0.38 -0.18 0.54 0.93** 0.12 0.16 0.29 -0.28 -0.05 0.49 (0.31) (0.57) (0.50) (0.56) (0.46) (0.47) (0.32) (0.42) (0.64) (0.47) (0.30) (0.31)
Note: Each pair of coefficients from a different regression (control variables as in Table 4). Robust standard errors in parentheses. Conflict indices: a) relative: fatalities per 1,000 inhabitants. Material damage as 0.01 %-points of total kabupaten GDP. b) absolute: number of fatalities (in 100 deaths). Material damage (in 1 billion Rupiah). *significant at 10%. **significant at 5%. ***significant at 1%.
The SMERU Research Institute 20
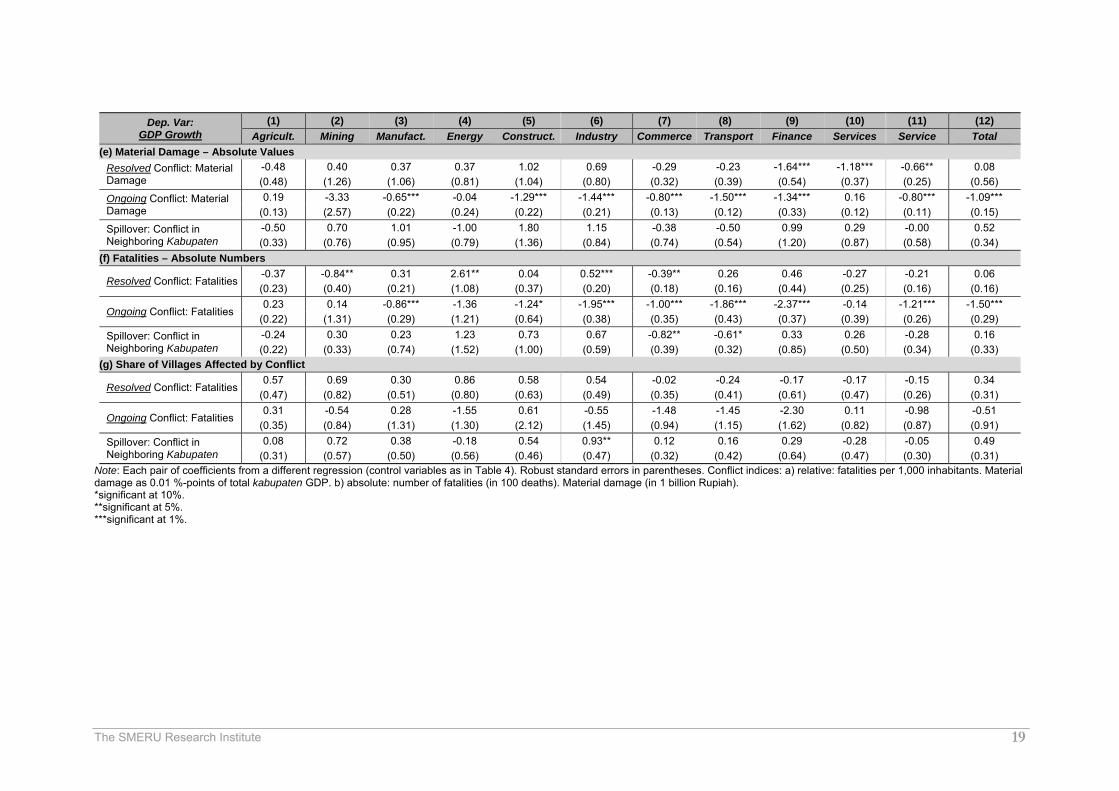
Second, we exclude observations from the province of Aceh, to see to what extent our findings are driven by the separatist conflict in this region (Table 6(b)). Once Aceh is excluded, the negative effects of conflict on the tertiary sector become less significant and are partly absorbed by the conflict spillover variables. The magnitude of the conflict coefficients, however, remains largely unchanged. Interestingly enough, the immediate recovery of the construction sector after the end of conflict is strongly supported here. This effect becomes even clearer when we instead exclude the islands of Maluku and Sulawesi and the associated ethno-communal conflicts (Table 6(c)). In line with Collier's (2009) characterization of the recovery process, we find the immediate post-conflict recovery efforts to center on the reconstruction of critical infrastructure. This trend is also supported by the substantially positive post-conflict growth estimate for the energy sector. Third, instead of conflict-related material damage, we use alternative indicators of conflict. Table 6(d) presents the estimates for the indicators of conflict fatalities. Consistent with previous findings for conflict-related material damage, finance, transport/communication, construction, and manufacturing are the most negatively affected. The results for resolved conflicts further confirm the impression of distinctly different economic impacts at different stages of violent conflict. The main results are also confirmed when using absolute numbers of material damage and fatalities instead of relative indicators of physical destruction and human losses (Tables 6(e) and 6(f)). The results are largely in line with our previous findings and underscore the particular conflict vulnerability of the service sector. Another alternative indicator of conflict is the proportion of villages in a kabupaten that report incidences of conflict. Consistently, the coefficients are highly insignificant (Table 6(g)). As this indicator does not take into account the severity of violence, the mere existence elf conflict seems to have no a priori impact on the economy. As claimed by related cross-country studies, the intensity of conflict decisively determines the impact on the economy. Finally, we repeat the main regressions with the original GDP data, without correcting for outliers in subsectoral growth rates (results not reported). We obtain similar results for al main specifications discussed above. VI. CONCLUSION The overall negative effect of violent conflict on economic outcomes is confirmed by a growing amount of literature. However, little is known on sector-specific impacts of violence, as disaggregated GDP data is scarcely available from conflict-ridden countries. In this paper, we build on detailed, district-level GDP data from Indonesia and on nationwide data on the occurrence of conflicts to assess the vulnerability to conflict across different economic activities. We find significantly different effects of violent conflict across sectors. As proposed by Collier (1999), industries dependent on either capital or transaction are found most vulnerable to conflict. In particular, this applies to manufacturing, finance, transport and communication, as well as the retail and hospitality industries. Spillover effects from violent conflicts in neighboring kabupaten affect both the finance sector as well as transport and communication businesses in a negative way. During ongoing conflicts, the construction sector suffers most, with reduced investment as a potential driver of the observed economic downturn—given that we cannot control for saving rates.
The SMERU Research Institute 21
A different picture evolves in the early post-conflict period. The slightly positive growth trend for construction industries is likely to reflect the immediate beginning of the reconstruction of destroyed infrastructure and production facilities. Other sectors' recovery takes place less rapidly, with both manufacturing industries and the finance sector appearing especially reliant on the rebuilding of trust and a peaceful environment, which takes time. Such differing conflict legacies across sectors change their relative weights, hence shifting the future development of the economy as a whole. This is particularly problematic when resources are diverted away from higher productivity activities. Tradables, for instance, such as manufacturing and modern services, are considered the key drivers behind sustainable development and economic convergence (Rodrik, 2011). The observed relative breakdown of these industries during and after conflict is likely to lead to persistent output gaps in post-conflict economies. The state’s and other actors’ efforts to foster economic recovery in the post-conflict period should put an emphasis on those sectors that drive and facilitate future growth and employment. The rebuilding of infrastructure, such as transportation and communication networks, seems crucial especially for manufacturing industries and logistics services. Further, restoring peace and security probably contributes the most to the recovery of the financial and tourism sectors. Given the scarcity of pubic funds in the aftermath of conflict, consideration of the local economy's structure and the varying needs across branches should guide the efficient use of resources.
The SMERU Research Institute 22
LIST OF REFERENCES Abadie, Alberto and Javier Gardeazabal (2003) ‘The Economic Costs of Conflict: A Case
Study of the Basque Country.’ American Economic Review 93 (1): 113–32. Annan, Jeannie, Christopher Blattman, and Roger Horton (2006) The State of Youth and Youth
Protection in Northern Uganda: Findings from the Survey of War Affected Youth. Uganda: UNICEF.
Arunatilake, Nisha, Sisira Jayasuriya, and Saman Kelegama (2001) ‘The Economic Cost of the
War in Sri Lanka.’ World Development 29 (9): 1483–1500. Barron, Patrick, Kai Kaiser, and Menno Pradhan (2009) ‘Understanding Variations in Local
Conflict: Evidence and Implications from Indonesia.’ World Development 37 (3): 698–713.
Barron, Patrick, Kai Kaiser, and Menno Pradhan (2004) ‘Local Conflict in Indonesia:
Measuring Incidence and Identifying Patterns.’ World Bank Policy Research Working Paper 3384.
Barron, Patrick and Joanne Sharpe (2008) ‘Local Conflict in Post-Suharto Indonesia:
Understanding Variations in Violence Levels and Forms through Local Newspapers.’ Journal of East Asian Studies 8: 395–424.
Beardsley, Kyle and Brian McQuinn (2009) ‘Rebel Groups as Predatory Organizations: The
Political Effects of the 2004 Tsunami in Indonesia and Sri Lanka.’ Journal of Conflict Resolution 53 (4): 624–45.
Bhakti, Ikrar Nusa, Sri Yanuarti, and Mochamad Nurhasim (2009) ‘Military Politics, Ethnicity
and Conflict in Indonesia.’ CRISE Working Paper 62. University of Oxford. Blattman, Christopher and Edward Miguel (2010) ‘Civil War.’ Journal of Economic Literature 48
(1): 3–57. Bodea, Cristina and Ibrahim A. Elbadawi (2008) ‘Political Violence and Economic Growth.’
World Bank Policy Research Working Paper 4692. Bos, Jap W.B., Claire Economidou, Michael Koetter, and James W. Kolari (2010) ‘Do All
Countries Grow Alike?’ Journal of Development Economics 91: 113–27. Bozzoli, Carlos, Tilman Brück, Thorsten Drautzburg, and Simon Sottsas, S. (2008) ‘Economic
Costs of Mass Violent Conflict.’ Politikberatung kompakt 42, DIW Berlin. Brown, Graham, Christopher Wilson, and Suprayoga Hadi (2005) Overcoming Violent Conflict:
Peace and Development Analysis in Maluku and North Maluku. CPRU-UNDP, LIPI, and BAPPENAS.
Brück, Tilman (1997) ‘Macroeconomic Effects of the War in Mozambique.’ Queen Elizabeth
House Working Paper Series 11. University of Oxford International Development Centre.
The SMERU Research Institute 23
Cerra, Valerie and Sweta Chaman Saxena (2008) ‘Growth Dynamics: The Myth of Economic Recovery.’ American Economic Review 98 (1): 439–57.
Chen, Siyan, Norman V.V. Loayza, and Marta Reynal-Querol (2008) ‘The Aftermath of Civil
War.’ The World Bank Economic Review 22 (1): 63–85. Collier, Paul (2009) ‘Post-conflict Recovery: How Should Strategies Be Distinctive?’ Journal of
African Economies 18, AERC Supplement 1: 99–131. ———. (1999) ‘On the Economic Consequences of Civil War.’ Oxford Economic Papers 51:
168–83. Collier, Paul and Anke Hoeffler (2004) ‘Greed and Grievance in Civil War.’ Oxford Economic
Papers 56 (4): 563–95. Depetris Chauvin, Nicolas and Dominic Rohner (2009) ‘The Effects of Conflict on the
Structure of the Economy.’ Dubai School of Government Working Paper 09–10. FAO (1997) ‘FAO/WFP Crop and Food Supply Assessment Mission to Rwanda 1 July 1997.’
Special Reports and Alerts (GIEWS). FAO. Fearon, James and David Laitin (2003) ‘Ethnicity, Insurgency, and Civil War.’ American
Political Science Review 97: 75–90. Garcia, Jorge G and Lana Soelistianingsih (1998) ‘Why Do Differences in Provincial Incomes
Persist in Indonesia?’ Bulletin of Indonesian Economic Studies 34 (1): 95–120. Gupta, Sanjeev, Benedict Clements, Rina Bhattacharya, and Shamit Chakravarti(2004) ‘Fiscal
Consequences of Armed Conflict and Terrorism in Low- and Middle-Income Countries.’ European Journal of Political Economy 20: 403–21.
Heiduk, Felix (2006) Series of Country-related Conflict Analyses: Province of Aceh/Indonesia. Friedrich
Ebert Stiftung, Berlin. Human Rights Watch (2002) Breakdown: Four Years of Communal Violence in Central Sulawesi
C1409, New York: Human Rights Watch. Imai, Kosuke and Jeremy Weinstein (2000) ‘Measuring the Economic Impact of Civil War.’
CID Working Paper 51. Harvard University. International Crisis Group (2002a) Indonesia: ‘The Search for Peace in Maluku.’ Asia Report
31, 8 February 2002. Jakarta/Brussels: ICG 2002. ———.(2002b) ‘Aceh: A Slim Chance for Peace.’ Indonesia Briefing 27 March 2002.
Jakarta/Brussels: ICG 2002. Kang, Seonjou and James Meernik (2005) ‘Civil War Destruction and the Prospects for
Economic Growth.’ Journal of Politics 67 (1): 88–109. Koubi, Vally (2005) ‘War and Economic Performance.’ Journal of Peace Research 42 (1): 67–82.
The SMERU Research Institute 24
Lopez, Humberto and Quentin Wodon (2005) ‘The Economic Impact of Armed Conflict in Rwanda’. Journal of African Economies 14 (4): 586–602.
Mawardi, Sulton (2006) ‘Community Synthesis Report: Kampung Pisang, Ternate, North
Maluku, Indonesia.’ Jakarta: The SMERU Research Institute. McCulloch, Neil and Bambang S. Sjahrir (2008) ‘Endowments, Location or Luck? Evaluating
the Determinants of Sub-National Growth in Decentralized Indonesia.’ World Bank Policy Research Working Paper 4769.
Murdoch, James C and Todd Sandler (2002) ‘Economic Growth, Civil Wars, and Spatial
Spillovers.’ Journal of Conflict Resolution 46 (1): 91–110. Neumayer, Eric (2004) ‘The Impact of Political Violence on Tourism: Dynamic Cross-
National Estimation.’ Journal of Conflict Resolution 48 (2): 259–81. Organski, A.F.K. and Jacek Kugler 1977. ‘The Costs of Major Wars: The Phoenix Factor.’
American Political Science Review 71 (4): 1347–66. Østby, Gudrun, Henrik Urdal, Mohammad Zulfan Tadjoeddin, Syed Mansoob Murshed,
Håvard Strand (2011) ‘Population Pressure, Horizontal Inequality and Political Violence: A Disaggregated Study of Indonesian Provinces, 1990–2003.’ Journal of Development Studies 47 (3): 377–98.
Reid, Anthony (ed.) (2006) Verandah of Violence: The Background to the Aceh Problem. Singapore:
Singapore University Press. Rodrik, Dani (2011) ‘The Future of Economic Convergence.’ NBER Working Paper Series No.
17400. Ross, Michael L. (2004) ‘What Do We Know About Natural Resources and Civil War?’ Journal
of Peace Research 41 (3): 337–56. Tadjoeddin Mohammad Zulfan and Syed Mansoob Murshed, (2007) ‘Socio-economic
Determinants of Everyday Violence in Indonesia: An Empirical Investigation of Javenese Districts, 1994–2003.’ Journal of Peace Research 44 (6): 689–709.
Slobodanka B. Teodosijević (2003) ‘Armed Conflicts and Food Security.’ ESA Working Paper
03–11. Office of the UN Recovery Coordinator for Aceh and Nias (UNORC) (2005) ‘Tsunami
Recovery Status Report.’ Banda Aceh: UNORC. Varshney, Ashutosh, Patrick Barron, Sana Jaffrey, Blair Palmer, and Imron Rasyid (2009)
‘Conflict After the Big Wave: Early Evidence from Maluku and North Maluku.’ Presentation at the World Bank, Jakarta, 12th August 2009.
World Bank (2011), World Development Report 2011: Conflict, Security and Development. Washington
D.C.: World Bank.
The SMERU Research Institute 25
APPENDIX
Table A1. Structure of the GDP Data SubsSector Subbranches GDP Share 2000
(Rural Areas) GDP Share 2008
(Rural Areas)
AG
RIC
UL-
TUR
E
Agriculture
Farm Food Crops
16.7a (27.5)
15.5 (26.2)
Estate Crops Livestock Forestry Fishery
IND
UST
RY
Mining Mining (Oil)
11.1 (18.8)
8.5 (14.8) Mining (Others)
Quarrying
Manufacturing
Oil & Gas Manufacturing
26.3 (21.7)
24.3 (22.2)
- Petroleum Refinery - Liquefied Natural Gas Non Oil & Gas Manufacturing - Food, Beverage & Tobacco - Textile, Leather Products & Footwear - Wood Products & Forest Products - Paper - Fertilizer, Chemicals & Rubber Products - Cements and Non-metal Quarrying Products - Iron & Steel - Transport. Vehicle, Machinery & Equipment - Other Manufactured Products
Energy Electricity
1.0 (0.9)
1.1 (1.0) Gas
Water Supply
Construction Construction Total 5.1 (3.3)
5.9 (3.9)
SER
VIC
ES
Commerce Large Trade & Retail
17.5 (14.5)
20.0 (16.5) Hotel
Restaurant
Transport & Communication
Transportation
5.2 (3.4)
6.9 (4.0)
- Railway Transport - Road Transport - Sea Water Transport - Inland Water Transport - Air Transport - Transportation Supporting Communication - Post and Telecommunication - Communication Supporting
Finance
Banking
8.6 (2.7)
8.8 (3.1)
Non-banking Financial Institution Financial Supporting Rent of Building Business Services
Services
General Government
8.5 (7.2)
9.0 (8.2)
- Government Administration & Defense - Other Government Services Private - Social Community - Recreation & Entertainment - Household & Private
aPercentage share of total (rural) GDP.

The SMERU Research Institute 26
The SMERU Research Institute Telephone: +62 21 3193 6336 Fax : +62 21 3193 0850 E-mail : [email protected] Website : www. smeru.or.id
ISBN: 978 – 602 – 7901 – 01 - 8