Embed Size (px)
Citation preview
The crude downturn for exploration & production companies One situation, diverse responses
Contents
Introduction ..................................................................... 1
Five options
Submit .............................................................................2
Borrow .............................................................................4
Venture ............................................................................8
Adjust ............................................................................10
Optimize ........................................................................14
Takeaways ...................................................................... 16
Let’s talk ......................................................................... 17
Research methodology
The study period for our analysis is the past 15-18 months of low and falling oil prices (July 1, 2014, to September 30, 2015, where the financials or operational data of companies is used; July 1, 2014, to December 31, 2015, where the market data is used). The sample set of our analysis is pure-play exploration & production (E&P) companies (i.e., excluding integrated oil majors and national oil companies); refer to each set of options for more details. The second quarter of 2014, April to June, a period before the oil price crash, is used as a base period for doing comparisons or showing the changes made by companies over the past 15-18 months.
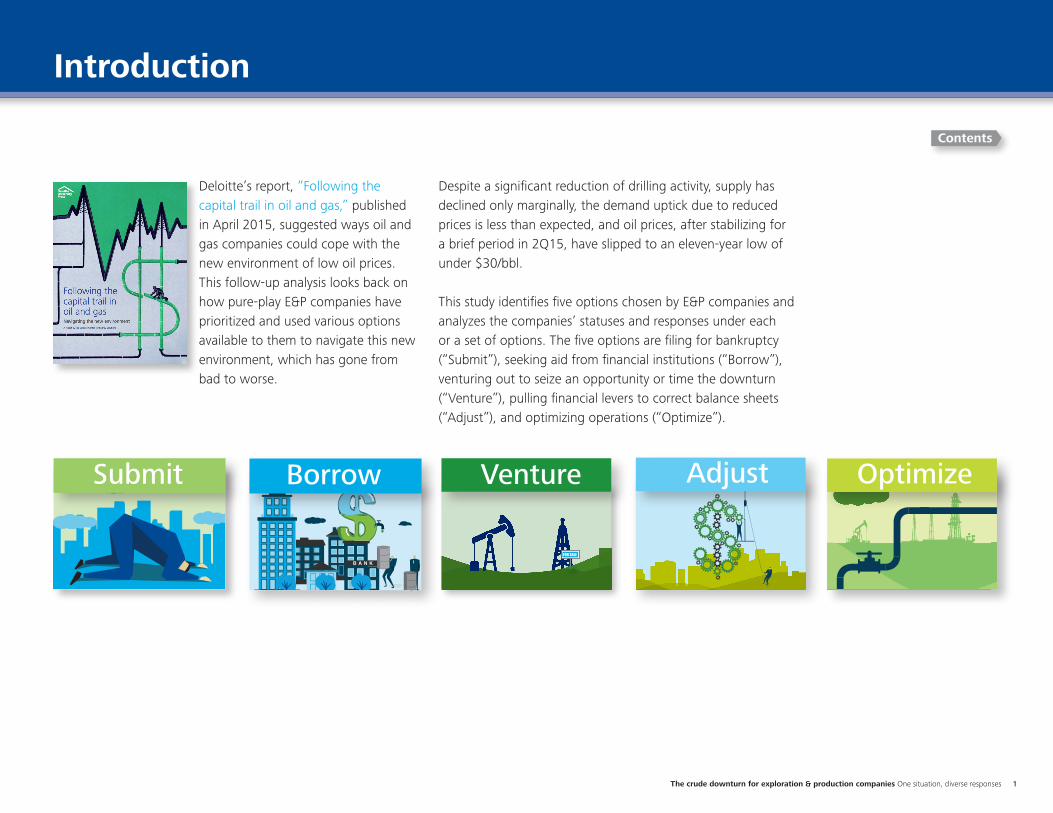
Deloitte’s report, “Following the capital trail in oil and gas,” published in April 2015, suggested ways oil and gas companies could cope with the new environment of low oil prices. This follow-up analysis looks back on how pure-play E&P companies have prioritized and used various options available to them to navigate this new environment, which has gone from bad to worse.
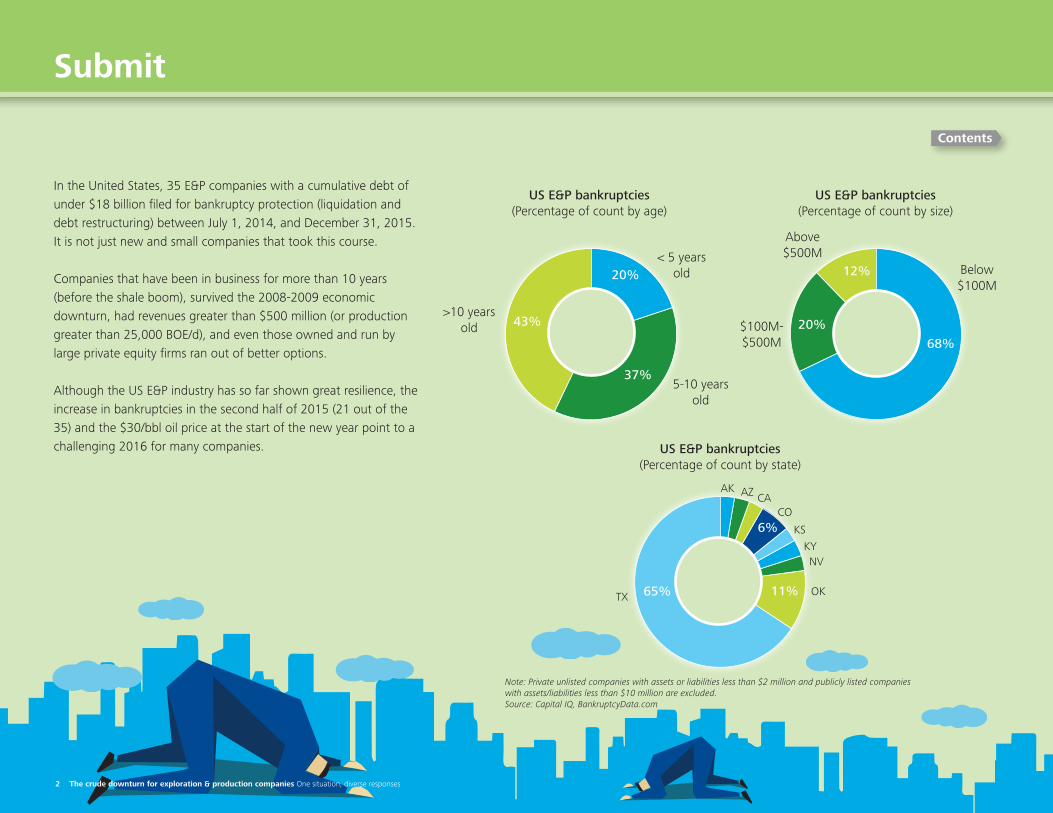
US E&P bankruptcies(% of count by age)
US E&P bankruptcies(% of count by state)
US E&P bankruptcies(% of count by size)
In the United States, 35 E&P companies with a cumulative debt of under $18 billion filed for bankruptcy protection (liquidation and debt restructuring) between July 1, 2014, and December 31, 2015. It is not just new and small companies that took this course.
Companies that have been in the business for more than 10 years (before the shale boom) or survived the 2008-2009 economic downturn had revenues greater than $500 million (or production greater than 25,000 BOE/d), and even those owned and run by large private equity firms ran out of better options.
Although the US E&P industry has so far shown great resilience, the increase in bankruptcies in the second half of 2015 (21 out of the 35) and the $30/bbl oil price at the start of the new year point to a challenging 2016 for many companies.
Note: Private unlisted companies with assets or liabilities less than $2 million and publicly listed companies with assets/liabilities less than $10 million are excluded.Source: Capital IQ, BankruptcyData.com
20%
68%
12%
20%
37%
>5 years old Below
$100M
$100M- $500M
Above $500M
5-10 years old
>10 years old 43%
6%
11%65%
AK AZ CACO
KSKYNV
OKTX
Submit
Contents
Submit Borrow Adjust
Optimize
US E&P players have reduced their production costs (lease operating expenses and production taxes) significantly, especially starting in 2015. Now, about 95 percent of 11.25 MMBOE/d production of US-origin players operate below $15/BOE, versus 65 percent in 2Q14.
By mapping productivity, production, and costs together, it appears higher well productivity was the dominant driver in reducing industry costs per BOE in 2H14 (a period of increased production), followed by switching from marginal to core fields in late 2014 and early 2015 (flat production growth). Cost reduction programs then started to make a visible impact in mid to late 2015 (lower shale break-evens).
Source: Factset, Bloomberg, Company Filings, and Deloitte Market Insights
Production split by production cost per BOE (2Q14-3Q15, US E&P companies)
100%
80%
60%
40%
20%
10%
0%
$0-5 $15-20$5-10 $10-15 $20-25 Above 25
2Q14 3Q14 4Q14 1Q15 2Q15 3Q15
14 The crude downturn for exploration & production companies One situation, diverse responses
Perc
enta
ge o
f to
tal p
rodu
ctio
n
Production cost ($BOE)
Contents
Optimize
Introduction
The crude downturn for exploration & production companies One situation, diverse responses 1
Contents
Despite a significant reduction of drilling activity, supply has declined only marginally, the demand uptick due to reduced prices is less than expected, and oil prices, after stabilizing for a brief period in 2Q15, have slipped to an eleven-year low of under $30/bbl.
This study identifies five options chosen by E&P companies and analyzes the companies’ statuses and responses under each or a set of options. The five options are filing for bankruptcy (“Submit”), seeking aid from financial institutions (“Borrow”), venturing out to seize an opportunity or time the downturn (“Venture”), pulling financial levers to correct balance sheets (“Adjust”), and optimizing operations (“Optimize”).
Venture
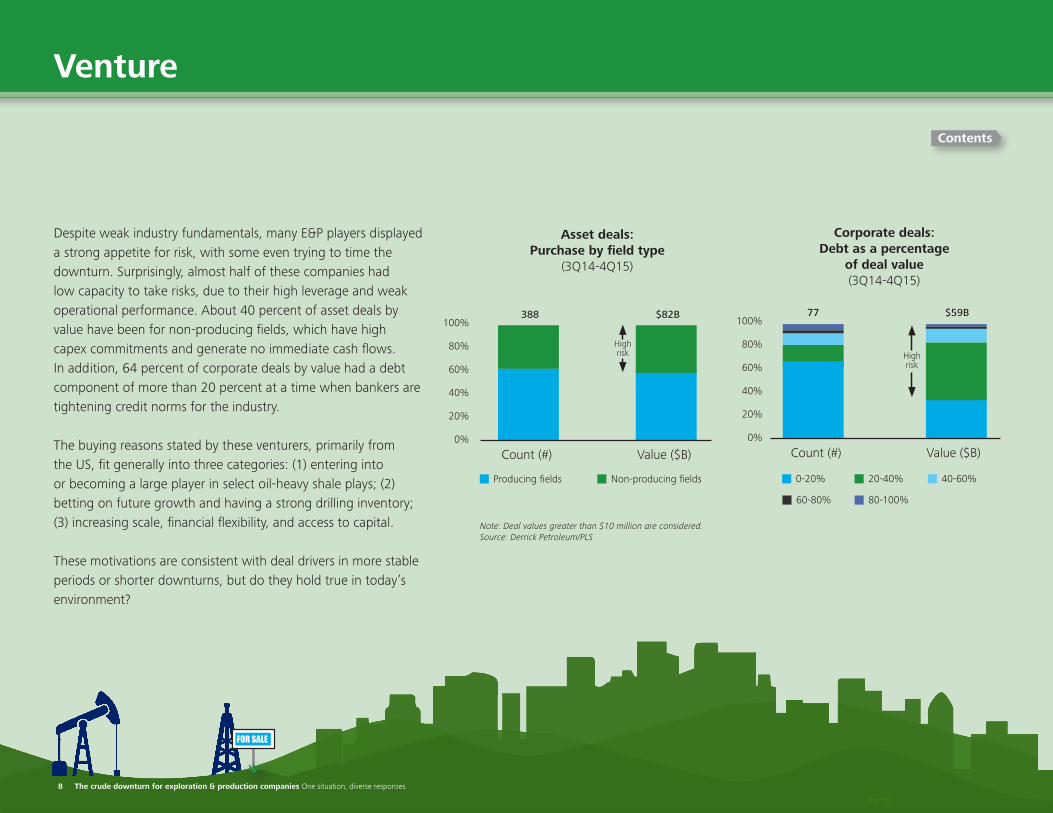
Despite weak industry fundamentals, many E&P players displayed a strong appetite for risk, with some even trying to time the downturn. Surprisingly, almost half of these companies had low capacity to take risks, due to their high leverage and weak operational performance. About 40 percent of asset deals by value have been for non-producing fields, which have high capex commitments and generate no immediate cash flows. In addition, 64 percent of corporate deals by value had a debt component of more than 20 percent at a time when bankers are tightening credit norms for the industry.
The buying reasons stated by these venturers, primarily from the US, fit generally into three categories: (1) entering into or becoming a large player in select oil-heavy shale plays; (2) betting on future growth and having a strong drilling inventory; (3) increasing scale, financial flexibility, and access to capital.
These motivations are consistent with deal drivers in more stable periods or shorter downturns, but do they hold true in today’s environment?
Note: Deal values greater than $10 million are considered. Source: Derrick Petroleum/PLS
Asset deals: Purchase by field type(3Q14-4Q15)
Count (#)
388 $82B
Value ($B)
Producing fields Non-producing fields
High risk
100%
80%
60%
40%
20%
0%
Corporate deals: Debt as a % of deal value
(3Q14-4Q15)
Count (#)
77 $59B
Value ($B)
0-20% 20-40% 40-60%
60-80% 80-100%
High risk
100%
80%
60%
40%
20%
0%
FOR SALE
Contents
Venture
US E&P bankruptcies(Percentage of count by age)
US E&P bankruptcies(Percentage of count by state)
US E&P bankruptcies(Percentage of count by size)
In the United States, 35 E&P companies with a cumulative debt of under $18 billion filed for bankruptcy protection (liquidation and debt restructuring) between July 1, 2014, and December 31, 2015. It is not just new and small companies that took this course.
Companies that have been in business for more than 10 years (before the shale boom), survived the 2008-2009 economic downturn, had revenues greater than $500 million (or production greater than 25,000 BOE/d), and even those owned and run by large private equity firms ran out of better options.
Although the US E&P industry has so far shown great resilience, the increase in bankruptcies in the second half of 2015 (21 out of the 35) and the $30/bbl oil price at the start of the new year point to achallenging 2016 for many companies.
Note: Private unlisted companies with assets or liabilities less than $2 million and publicly listed companies with assets/liabilities less than $10 million are excluded.Source: Capital IQ, BankruptcyData.com
20%
68%
12%
20%
37%
< 5 years old Below
$100M
$100M- $500M
Above $500M
5-10 years old
>10 years old 43%
6%
11%65%
AK AZ CACO
KSKYNV
OKTX
Submit
Contents
2 The crude downturn for exploration & production companies One situation, diverse responses
Chapter 7 (liquidation) Chapter 11 (debt restructuring)
The Great Recession(2008-2009)
Current downturn(2014-2015)
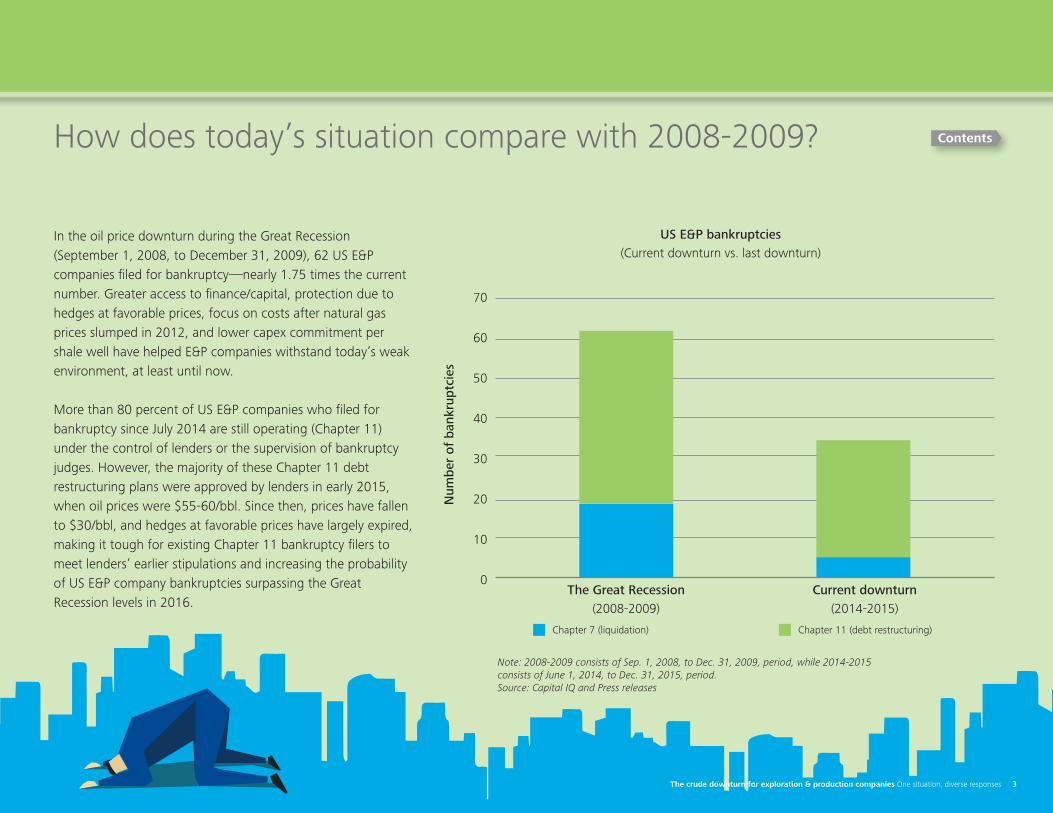
How does today’s situation compare with 2008-2009?
In the oil price downturn during the Great Recession (September 1, 2008, to December 31, 2009), 62 US E&P companies filed for bankruptcy—nearly 1.75 times the current number. Greater access to finance/capital, protection due to hedges at favorable prices, focus on costs after natural gas prices slumped in 2012, and lower capex commitment per shale well have helped E&P companies withstand today’s weak environment, at least until now.
More than 80 percent of US E&P companies who filed for bankruptcy since July 2014 are still operating (Chapter 11) under the control of lenders or the supervision of bankruptcy judges. However, the majority of these Chapter 11 debt restructuring plans were approved by lenders in early 2015, when oil prices were $55-60/bbl. Since then, prices have fallen to $30/bbl, and hedges at favorable prices have largely expired, making it tough for existing Chapter 11 bankruptcy filers to meet lenders’ earlier stipulations and increasing the probability of US E&P company bankruptcies surpassing the Great Recession levels in 2016.
Note: 2008-2009 consists of Sep. 1, 2008, to Dec. 31, 2009, period, while 2014-2015 consists of June 1, 2014, to Dec. 31, 2015, period.Source: Capital IQ and Press releases
US E&P bankruptcies(Current downturn vs. last downturn)
Num
ber
of b
ankr
uptc
ies
70
60
50
40
30
20
10
0
The crude downturn for exploration & production companies One situation, diverse responses 3
Contents
Borrow
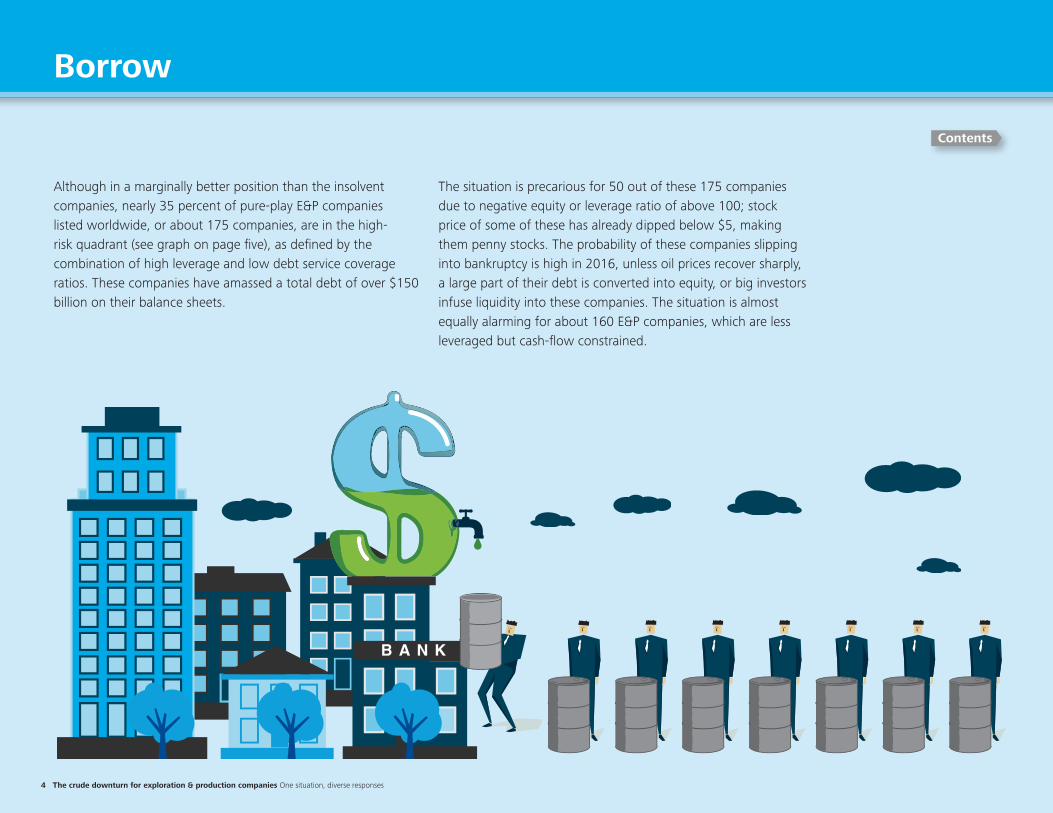
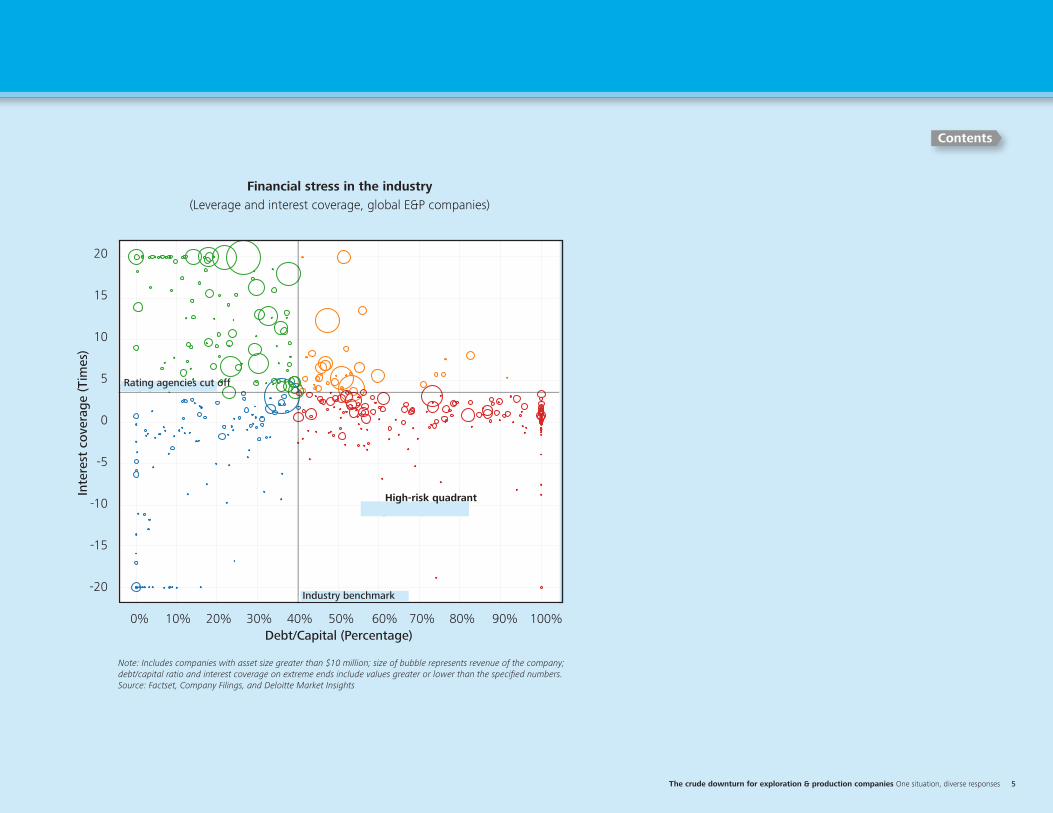
Although in a marginally better position than the insolvent companies, nearly 35 percent of pure-play E&P companies listed worldwide, or about 175 companies, are in the high-risk quadrant (see graph on page five), as defined by the combination of high leverage and low debt service coverage ratios. These companies have amassed a total debt of over $150 billion on their balance sheets.
4 The crude downturn for exploration & production companies One situation, diverse responses
The situation is precarious for 50 out of these 175 companies due to negative equity or leverage ratio of above 100; stock price of some of these has already dipped below $5, making them penny stocks. The probability of these companies slipping into bankruptcy is high in 2016, unless oil prices recover sharply, a large part of their debt is converted into equity, or big investors infuse liquidity into these companies. The situation is almost equally alarming for about 160 E&P companies, which are less leveraged but cash-flow constrained.
Contents
20
15
10
5
0
-5
-10
-15
-20
Financial stress in the industry (Leverage and interest coverage, global E&P companies)
Inte
rest
cov
erag
e (T
imes
)
Debt/Capital (Percentage)
Note: Includes companies with asset size greater than $10 million; size of bubble represents revenue of the company; debt/capital ratio and interest coverage on extreme ends include values greater or lower than the specified numbers. Source: Factset, Company Filings, and Deloitte Market Insights
The crude downturn for exploration & production companies One situation, diverse responses 5
Contents
0% 10% 20% 30% 40% 50% 60% 70% 80% 90% 100%Debt/Capital (%)
-20
-15
-10
-5
0
5
10
15
20
Inte
rest
Cov
erag
e(ti
mes
)
Industry benchmark
Rating agencies cut off
High-risk quadrant
0% 10% 20% 30% 40% 50% 60% 70% 80% 90% 100%
Rating agencies cut off
High-risk quadrant
Industry benchmark
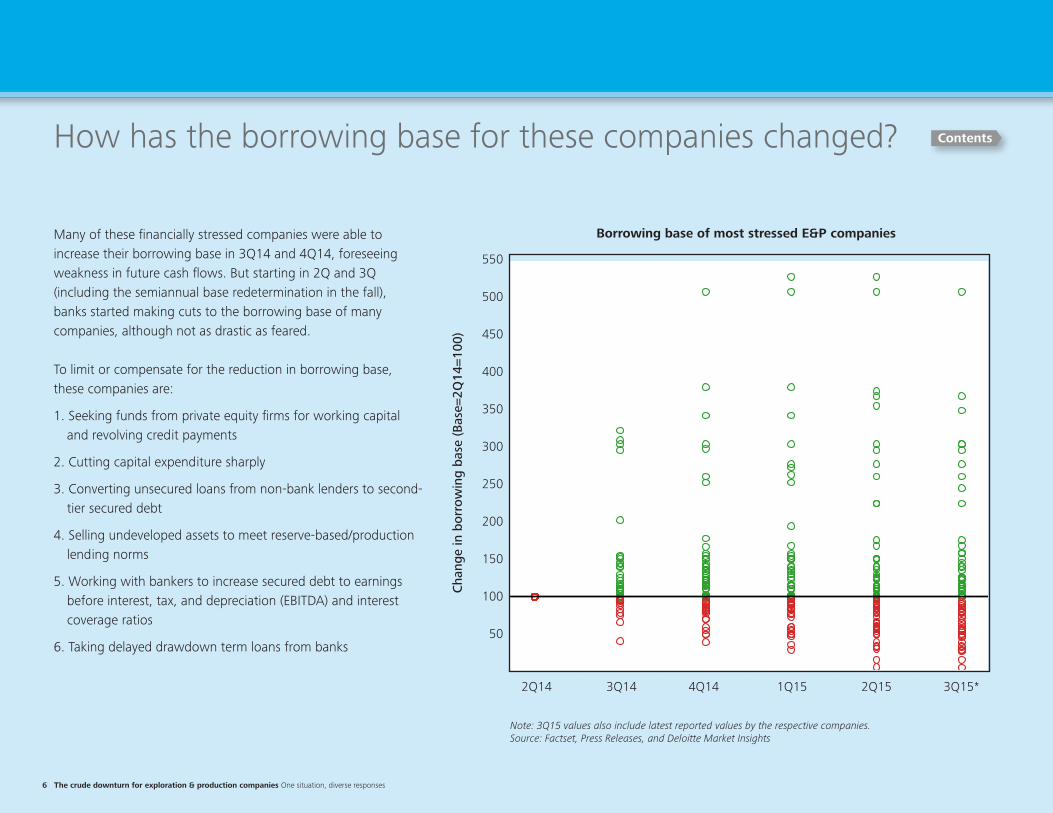
How has the borrowing base for these companies changed?
Many of these financially stressed companies were able to increase their borrowing base in 3Q14 and 4Q14, foreseeing weakness in future cash flows. But starting in 2Q and 3Q (including the semiannual base redetermination in the fall), banks started making cuts to the borrowing base of many companies, although not as drastic as feared.
To limit or compensate for the reduction in borrowing base, these companies are:
1. Seeking funds from private equity firms for working capitaland revolving credit payments
2. Cutting capital expenditure sharply
3. Converting unsecured loans from non-bank lenders to second-tier secured debt
4. Selling undeveloped assets to meet reserve-based/productionlending norms
5. Working with bankers to increase secured debt to earningsbefore interest, tax, and depreciation (EBITDA) and interestcoverage ratios
6. Taking delayed drawdown term loans from banks
Borrowing base of most stressed E&P companies
550
500
450
400
350
300
250
200
150
100
50
Cha
nge
in b
orro
win
g ba
se (B
ase=
2Q14
=100
)
Note: 3Q15 values also include latest reported values by the respective companies.Source: Factset, Press Releases, and Deloitte Market Insights
2Q14 3Q14 4Q14 1Q15 2Q15 3Q15*
6 The crude downturn for exploration & production companies One situation, diverse responses
Contents
2Q14 3Q14 4Q14 1Q15 2Q15 3Q15*
50
100
150
200
250
300
350
400
450
500
550
Cha
nge
inB
orro
win
gB
ase
(Bas
e=2Q
14=1
00)
How does credit line support look in 2016?
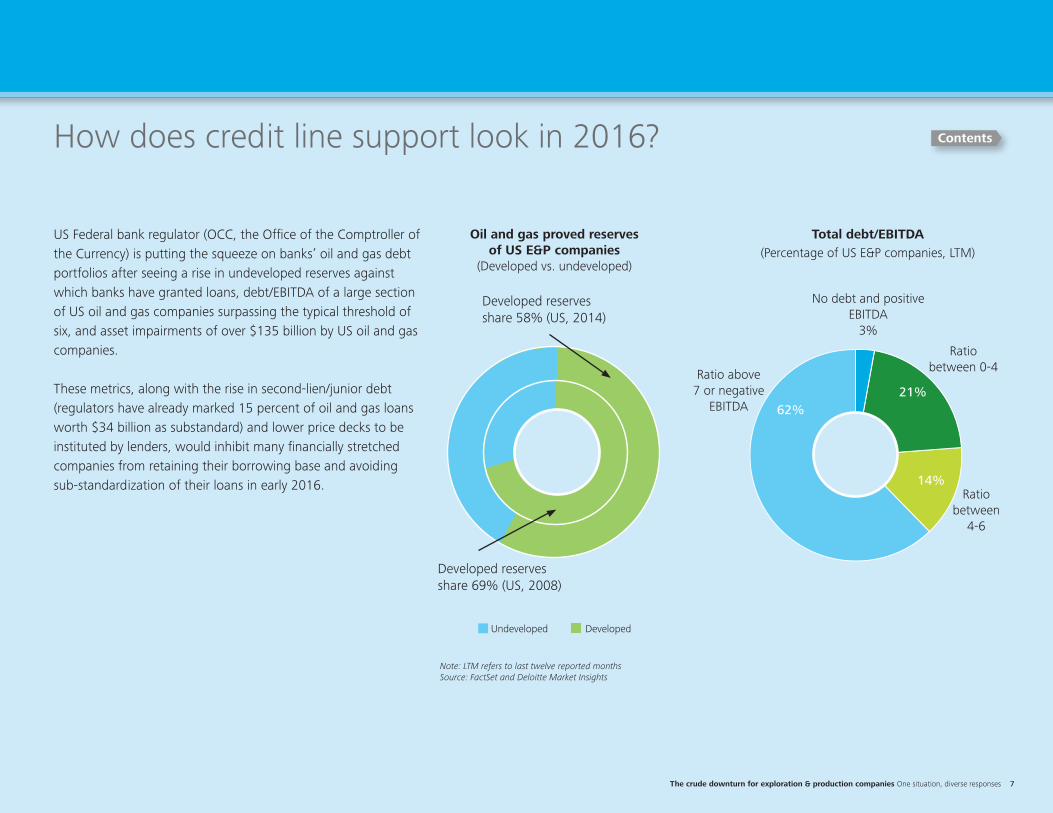
US Federal bank regulator (OCC, the Office of the Comptroller of the Currency) is putting the squeeze on banks’ oil and gas debt portfolios after seeing a rise in undeveloped reserves against which banks have granted loans, debt/EBITDA of a large section of US oil and gas companies surpassing the typical threshold of six, and asset impairments of over $135 billion by US oil and gas companies.
These metrics, along with the rise in second-lien/junior debt (regulators have already marked 15 percent of oil and gas loans worth $34 billion as substandard) and lower price decks to be instituted by lenders, would inhibit many financially stretched companies from retaining their borrowing base and avoiding sub-standardization of their loans in early 2016.
Note: LTM refers to last twelve reported monthsSource: FactSet and Deloitte Market Insights
Oil and gas proved reserves of US E&P companies
(Developed vs. undeveloped)
Total debt/EBITDA (Percentage of US E&P companies, LTM)
21%
14%
62%
Ratio between 0-4
Ratio between
4-6
Ratio above 7 or negative
EBITDA
No debt and positive EBITDA
3%
Developed reserves share 58% (US, 2014)
Developed reserves share 69% (US, 2008)
Undeveloped Developed
The crude downturn for exploration & production companies One situation, diverse responses 7
Contents
Venture
Despite weak industry fundamentals, many E&P players displayed a strong appetite for risk, with some even trying to time the downturn. Surprisingly, almost half of these companies had low capacity to take risks, due to their high leverage and weak operational performance. About 40 percent of asset deals by value have been for non-producing fields, which have high capex commitments and generate no immediate cash flows. In addition, 64 percent of corporate deals by value had a debt component of more than 20 percent at a time when bankers are tightening credit norms for the industry.
The buying reasons stated by these venturers, primarily from the US, fit generally into three categories: (1) entering into or becoming a large player in select oil-heavy shale plays; (2) betting on future growth and having a strong drilling inventory; (3) increasing scale, financial flexibility, and access to capital.
These motivations are consistent with deal drivers in more stable periods or shorter downturns, but do they hold true in today’s environment?
Note: Deal values greater than $10 million are considered. Source: Derrick Petroleum/PLS
Asset deals: Purchase by field type
(3Q14-4Q15)
Count (#)
388 $82B
Value ($B)
Producing fields Non-producing fields
High risk
100%
80%
60%
40%
20%
0%
Corporate deals: Debt as a percentage
of deal value (3Q14-4Q15)
Count (#)
77 $59B
Value ($B)
0-20% 20-40% 40-60%
60-80% 80-100%
High risk
100%
80%
60%
40%
20%
0%
FOR SALE
Contents
8 The crude downturn for exploration & production companies One situation, diverse responses
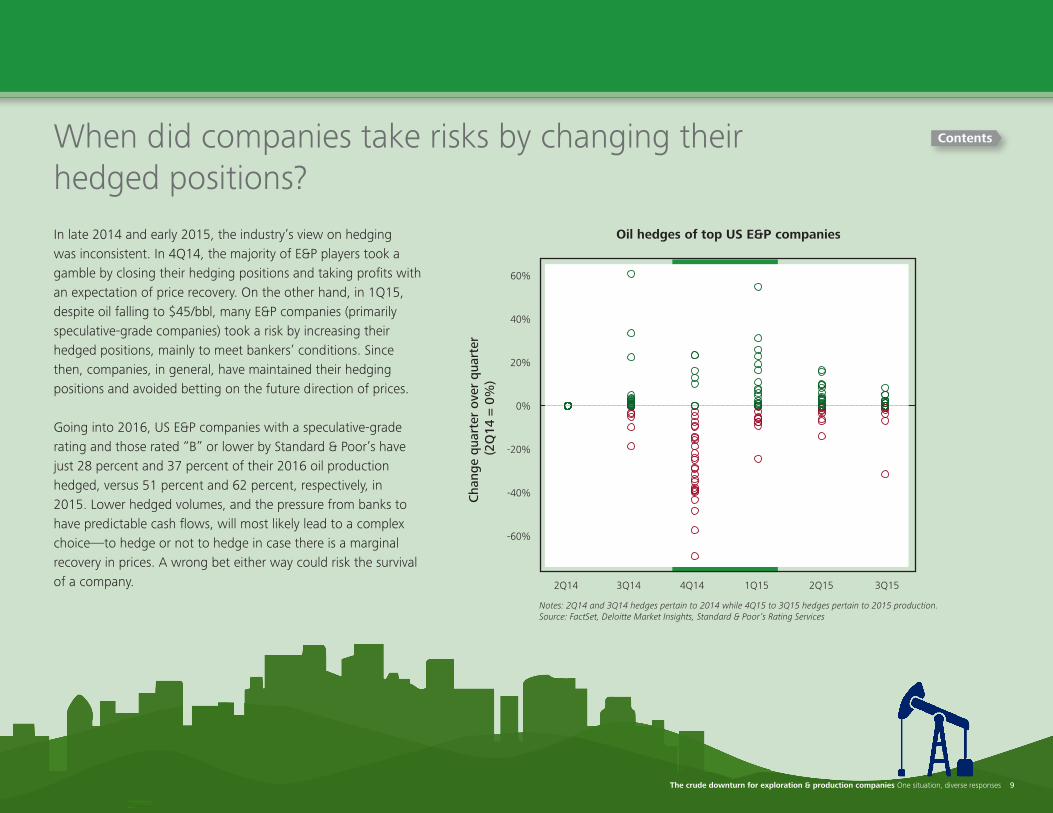
When did companies take risks by changing their hedged positions?
In late 2014 and early 2015, the industry’s view on hedging was inconsistent. In 4Q14, the majority of E&P players took a gamble by closing their hedging positions and taking profits with an expectation of price recovery. On the other hand, in 1Q15, despite oil falling to $45/bbl, many E&P companies (primarily speculative-grade companies) took a risk by increasing their hedged positions, mainly to meet bankers’ conditions. Since then, companies, in general, have maintained their hedging positions and avoided betting on the future direction of prices.
Going into 2016, US E&P companies with a speculative-grade rating and those rated “B” or lower by Standard & Poor’s have just 28 percent and 37 percent of their 2016 oil production hedged, versus 51 percent and 62 percent, respectively, in 2015. Lower hedged volumes, and the pressure from banks to have predictable cash flows, will most likely lead to a complex choice—to hedge or not to hedge in case there is a marginal recovery in prices. A wrong bet either way could risk the survival of a company.
Oil hedges of top US E&P companies
Notes: 2Q14 and 3Q14 hedges pertain to 2014 while 4Q15 to 3Q15 hedges pertain to 2015 production.Source: FactSet, Deloitte Market Insights, Standard & Poor’s Rating Services
Cha
nge
quar
ter
over
qua
rter
(2
Q14
= 0
%)
60%
40%
20%
0%
-20%
-40%
-60%
2Q14 3Q14 4Q14 1Q15 2Q15 3Q15
The crude downturn for exploration & production companies One situation, diverse responses 9
Contents
2Q14 3Q14 4Q14 1Q15 2Q15 3Q15
-70%
-60%
-50%
-40%
-30%
-20%
-10%
0%
10%
20%
30%
40%
50%
60%
Cha
nge
quar
tero
verq
uart
er(2
Q14
=100
%)
With high leverage levels and negative cash flows, E&P companies worldwide are making financial adjustments. Since 2Q14, E&P companies have saved or raised cash to the tune of $130 billion from capex cuts and other financial measures, such as asset sales, equity issuance, and lower shareholder distribution.
Surprisingly, two-thirds of savings have come from non-capex financial measures; significant capex cuts only started in 2Q15. As for non-capex measures, E&P companies have prioritized issuing equity and asset sales over reducing shareholder payouts.
10 The crude downturn for exploration & production companies One situation, diverse responses
Adjust
Contents
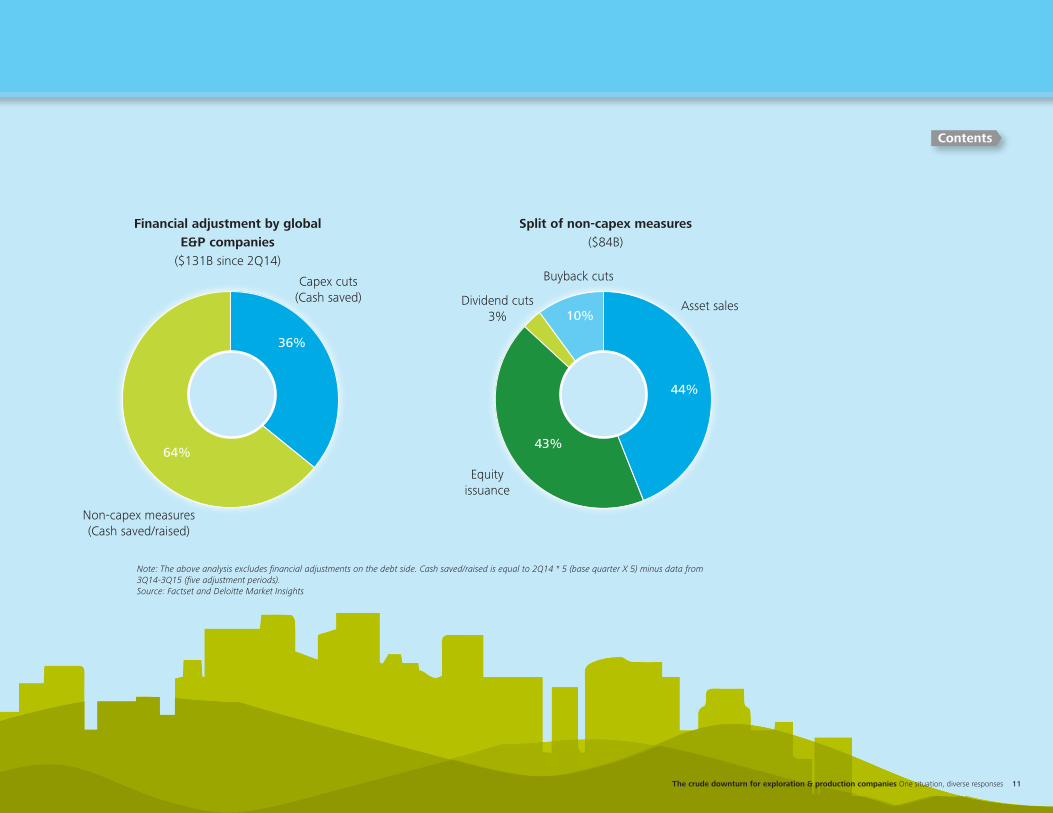
Split of non-capex measures($84B)
Financial adjustment by global E&P companies
($131B since 2Q14)
44%
43%
10%Asset sales
Capex cuts(Cash saved)
Non-capex measures(Cash saved/raised)
Buyback cuts
Equity issuance
Dividend cuts3%
36%
64%
Note: The above analysis excludes financial adjustments on the debt side. Cash saved/raised is equal to 2Q14 * 5 (base quarter X 5) minus data from 3Q14-3Q15 (five adjustment periods).Source: Factset and Deloitte Market Insights
The crude downturn for exploration & production companies One situation, diverse responses 11
Contents
Who adjusted what, and by how much?
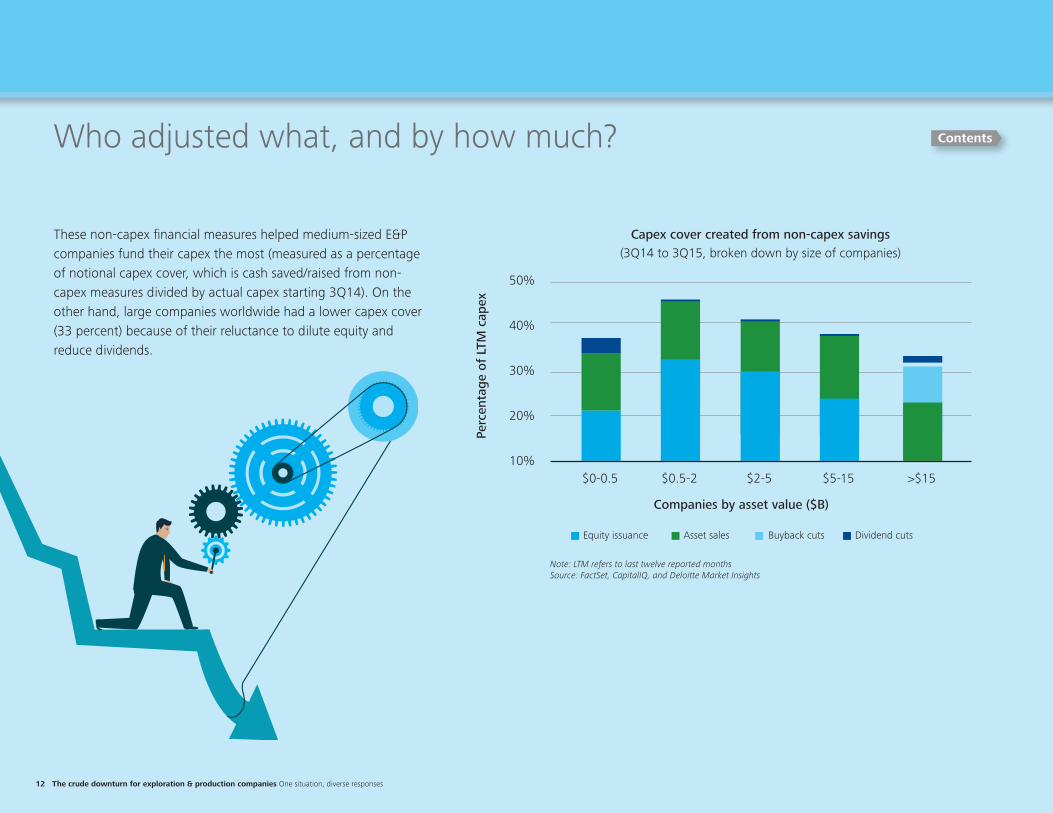
These non-capex financial measures helped medium-sized E&P companies fund their capex the most (measured as a percentage of notional capex cover, which is cash saved/raised from non-capex measures divided by actual capex starting 3Q14). On the other hand, large companies worldwide had a lower capex cover (33 percent) because of their reluctance to dilute equity and reduce dividends.
Note: LTM refers to last twelve reported monthsSource: FactSet, CapitalIQ, and Deloitte Market Insights
Capex cover created from non-capex savings(3Q14 to 3Q15, broken down by size of companies)
Perc
enta
ge o
f LT
M c
apex
50%
40%
30%
20%
10%
Equity issuance Asset sales Buyback cuts Dividend cuts
$0-0.5 $0.5-2
Companies by asset value ($B)
$2-5 $5-15 >$15
12 The crude downturn for exploration & production companies One situation, diverse responses
Contents
What more can they do?
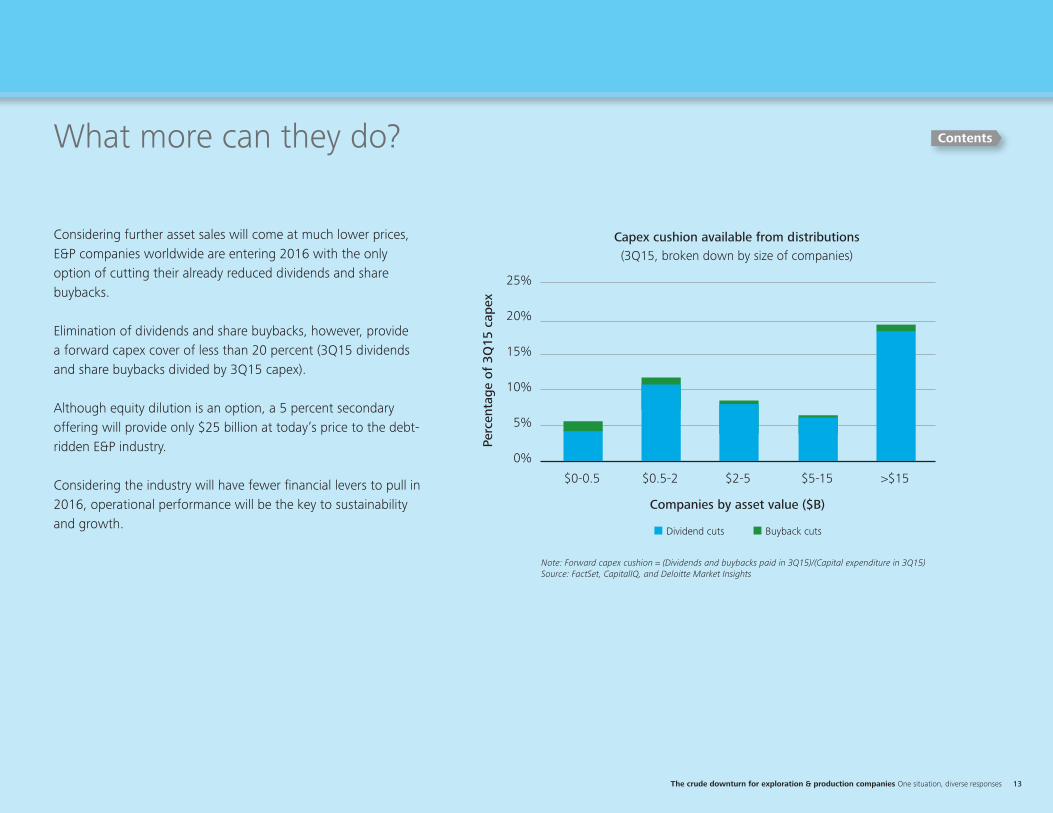
Considering further asset sales will come at much lower prices, E&P companies worldwide are entering 2016 with the only option of cutting their already reduced dividends and share buybacks.
Elimination of dividends and share buybacks, however, provide a forward capex cover of less than 20 percent (3Q15 dividends and share buybacks divided by 3Q15 capex).
Although equity dilution is an option, a 5 percent secondary offering will provide only $25 billion at today’s price to the debt-ridden E&P industry.
Considering the industry will have fewer financial levers to pull in 2016, operational performance will be the key to sustainability and growth.
Note: Forward capex cushion = (Dividends and buybacks paid in 3Q15)/(Capital expenditure in 3Q15)Source: FactSet, CapitalIQ, and Deloitte Market Insights
Capex cushion available from distributions(3Q15, broken down by size of companies)
25%
20%
15%
10%
5%
0%
Dividend cuts Buyback cuts
$0-0.5 $0.5-2 $2-5 $5-15 >$15
Companies by asset value ($B)Pe
rcen
tage
of
3Q15
cap
ex
The crude downturn for exploration & production companies One situation, diverse responses 13
Contents
Optimize
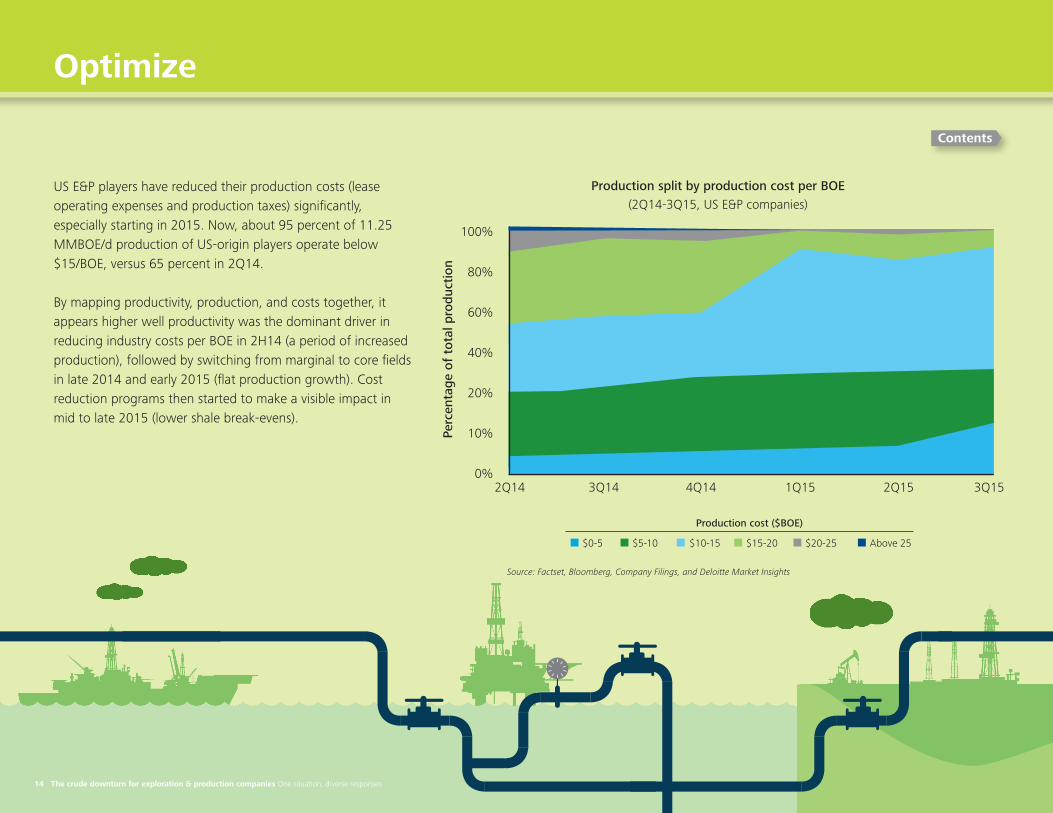
US E&P players have reduced their production costs (lease operating expenses and production taxes) significantly, especially starting in 2015. Now, about 95 percent of 11.25 MMBOE/d production of US-origin players operate below $15/BOE, versus 65 percent in 2Q14.
By mapping productivity, production, and costs together, it appears higher well productivity was the dominant driver in reducing industry costs per BOE in 2H14 (a period of increased production), followed by switching from marginal to core fields in late 2014 and early 2015 (flat production growth). Cost reduction programs then started to make a visible impact in mid to late 2015 (lower shale break-evens).
Source: Factset, Bloomberg, Company Filings, and Deloitte Market Insights
100%
80%
60%
40%
20%
10%
0%
$0-5 $15-20$5-10 $10-15 $20-25 Above 25
2Q14 3Q14 4Q14 1Q15 2Q15 3Q15
14 The crude downturn for exploration & production companies One situation, diverse responses
Perc
enta
ge o
f to
tal p
rodu
ctio
n
Production cost ($BOE)
Contents
Production split by production cost per BOE (2Q14-3Q15, US E&P companies)
Who optimized the most by fuel and size?
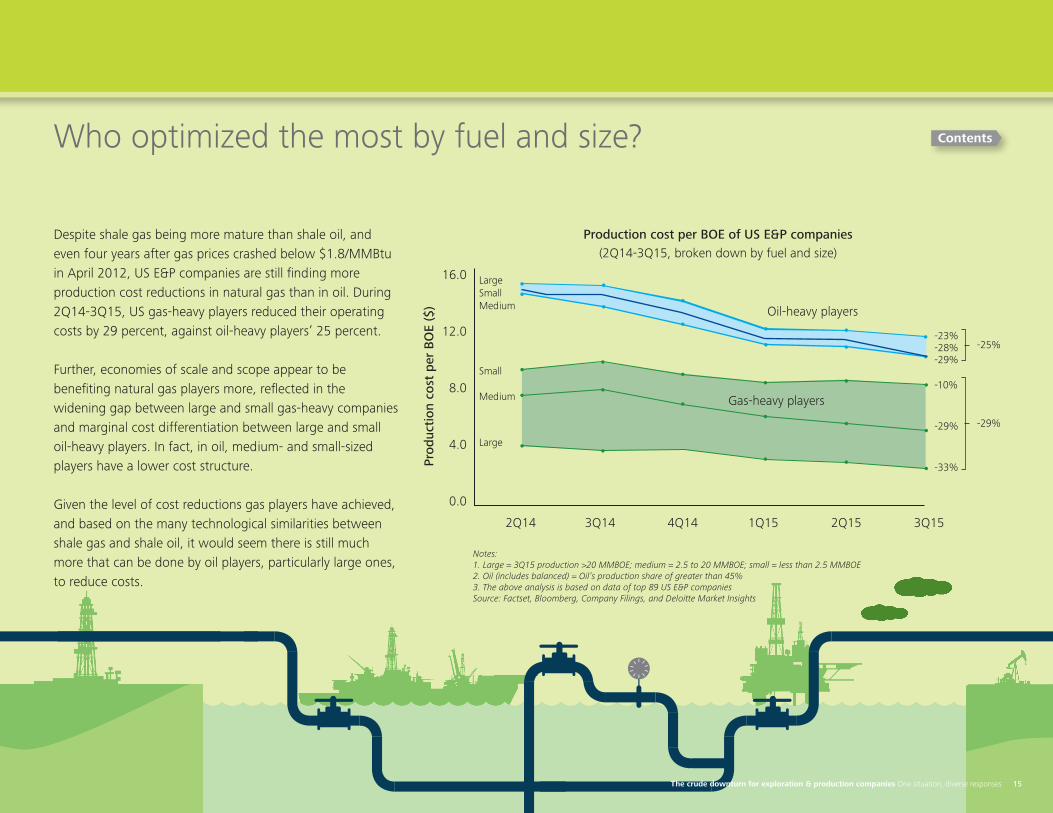
Despite shale gas being more mature than shale oil, and even four years after gas prices crashed below $1.8/MMBtu in April 2012, US E&P companies are still finding more production cost reductions in natural gas than in oil. During 2Q14-3Q15, US gas-heavy players reduced their operating costs by 29 percent, against oil-heavy players’ 25 percent.
Further, economies of scale and scope appear to be benefiting natural gas players more, reflected in the widening gap between large and small gas-heavy companies and marginal cost differentiation between large and small oil-heavy players. In fact, in oil, medium- and small-sized players have a lower cost structure.
Given the level of cost reductions gas players have achieved, and based on the many technological similarities between shale gas and shale oil, it would seem there is still much more that can be done by oil players, particularly large ones, to reduce costs.
Production cost per BOE of US E&P companies (2Q14-3Q15, broken down by fuel and size)
Prod
ucti
on c
ost
per
BO
E ($
)
Notes: 1. Large = 3Q15 production >20 MMBOE; medium = 2.5 to 20 MMBOE; small = less than 2.5 MMBOE2. Oil (includes balanced) = Oil’s production share of greater than 45%3. The above analysis is based on data of top 89 US E&P companiesSource: Factset, Bloomberg, Company Filings, and Deloitte Market Insights
2Q14
Gas-heavy players
Oil-heavy players
3Q14 4Q14
LargeSmall Medium
Small Medium
Large
-23%-28%-29%
-10%
-29%
-33%
-25%
-29%
1Q15 2Q15 3Q15
16.0
12.0
8.0
4.0
0.0
Contents
The crude downturn for exploration & production companies One situation, diverse responses 15
Takeaways
Even after 18 months of falling oil prices, pessimism has not bottomed out in the oil and gas industry. In fact, the most optimistic forecast does not expect a recovery in prices or a significant change in market sentiment before late 2016. More than two years of low and depressed prices will not only increase the stress and further fragment the response of players in 2016, but also raise several questions for the industry.
1. Access to capital markets, bankers’ support, and derivatives protection, which helped to smooth an otherwise rocky road for the industry in 2015, are fast waning. A looming capital crunch and heightened cash flow volatility suggest 2016 will be a period of tough, new financial choices for the industry.
2. Spending cuts for two consecutive years (for the first time since the mid-1980s the industry will reduce capex for two years in a row—2015 and 2016) will likely have a substantial and long-lasting impact on future supplies and open new chapters in the geopolitics of oil. These cuts risk slowing the conversion of resources to reserves in frontier locations and eating into the capex required to maintain aging fields and facilities.
3. Future mergers and acquisitions will most likely go beyond the typical buying reasons of the past—preference for oil-heavy assets and buying for growth/scale. In the near future, returns and economies of scope will likely re-emerge as the top reasons for buying assets/companies, instead of growth and economies of scale.
4. The focus on lowering breakeven costs to support near-term cash flows could give way to a renewed focus on bolstering the future ROCE (return on capital employed) potential of the industry. As the industry improves performance on costs/efficiency, its future emphasis will not be on its ability to make profits at low prices, but about generating sufficient ROCE on a large base of devalued investments made in the past.
16 The crude downturn for exploration & production companies One situation, diverse responses
Contents

Key contributors
John EnglandUS and Americas Oil & Gas LeaderDeloitte [email protected]+1 713 982 2556@JohnWEngland
Andrew SlaughterExecutive Director, Deloitte Center for Energy SolutionsDeloitte Services [email protected]+1 713 982 3526
Vivek Bansal, Analyst, Market Insights, Deloitte Support Services India Pvt. Ltd.
Gregory Bean, Director, Deloitte Consulting LLP
Ashish Kumar, Senior Analyst, Market Insights, Deloitte Support Services India Pvt. Ltd.
John Little, Principal, Deloitte Transactions and Business Analytics LLP
Deepak Vasantlal Shah, Senior Analyst, Market Insights, Deloitte Support Services India Pvt. Ltd.
Anshu MittalExecutive Manager, Market InsightsDeloitte Support Services India Pvt. Ltd.
The crude downturn for exploration & production companies One situation, diverse responses 17
Let’s talk.
Contents
About DeloitteDeloitte refers to one or more of Deloitte Touche Tohmatsu Limited, a UK private company limited by guarantee(“DTTL”), its network of member firms, and their related entities. DTTL and each of its member firms are legally separateand independent entities. DTTL (also referred to as “Deloitte Global”) does not provide services to clients. Please seewww.deloitte.com/about for a detailed description of DTTL and its member firms. Please see www.deloitte.com/us/about for a detailed description of the legal structure of Deloitte LLP and its subsidiaries. Certain services may not beavailable to attest clients under the rules and regulations of public accounting.
Copyright © 2016 Deloitte Development LLC. All rights reserved.Member of Deloitte Touche Tohmatsu Limited
This publication contains general information only and is based on the experiences and research of Deloitte practitioners. Deloitte is not, by means of this publication, rendering business, financial, investment, or other professional advice or services. This publication is not a substitute for such professional advice or services, nor should it be used as a basis for any decision or action that may affect your business. Before making any decision or taking any action that may affect your business, you should consult a qualified professional advisor. Deloitte shall not be responsible for any loss sustained by any person who relies on this publication.
About the Deloitte Center for Energy SolutionsThe Deloitte Center for Energy Solutions (the “Center”) provides a forum for innovation, thought leadership, groundbreaking research, and industry collaboration to help companies solve the most complex energy challenges.
Through the Center, Deloitte’s Energy & Resources group leads the debate on critical topics on the minds of executives – from the impact of legislative and regulatory policy, to operational efficiency, to sustainable and profitable growth.We provide comprehensive solutions through a global network of specialists and thought leaders.
With locations in Houston and Washington, DC, the Center offers interaction through seminars, roundtables, and otherforms of engagement where established and growing companies can come together to learn, discuss, and debate.
www.deloitte.com/us/energysolutions
Marlene Motyka US Alternative Energy Leader Principal Deloitte Transactions and Business Analytics LLP [email protected] +1 973 602 5691
John McCue Vice Chairman, US Energy & Resources Leader Deloitte LLP [email protected] +1 216 830 6606 @JMcCue624
Acknowledgments
Special thanks to Suzanna Sanborn, senior manager, Market Insights and Julia Berg, operations analyst, Deloitte Center for Energy Solutions, for their valuable contributions to this report.
Contacts
Follow the Center on Twitter @Deloitte4Energy
About DeloitteDeloitte refers to one or more of Deloitte Touche Tohmatsu Limited, a UK private company limited by guarantee (“DTTL”), its network of member firms, and their related entities. DTTL and each of its member firms are legally separate and independent entities. DTTL (also referred to as “Deloitte Global”) does not provide services to clients. Please see www.deloitte.com/about for a detailed description of DTTL and its member firms. Please see www.deloitte.com/us/about for a detailed description of the legal structure of Deloitte LLP and its subsidiaries. Certain services may not beavailable to attest clients under the rules and regulations of public accounting.
Copyright © 2016 Deloitte Development LLC. All rights reserved.Member of Deloitte Touche Tohmatsu Limited
About DeloitteDeloitte refers to one or more of Deloitte Touche Tohmatsu Limited, a UK private company limited by guarantee(“DTTL”), its network of member firms, and their related entities. DTTL and each of its member firms are legally separateand independent entities. DTTL (also referred to as “Deloitte Global”) does not provide services to clients. Please seewww.deloitte.com/about for a detailed description of DTTL and its member firms. Please see www.deloitte.com/us/about for a detailed description of the legal structure of Deloitte LLP and its subsidiaries. Certain services may not beavailable to attest clients under the rules and regulations of public accounting.
Copyright © 2016 Deloitte Development LLC. All rights reserved.Member of Deloitte Touche Tohmatsu Limited
This publication contains general information only and is based on the experiences and research of Deloitte practitioners. Deloitte is not, by means of this publication, rendering business, financial, investment, or other professional advice or services. This publication is not a substitute for such professional advice or services, nor should it be used as a basis for any decision or action that may affect your business. Before making any decision or taking any action that may affect your business, you should consult a qualified professional advisor. Deloitte shall not be responsible for any loss sustained by any person who relies on this publication.
About the Deloitte Center for Energy SolutionsThe Deloitte Center for Energy Solutions (the “Center”) provides a forum for innovation, thought leadership, groundbreaking research, and industry collaboration to help companies solve the most complex energy challenges.
Through the Center, Deloitte’s Energy & Resources group leads the debate on critical topics on the minds of executives – from the impact of legislative and regulatory policy, to operational efficiency, to sustainable and profitable growth.We provide comprehensive solutions through a global network of specialists and thought leaders.
With locations in Houston and Washington, DC, the Center offers interaction through seminars, roundtables, and otherforms of engagement where established and growing companies can come together to learn, discuss, and debate.
www.deloitte.com/us/energysolutions
Marlene Motyka US Alternative Energy Leader Principal Deloitte Transactions and Business Analytics LLP [email protected] +1 973 602 5691
John McCue Vice Chairman, US Energy & Resources Leader Deloitte LLP [email protected] +1 216 830 6606 @JMcCue624
Acknowledgments
Special thanks to Suzanna Sanborn, senior manager, Market Insights and Julia Berg, operations analyst, Deloitte Center for Energy Solutions, for their valuable contributions to this report.
Contacts
Follow the Center on Twitter @Deloitte4Energy
This publication contains general information only and is based on the experiences and research of Deloitte practitioners. Deloitte is not, by means of this publication, rendering business, nancial, investment, or other professional advice or services. This publication is not a substitute for such professional advice or services, nor should it be used as a basis for any decision or action that may affect your business. Before making any decision or taking any action that may affect your business, you should consult a quali ed professional advisor. Deloitte, its af liates, and related entities shall not be responsible for any loss sustained by any person who relies on this publication.