Embed Size (px)
Citation preview
1
Beverley
District High School
2012012012012222
Annual Report
2
BEVERLEY DISTRICT HIGH SCHOOL
Beverley is a small to medium sized farming community situated approximately 130km east of Perth with a shire population of 1700. There is a gradual change in the demographics of the community as an increasing number of students live in the township. We have approximately a 52% - 48% split of students whose families are resident in town compared to farming families. 17% of families have been resident in Beverley for less than 5 years. Beverley has a Socio Economic Index (SEI) of 99.66. The Beverley District High School staff comprises 18 teachers, including specialists delivering programs in Italian, Home Economics, ICT, Metal Fabrication, Woodwork and Physical Education. We cater for 191students, with 177 from Kindergarten to Year 7 and 14 in the secondary Years 8-10. The teaching and non teaching staff work collaboratively in Developmental Learning Teams formed through the Early Childhood (K-3), Middle Childhood (4-7) and Early Adolescent (8-10) Phases of Learning. The school provides an inclusive and differentiated educational program catering for a broad spectrum of abilities, needs and interests and the social, cultural backgrounds of the students. A feature of this are the Talented and Gifted (TAGs), Students at Educational Risk (SAER) and Primary Extension and Challenge (PEAC) opportunities in the primary years, along with the academic, or vocational, pathways for secondary students. Teachers at Beverley District High School range in experience from Graduate teachers to Senior teachers, all of whom are committed, motivated and innovative educators. The camaraderie, friendship and collegiate nature of the staff make for a harmonious working environment. The staff work in a caring and supportive environment where their teaching and ongoing professional development are valued and appreciated. Our teachers are approachable and maintain open proactive communication in their relationships with students, parents and each other. Our facilities are excellent with well-appointed classrooms, separate library, science, home economics music and art rooms, all air-conditioned. Our grounds are very spacious with large reticulated grassed playing areas, two new playground structures and recently resurfaced basketball, netball and tennis courts. The School Council meets at least once each term and plays a pivotal role in the endorsement of the School Plan, policy formation and school accountability. The Parents and Citizens Association (P&C) meets twice each term and supports the school with a variety of fundraising ventures throughout the year. Their focus is on improving school facilities.
OUR VISION
In unity, nurturing learning and life for the future.
OUR VALUES
• Respect for self, others and the environment.
• Commitment to learning.
• Honesty and open communication.
• Confidence to tackle all challenges
• Resilience to cope with life situations.
3
ACADEMIC RESULTS 2012
2012 National Assessment Program in Literacy and Numeracy (NAPLAN)
Percentages for Year 3, 5, 7 and 9 students achieving above the minimum standard compared to the state
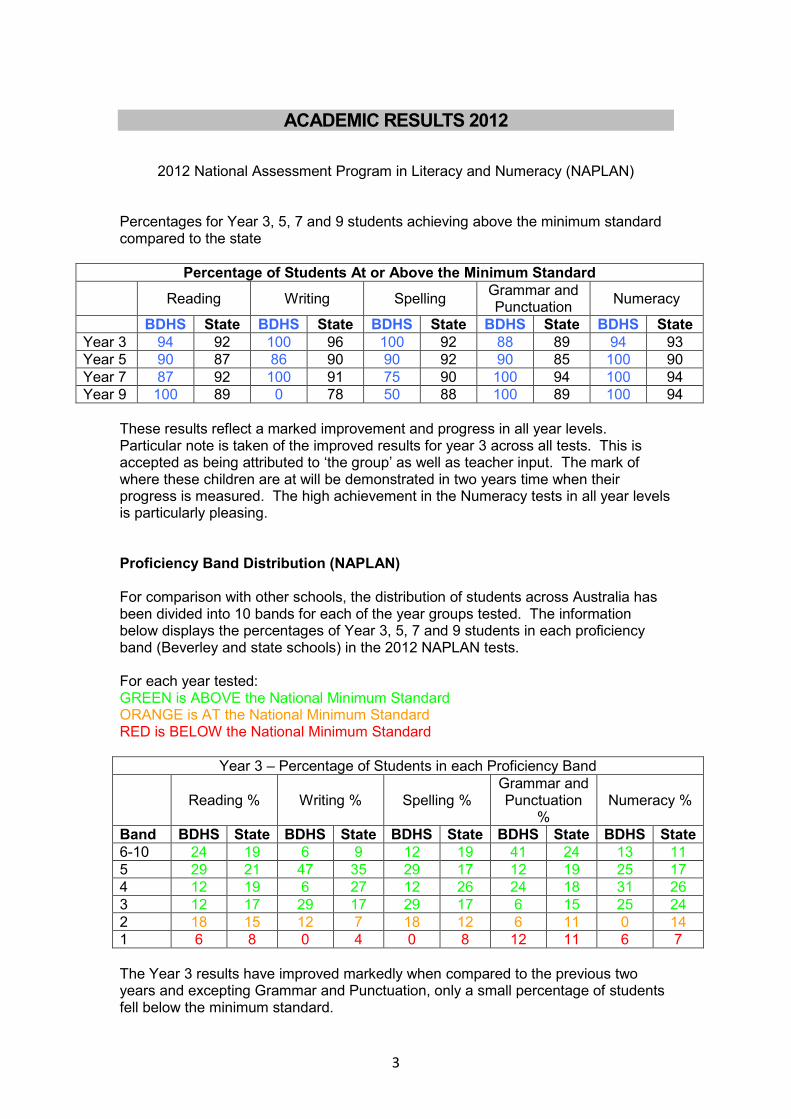
Percentage of Students At or Above the Minimum Standard
Reading Writing Spelling
Grammar and Punctuation
Numeracy
BDHS State BDHS State BDHS State BDHS State BDHS State
Year 3 94 92 100 96 100 92 88 89 94 93
Year 5 90 87 86 90 90 92 90 85 100 90
Year 7 87 92 100 91 75 90 100 94 100 94
Year 9 100 89 0 78 50 88 100 89 100 94
These results reflect a marked improvement and progress in all year levels. Particular note is taken of the improved results for year 3 across all tests. This is accepted as being attributed to ‘the group’ as well as teacher input. The mark of where these children are at will be demonstrated in two years time when their progress is measured. The high achievement in the Numeracy tests in all year levels is particularly pleasing. Proficiency Band Distribution (NAPLAN) For comparison with other schools, the distribution of students across Australia has been divided into 10 bands for each of the year groups tested. The information below displays the percentages of Year 3, 5, 7 and 9 students in each proficiency band (Beverley and state schools) in the 2012 NAPLAN tests. For each year tested: GREEN is ABOVE the National Minimum Standard ORANGE is AT the National Minimum Standard RED is BELOW the National Minimum Standard
Year 3 – Percentage of Students in each Proficiency Band
Reading % Writing % Spelling % Grammar and Punctuation
% Numeracy %
Band BDHS State BDHS State BDHS State BDHS State BDHS State
6-10 24 19 6 9 12 19 41 24 13 11
5 29 21 47 35 29 17 12 19 25 17
4 12 19 6 27 12 26 24 18 31 26
3 12 17 29 17 29 17 6 15 25 24
2 18 15 12 7 18 12 6 11 0 14
1 6 8 0 4 0 8 12 11 6 7
The Year 3 results have improved markedly when compared to the previous two years and excepting Grammar and Punctuation, only a small percentage of students fell below the minimum standard.
4
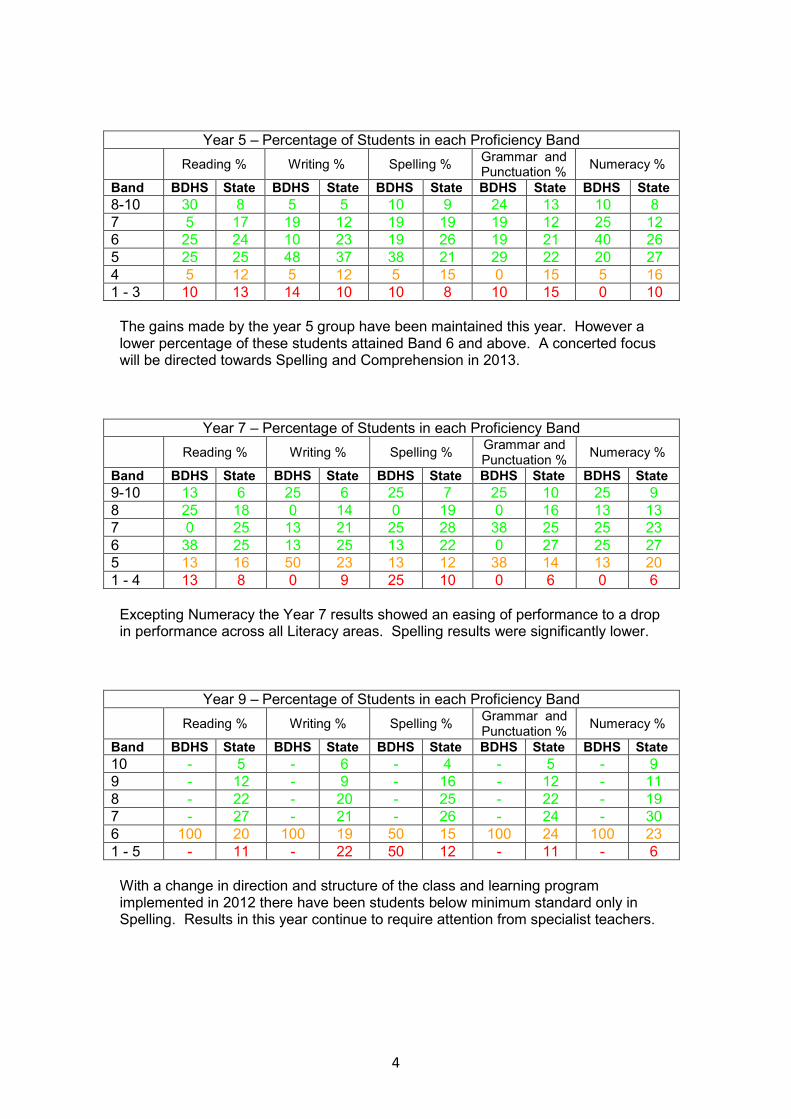
Year 5 – Percentage of Students in each Proficiency Band
Reading % Writing % Spelling % Grammar and Punctuation %
Numeracy %
Band BDHS State BDHS State BDHS State BDHS State BDHS State
8-10 30 8 5 5 10 9 24 13 10 8
7 5 17 19 12 19 19 19 12 25 12
6 25 24 10 23 19 26 19 21 40 26
5 25 25 48 37 38 21 29 22 20 27
4 5 12 5 12 5 15 0 15 5 16
1 - 3 10 13 14 10 10 8 10 15 0 10
The gains made by the year 5 group have been maintained this year. However a lower percentage of these students attained Band 6 and above. A concerted focus will be directed towards Spelling and Comprehension in 2013.
Year 7 – Percentage of Students in each Proficiency Band
Reading % Writing % Spelling % Grammar and Punctuation %
Numeracy %
Band BDHS State BDHS State BDHS State BDHS State BDHS State
9-10 13 6 25 6 25 7 25 10 25 9
8 25 18 0 14 0 19 0 16 13 13
7 0 25 13 21 25 28 38 25 25 23
6 38 25 13 25 13 22 0 27 25 27
5 13 16 50 23 13 12 38 14 13 20
1 - 4 13 8 0 9 25 10 0 6 0 6
Excepting Numeracy the Year 7 results showed an easing of performance to a drop in performance across all Literacy areas. Spelling results were significantly lower.
Year 9 – Percentage of Students in each Proficiency Band
Reading % Writing % Spelling % Grammar and Punctuation %
Numeracy %
Band BDHS State BDHS State BDHS State BDHS State BDHS State
10 - 5 - 6 - 4 - 5 - 9
9 - 12 - 9 - 16 - 12 - 11
8 - 22 - 20 - 25 - 22 - 19
7 - 27 - 21 - 26 - 24 - 30
6 100 20 100 19 50 15 100 24 100 23
1 - 5 - 11 - 22 50 12 - 11 - 6
With a change in direction and structure of the class and learning program implemented in 2012 there have been students below minimum standard only in Spelling. Results in this year continue to require attention from specialist teachers.
5
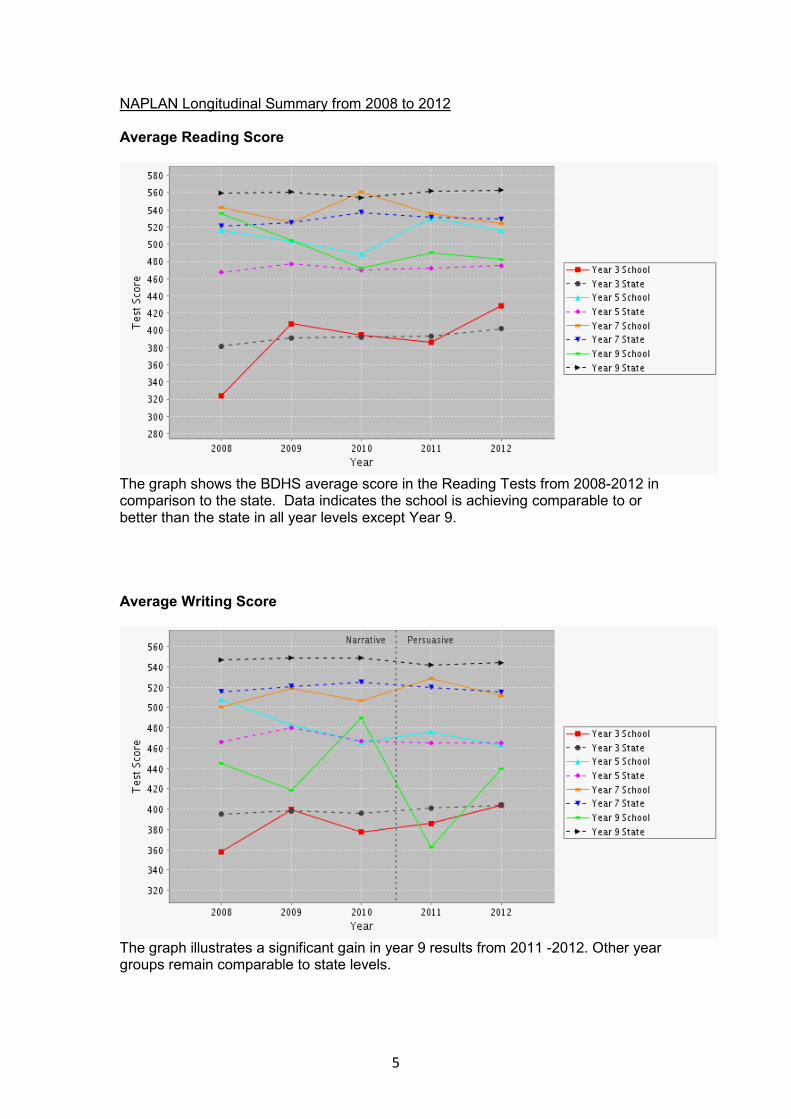
NAPLAN Longitudinal Summary from 2008 to 2012 Average Reading Score
The graph shows the BDHS average score in the Reading Tests from 2008-2012 in comparison to the state. Data indicates the school is achieving comparable to or better than the state in all year levels except Year 9. Average Writing Score
The graph illustrates a significant gain in year 9 results from 2011 -2012. Other year groups remain comparable to state levels.
6
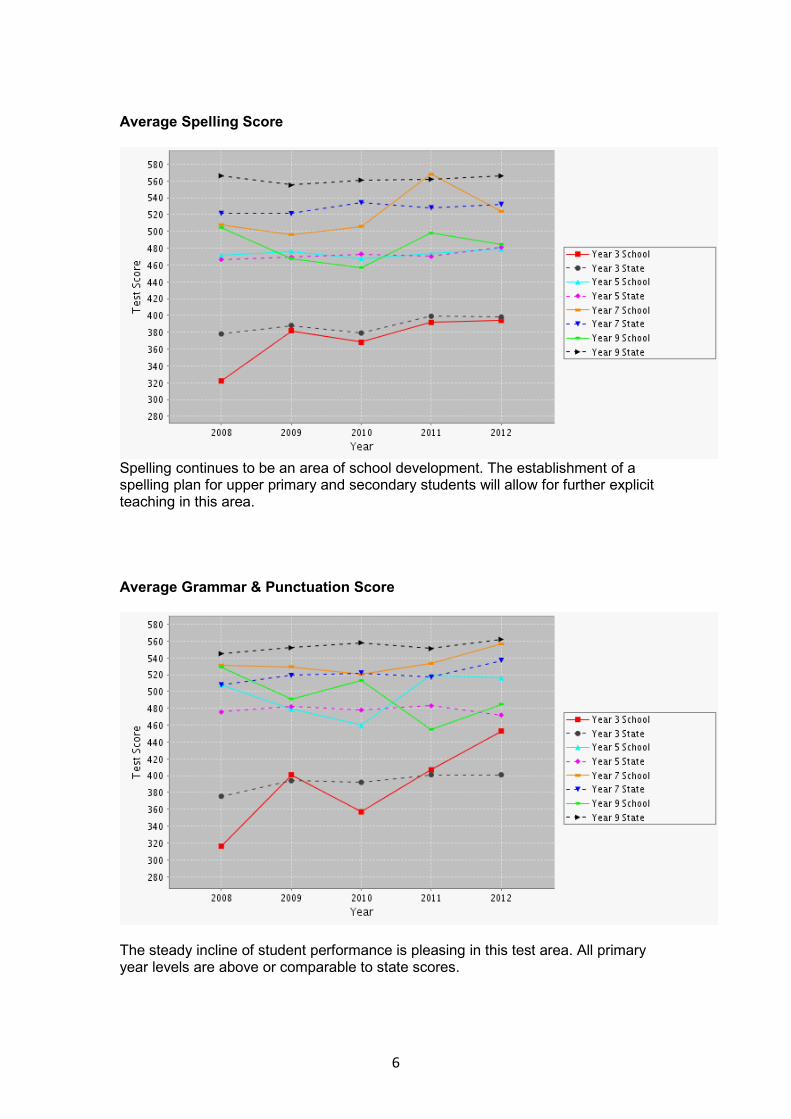
Average Spelling Score
Spelling continues to be an area of school development. The establishment of a spelling plan for upper primary and secondary students will allow for further explicit teaching in this area.
Average Grammar & Punctuation Score
The steady incline of student performance is pleasing in this test area. All primary year levels are above or comparable to state scores.
7
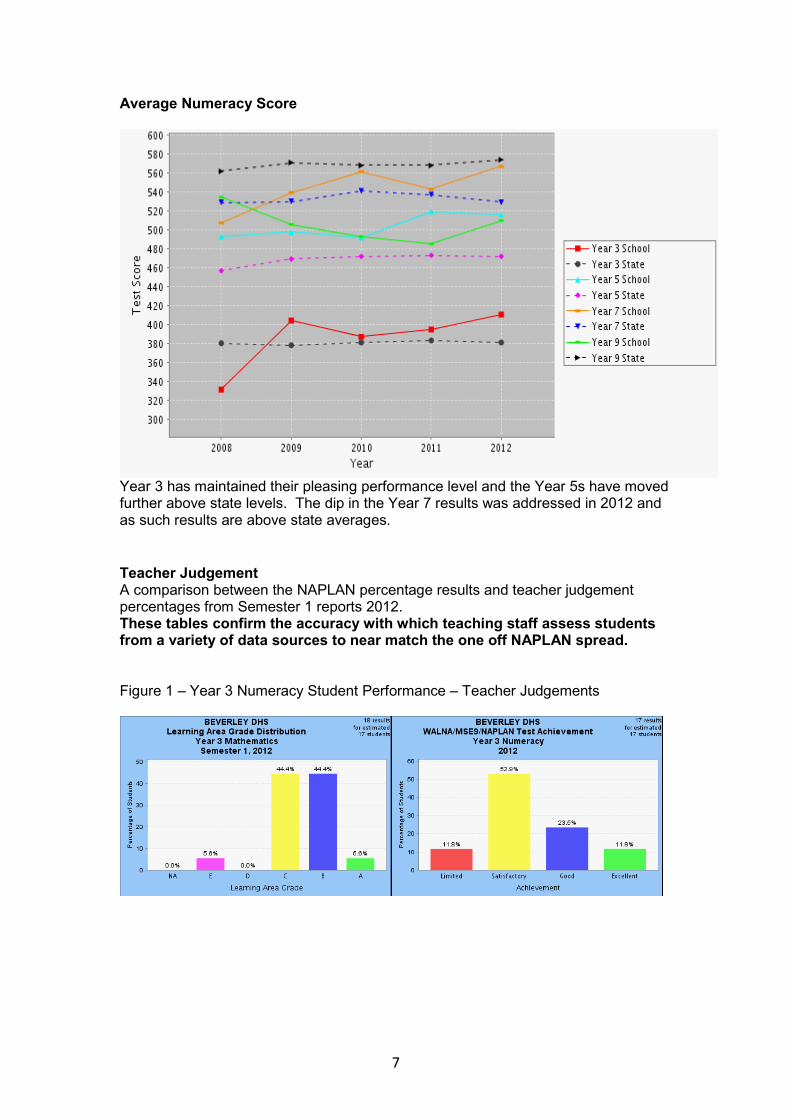
Average Numeracy Score
Year 3 has maintained their pleasing performance level and the Year 5s have moved further above state levels. The dip in the Year 7 results was addressed in 2012 and as such results are above state averages.
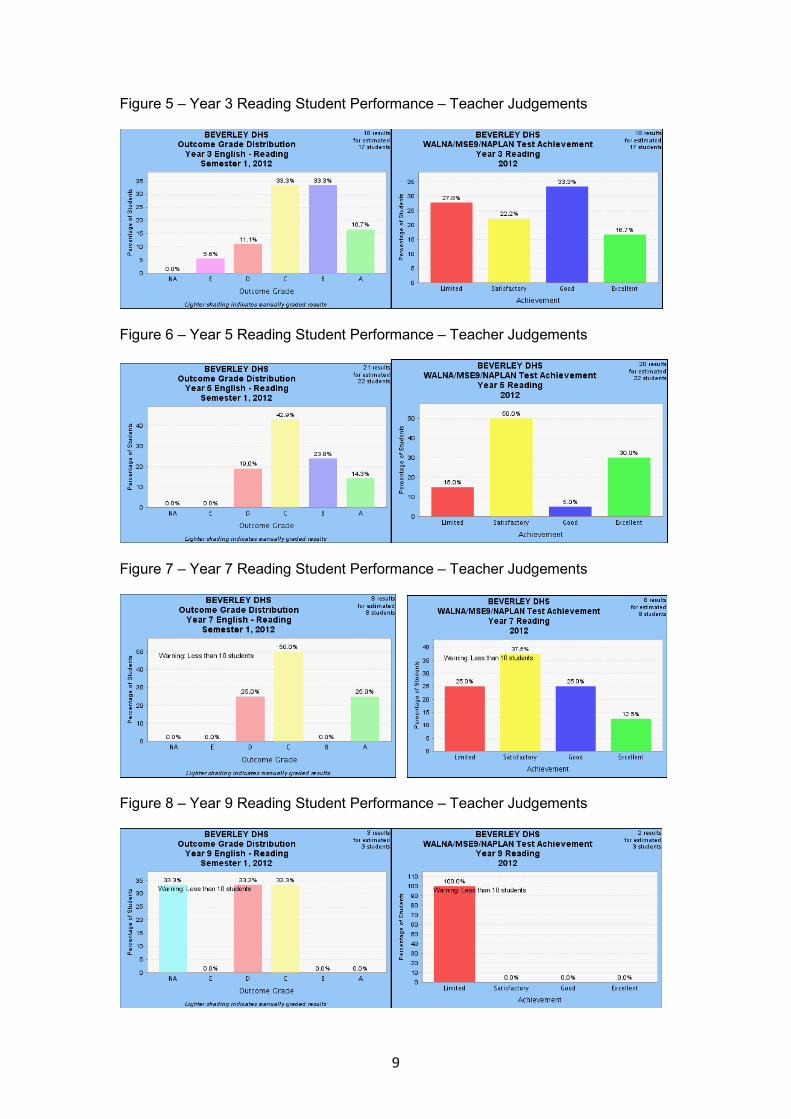
Teacher Judgement A comparison between the NAPLAN percentage results and teacher judgement percentages from Semester 1 reports 2012. These tables confirm the accuracy with which teaching staff assess students from a variety of data sources to near match the one off NAPLAN spread. Figure 1 – Year 3 Numeracy Student Performance – Teacher Judgements
8
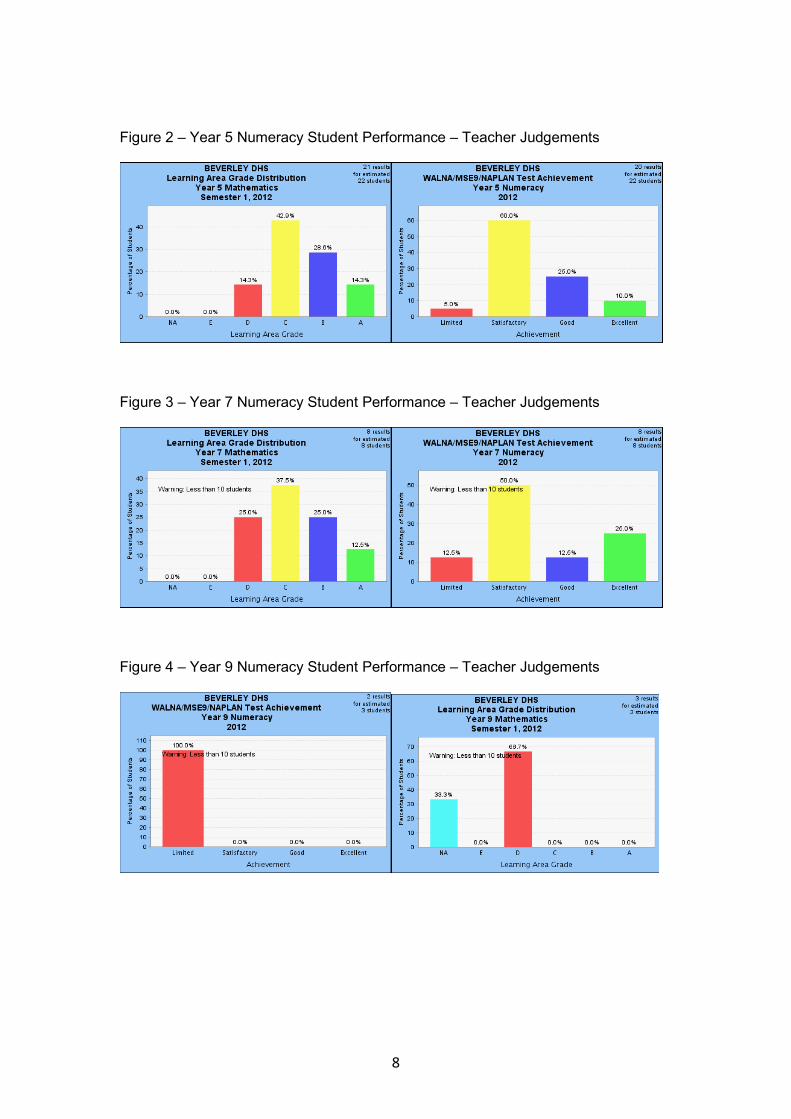
Figure 2 – Year 5 Numeracy Student Performance – Teacher Judgements
Figure 3 – Year 7 Numeracy Student Performance – Teacher Judgements
Figure 4 – Year 9 Numeracy Student Performance – Teacher Judgements
9
Figure 5 – Year 3 Reading Student Performance – Teacher Judgements
Figure 6 – Year 5 Reading Student Performance – Teacher Judgements
Figure 7 – Year 7 Reading Student Performance – Teacher Judgements
Figure 8 – Year 9 Reading Student Performance – Teacher Judgements
10
PROGRESS ON 2012 PRIORITIES
In 2012 the school took a number of steps to improve the standard of Literacy and Numeracy throughout the school.
PRIORITY AREA – LITERACY K-10 This priority was continued from last year to build the sustainability of the Whole School Literacy Plan (WSLP).
• Commitment to the Whole School Literacy Plan;
• Explicit teaching of grammar, punctuation and spelling.
• Targeted Literacy Support providing at point of need direct assistance to students identified from 2011 NAPLAN data.
• More concerted attention to Persuasive Writing instruction through timed practice and teacher moderation.
• Commitment to the use of PLD resources across the school.
PRIORITY AREA – NUMERACY K-10 This priority area was maintained to confirm the embedding of the Whole School Numeracy Plan (WSNP) in teachers’ planning. An identified concern from NAPLAN results was the inability to problem solve.
• The school appointed Getting It Right Numeracy Teacher continues her excellent role in up-skilling the staff in the teaching of Maths and developing programs to address concerns raised in previous NAPLAN tests.
• Commitment to the Whole School Numeracy Plan across all classrooms.
• Students at Educational Risk were identified through data analysis and IEPs developed and implemented. Comprehensive changeover of student information conducted between teachers at the end of the school year.
• Explicit teaching of calculation strategies and methods for problem solving.
• Use of Maths Olympiad for Maths extension activities and investigate other IT based Maths resources including Mathletics.
2012 PRIORITIES
• Literacy
• Numeracy
• Information Technology
• Attendance
11
PRIORITY AREA – INFORMATION TECHNOLOGY
• Time allocated for an IT teacher to take computing across the school.
• Purchased additional Electronic Whiteboards for primary classrooms.
• Updated resources and programs currently available on the school network.
• Carried out an audit of current IT use across the school.
• Incorporated a computing skills continuum for students across K-10.
• Purchased iPads for the secondary classroom.
PRIORITY AREA – ATTENDANCE
• Addressed the issue at the Parent/Teacher night early in term 1.
• SMS – initiated phone messages to be sent daily for unexplained absences.
• Planned with community leisure/sporting groups to reinforce attendance through non participation in external activities.
• Incentives distributed for highest student attendance achieved.
• Case meetings held for individual students whose attendance dropped below 85%.
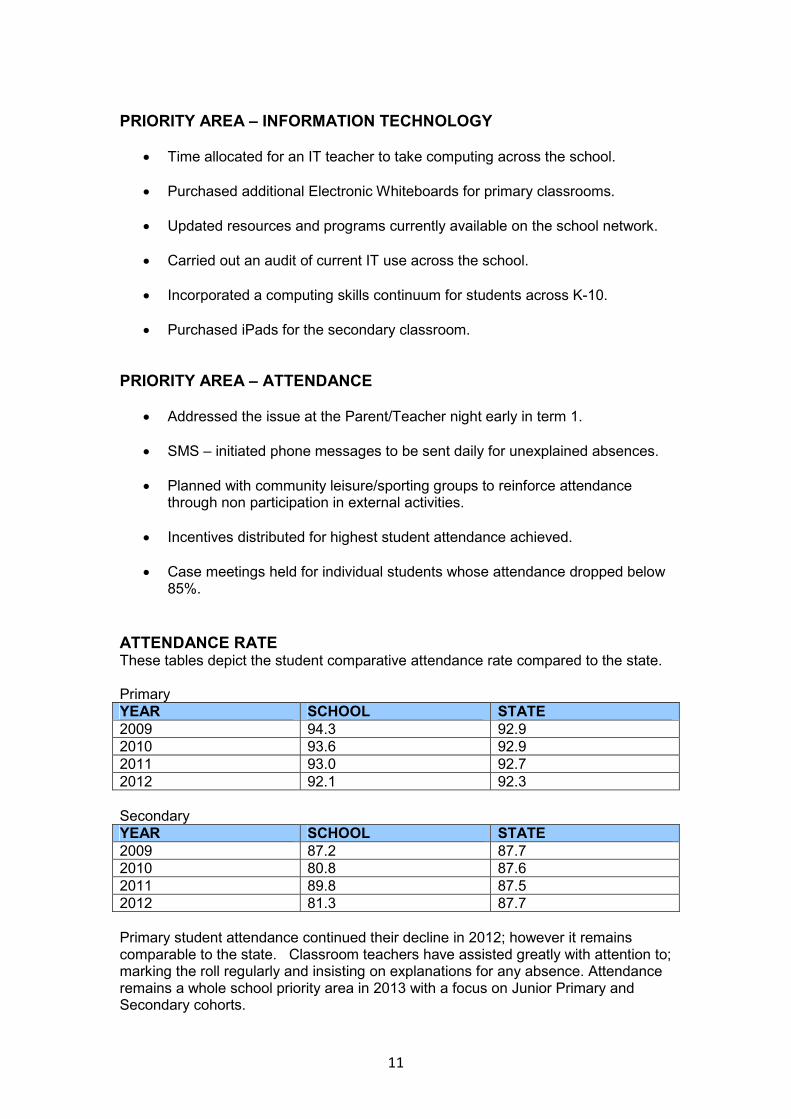
ATTENDANCE RATE These tables depict the student comparative attendance rate compared to the state. Primary
YEAR SCHOOL STATE
2009 94.3 92.9
2010 93.6 92.9
2011 93.0 92.7
2012 92.1 92.3
Secondary
YEAR SCHOOL STATE
2009 87.2 87.7
2010 80.8 87.6
2011 89.8 87.5
2012 81.3 87.7
Primary student attendance continued their decline in 2012; however it remains comparable to the state. Classroom teachers have assisted greatly with attention to; marking the roll regularly and insisting on explanations for any absence. Attendance remains a whole school priority area in 2013 with a focus on Junior Primary and Secondary cohorts.
12
ATTITUDE, BEHAVIOUR, EFFORT AND VALUES
During 2012 the school maintained its focus on a number of values we believed would help the students in their development.
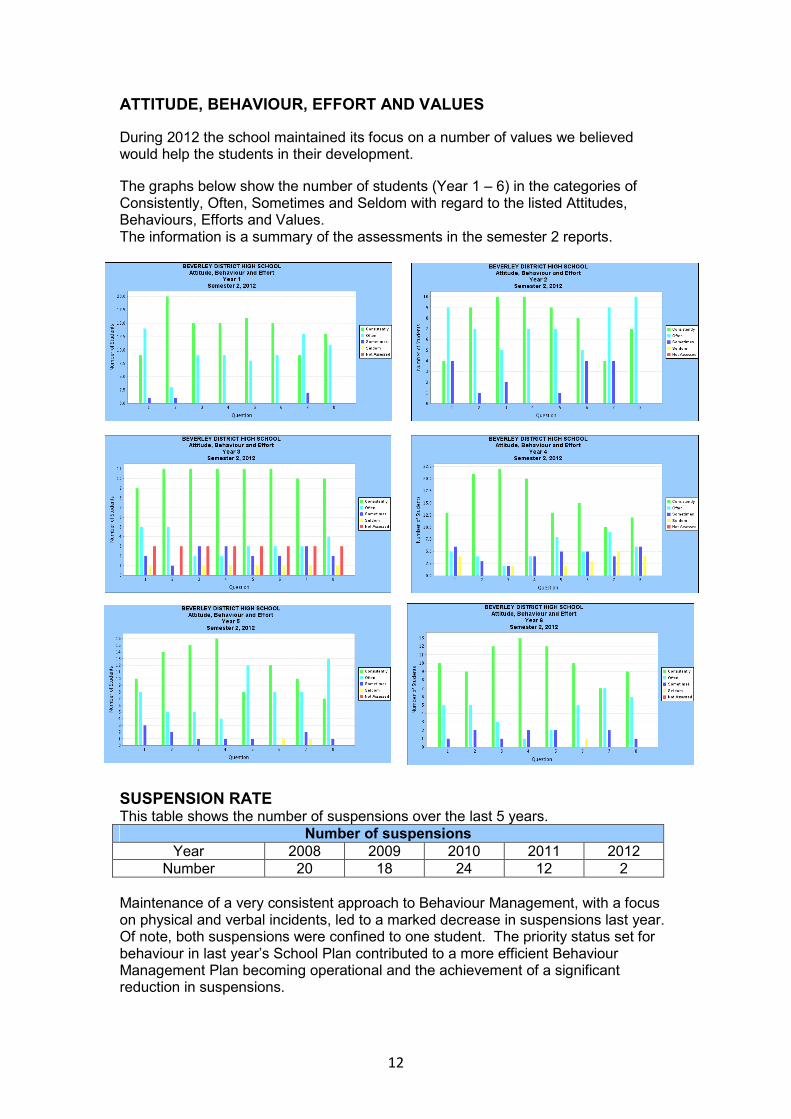
The graphs below show the number of students (Year 1 – 6) in the categories of Consistently, Often, Sometimes and Seldom with regard to the listed Attitudes, Behaviours, Efforts and Values. The information is a summary of the assessments in the semester 2 reports.
SUSPENSION RATE This table shows the number of suspensions over the last 5 years.
Number of suspensions
Year 2008 2009 2010 2011 2012
Number 20 18 24 12 2
Maintenance of a very consistent approach to Behaviour Management, with a focus on physical and verbal incidents, led to a marked decrease in suspensions last year. Of note, both suspensions were confined to one student. The priority status set for behaviour in last year’s School Plan contributed to a more efficient Behaviour Management Plan becoming operational and the achievement of a significant reduction in suspensions.
13
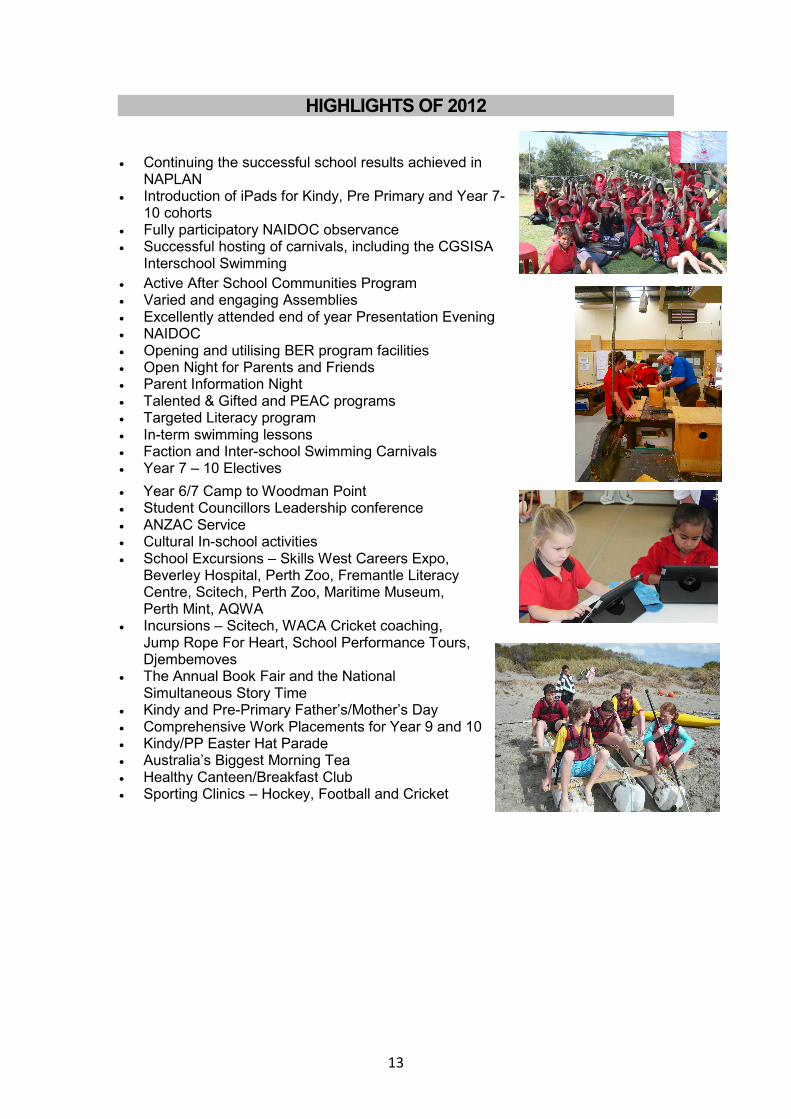
HIGHLIGHTS OF 2012
• Continuing the successful school results achieved in NAPLAN
• Introduction of iPads for Kindy, Pre Primary and Year 7-10 cohorts
• Fully participatory NAIDOC observance • Successful hosting of carnivals, including the CGSISA
Interschool Swimming
• Active After School Communities Program • Varied and engaging Assemblies • Excellently attended end of year Presentation Evening • NAIDOC • Opening and utilising BER program facilities • Open Night for Parents and Friends • Parent Information Night • Talented & Gifted and PEAC programs • Targeted Literacy program • In-term swimming lessons • Faction and Inter-school Swimming Carnivals • Year 7 – 10 Electives
• Year 6/7 Camp to Woodman Point • Student Councillors Leadership conference • ANZAC Service • Cultural In-school activities • School Excursions – Skills West Careers Expo,
Beverley Hospital, Perth Zoo, Fremantle Literacy Centre, Scitech, Perth Zoo, Maritime Museum, Perth Mint, AQWA
• Incursions – Scitech, WACA Cricket coaching, Jump Rope For Heart, School Performance Tours, Djembemoves
• The Annual Book Fair and the National Simultaneous Story Time
• Kindy and Pre-Primary Father’s/Mother’s Day • Comprehensive Work Placements for Year 9 and 10 • Kindy/PP Easter Hat Parade • Australia’s Biggest Morning Tea • Healthy Canteen/Breakfast Club • Sporting Clinics – Hockey, Football and Cricket
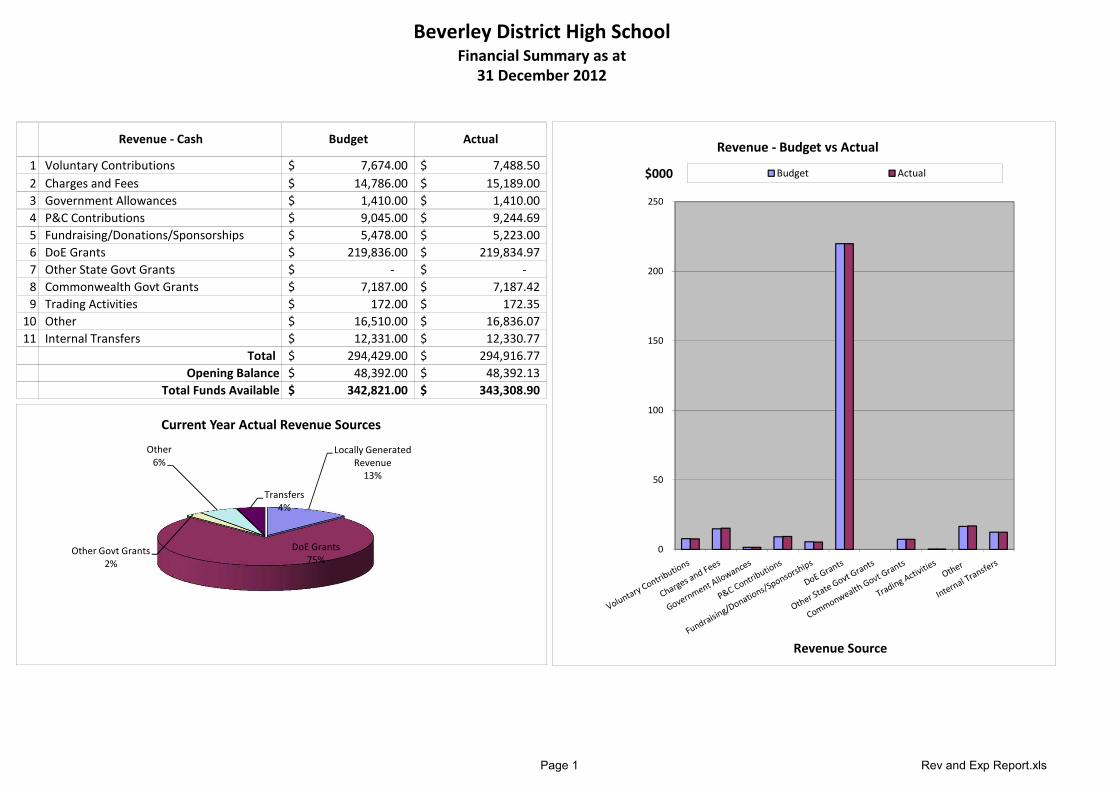
1 7,674.00$ 7,488.50$
2 14,786.00$ 15,189.00$
3 1,410.00$ 1,410.00$
4 9,045.00$ 9,244.69$
5 5,478.00$ 5,223.00$
6 219,836.00$ 219,834.97$
7 -$ -$
8 7,187.00$ 7,187.42$
9 172.00$ 172.35$
10 16,510.00$ 16,836.07$
11 12,331.00$ 12,330.77$
294,429.00$ 294,916.77$
48,392.00$ 48,392.13$
342,821.00$ 343,308.90$
Locally Generated Revenue37,317.54$
DoE Grants 221,244.97$
Other Govt Grants 7,187.42$
Other 16,836.07$
Transfers 12,330.77$
294,916.77$
Opening Balance
Voluntary Contributions
Charges and Fees
Government Allowances
P&C Contributions
Commonwealth Govt Grants
Fundraising/Donations/Sponsorships
DoE Grants
Other State Govt Grants
Total
Beverley District High SchoolFinancial Summary as at
Actual
31 December 2012
Total Funds Available
Internal Transfers
BudgetRevenue - Cash
Trading Activities
Other
0
50
100
150
200
250
$000
Revenue Source
Revenue - Budget vs Actual
Budget Actual
Locally Generated
Revenue
13%
DoE Grants
75%Other Govt Grants
2%
Other
6%
Transfers
4%
Current Year Actual Revenue Sources
Page 1 Rev and Exp Report.xls
Beverley District High SchoolFinancial Summary as at
31 December 2012
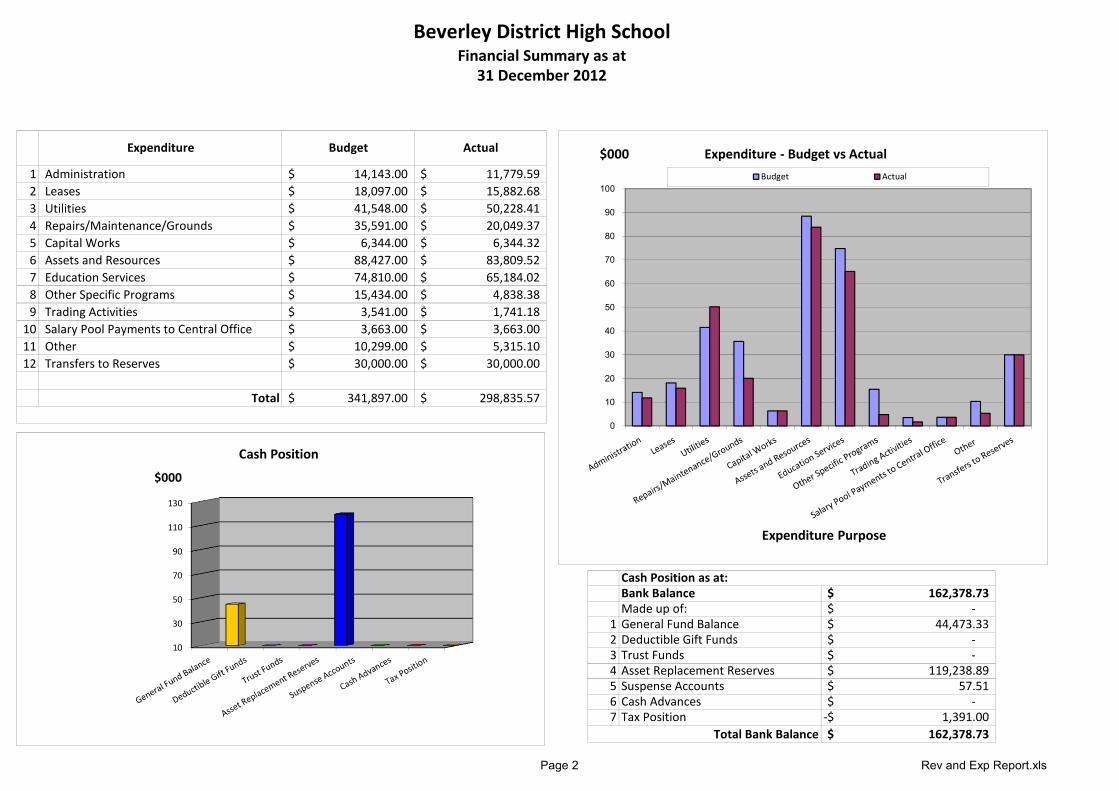
1 14,143.00$ 11,779.59$
2 18,097.00$ 15,882.68$
3 41,548.00$ 50,228.41$
4 35,591.00$ 20,049.37$
5 6,344.00$ 6,344.32$
6 88,427.00$ 83,809.52$
7 74,810.00$ 65,184.02$
8 15,434.00$ 4,838.38$
9 3,541.00$ 1,741.18$
10 3,663.00$ 3,663.00$
11 10,299.00$ 5,315.10$
12 30,000.00$ 30,000.00$
341,897.00$ 298,835.57$
Bank Balance 162,378.73$
Made up of: -$
1 General Fund Balance 44,473.33$
2 Deductible Gift Funds -$
3 Trust Funds -$
4 Asset Replacement Reserves 119,238.89$
5 Suspense Accounts 57.51$
6 Cash Advances -$
7 Tax Position 1,391.00-$
162,378.73$
Salary Pool Payments to Central Office
Budget ActualExpenditure
Trading Activities
Administration
Leases
Utilities
Repairs/Maintenance/Grounds
Capital Works
Total Bank Balance
Cash Position as at:
Other
Transfers to Reserves
Total
Assets and Resources
Education Services
Other Specific Programs
0
10
20
30
40
50
60
70
80
90
100
$000
Expenditure Purpose
Expenditure - Budget vs Actual
Budget Actual
10
30
50
70
90
110
130
$000
Cash Position
Page 2 Rev and Exp Report.xls
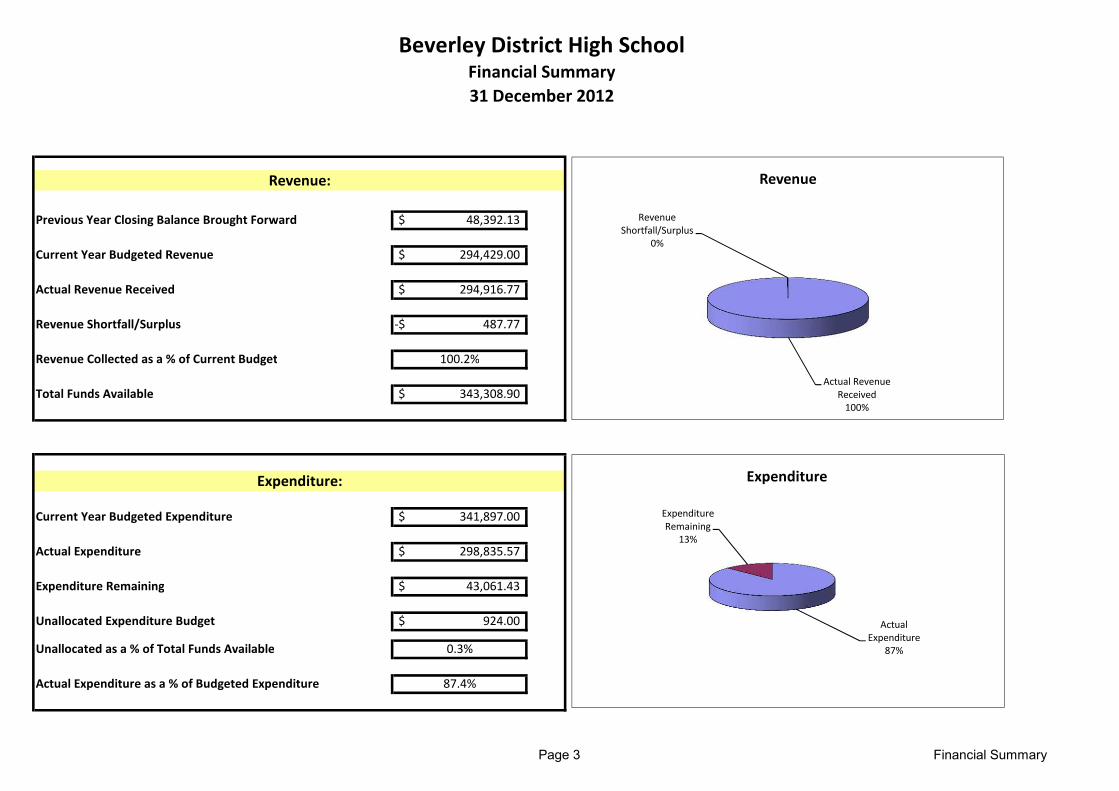
Previous Year Closing Balance Brought Forward 48,392.13$
Current Year Budgeted Revenue 294,429.00$
Actual Revenue Received 294,916.77$
Revenue Shortfall/Surplus 487.77-$
Revenue Collected as a % of Current Budget 100.2%
Total Funds Available 343,308.90$
Current Year Budgeted Expenditure 341,897.00$
Actual Expenditure 298,835.57$
Expenditure Remaining 43,061.43$
Unallocated Expenditure Budget 924.00$
Unallocated as a % of Total Funds Available 0.3%
Actual Expenditure as a % of Budgeted Expenditure 87.4%
Beverley District High SchoolFinancial Summary
31 December 2012
Revenue:
Expenditure:
Actual Revenue
Received
100%
Revenue
Shortfall/Surplus
0%
Revenue
Actual
Expenditure
87%
Expenditure
Remaining
13%
Expenditure
Page 3 Financial Summary
Beverley District High SchoolFinancial Summary
31 December 2012
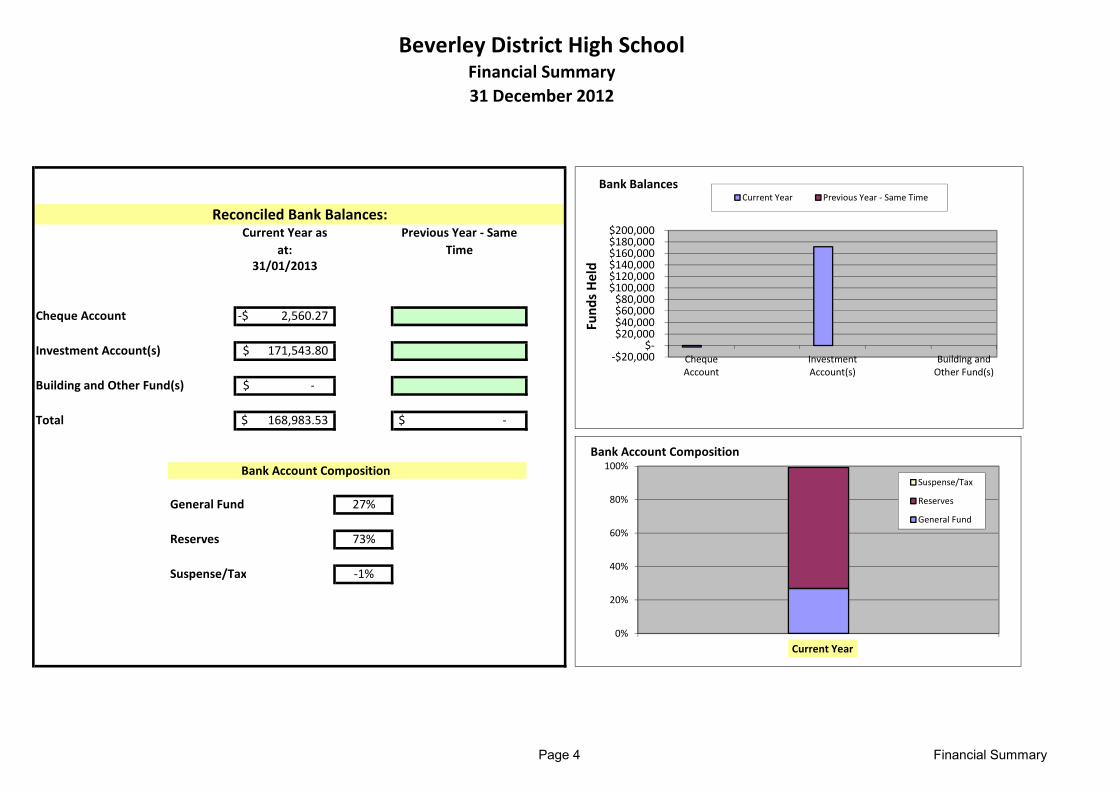
Current Year as
at:
Previous Year - Same
Time
31/01/2013
Cheque Account 2,560.27-$
Investment Account(s) 171,543.80$
Building and Other Fund(s) -$
Total 168,983.53$ -$
Bank Account Composition
General Fund 27%
Reserves 73%
Suspense/Tax -1%
Reconciled Bank Balances:
-$20,000 $-
$20,000 $40,000 $60,000 $80,000
$100,000 $120,000 $140,000 $160,000 $180,000 $200,000
Cheque
Account
Investment
Account(s)
Building and
Other Fund(s)
Fun
ds
He
ld
Bank BalancesCurrent Year Previous Year - Same Time
0%
20%
40%
60%
80%
100%
1Current Year
Bank Account Composition
Suspense/Tax
Reserves
General Fund
Page 4 Financial Summary
Beverley District High SchoolFinancial Summary
31 December 2012
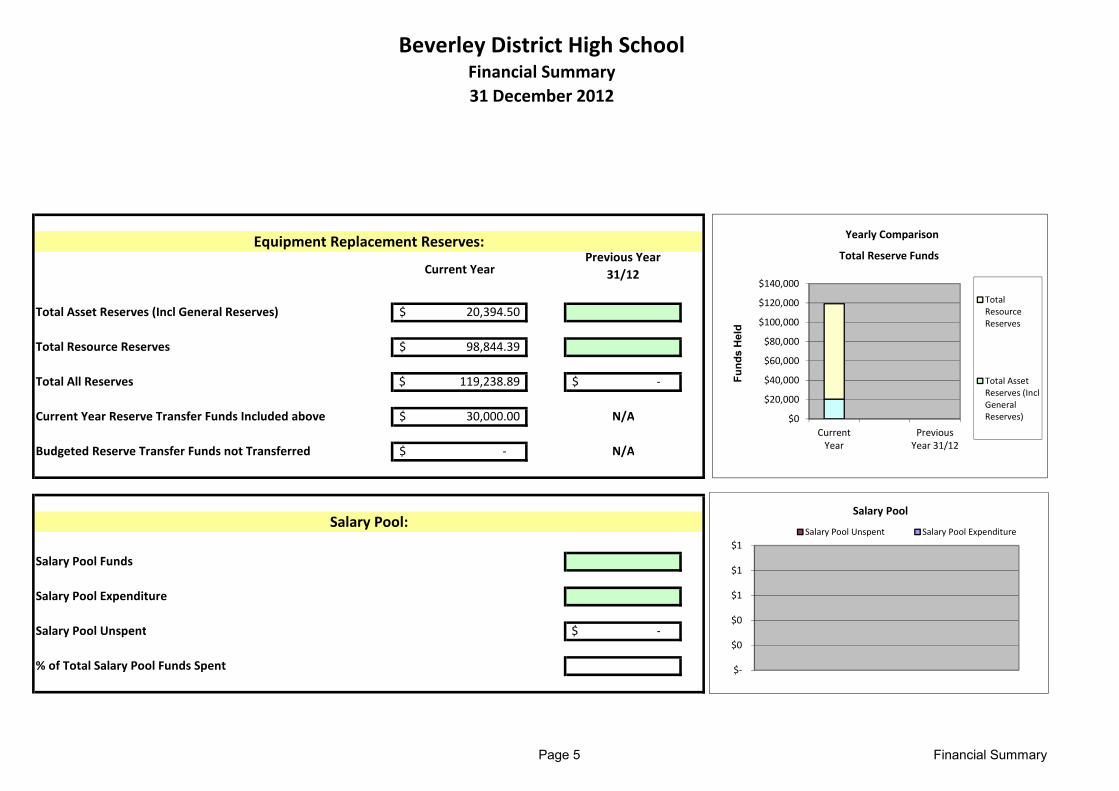
Current YearPrevious Year
31/12
Total Asset Reserves (Incl General Reserves) 20,394.50$
Total Resource Reserves 98,844.39$
Total All Reserves 119,238.89$ -$
Current Year Reserve Transfer Funds Included above 30,000.00$ N/A
Budgeted Reserve Transfer Funds not Transferred -$ N/A
Salary Pool Funds
Salary Pool Expenditure
Salary Pool Unspent -$
% of Total Salary Pool Funds Spent
Salary Pool:
Equipment Replacement Reserves:
$0
$20,000
$40,000
$60,000
$80,000
$100,000
$120,000
$140,000
Current
Year
Previous
Year 31/12
Funds Held
Yearly Comparison
Total Reserve Funds
Total
Resource
Reserves
Total Asset
Reserves (Incl
General
Reserves)
$-
$0
$0
$1
$1
$1
Salary Pool
Salary Pool Unspent Salary Pool Expenditure
Page 5 Financial Summary
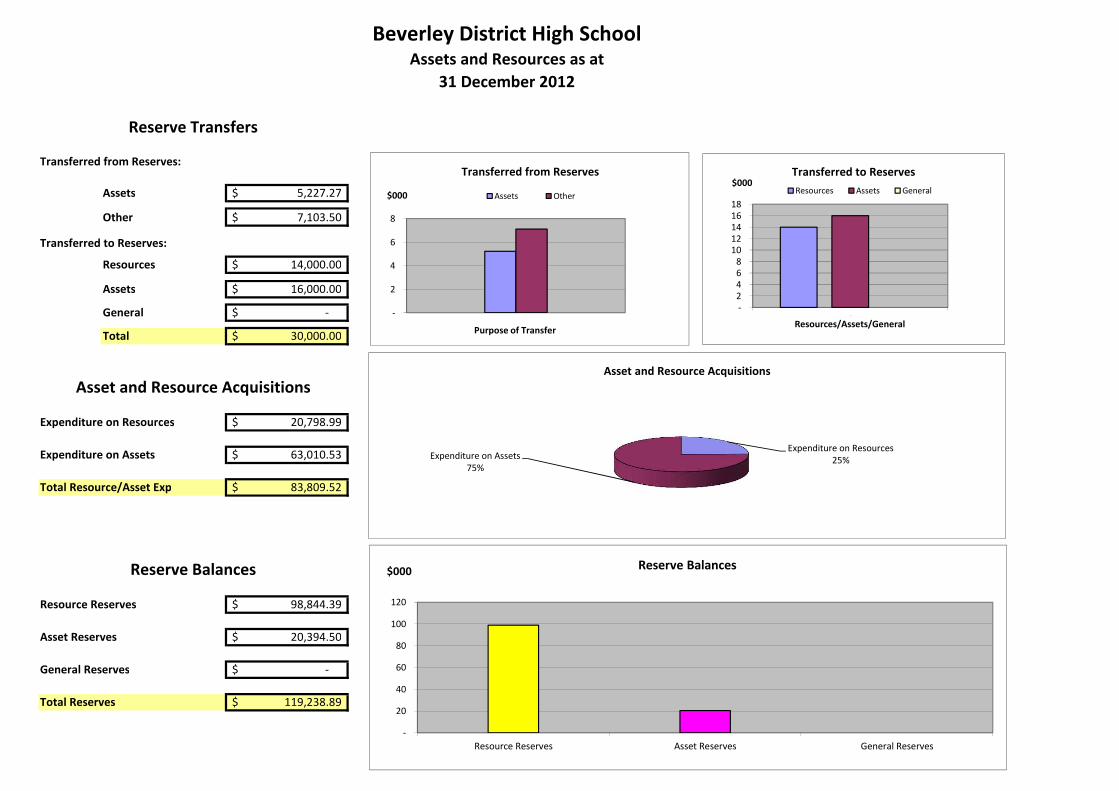
Transferred from Reserves:
Assets 5,227.27$
Other 7,103.50$
Transferred to Reserves:
14,000.00$
16,000.00$
General -$
30,000.00$
Expenditure on Resources 20,798.99$
Expenditure on Assets 63,010.53$
Total Resource/Asset Exp 83,809.52$
Resource Reserves 98,844.39$
Asset Reserves 20,394.50$
General Reserves -$
Total Reserves 119,238.89$
Reserve Balances
Resources
Assets
Reserve Transfers
Total
Beverley District High SchoolAssets and Resources as at
31 December 2012
Asset and Resource Acquisitions
-
2
4
6
8
$000
Purpose of Transfer
Transferred from Reserves
Assets Other
- 2 4 6 8
10 12 14 16 18
1
$000
Resources/Assets/General
Transferred to Reserves
Resources Assets General
Expenditure on Resources
25%Expenditure on Assets
75%
Asset and Resource Acquisitions
-
20
40
60
80
100
120
Resource Reserves Asset Reserves General Reserves
$000Reserve Balances