Embed Size (px)
Citation preview
5/13/2014
Best Value Procurement
AZ NIGP
Peggy Ferrin
2
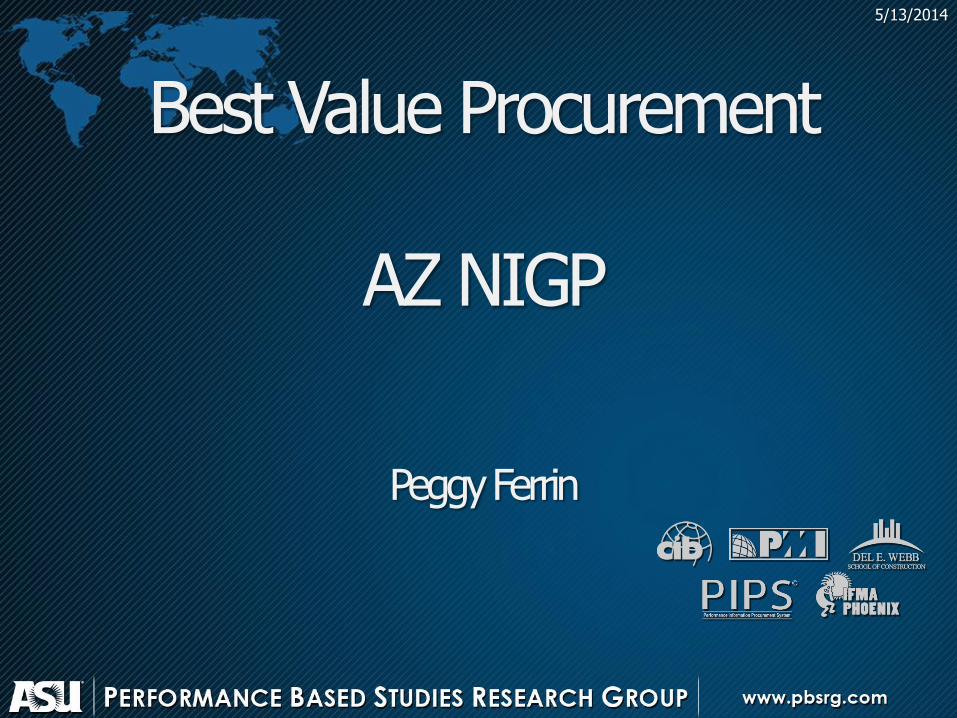
PBSRG Research Results
Worldwide as a leader in Best-Value Systems
18 Years
1000+ Projects
$6.3 Billion Services & Construction
$1.8 Billion Netherlands infrastructure construction test
5% Increase in Vendor profit
98% On-time, On-Budget, Customer Satisfaction
ASU – investments of over $100M due to Best Value
GSA (largest organization in U.S. delivering services)
implementation in 2009
Tests also in Africa, Southeast Asia, Canada, & Australia
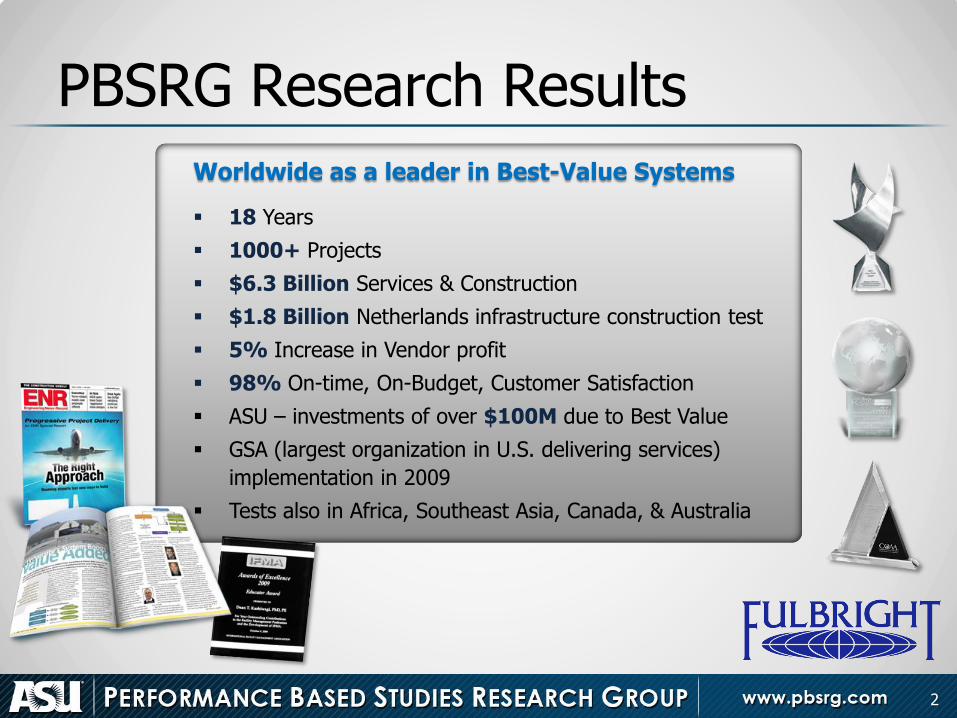
International Efforts & Partners
3
Fulbright Scholarship- University of Botswana PIPS tests
RMIT Teaching IMT PBSRG platform
Tongji University
5 years 15 tests for infrastructure Two major GCs
Brunsfield Complete Supply Chain
University of Alberta
United States - 65 clients
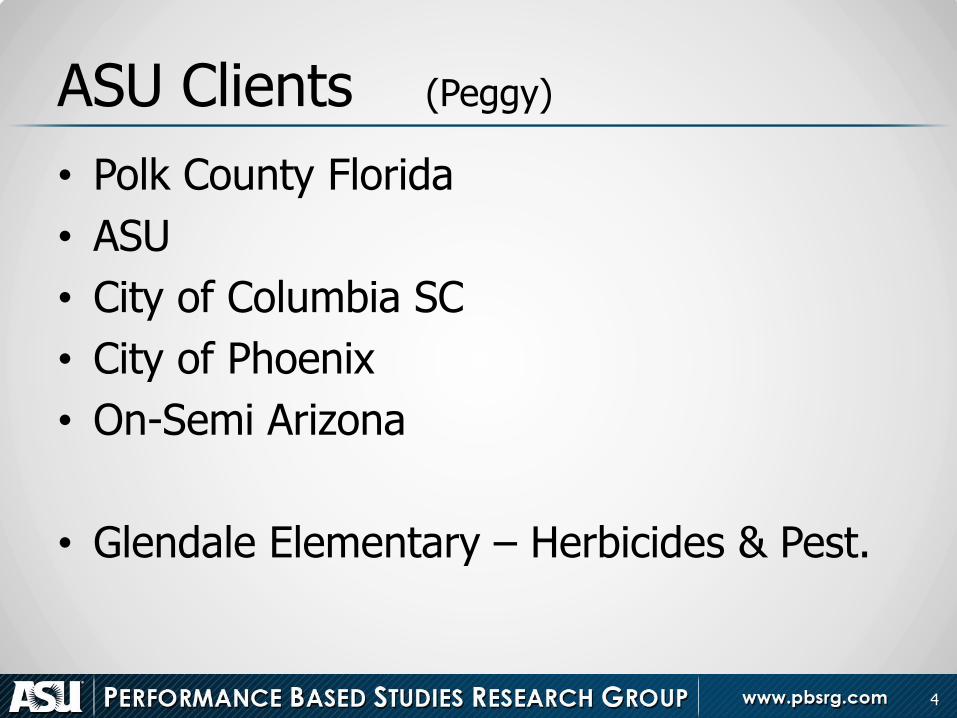
ASU Clients (Peggy)
• Polk County Florida
• ASU
• City of Columbia SC
• City of Phoenix
• On-Semi Arizona
• Glendale Elementary – Herbicides & Pest.
4
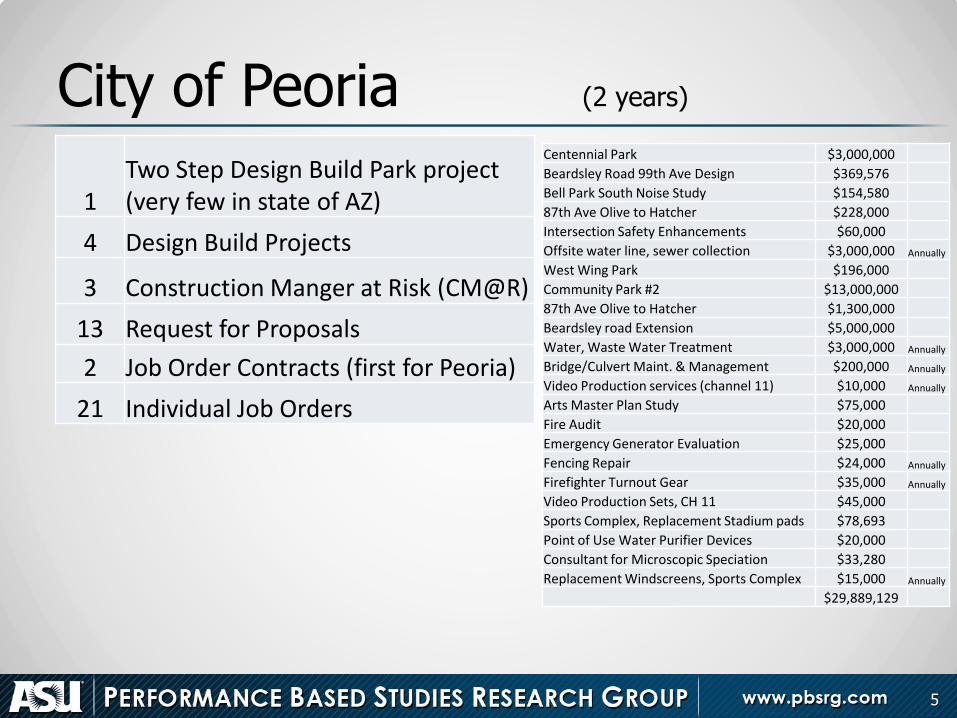
City of Peoria (2 years)
5
1 Two Step Design Build Park project (very few in state of AZ)
4 Design Build Projects
3 Construction Manger at Risk (CM@R)
13 Request for Proposals
2 Job Order Contracts (first for Peoria)
21 Individual Job Orders
Centennial Park $3,000,000
Beardsley Road 99th Ave Design $369,576
Bell Park South Noise Study $154,580
87th Ave Olive to Hatcher $228,000
Intersection Safety Enhancements $60,000
Offsite water line, sewer collection $3,000,000 Annually
West Wing Park $196,000
Community Park #2 $13,000,000
87th Ave Olive to Hatcher $1,300,000
Beardsley road Extension $5,000,000
Water, Waste Water Treatment $3,000,000 Annually
Bridge/Culvert Maint. & Management $200,000 Annually
Video Production services (channel 11) $10,000 Annually
Arts Master Plan Study $75,000
Fire Audit $20,000
Emergency Generator Evaluation $25,000
Fencing Repair $24,000 Annually
Firefighter Turnout Gear $35,000 Annually
Video Production Sets, CH 11 $45,000
Sports Complex, Replacement Stadium pads $78,693
Point of Use Water Purifier Devices $20,000
Consultant for Microscopic Speciation $33,280
Replacement Windscreens, Sports Complex $15,000 Annually
$29,889,129
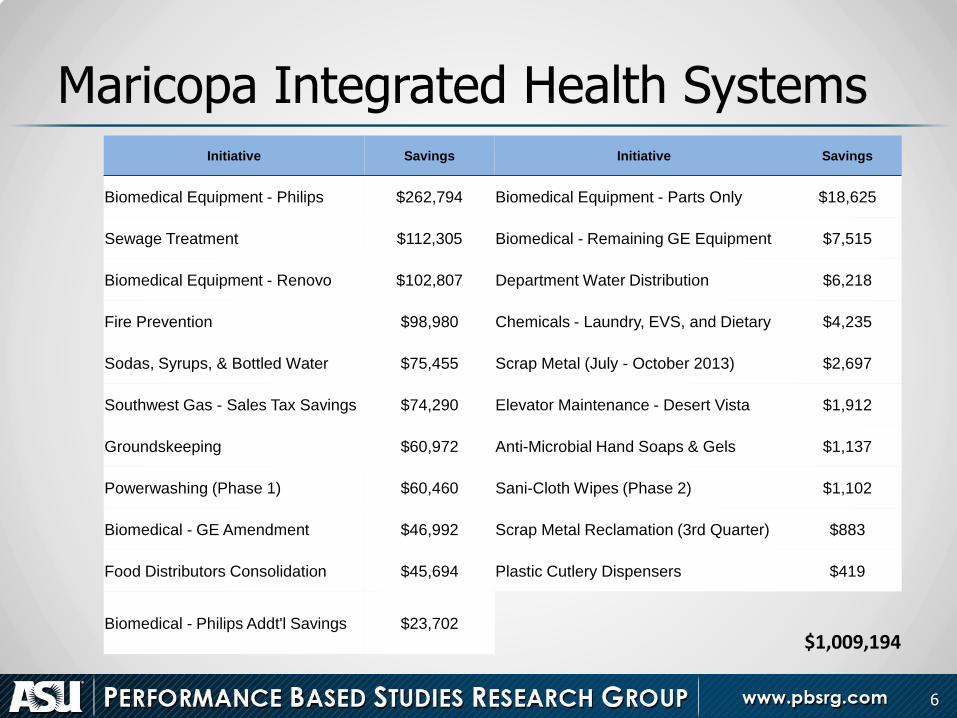
Maricopa Integrated Health Systems Initiative Savings Initiative Savings
Biomedical Equipment - Philips $262,794 Biomedical Equipment - Parts Only $18,625
Sewage Treatment $112,305 Biomedical - Remaining GE Equipment $7,515
Biomedical Equipment - Renovo $102,807 Department Water Distribution $6,218
Fire Prevention $98,980 Chemicals - Laundry, EVS, and Dietary $4,235
Sodas, Syrups, & Bottled Water $75,455 Scrap Metal (July - October 2013) $2,697
Southwest Gas - Sales Tax Savings $74,290 Elevator Maintenance - Desert Vista $1,912
Groundskeeping $60,972 Anti-Microbial Hand Soaps & Gels $1,137
Powerwashing (Phase 1) $60,460 Sani-Cloth Wipes (Phase 2) $1,102
Biomedical - GE Amendment $46,992 Scrap Metal Reclamation (3rd Quarter) $883
Food Distributors Consolidation $45,694 Plastic Cutlery Dispensers $419
Biomedical - Philips Addt'l Savings $23,702
$1,009,194
6
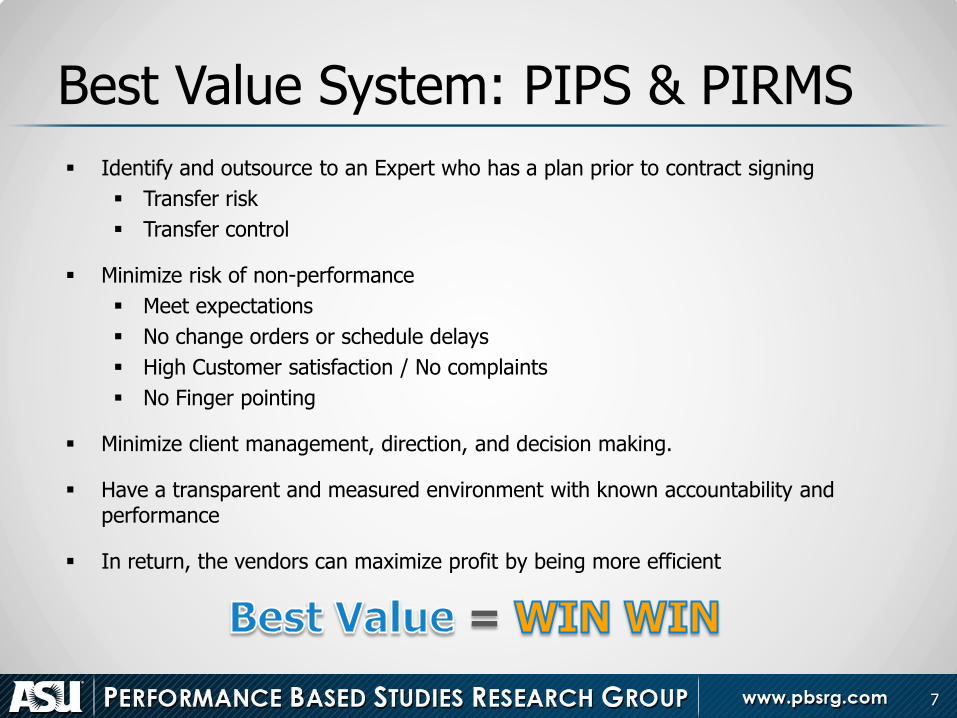
Best Value System: PIPS & PIRMS
7
Identify and outsource to an Expert who has a plan prior to contract signing
Transfer risk
Transfer control
Minimize risk of non-performance
Meet expectations
No change orders or schedule delays
High Customer satisfaction / No complaints
No Finger pointing
Minimize client management, direction, and decision making.
Have a transparent and measured environment with known accountability and performance
In return, the vendors can maximize profit by being more efficient
=
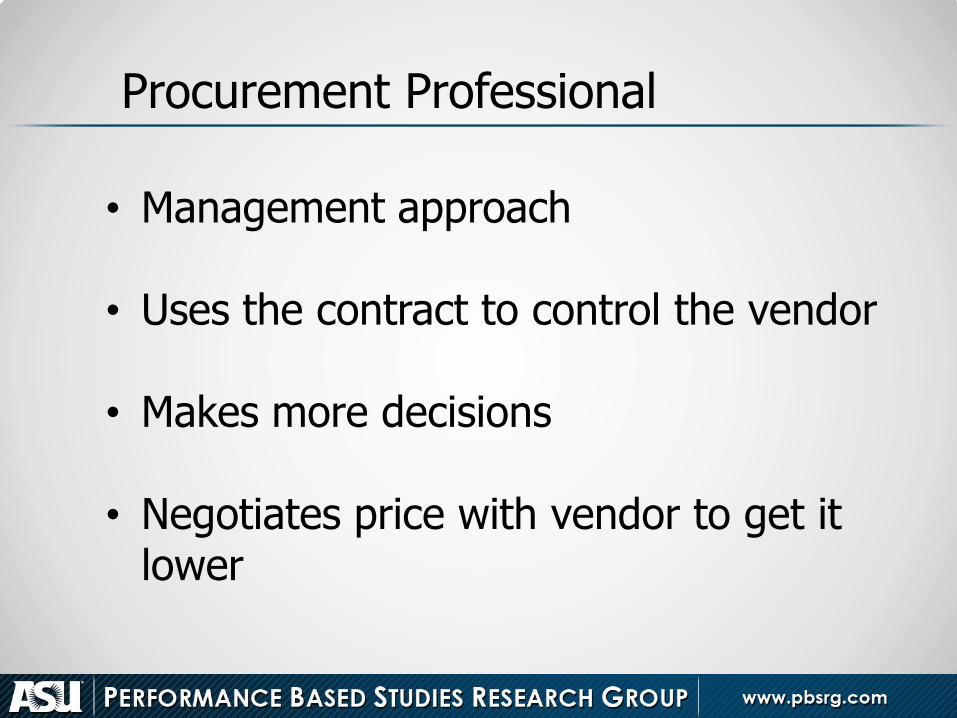
Procurement Professional
• Management approach • Uses the contract to control the vendor
• Makes more decisions
• Negotiates price with vendor to get it
lower
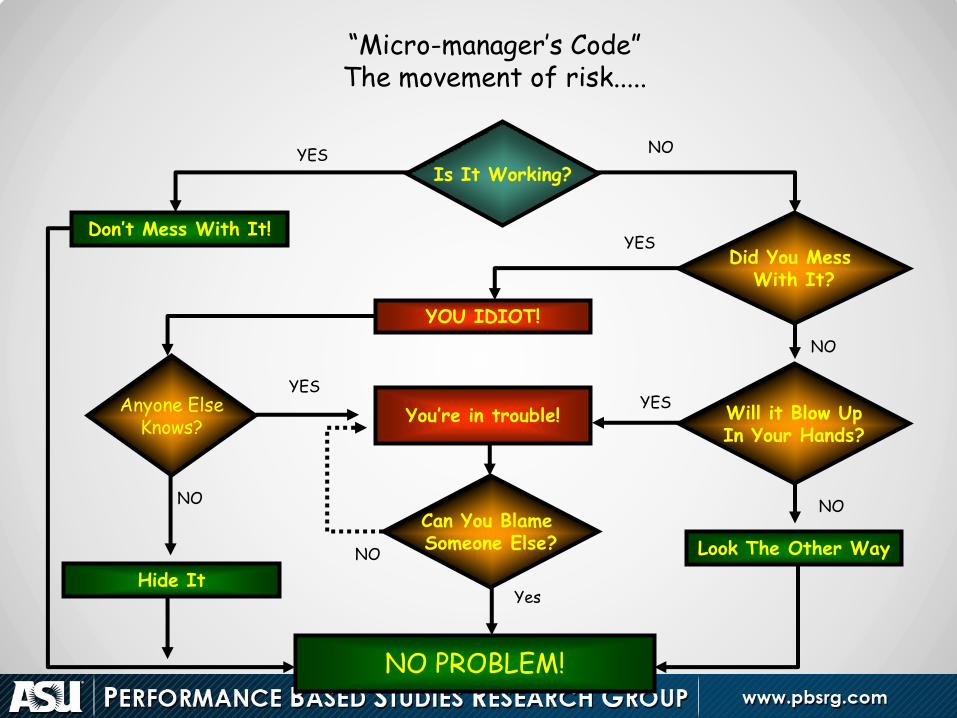
“Micro-manager’s Code” The movement of risk.....
Don’t Mess With It!
YES NO
YES
YOU IDIOT!
NO
Will it Blow Up In Your Hands?
NO
Look The Other Way
Anyone Else Knows?
You’re in trouble! YES
YES
NO
Hide It
Can You Blame Someone Else?
NO
NO PROBLEM!
Yes
Is It Working?
Did You Mess With It?
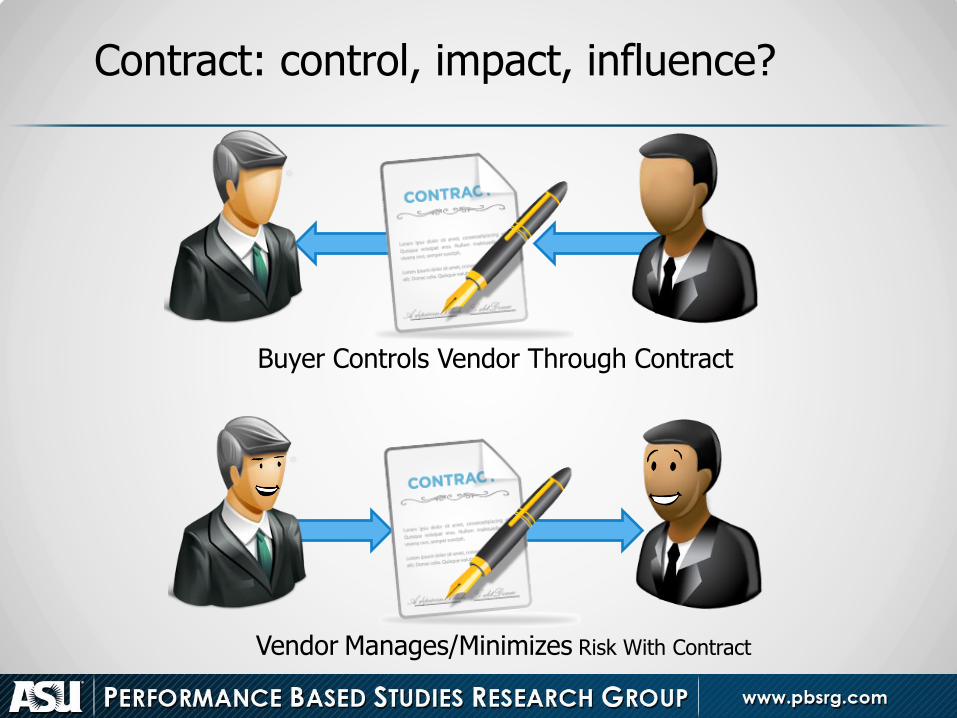
Vendor Manages/Minimizes Risk With Contract
Buyer Controls Vendor Through Contract
Contract: control, impact, influence?
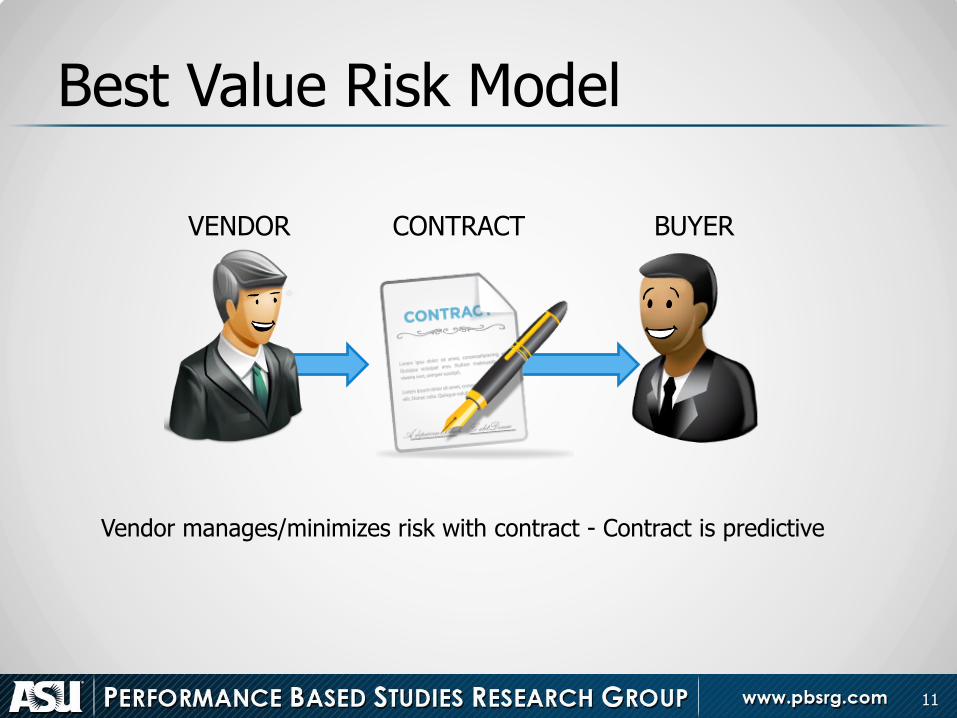
Best Value Risk Model
11
Vendor manages/minimizes risk with contract - Contract is predictive
VENDOR CONTRACT BUYER
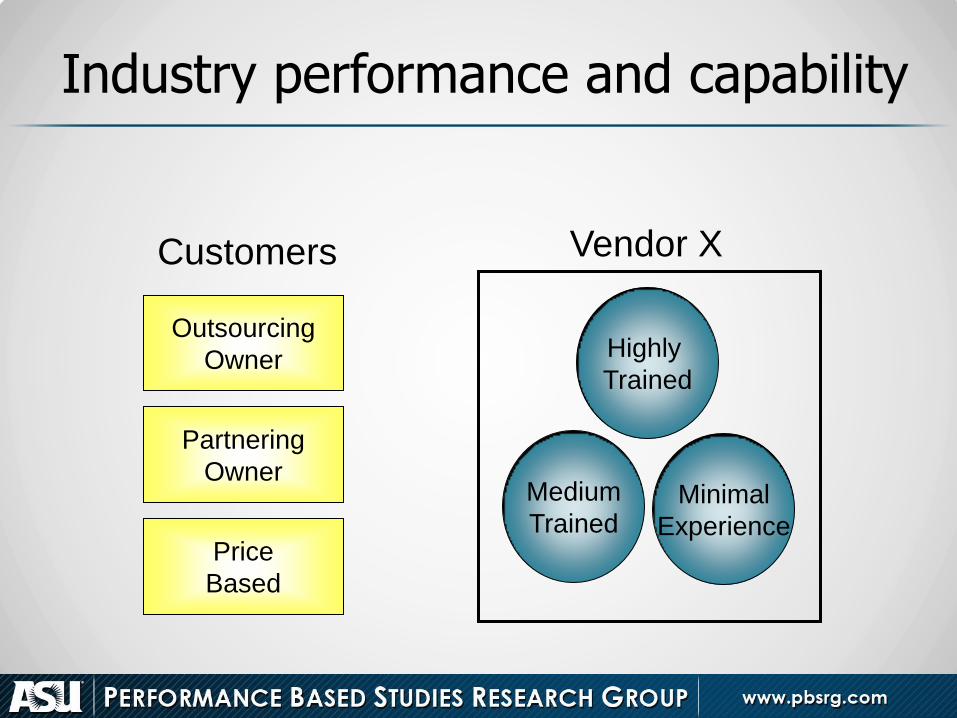
Industry performance and capability
Highly
Trained
Medium
Trained
Vendor X Customers
Outsourcing
Owner
Partnering
Owner
Price
Based
Minimal
Experience
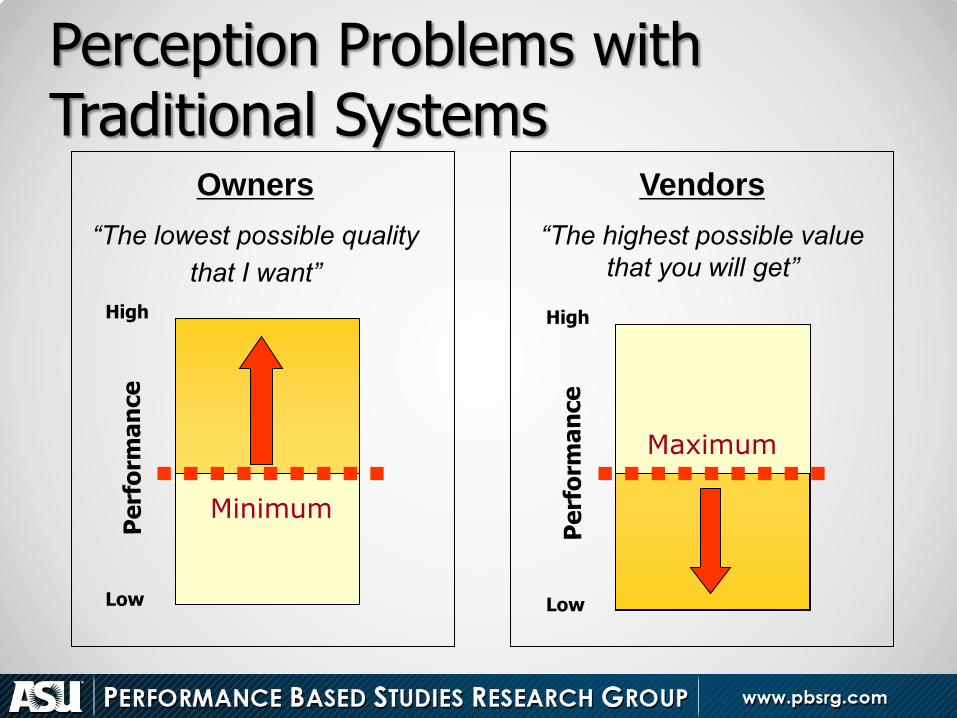
High
Low
Owners
“The lowest possible quality
that I want”
Vendors
“The highest possible value
that you will get”
Minimum
Perception Problems with Traditional Systems
High
Low
Maximum
14
15

Best Value Project Objectives
16
PHASE 1 PHASE 2 PHASE 3
Financial Proposal Past Performance Risk Assessment Value Assessment Interviews Demonstrations Other Requirements
Award Weekly Reporting Post Award Metrics Final Documentation Update PPI
One Vendor Detailed Project Plan Risks Minimized Project Schedule Measurement System
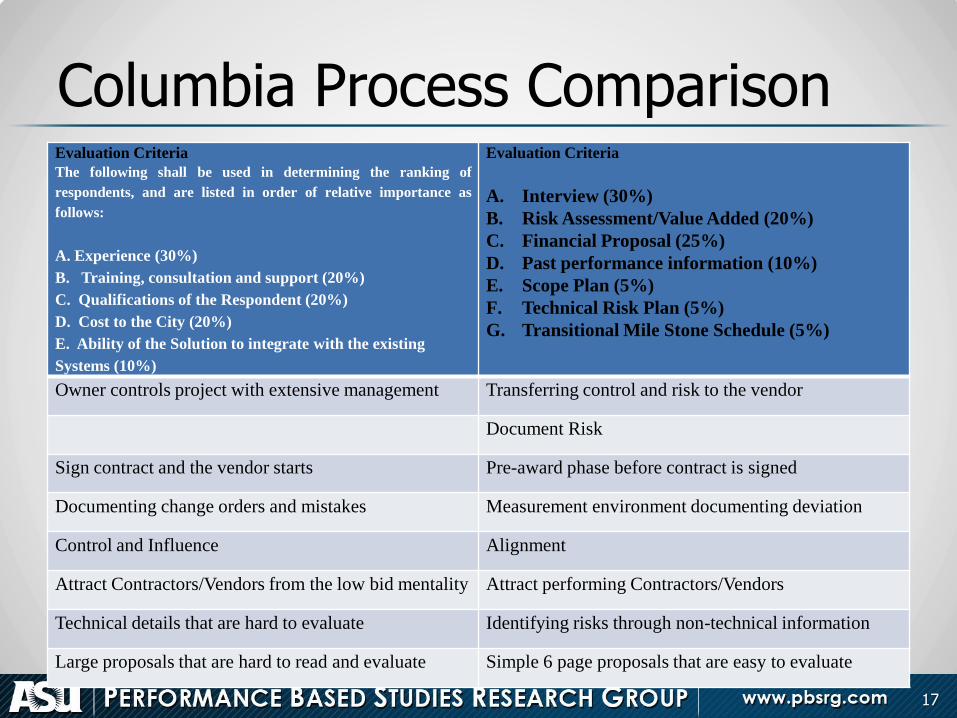
Columbia Process Comparison Evaluation Criteria
The following shall be used in determining the ranking of
respondents, and are listed in order of relative importance as
follows:
A. Experience (30%)
B. Training, consultation and support (20%)
C. Qualifications of the Respondent (20%)
D. Cost to the City (20%)
E. Ability of the Solution to integrate with the existing
Systems (10%)
Evaluation Criteria
A. Interview (30%)
B. Risk Assessment/Value Added (20%)
C. Financial Proposal (25%)
D. Past performance information (10%)
E. Scope Plan (5%)
F. Technical Risk Plan (5%)
G. Transitional Mile Stone Schedule (5%)
Owner controls project with extensive management Transferring control and risk to the vendor
Document Risk
Sign contract and the vendor starts Pre-award phase before contract is signed
Documenting change orders and mistakes Measurement environment documenting deviation
Control and Influence Alignment
Attract Contractors/Vendors from the low bid mentality Attract performing Contractors/Vendors
Technical details that are hard to evaluate Identifying risks through non-technical information
Large proposals that are hard to read and evaluate Simple 6 page proposals that are easy to evaluate
17
18
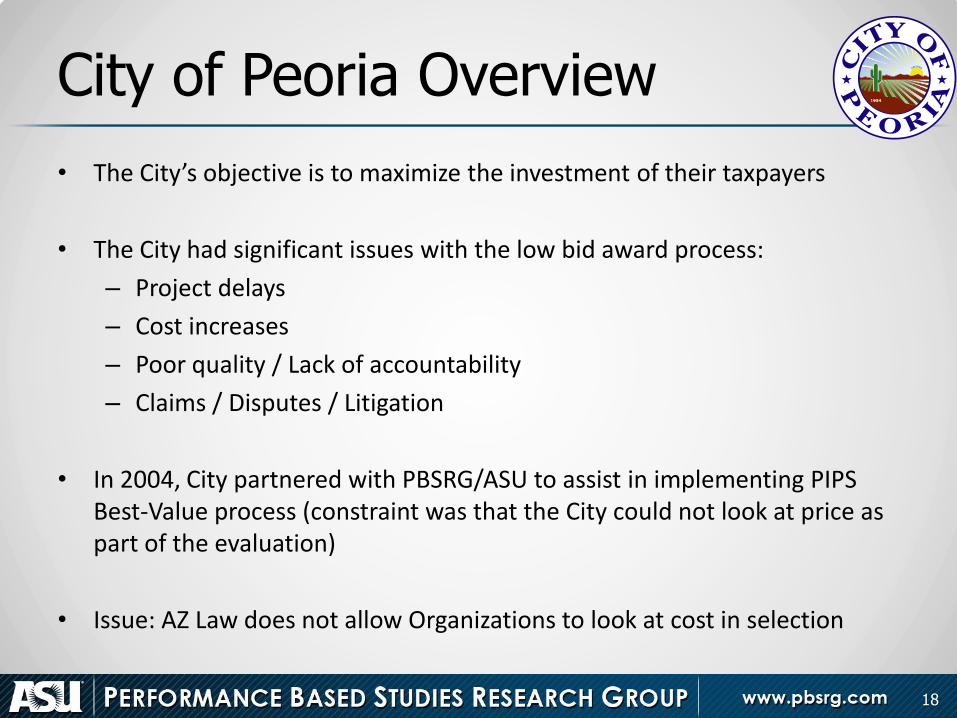
City of Peoria Overview
• The City’s objective is to maximize the investment of their taxpayers
• The City had significant issues with the low bid award process:
– Project delays
– Cost increases
– Poor quality / Lack of accountability
– Claims / Disputes / Litigation
• In 2004, City partnered with PBSRG/ASU to assist in implementing PIPS Best-Value process (constraint was that the City could not look at price as part of the evaluation)
• Issue: AZ Law does not allow Organizations to look at cost in selection
19
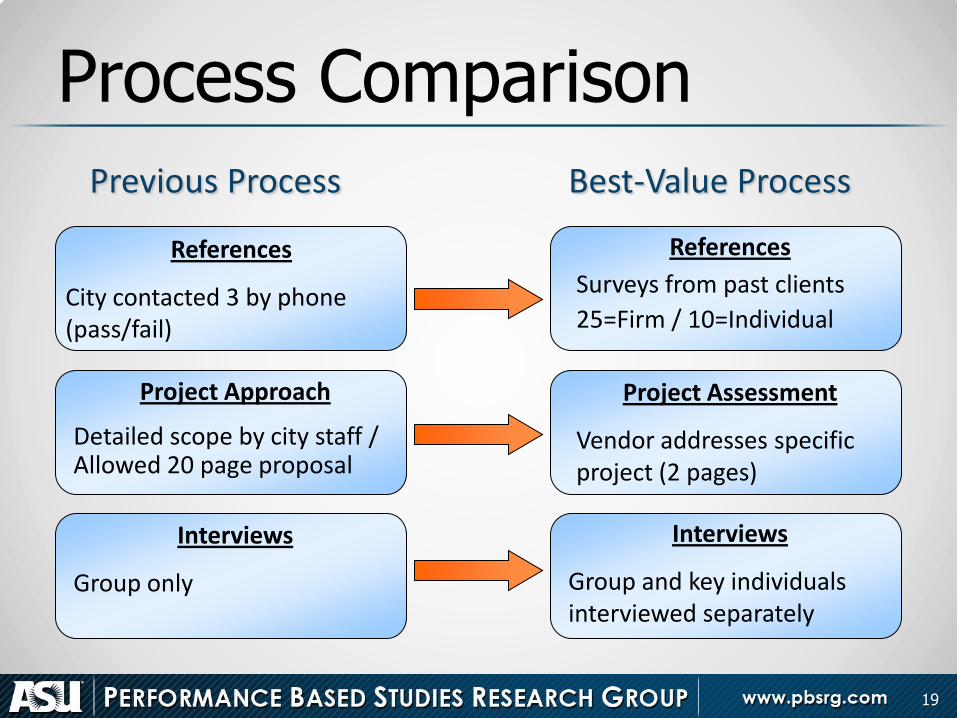
Process Comparison
Best-Value Process Previous Process
Interviews
Group and key individuals interviewed separately
References
Surveys from past clients
25=Firm / 10=Individual
References
City contacted 3 by phone (pass/fail)
Interviews
Group only
Project Approach
Detailed scope by city staff / Allowed 20 page proposal
Project Assessment
Vendor addresses specific project (2 pages)
20 20
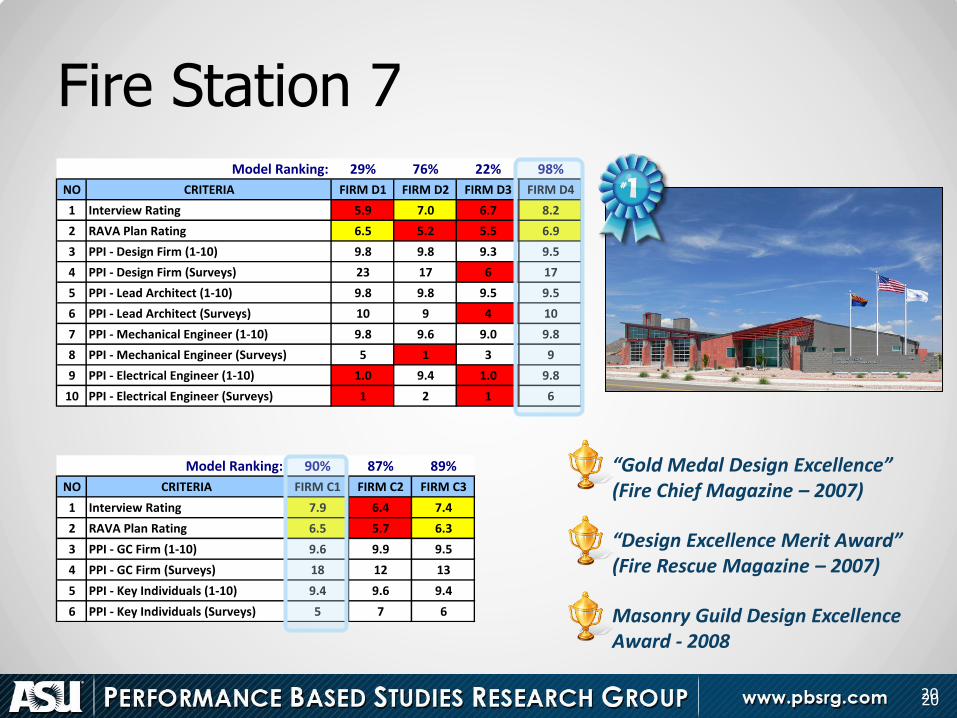
Model Ranking: 90% 87% 89%
NO CRITERIA FIRM C1 FIRM C2 FIRM C3
1 Interview Rating 7.9 6.4 7.4
2 RAVA Plan Rating 6.5 5.7 6.3
3 PPI - GC Firm (1-10) 9.6 9.9 9.5
4 PPI - GC Firm (Surveys) 18 12 13
5 PPI - Key Individuals (1-10) 9.4 9.6 9.4
6 PPI - Key Individuals (Surveys) 5 7 6
Model Ranking: 29% 76% 22% 98%
NO CRITERIA FIRM D1 FIRM D2 FIRM D3 FIRM D4
1 Interview Rating 5.9 7.0 6.7 8.2
2 RAVA Plan Rating 6.5 5.2 5.5 6.9
3 PPI - Design Firm (1-10) 9.8 9.8 9.3 9.5
4 PPI - Design Firm (Surveys) 23 17 6 17
5 PPI - Lead Architect (1-10) 9.8 9.8 9.5 9.5
6 PPI - Lead Architect (Surveys) 10 9 4 10
7 PPI - Mechanical Engineer (1-10) 9.8 9.6 9.0 9.8
8 PPI - Mechanical Engineer (Surveys) 5 1 3 9
9 PPI - Electrical Engineer (1-10) 1.0 9.4 1.0 9.8
10 PPI - Electrical Engineer (Surveys) 1 2 1 6
Fire Station 7
“Gold Medal Design Excellence” (Fire Chief Magazine – 2007)
“Design Excellence Merit Award” (Fire Rescue Magazine – 2007)
Masonry Guild Design Excellence Award - 2008
21
Summary • PIPS has significantly increased performance
• Tested on Construction and Non-Construction Services
• Core Group has been aggressive, but has spent time to be educated
• Research Results
– Do not increase RAVA Plan page limit
– Interview all critical personnel / Interview separately
– PPI should be used to place vendor at risk
• Procurement time has decreased (evaluating 2-pages instead of 20 pages)
• Projects have been some of the best Peoria has ever seen
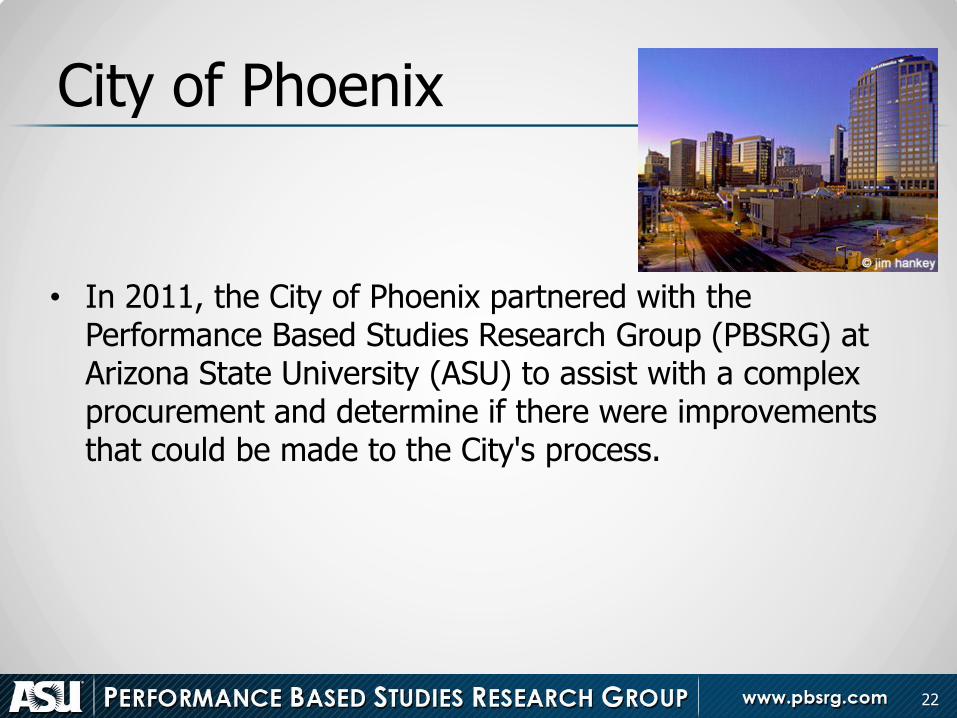
City of Phoenix
• In 2011, the City of Phoenix partnered with the Performance Based Studies Research Group (PBSRG) at Arizona State University (ASU) to assist with a complex procurement and determine if there were improvements that could be made to the City's process.
22
Materials Recovery Facility’s
• The first pilot project
• Operation and maintenance of their two Materials Recovery Facility’s (MRF) Process System and Marketing of Recovered Materials.
23
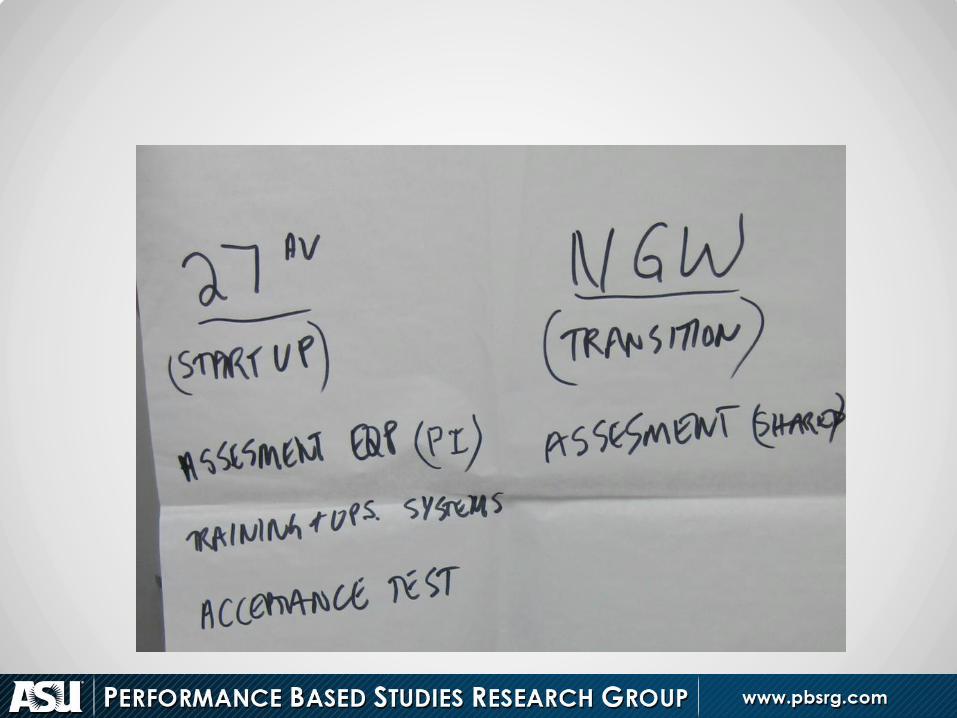
RFP 11-011 • The City of Phoenix Public Works Department
owns two Materials Recovery Facilities (MRFs) used to process single stream recyclable materials collected from City of Phoenix residents, city buildings, institutions, and other sources. This process will procure an operator for both facilities and will result in two operating agreements with one or more contractors.
24
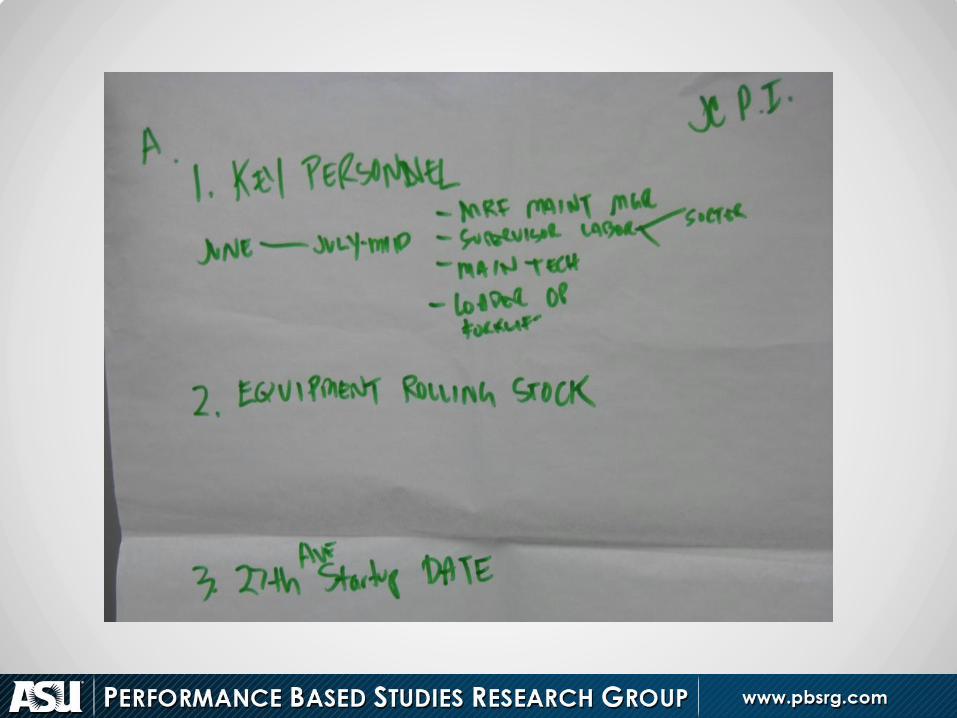
MRF
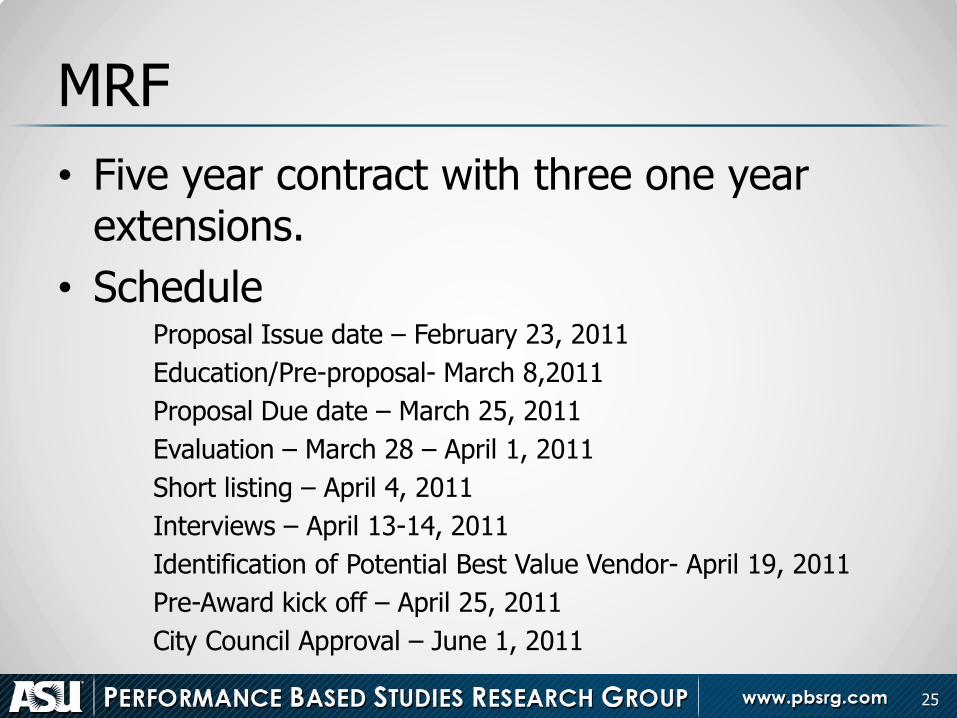
• Five year contract with three one year extensions.
• Schedule Proposal Issue date – February 23, 2011
Education/Pre-proposal- March 8,2011
Proposal Due date – March 25, 2011
Evaluation – March 28 – April 1, 2011
Short listing – April 4, 2011
Interviews – April 13-14, 2011
Identification of Potential Best Value Vendor- April 19, 2011
Pre-Award kick off – April 25, 2011
City Council Approval – June 1, 2011
25
State of Idaho
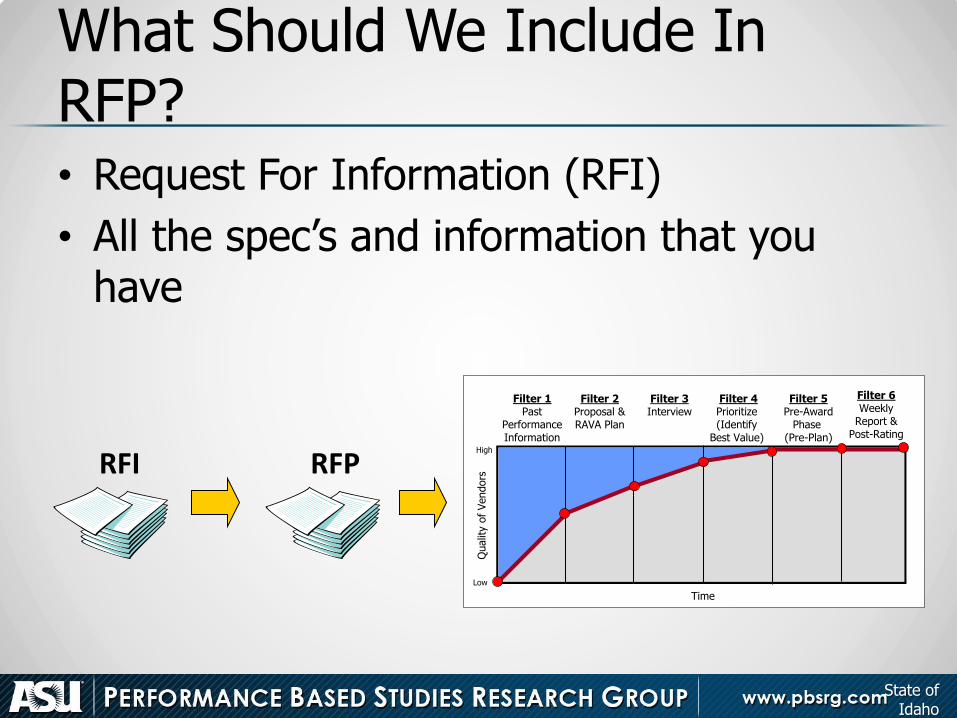
What Should We Include In RFP? • Request For Information (RFI)
• All the spec’s and information that you have
Filter 1
PastPerformanceInformation
Filter 2Proposal & RAVA Plan
Filter 4Prioritize (Identify
Best Value)
Filter 5Pre-Award
Phase (Pre-Plan)
Filter 6Weekly
Report &Post-Rating
Time
Qualit
y o
f Vendors
Filter 3Interview
High
Low
RFI RFP
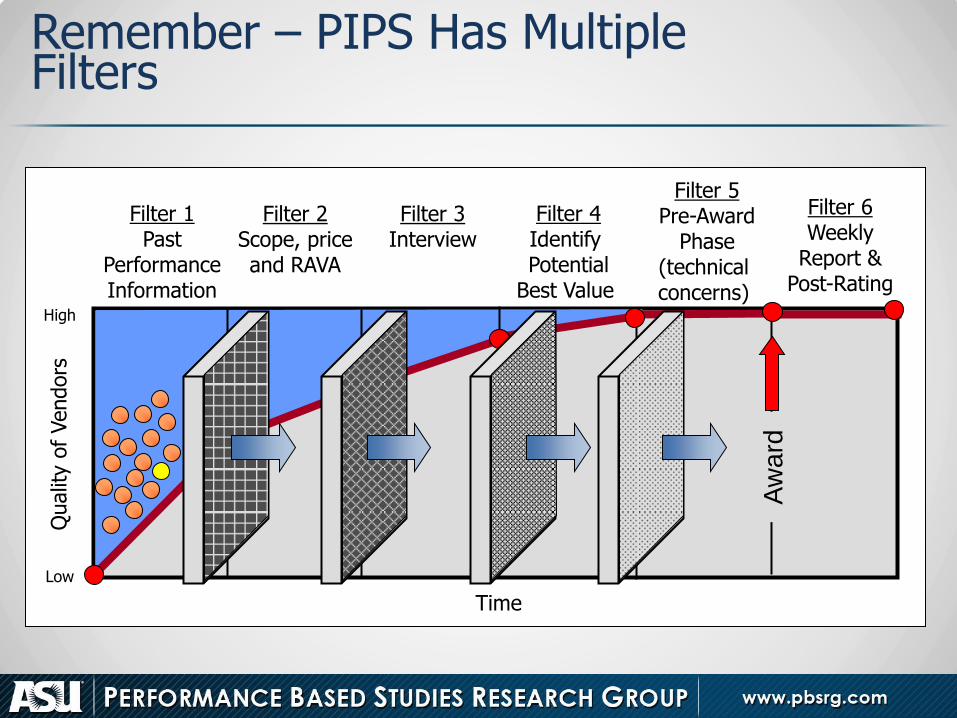
Filter 1 Past
Performance Information
Filter 2 Scope, price and RAVA
Filter 4 Identify Potential
Best Value
Filter 5 Pre-Award
Phase (technical concerns)
Filter 6 Weekly
Report & Post-Rating
Time
Qualit
y o
f Vendors
Filter 3 Interview
Aw
ard
High
Low
Remember – PIPS Has Multiple Filters
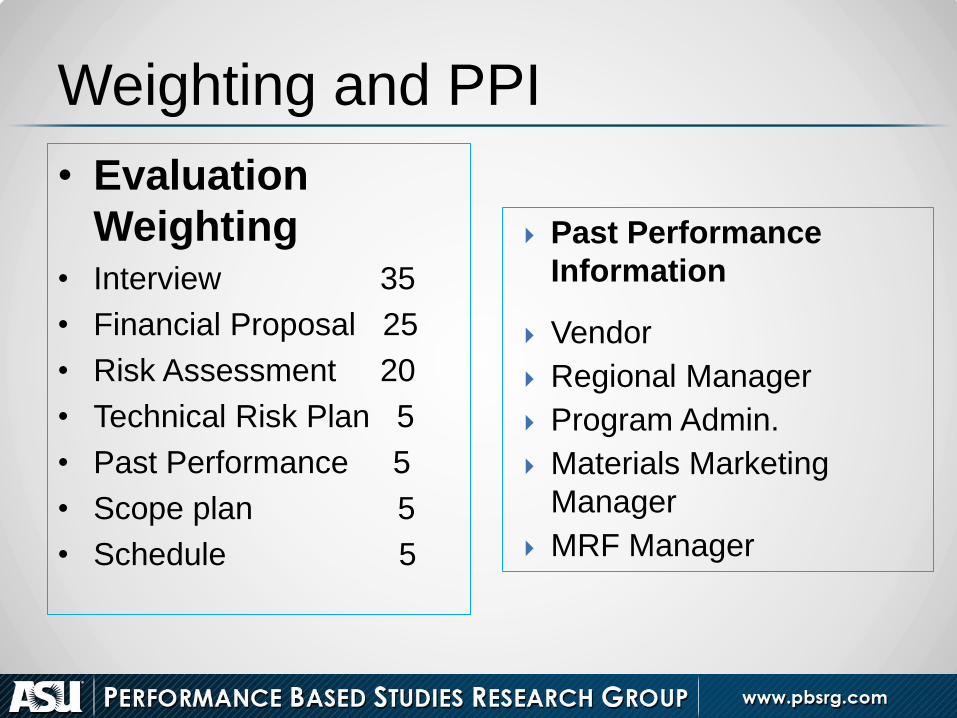
• Evaluation
Weighting • Interview 35
• Financial Proposal 25
• Risk Assessment 20
• Technical Risk Plan 5
• Past Performance 5
• Scope plan 5
• Schedule 5
Weighting and PPI
Past Performance
Information
Vendor
Regional Manager
Program Admin.
Materials Marketing
Manager
MRF Manager
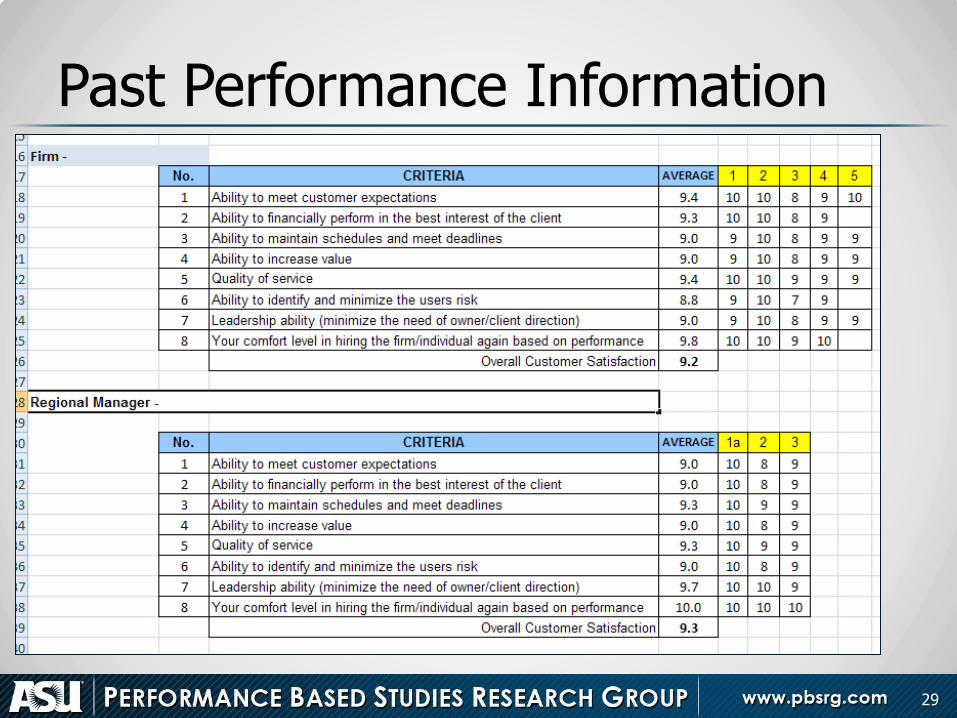
Past Performance Information
29
30 30
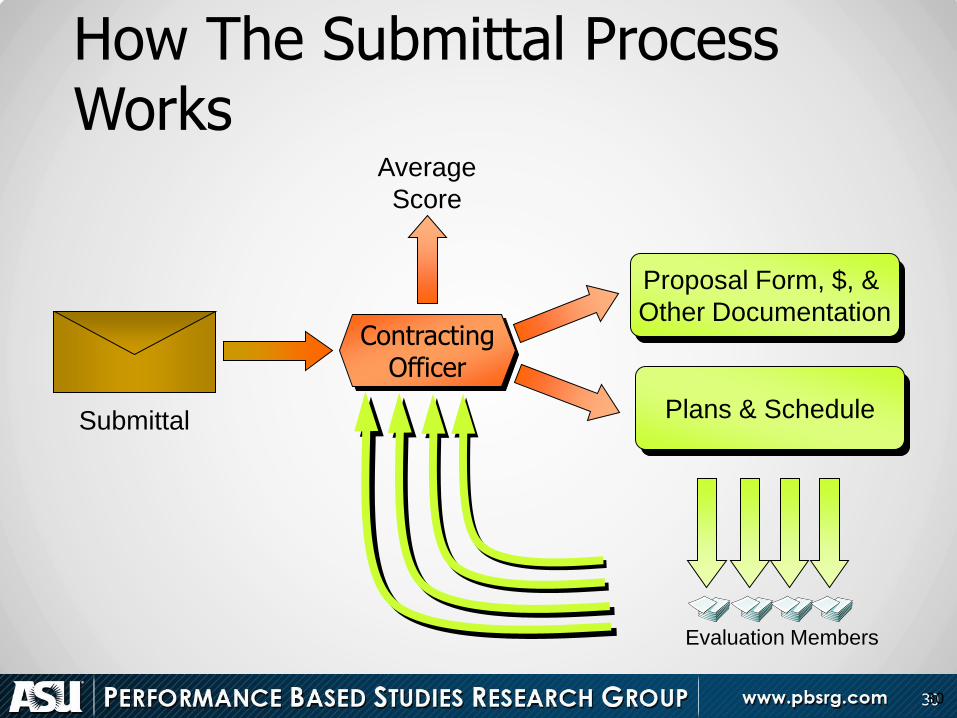
How The Submittal Process Works
Submittal
Evaluation Members
Proposal Form (1 page)
Proposal Form, $, &
Other Documentation
Proposal Form (1 page)
Plans & Schedule
Average
Score
Contracting Officer
Contracting Officer
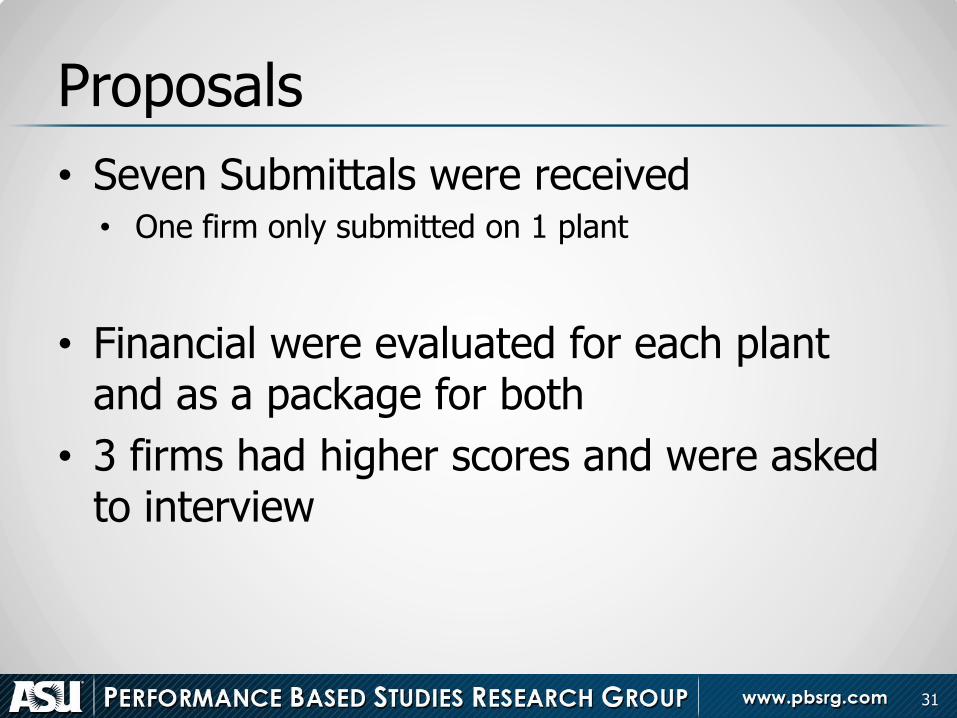
Proposals
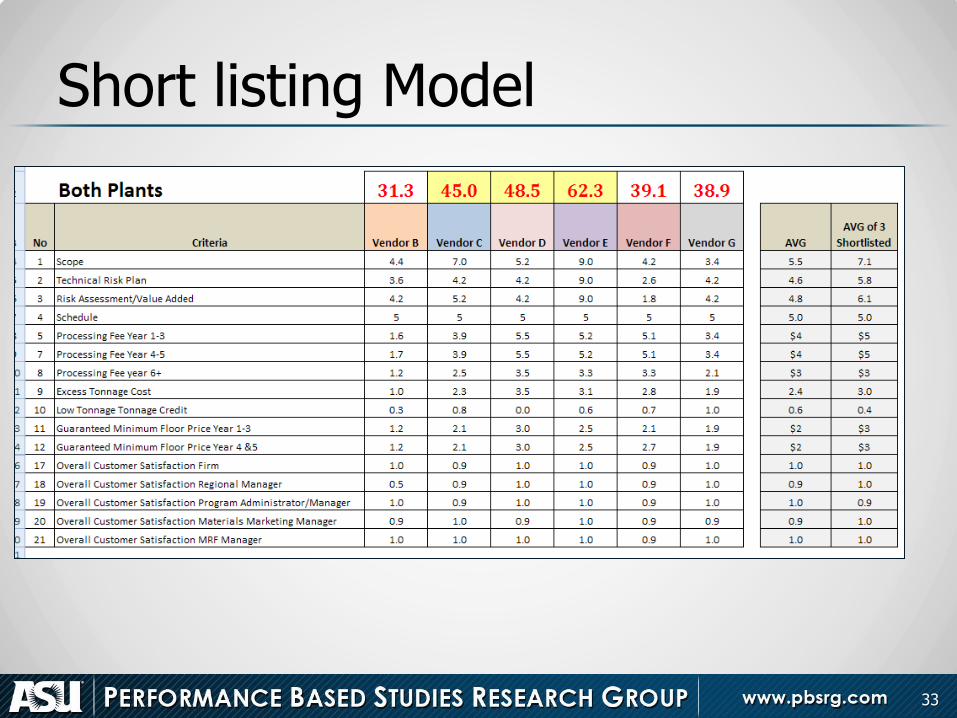
• Seven Submittals were received • One firm only submitted on 1 plant
• Financial were evaluated for each plant and as a package for both
• 3 firms had higher scores and were asked to interview
31
32
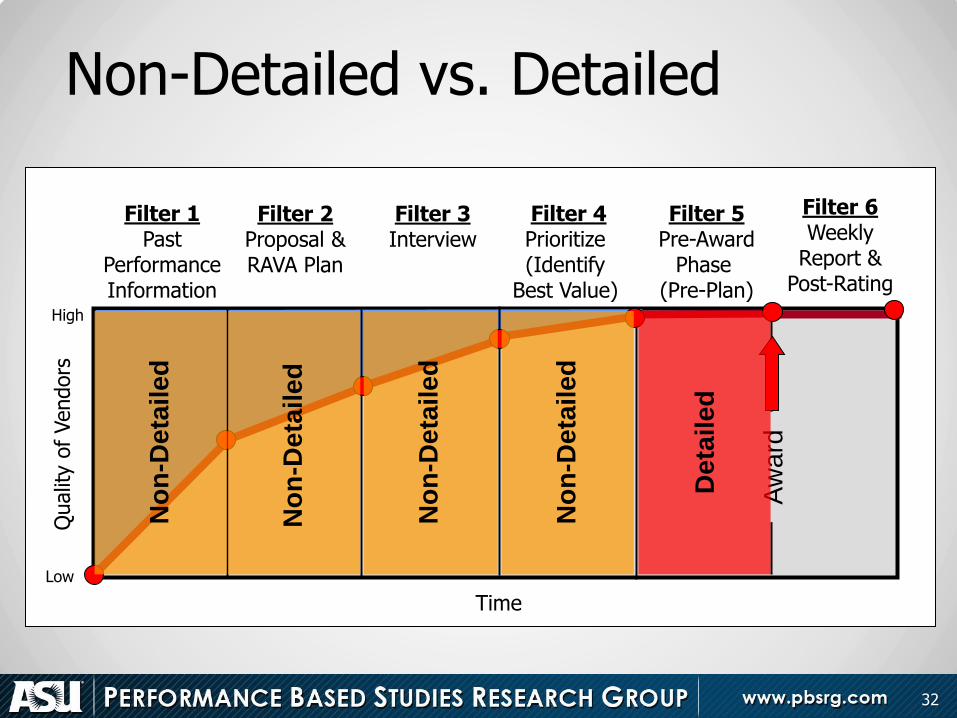
Filter 1 Past
Performance Information
Filter 2 Proposal & RAVA Plan
Filter 4 Prioritize (Identify
Best Value)
Filter 5 Pre-Award
Phase (Pre-Plan)
Filter 6 Weekly
Report & Post-Rating
Time
Qualit
y o
f Vendors
Filter 3 Interview
Aw
ard
High
Low
Non-Detailed vs. Detailed
No
n-D
eta
ile
d
No
n-D
eta
ile
d
No
n-D
eta
ile
d
No
n-D
eta
ile
d
De
taile
d
Short listing Model
33
Interviews • Interviewed actual team members
involved in operations
• There was a clear 6 points between the 3rd and 4th place firms
• Although Firm D scored slightly higher on interviews, several areas of concern were also revealed.
34
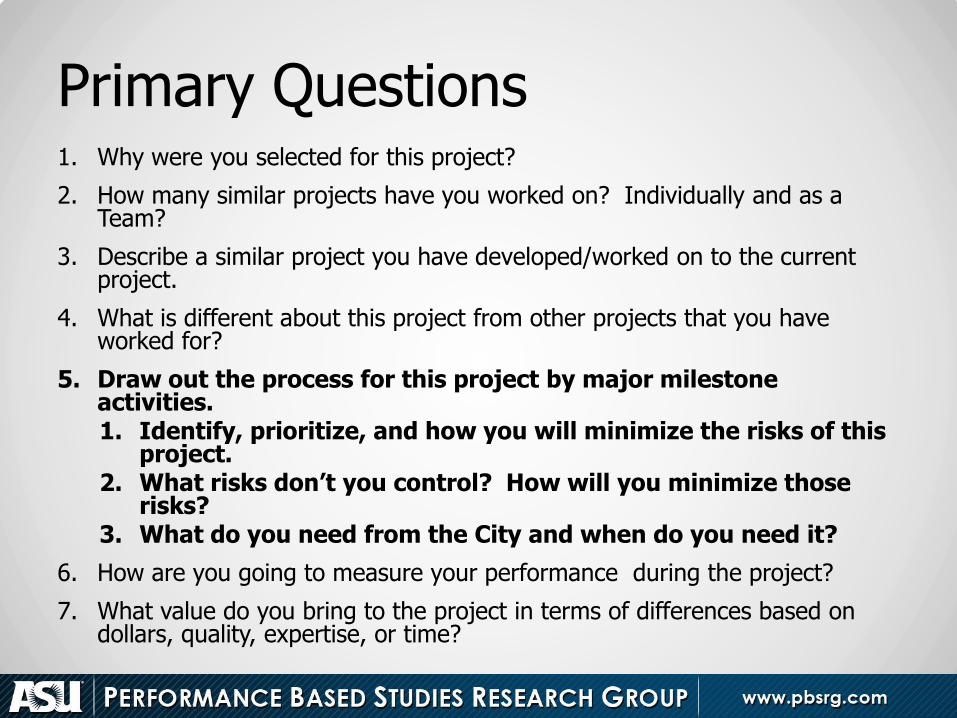
Primary Questions 1. Why were you selected for this project?
2. How many similar projects have you worked on? Individually and as a Team?
3. Describe a similar project you have developed/worked on to the current project.
4. What is different about this project from other projects that you have worked for?
5. Draw out the process for this project by major milestone activities. 1. Identify, prioritize, and how you will minimize the risks of this
project. 2. What risks don’t you control? How will you minimize those
risks? 3. What do you need from the City and when do you need it?
6. How are you going to measure your performance during the project?
7. What value do you bring to the project in terms of differences based on dollars, quality, expertise, or time?
39
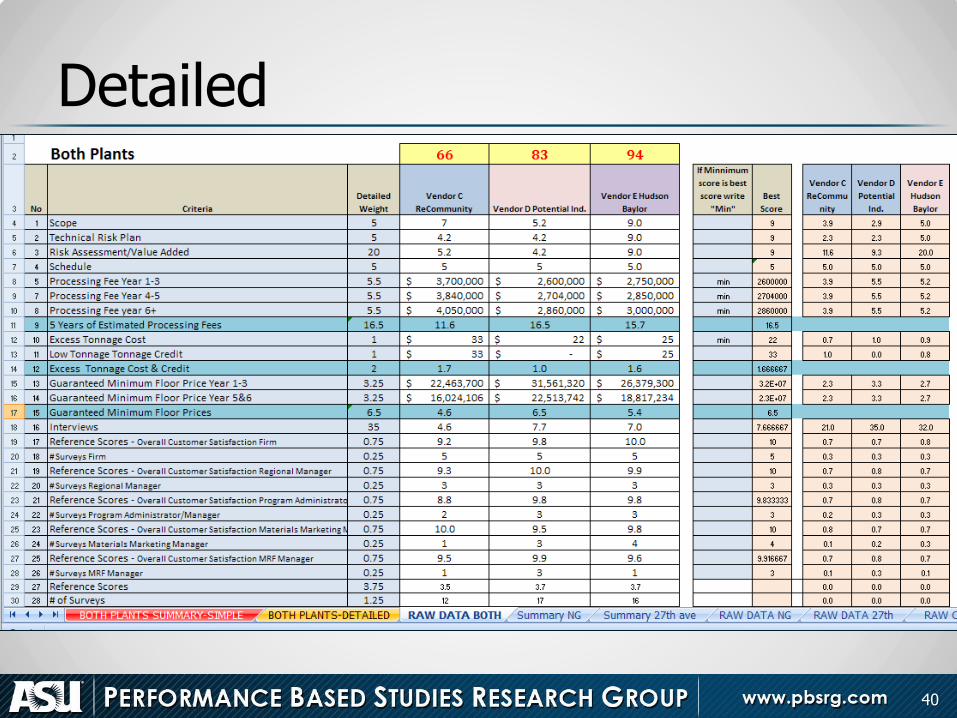
Detailed
40
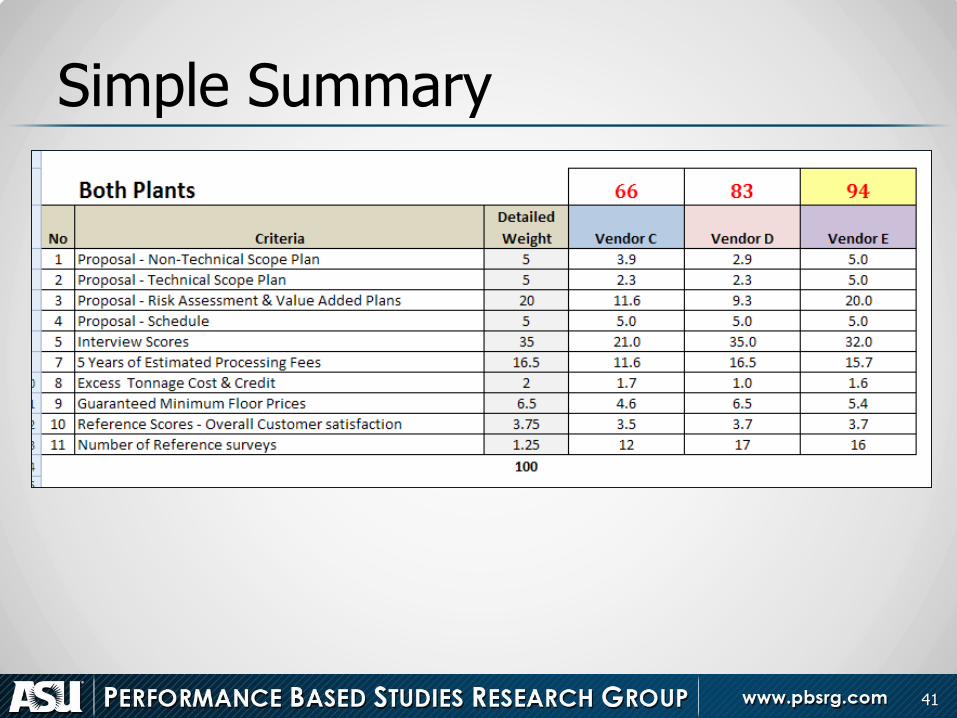
Simple Summary
41
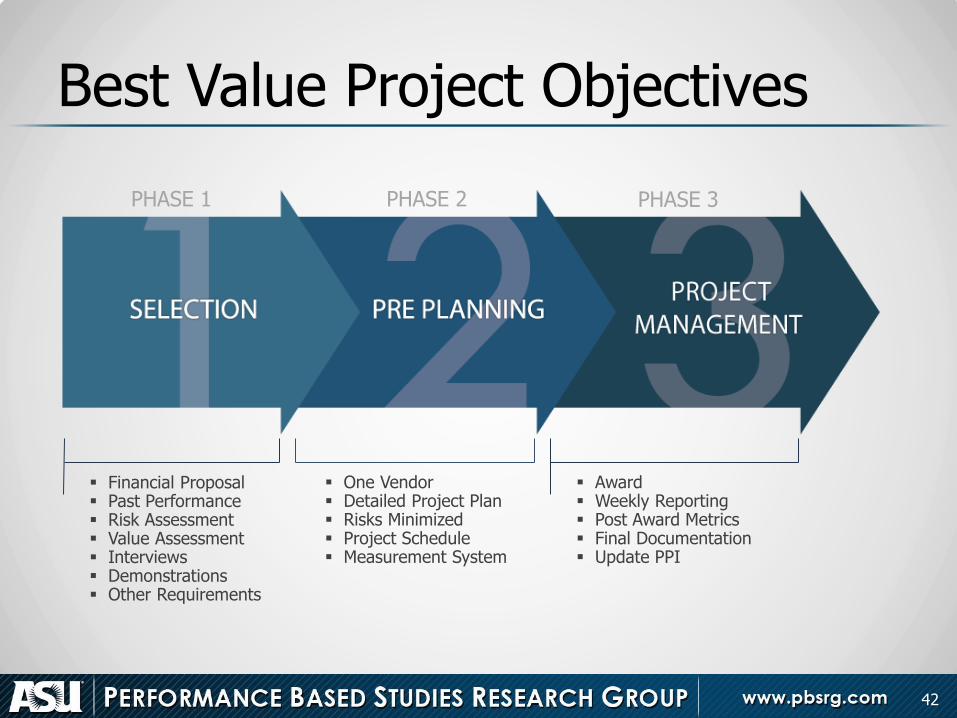
Best Value Project Objectives
42
PHASE 1 PHASE 2 PHASE 3
Financial Proposal Past Performance Risk Assessment Value Assessment Interviews Demonstrations Other Requirements
Award Weekly Reporting Post Award Metrics Final Documentation Update PPI
One Vendor Detailed Project Plan Risks Minimized Project Schedule Measurement System
43 43
Pre Award Period What is it / Why is it important
• Period of time allotted to potential best value vendor (aka the Expert) to:
– Think about and preplan the project
– Set a plan for its delivery / clarify that your proposal is accurate
– Identify the risks and issues that could cause the plan to deviate
• Identify what you don’t know and when you will know it and how the plan could change based upon what you discover
• Set plans to minimize those risks from occurring
• Address all the concerns and risks of the client
44
Pre Award Document (Risk Management Plan)
1. Scope & Project/Effort Plan • Clear and Detailed Project Scope (what is and what is not
included) – Set Baseline Expectation
2. Cost or Financial Model
3. Milestone schedule (linked to performance benchmarks)
4. Risk Minimization Plan • Uncontrolled Risks List
– A list of Risks Proposer does not control with plans to minimize
• Identified Risks List – A list of all previously identified risks (by other bidders,
user, and client) with plans to minimize
45
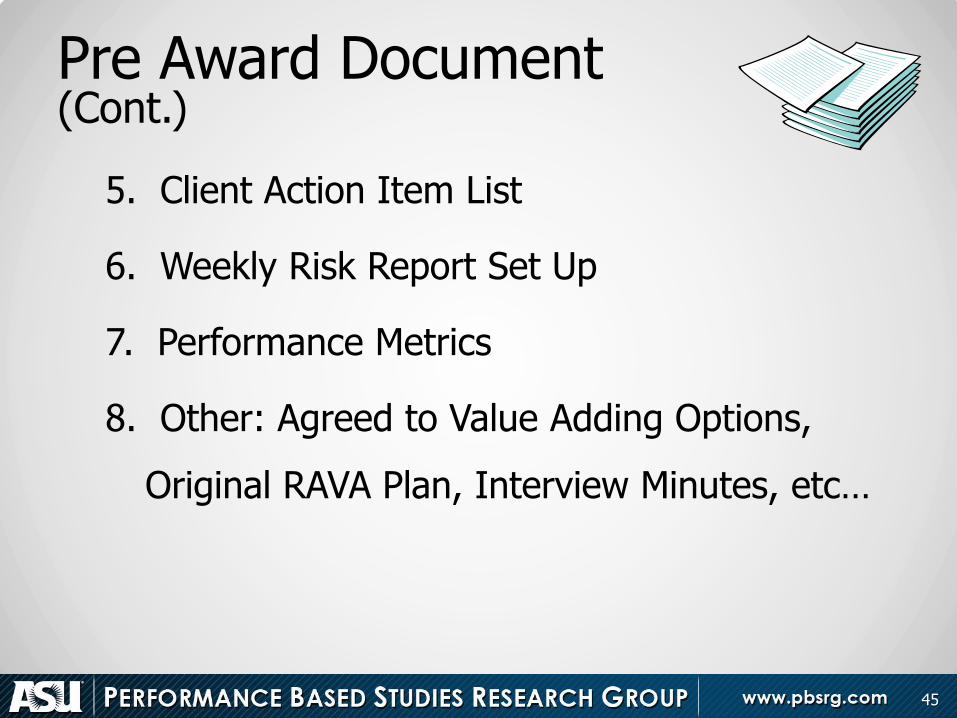
Pre Award Document (Cont.)
5. Client Action Item List
6. Weekly Risk Report Set Up
7. Performance Metrics
8. Other: Agreed to Value Adding Options,
Original RAVA Plan, Interview Minutes, etc…
46
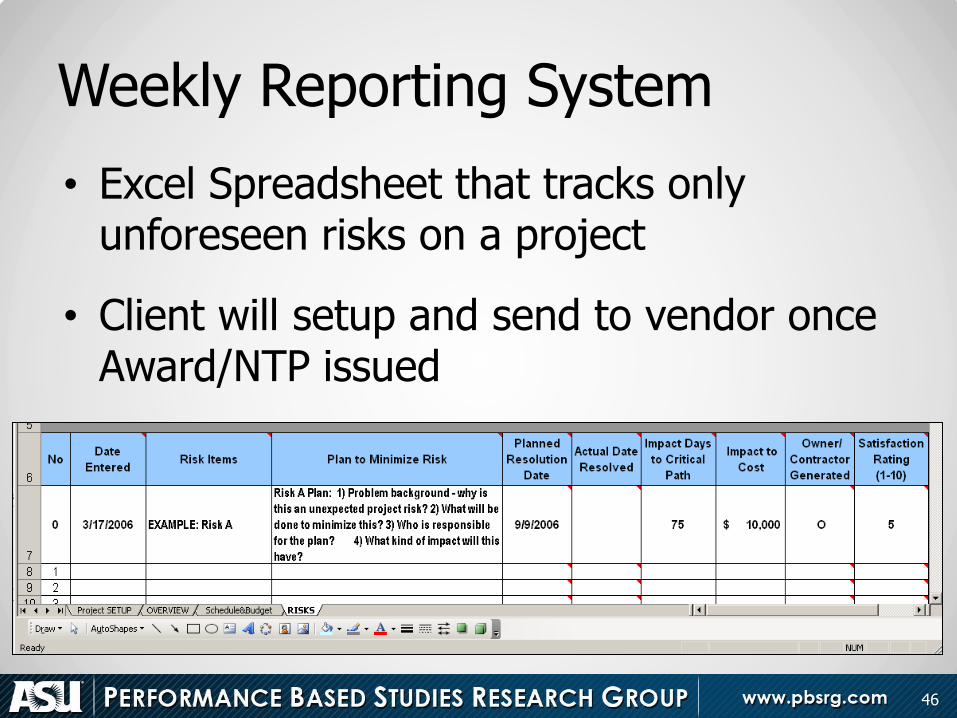
Weekly Reporting System
• Excel Spreadsheet that tracks only unforeseen risks on a project
• Client will setup and send to vendor once Award/NTP issued
• Vendor must submit the report every week (Friday).
• The final project rating will be impacted by the accuracy and timely submittal of the

Glendale Elementary School Dist
• Herbicides & Pesticides
– Detailed and specific
– Cafeteria
– Letter
47
ON-Semiconductor Waste Management
Case Study By Peggy Ferrin
• All work necessary to provide general
waste management, including recycling,
and document shredding
Project Scope
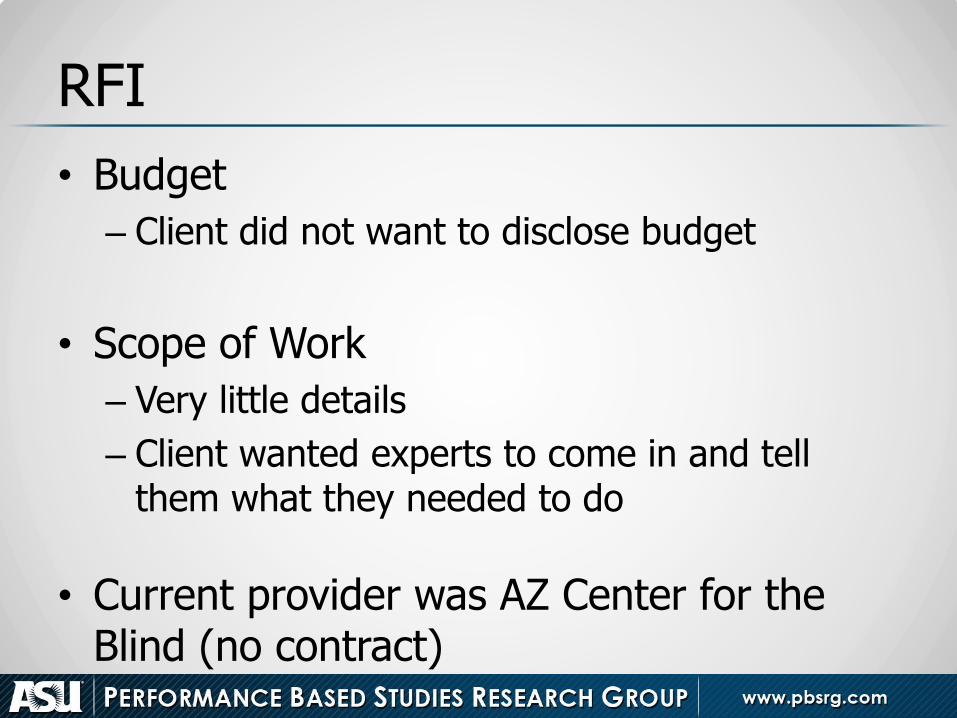
• Budget
– Client did not want to disclose budget
• Scope of Work
– Very little details
– Client wanted experts to come in and tell them what they needed to do
• Current provider was AZ Center for the Blind (no contract)
RFI
• Five vendors came to the Pre-proposal conference
• Three vendors proposed
• Interviewed all three firms
Submittals
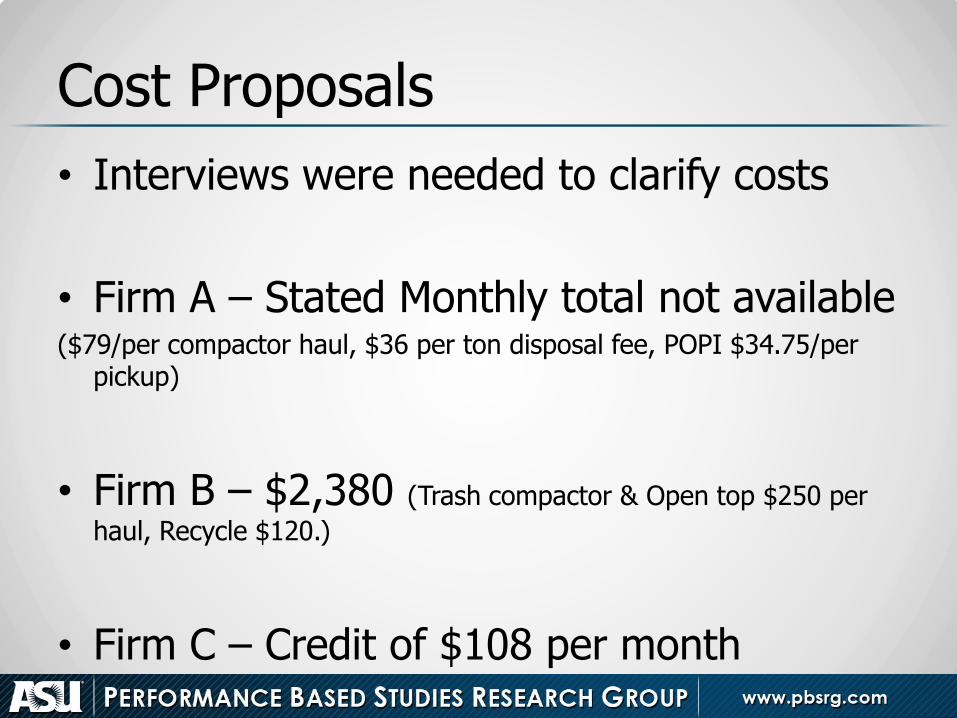
• Interviews were needed to clarify costs
• Firm A – Stated Monthly total not available ($79/per compactor haul, $36 per ton disposal fee, POPI $34.75/per
pickup)
• Firm B – $2,380 (Trash compactor & Open top $250 per
haul, Recycle $120.)
• Firm C – Credit of $108 per month
Cost Proposals
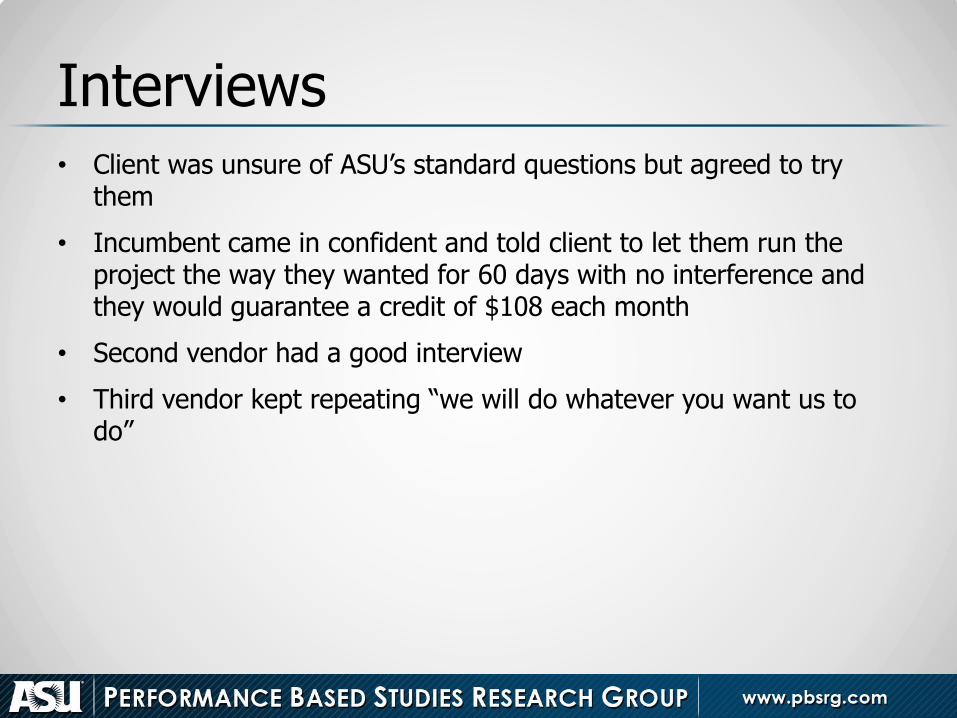
• Client was unsure of ASU’s standard questions but agreed to try them
• Incumbent came in confident and told client to let them run the project the way they wanted for 60 days with no interference and they would guarantee a credit of $108 each month
• Second vendor had a good interview
• Third vendor kept repeating “we will do whatever you want us to do”
Interviews
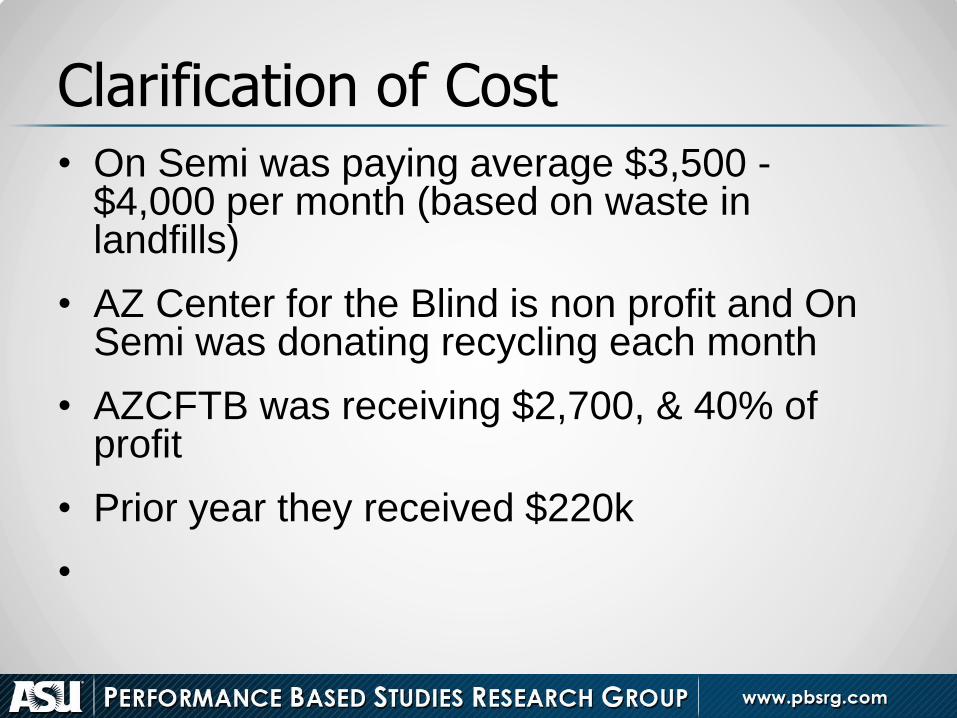
• On Semi was paying average $3,500 - $4,000 per month (based on waste in landfills)
• AZ Center for the Blind is non profit and On Semi was donating recycling each month
• AZCFTB was receiving $2,700, & 40% of profit
• Prior year they received $220k
•
Clarification of Cost
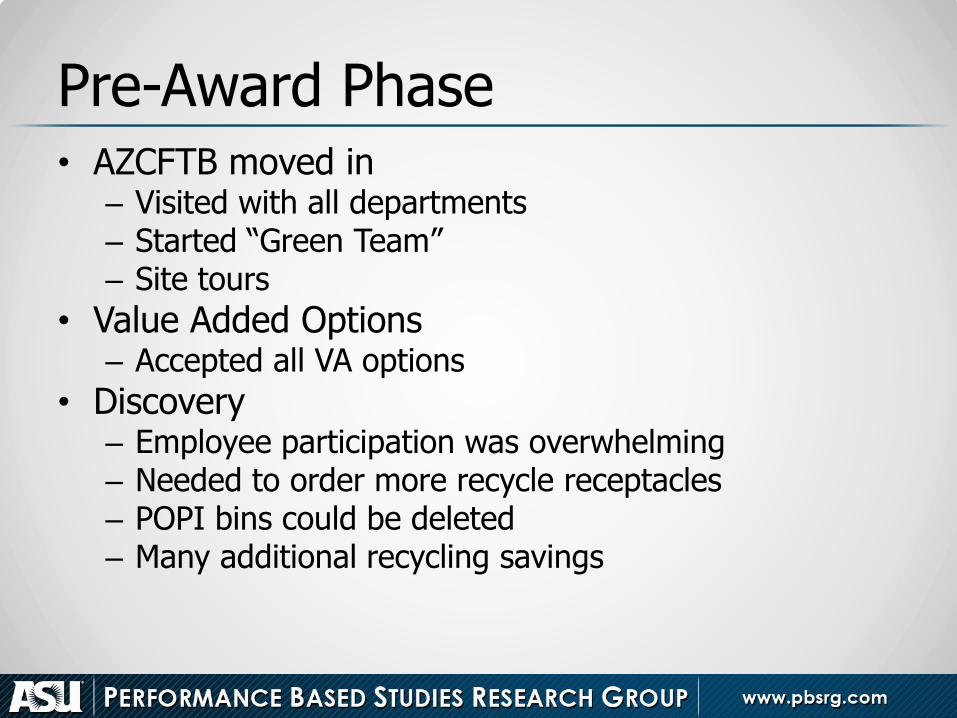
Pre-Award Phase • AZCFTB moved in
– Visited with all departments – Started “Green Team” – Site tours
• Value Added Options – Accepted all VA options
• Discovery – Employee participation was overwhelming – Needed to order more recycle receptacles – POPI bins could be deleted – Many additional recycling savings
• You need to know where you are before you can tell if you are improving (Measurements)
• Let the process run itself (Don’t Make decisions)
• Let the vendor be the Expert
Lessons learned
57
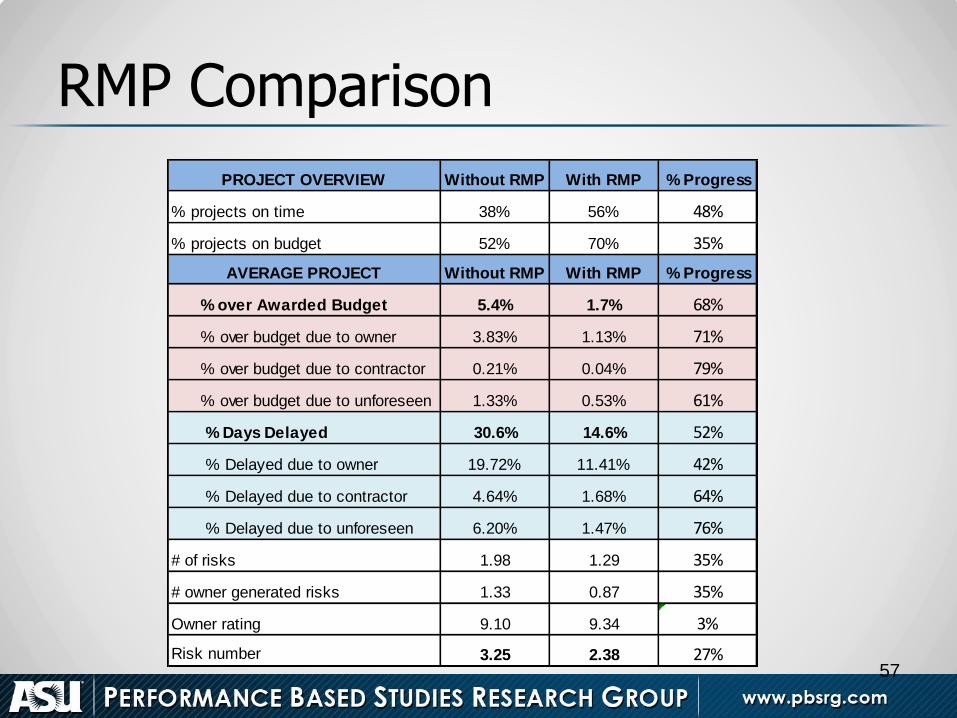
RMP Comparison
Without RMP With RMP % Progress
38% 56% 48%
52% 70% 35%
Without RMP With RMP % Progress
5.4% 1.7% 68%
3.83% 1.13% 71%
0.21% 0.04% 79%
1.33% 0.53% 61%
30.6% 14.6% 52%
19.72% 11.41% 42%
4.64% 1.68% 64%
6.20% 1.47% 76%
1.98 1.29 35%
1.33 0.87 35%
9.10 9.34 3%
3.25 2.38 27%
PROJECT OVERVIEW
% projects on time
% projects on budget
% Days Delayed
AVERAGE PROJECT
% over Awarded Budget
% over budget due to owner
% over budget due to contractor
% over budget due to unforeseen
Owner rating
Risk number
% Delayed due to owner
% Delayed due to contractor
% Delayed due to unforeseen
# of risks
# owner generated risks
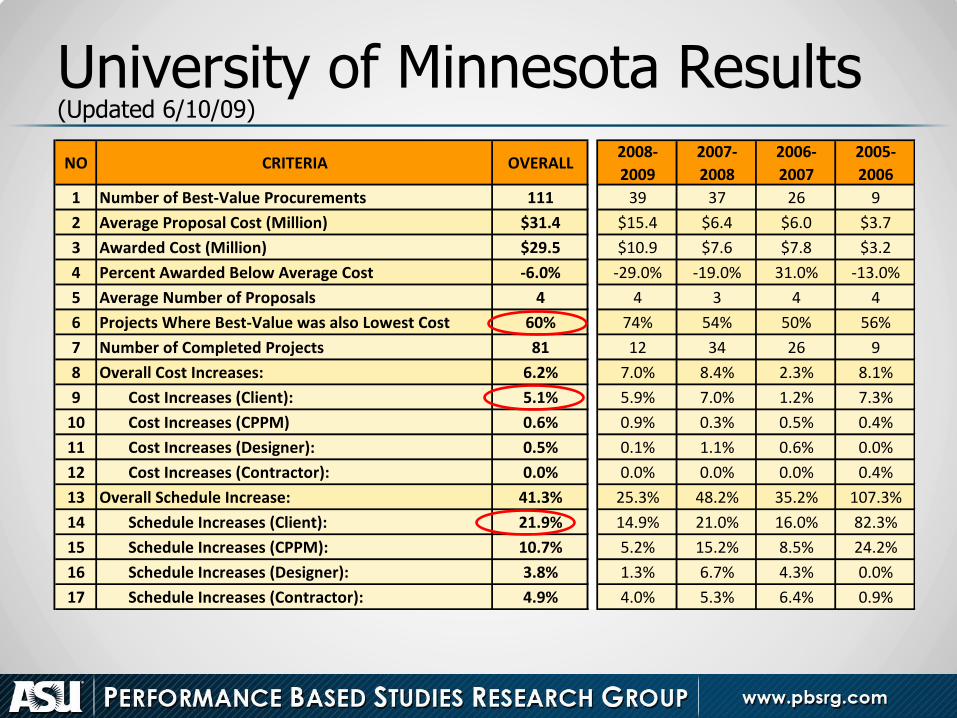
University of Minnesota Results (Updated 6/10/09)
NO CRITERIA OVERALL2008-
2009
2007-
2008
2006-
2007
2005-
2006
1 Number of Best-Value Procurements 111 39 37 26 9
2 Average Proposal Cost (Million) $31.4 $15.4 $6.4 $6.0 $3.7
3 Awarded Cost (Million) $29.5 $10.9 $7.6 $7.8 $3.2
4 Percent Awarded Below Average Cost -6.0% -29.0% -19.0% 31.0% -13.0%
5 Average Number of Proposals 4 4 3 4 4
6 Projects Where Best-Value was also Lowest Cost 60% 74% 54% 50% 56%
7 Number of Completed Projects 81 12 34 26 9
8 Overall Cost Increases: 6.2% 7.0% 8.4% 2.3% 8.1%
9 Cost Increases (Client): 5.1% 5.9% 7.0% 1.2% 7.3%
10 Cost Increases (CPPM) 0.6% 0.9% 0.3% 0.5% 0.4%
11 Cost Increases (Designer): 0.5% 0.1% 1.1% 0.6% 0.0%
12 Cost Increases (Contractor): 0.0% 0.0% 0.0% 0.0% 0.4%
13 Overall Schedule Increase: 41.3% 25.3% 48.2% 35.2% 107.3%
14 Schedule Increases (Client): 21.9% 14.9% 21.0% 16.0% 82.3%
15 Schedule Increases (CPPM): 10.7% 5.2% 15.2% 8.5% 24.2%
16 Schedule Increases (Designer): 3.8% 1.3% 6.7% 4.3% 0.0%
17 Schedule Increases (Contractor): 4.9% 4.0% 5.3% 6.4% 0.9%
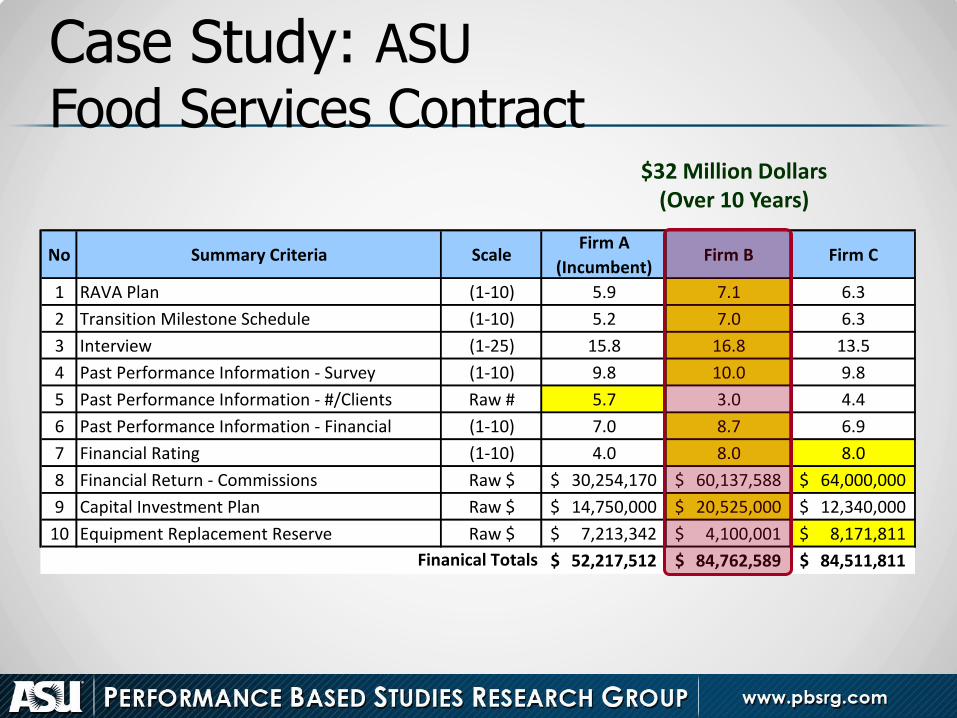
Case Study: ASU
Food Services Contract
No Summary Criteria ScaleFirm A
(Incumbent)Firm B Firm C
1 RAVA Plan (1-10) 5.9 7.1 6.3
2 Transition Milestone Schedule (1-10) 5.2 7.0 6.3
3 Interview (1-25) 15.8 16.8 13.5
4 Past Performance Information - Survey (1-10) 9.8 10.0 9.8
5 Past Performance Information - #/Clients Raw # 5.7 3.0 4.4
6 Past Performance Information - Financial (1-10) 7.0 8.7 6.9
7 Financial Rating (1-10) 4.0 8.0 8.0
8 Financial Return - Commissions Raw $ 30,254,170$ 60,137,588$ 64,000,000$
9 Capital Investment Plan Raw $ 14,750,000$ 20,525,000$ 12,340,000$
10 Equipment Replacement Reserve Raw $ 7,213,342$ 4,100,001$ 8,171,811$
52,217,512$ 84,762,589$ 84,511,811$ Finanical Totals
$32 Million Dollars (Over 10 Years)
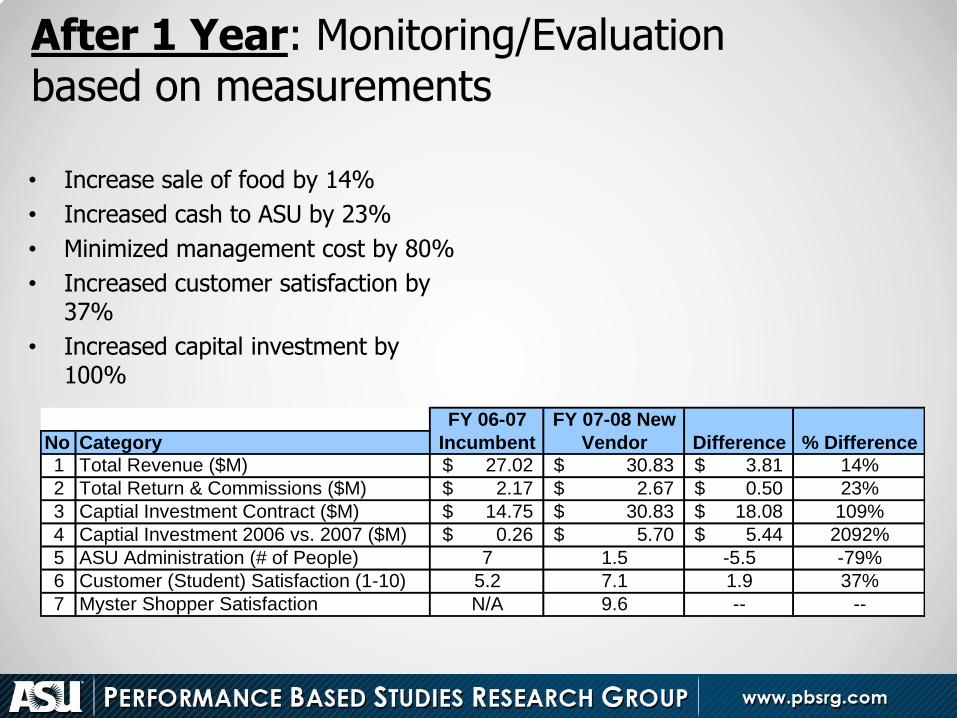
After 1 Year: Monitoring/Evaluation based on measurements
• Increase sale of food by 14%
• Increased cash to ASU by 23%
• Minimized management cost by 80%
• Increased customer satisfaction by 37%
• Increased capital investment by 100%
No Category
1 Total Revenue ($M) 27.02$ 30.83$ 3.81$ 14%
2 Total Return & Commissions ($M) 2.17$ 2.67$ 0.50$ 23%
3 Captial Investment Contract ($M) 14.75$ 30.83$ 18.08$ 109%
4 Captial Investment 2006 vs. 2007 ($M) 0.26$ 5.70$ 5.44$ 2092%
5 ASU Administration (# of People) 7 1.5 -5.5 -79%
6 Customer (Student) Satisfaction (1-10) 5.2 7.1 1.9 37%
7 Myster Shopper Satisfaction N/A 9.6 -- --
FY 06-07
Incumbent
FY 07-08 New
Vendor Difference % Difference
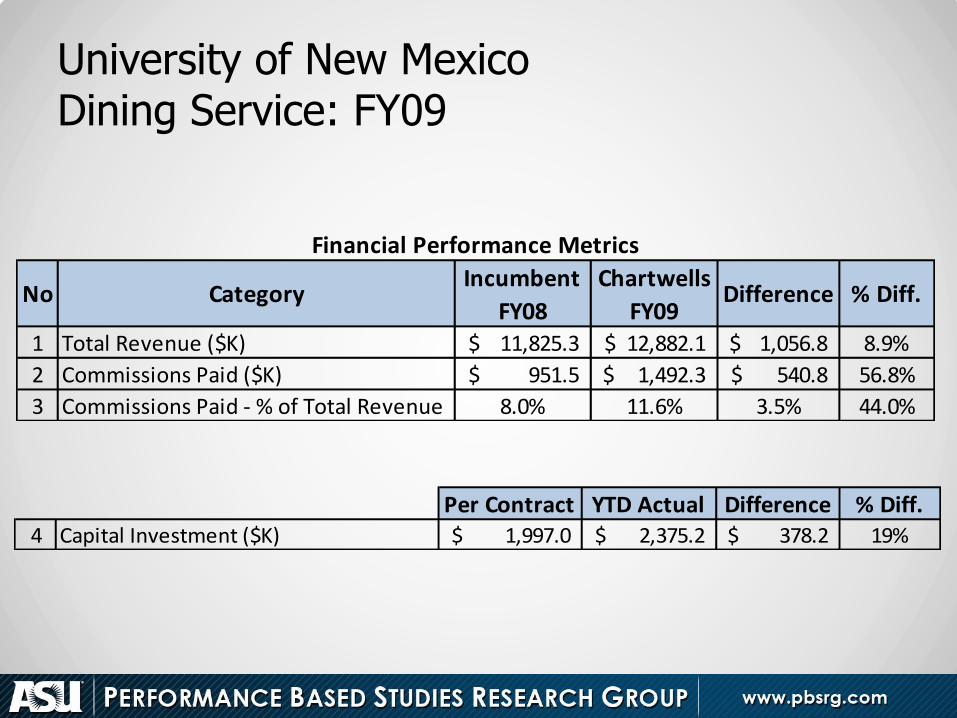
University of New Mexico Dining Service: FY09
No CategoryIncumbent
FY08
Chartwells
FY09Difference % Diff.
1 Total Revenue ($K) 11,825.3$ 12,882.1$ 1,056.8$ 8.9%
2 Commissions Paid ($K) 951.5$ 1,492.3$ 540.8$ 56.8%
3 Commissions Paid - % of Total Revenue 8.0% 11.6% 3.5% 44.0%
Financial Performance Metrics
Per Contract YTD Actual Difference % Diff.
4 Capital Investment ($K) 1,997.0$ 2,375.2$ 378.2$ 19%
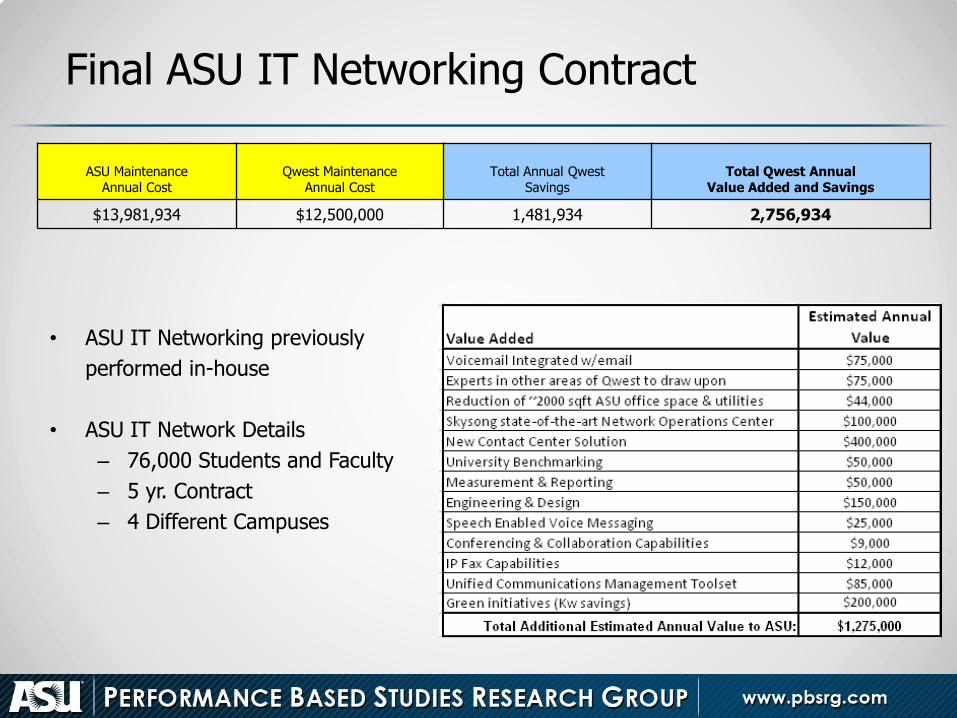
Final ASU IT Networking Contract
• ASU IT Networking previously
performed in-house
• ASU IT Network Details
– 76,000 Students and Faculty
– 5 yr. Contract
– 4 Different Campuses
ASU Maintenance Annual Cost
Qwest Maintenance Annual Cost
Total Annual Qwest Savings
Total Qwest Annual Value Added and Savings
$13,981,934 $12,500,000 1,481,934 2,756,934
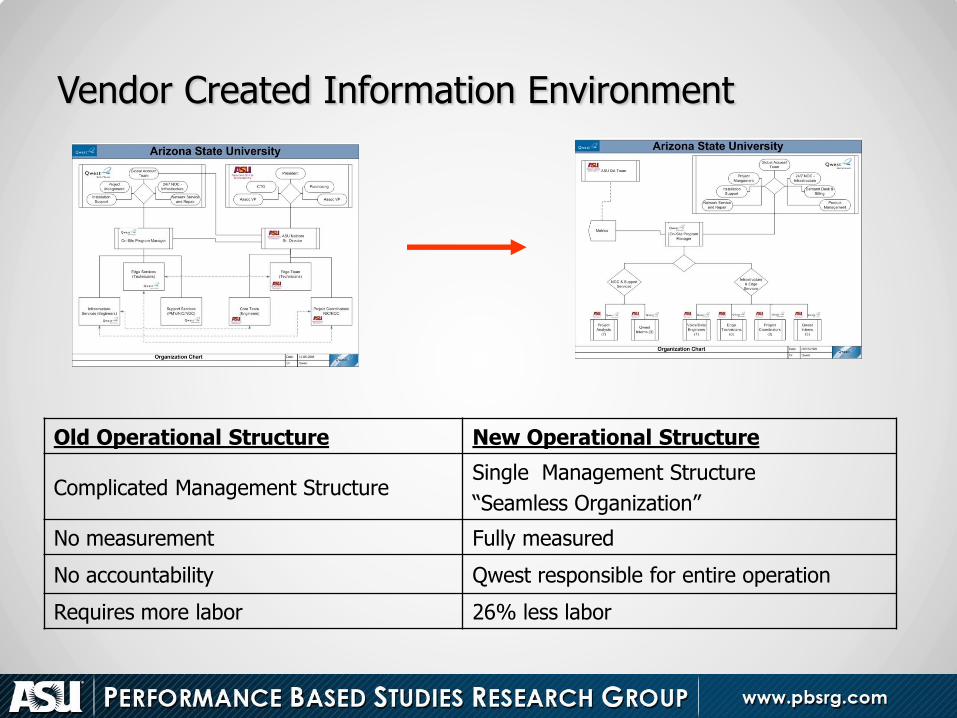
Vendor Created Information Environment
Old Operational Structure New Operational Structure
Complicated Management Structure Single Management Structure
“Seamless Organization”
No measurement Fully measured
No accountability Qwest responsible for entire operation
Requires more labor 26% less labor
State of Idaho
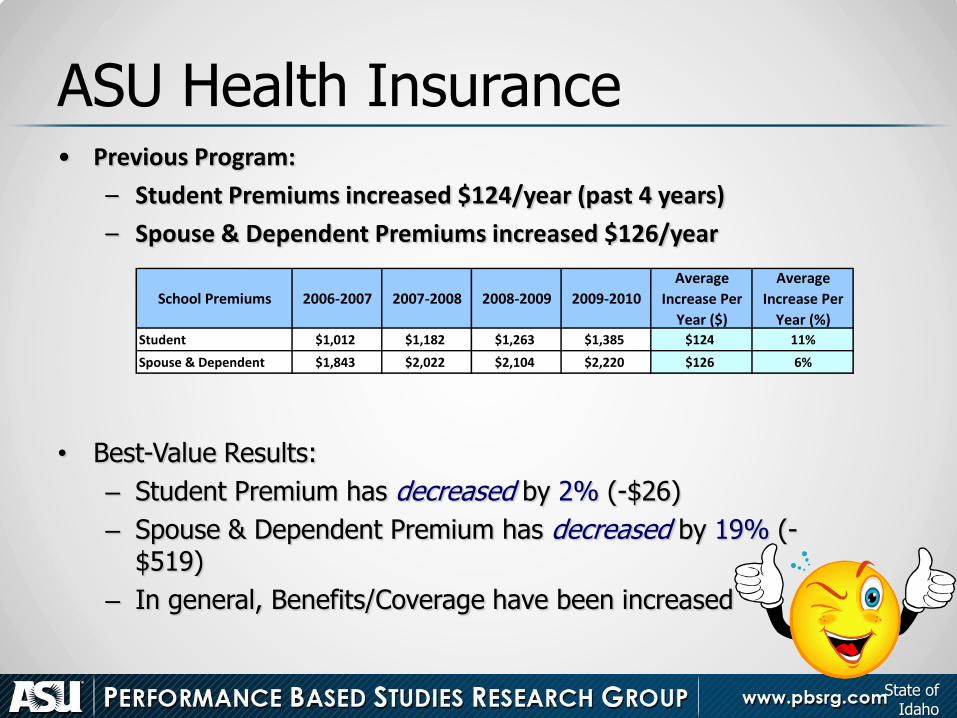
ASU Health Insurance
• Best-Value Results:
– Student Premium has decreased by 2% (-$26)
– Spouse & Dependent Premium has decreased by 19% (-$519)
– In general, Benefits/Coverage have been increased
School Premiums 2006-2007 2007-2008 2008-2009 2009-2010
Average
Increase Per
Year ($)
Average
Increase Per
Year (%)Student $1,012 $1,182 $1,263 $1,385 $124 11%
Spouse & Dependent $1,843 $2,022 $2,104 $2,220 $126 6%
• Previous Program:
– Student Premiums increased $124/year (past 4 years)
– Spouse & Dependent Premiums increased $126/year
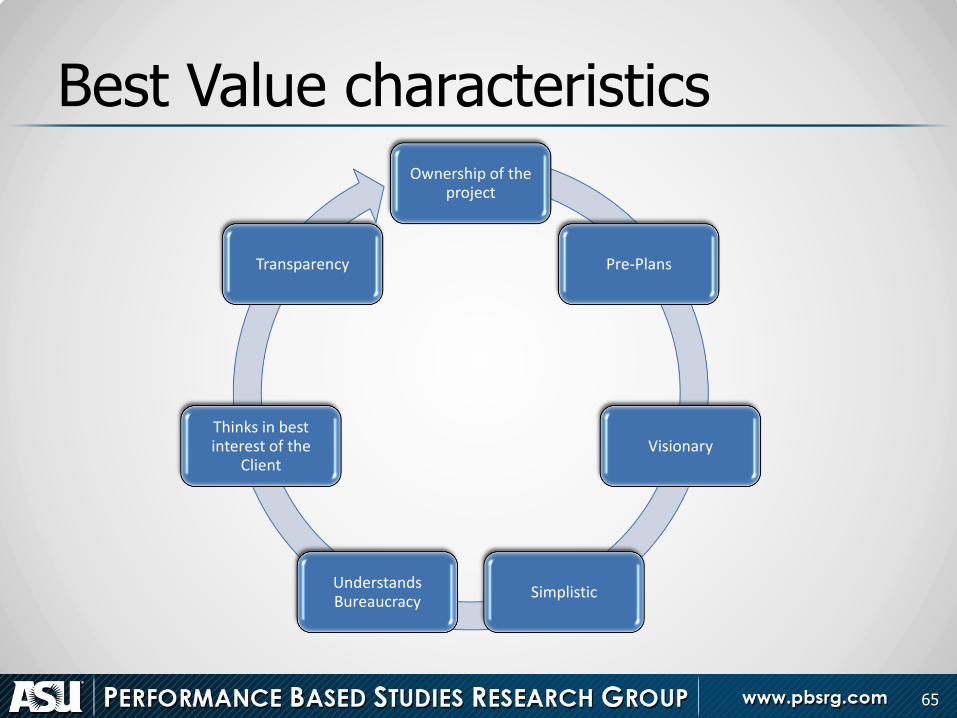
Best Value characteristics
Ownership of the project
Pre-Plans
Visionary
Simplistic Understands Bureaucracy
Thinks in best interest of the
Client
Transparency
65
66
Best Value Overview
• Complete business model for organizations & projects
• A best value selection and management tool (developed and tested over 18 years)
• It can be applied to any type of system, organization, structure, procurement, project, or need
• that allows a client to make an informed decision

67
Join Our Email List www.pbsrg.com • Educational Briefings • Seminar Invitations • Notable Updates from our Research • Early Conference Registration • And More . . .
PBSRG