Embed Size (px)
Citation preview
SCOM / BI – Dashboard Integration
Bernd SchneiderTechnical Solution Professional - BIMicrosoft Schweiz
Agenda
Solution Overview and ArchitectureCollect the Source Data
Operations Manager Data WarehouseSQL Server Integration Services
Build the CubeSQL Server Analysis Services
Put it all TogetherSharePoint Server 2007 & PerformancePoint Server 2007
Solution Walk-Through & Creating SCOM Dashboards
You Can Do More With Your SystemCenter Data!
Integrated (balanced) view of IT Performance
Roll up disparate metrics in a single scorecard – Server capacity, Transactions, SLA measurement
Ad-hoc analyticsHelp determine root cause for usage spikes, application downtime
Predictive analyticsWhat will my capacity needs look like next year?
Leverages existing infrastructureSQL Server, Operations Manager, SharePoint, Office
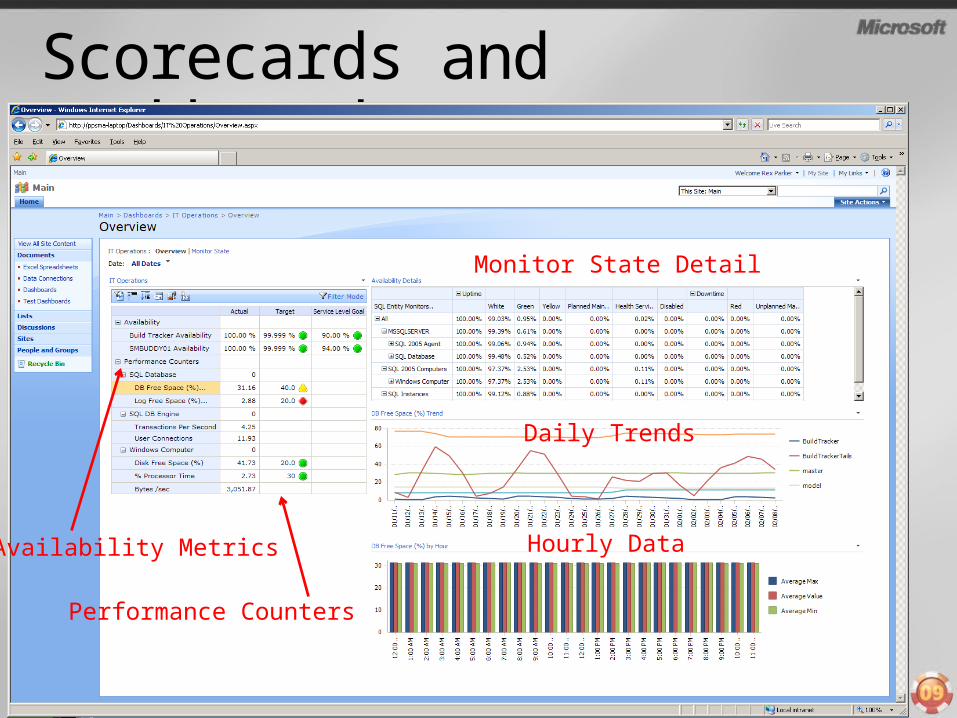
Scorecards and Dashboards
Availability Metrics
Performance Counters
Monitor State Detail
Hourly Data
Daily Trends
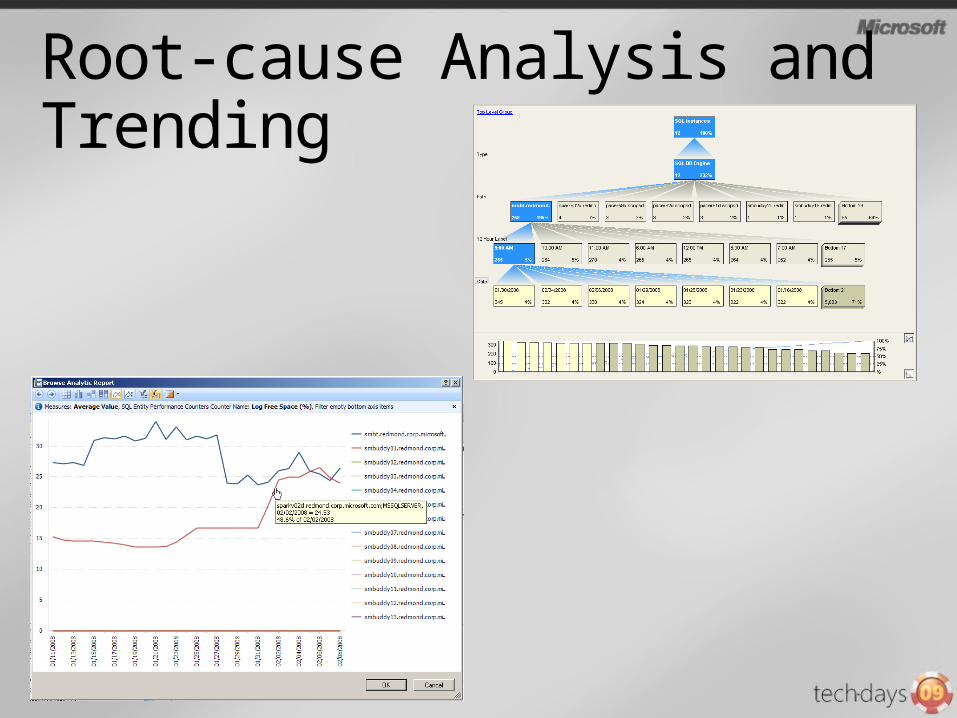
Root-cause Analysis and Trending
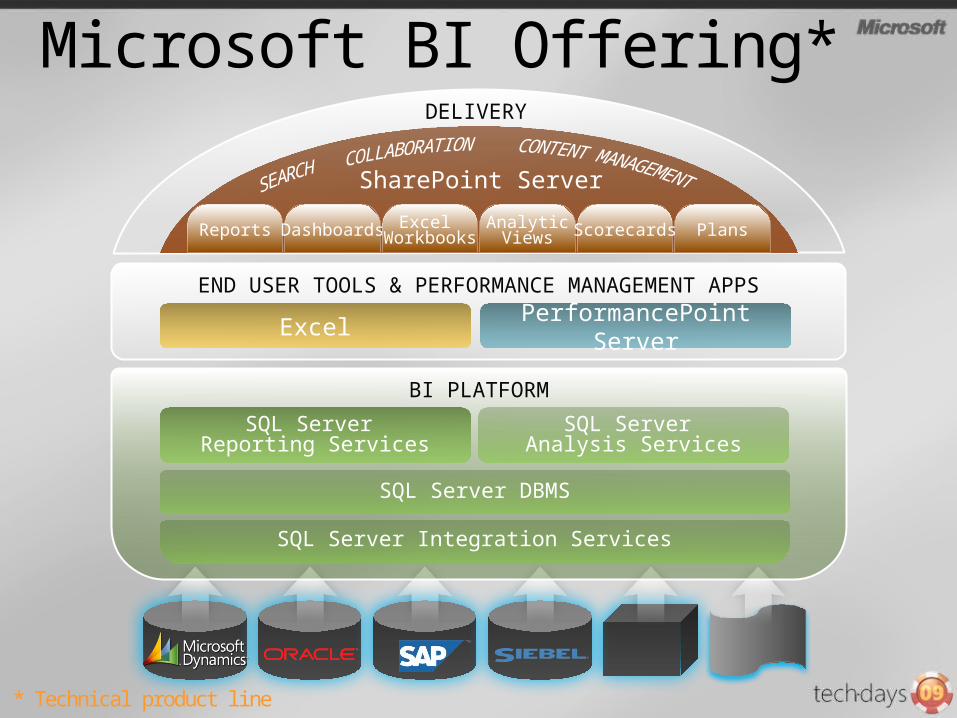
Microsoft BI Offering*
END USER TOOLS & PERFORMANCE MANAGEMENT APPS
ExcelPerformancePoint
Server
BI PLATFORM
SQL Server Reporting Services
SQL Server Analysis Services
SQL Server DBMS
SQL Server Integration Services
SharePoint Server
DELIVERY
Reports Dashboards Excel Workbooks
AnalyticViews Scorecards Plans
* Technical product line
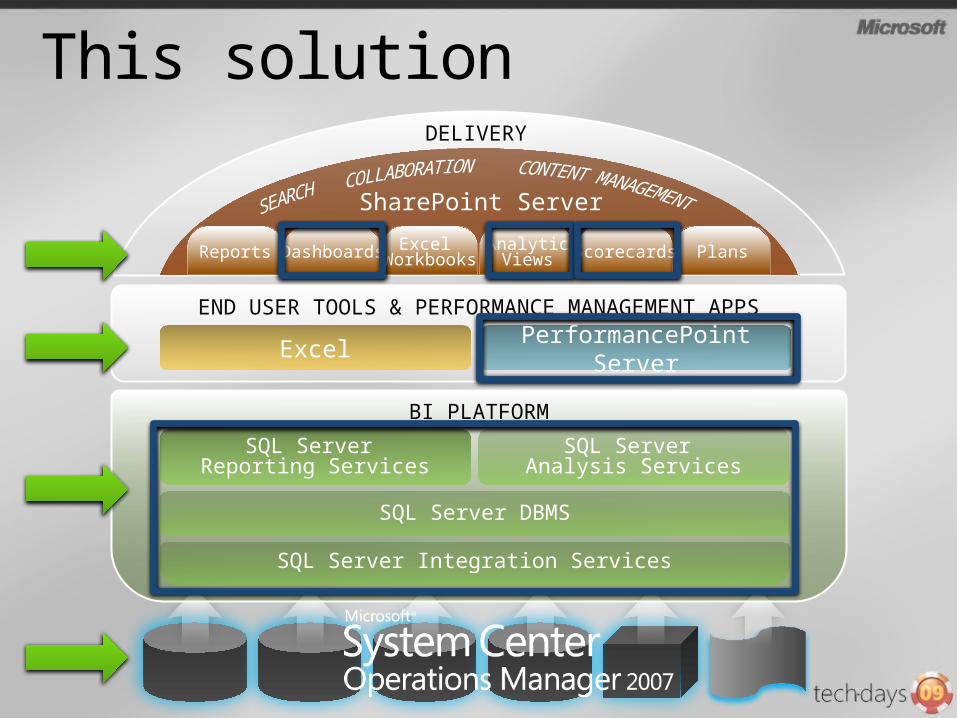
This solution
END USER TOOLS & PERFORMANCE MANAGEMENT APPS
ExcelPerformancePoint
Server
BI PLATFORM
SQL Server Reporting Services
SQL Server Analysis Services
SQL Server DBMS
SQL Server Integration Services
SharePoint Server
DELIVERY
Reports Dashboards Excel Workbooks
AnalyticViews Scorecards Plans
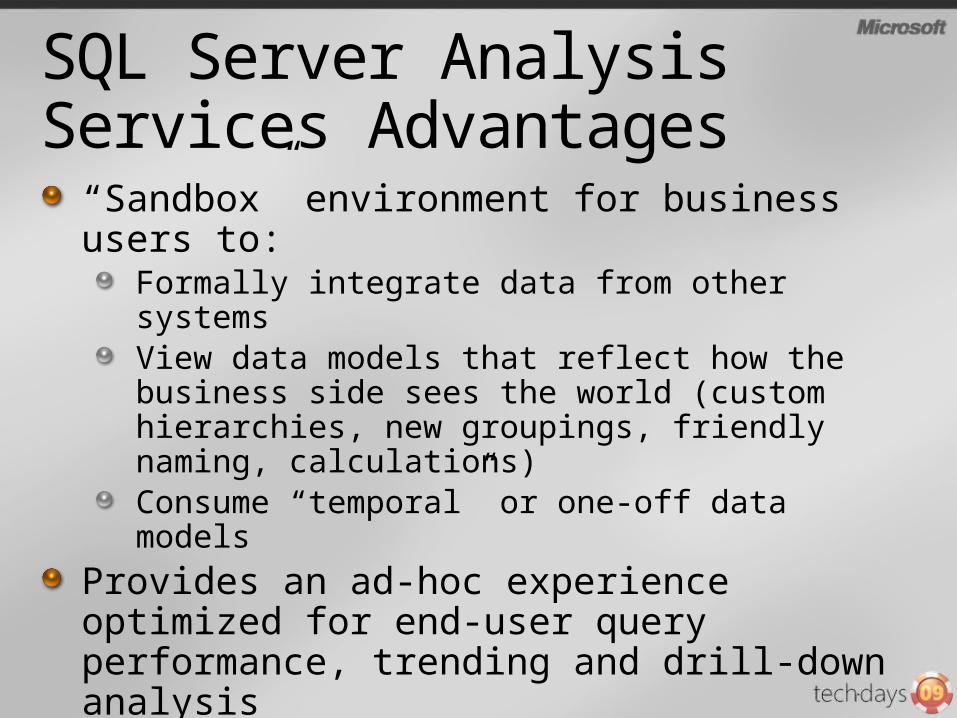
SQL Server Analysis Services Advantages
“Sandbox” environment for business users to:
Formally integrate data from other systemsView data models that reflect how the business side sees the world (custom hierarchies, new groupings, friendly naming, calculations)Consume “temporal” or one-off data models
Provides an ad-hoc experience optimized for end-user query performance, trending and drill-down analysisAd-hoc queries and frequent monitoring of KPIs will not load down the transactional database
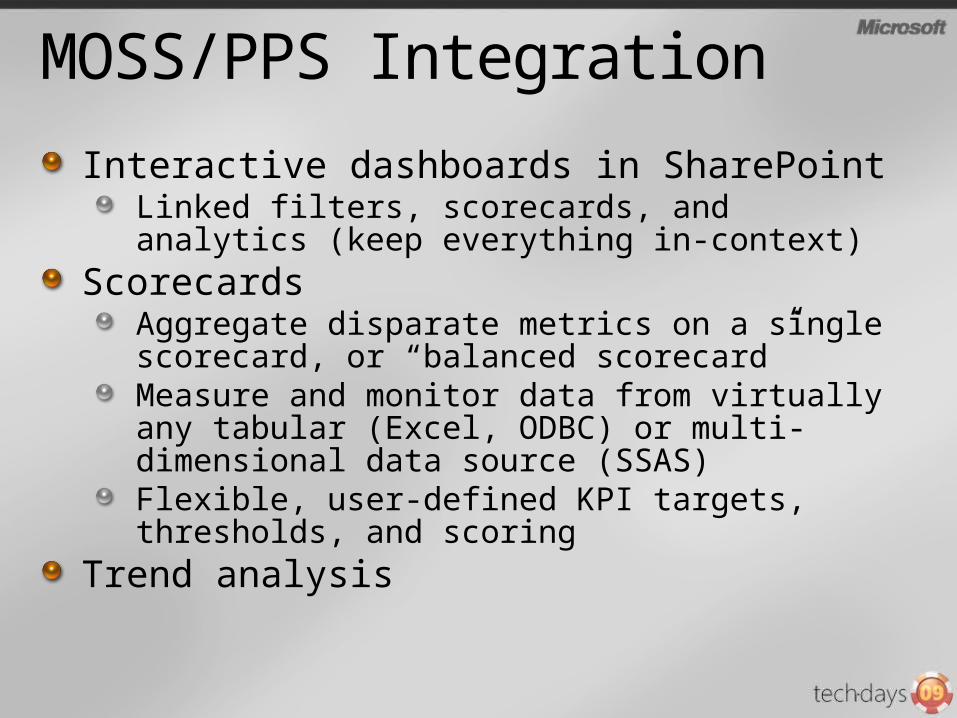
MOSS/PPS Integration
Interactive dashboards in SharePointLinked filters, scorecards, and analytics (keep everything in-context)
ScorecardsAggregate disparate metrics on a single scorecard, or “balanced scorecard”Measure and monitor data from virtually any tabular (Excel, ODBC) or multi-dimensional data source (SSAS)Flexible, user-defined KPI targets, thresholds, and scoring
Trend analysis
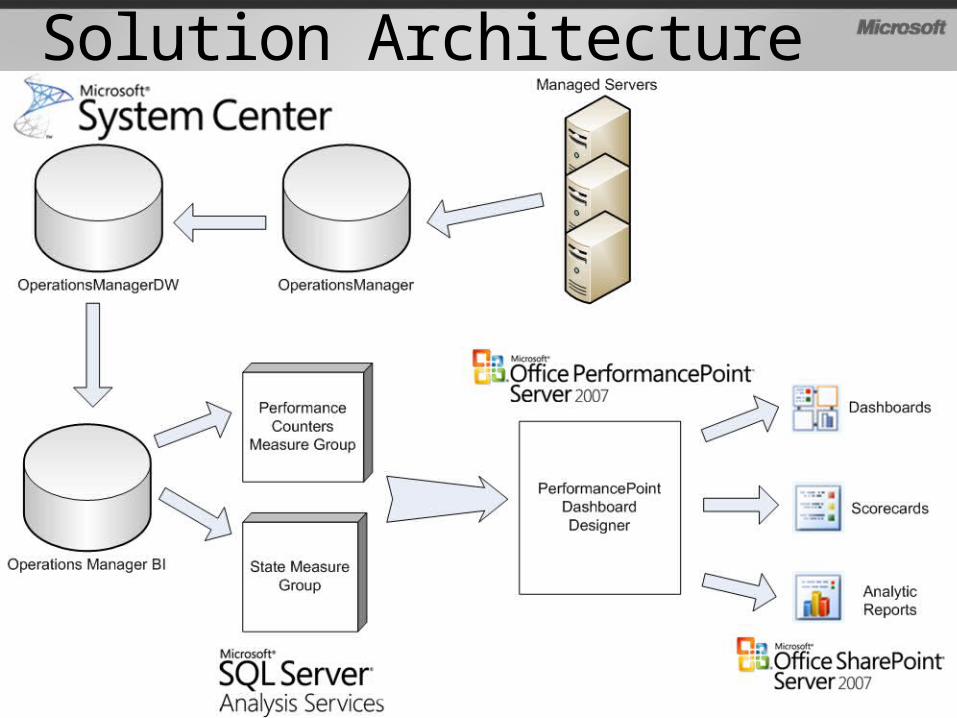
Solution Architecture
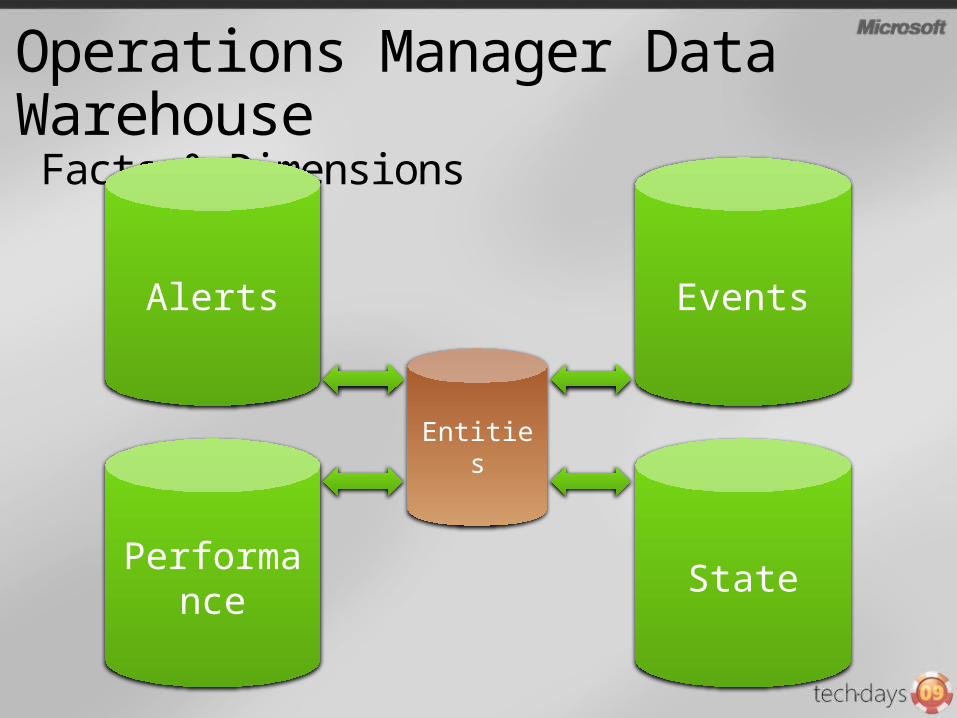
Operations Manager Data Warehouse Facts & Dimensions
Alerts Events
Performance State
Entities
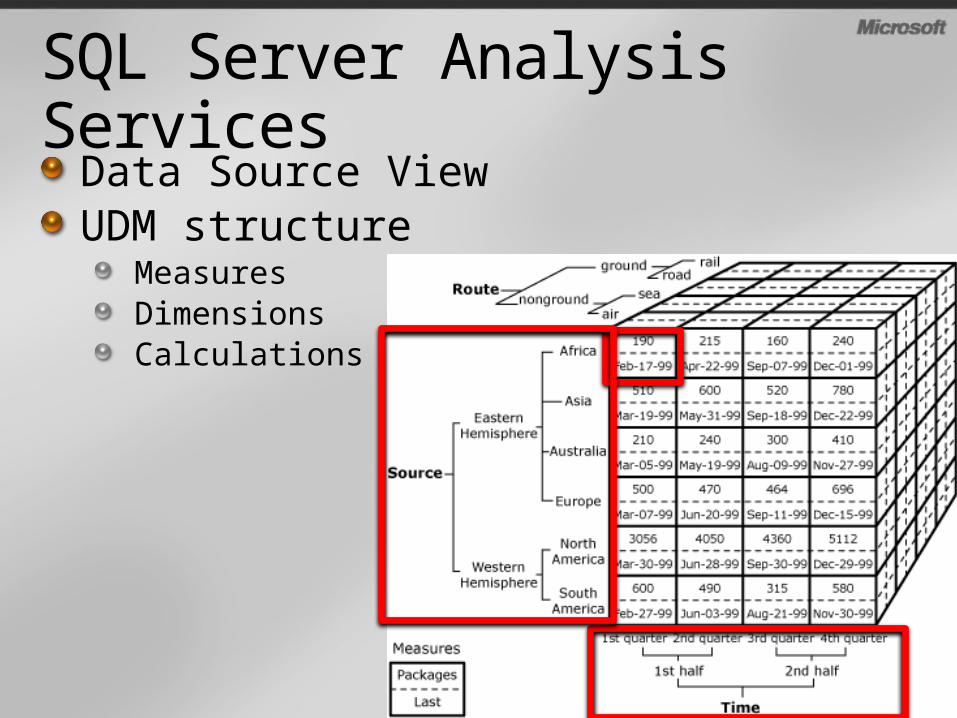
SQL Server Analysis Services
Data Source ViewUDM structure
MeasuresDimensionsCalculations
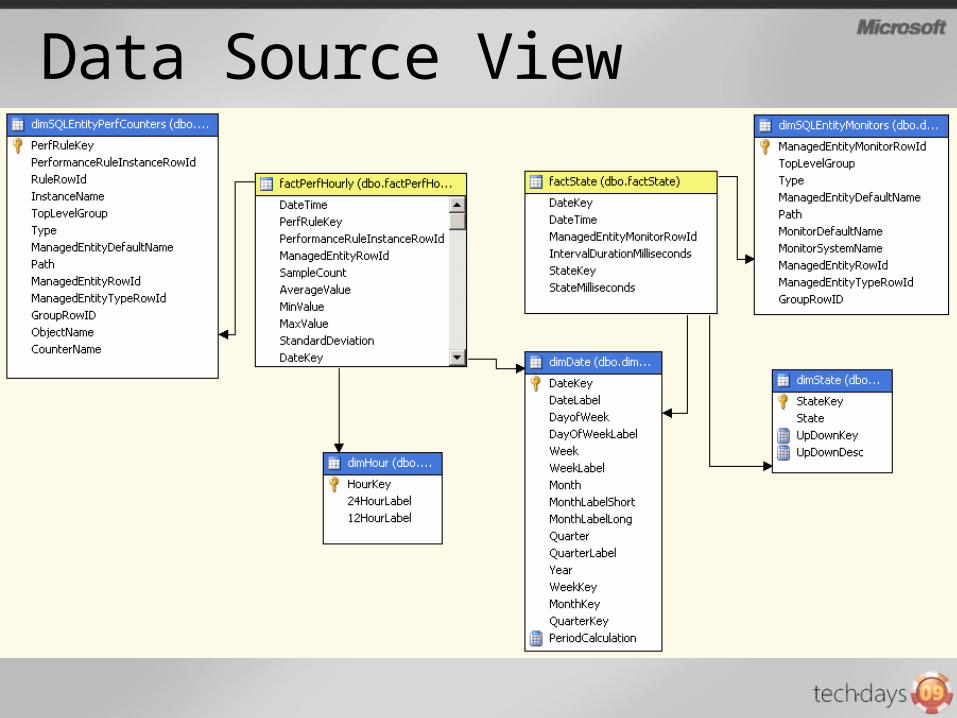
Data Source View
Diagrams of star schemas – state cube, perf cube
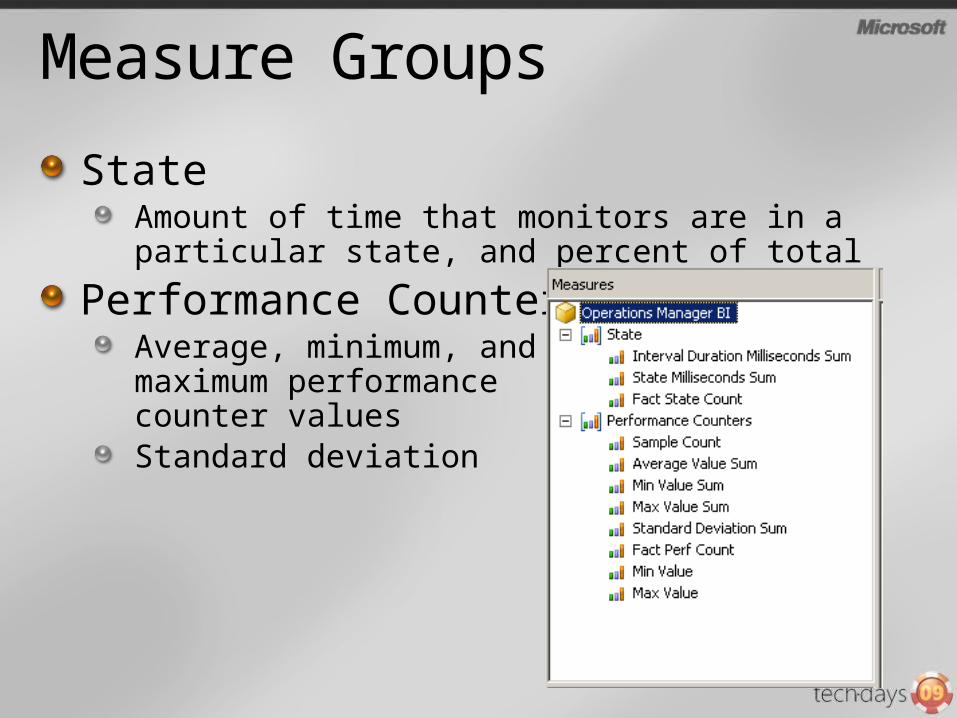
Measure Groups
StateAmount of time that monitors are in a particular state, and percent of total
Performance CountersAverage, minimum, and maximum performance counter valuesStandard deviation
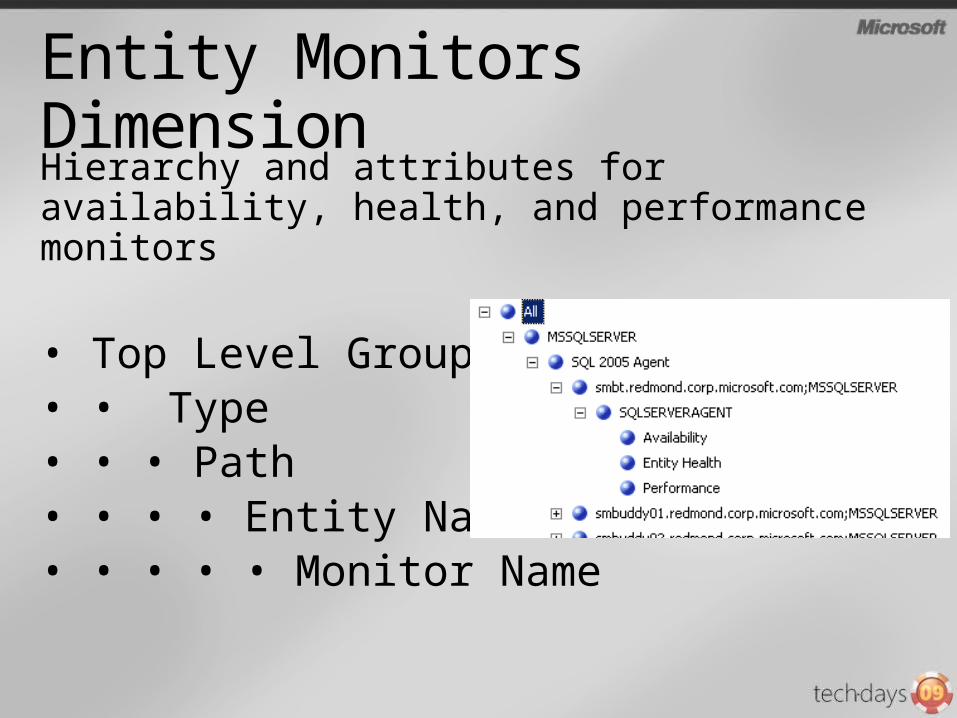
Entity Monitors Dimension
Hierarchy and attributes for availability, health, and performance monitors
• Top Level Group• • Type• • • Path• • • • Entity Name• • • • • Monitor Name
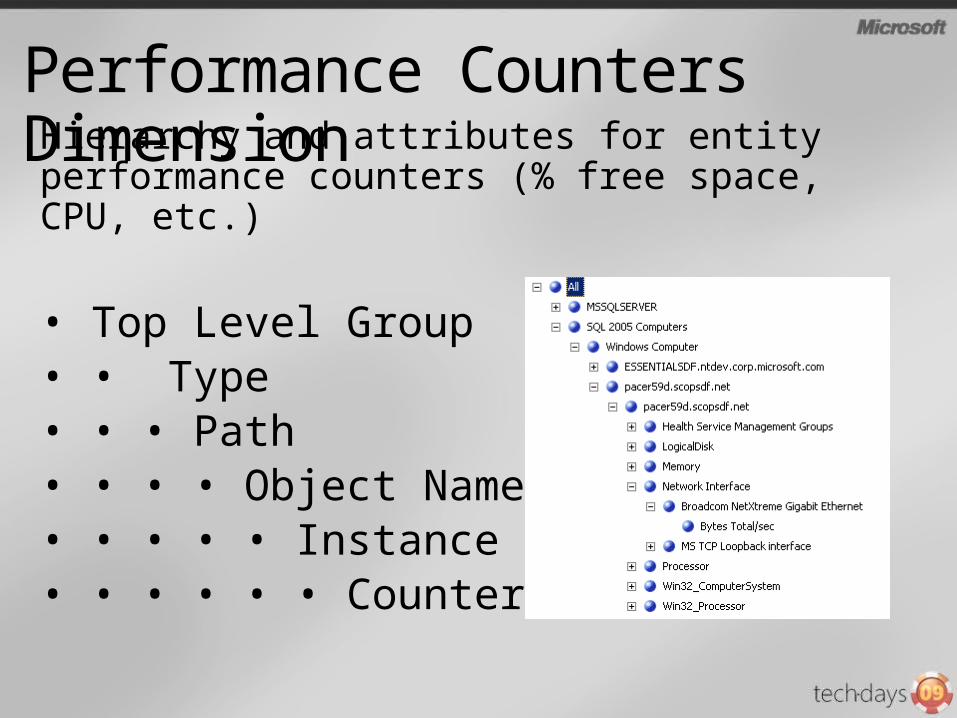
Performance Counters DimensionHierarchy and attributes for entity performance counters (% free space, CPU, etc.)
• Top Level Group• • Type• • • Path• • • • Object Name• • • • • Instance Name• • • • • • Counter Name
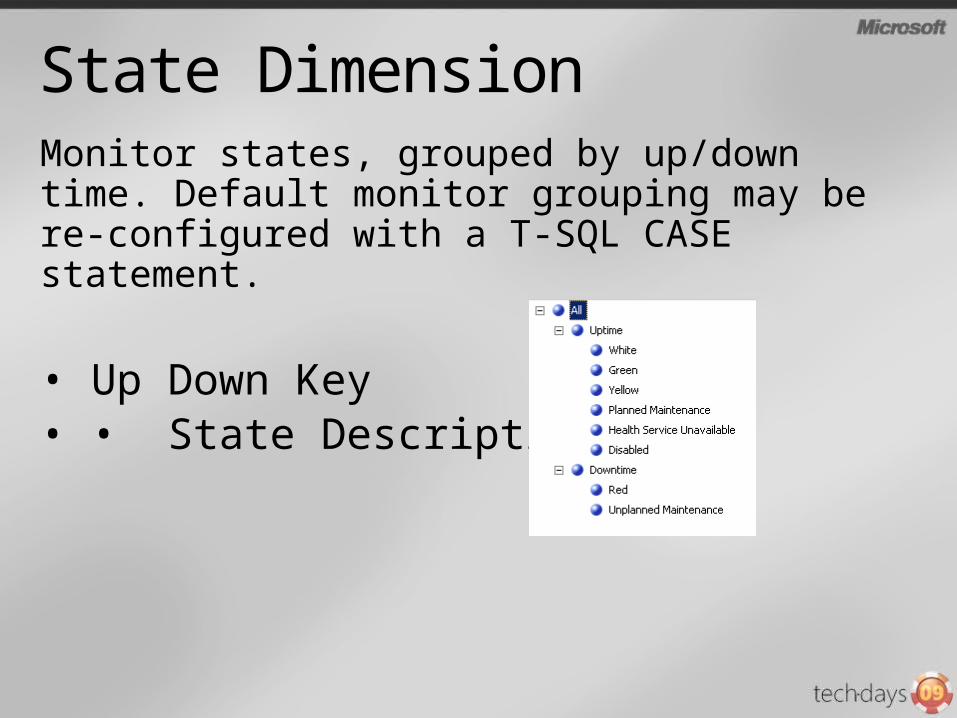
State DimensionMonitor states, grouped by up/down time. Default monitor grouping may be re-configured with a T-SQL CASE statement.
• Up Down Key• • State Description
Time and Date DimensionsCalendar dates and hours of day, with separate attributes for time-folded analysis (values by hour for the past week, for example)
• Date by Month (Year, Quarter, Month, Date)
• Date by Week (Year, Week, Date)• Time (Hours, in 12 hour or 24 hour
format)
Period CalculationsA dimension that contains dynamic, time-based calculations
• Month-to-date• Quarter-to-date• Year-to-date• Prior Period• Year-to-date, Prior Year• Percentage change
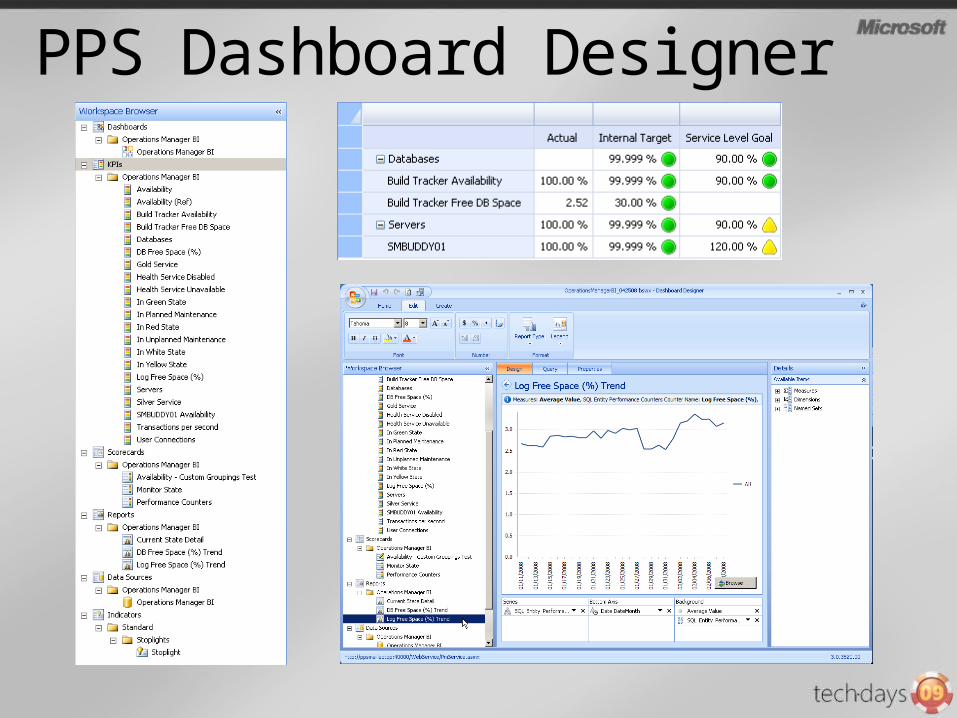
PPS Dashboard Designer

Creating SCOM Dashboard
demo
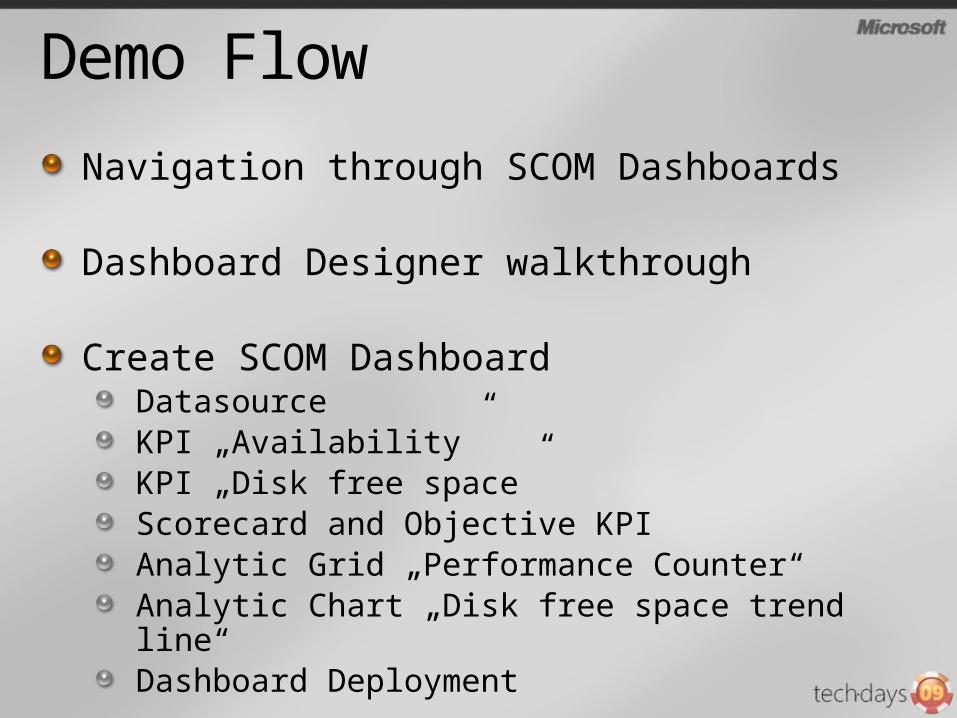
Demo Flow
Navigation through SCOM Dashboards
Dashboard Designer walkthrough
Create SCOM DashboardDatasourceKPI „Availability”KPI „Disk free space”Scorecard and Objective KPIAnalytic Grid „Performance Counter“Analytic Chart „Disk free space trend line“Dashboard Deployment
Conclusion
We have…Discussed the need for IT Operations scorecards, dashboards, analyticsDiscussed building an Analysis Services cubeCreated Key Performance Indicators (KPIs), scorecards, dashboards, and analytic reports
More Possibilities
Data Mining Add-In for ExcelEvent correlation!
Data-driven diagrams with VisioShow KPI status in a topology diagram
Predictive trend lines with PerformancePoint Trend ChartsMore…
More informationSQL Server Datawarehouse Overviewhttp://technet.microsoft.com/en-gb/sqlserver/dd421879.aspx
PerformancePoint Webhttp://www.microsoft.com/business/performancepoint/
SCOM/PPS Whitepaper & Sampleshttp://www.microsoft.com/business/performancepoint/downloads/default.aspx
Operations Manager Report Guide http://blogs.technet.com/momteam/archive/2008/02/26/operations-manager-report-authoring-guide.aspx
Your MSDN resourcescheck out these websites, blogs & more!
PresentationsTechDays: www.techdays.chMSDN Events: http://www.microsoft.com/switzerland/msdn/de/presentationfinder.mspxMSDN Webcasts: http://www.microsoft.com/switzerland/msdn/de/finder/default.mspx
MSDN EventsMSDN Events: http://www.microsoft.com/switzerland/msdn/de/events/default.mspxSave the date: Tech•Ed 2009 Europe, 9-13 November 2009, Berlin
MSDN Flash (our by weekly newsletter)Subscribe: http://www.microsoft.com/switzerland/msdn/de/flash.mspx
MSDN Team BlogRSS: http://blogs.msdn.com/swiss_dpe_team/Default.aspx
Developer User Groups & CommunitiesMobile Devices: http://www.pocketpc.ch/Microsoft Solutions User Group Switzerland: www.msugs.ch.NET Managed User Group of Switzerland: www.dotmugs.chFoxPro User Group Switzerland: www.fugs.ch
Your TechNet resourcescheck out these websites, blogs & more!
PresentationsTechDays: www.techdays.ch
TechNet EventsTechNet Events: http://technet.microsoft.com/de-ch/bb291010.aspx Save the date: Tech•Ed 2009 Europe, 9-13 November 2009, Berlin
TechNet Flash (our by weekly newsletter)Subscribe: http://technet.microsoft.com/de-ch/bb898852.aspx
Schweizer IT Professional und TechNet BlogRSS: http://blogs.technet.com/chitpro-de/
IT Professional User Groups & CommunitiesSwissITPro User Group: www.swissitpro.ch NT Anwendergruppe Schweiz: www.nt-ag.ch PASS (Professional Association for SQL Server): www.sqlpass.ch
Save the date for tech·days next year!
7. – 8. April 2010Congress Center Basel
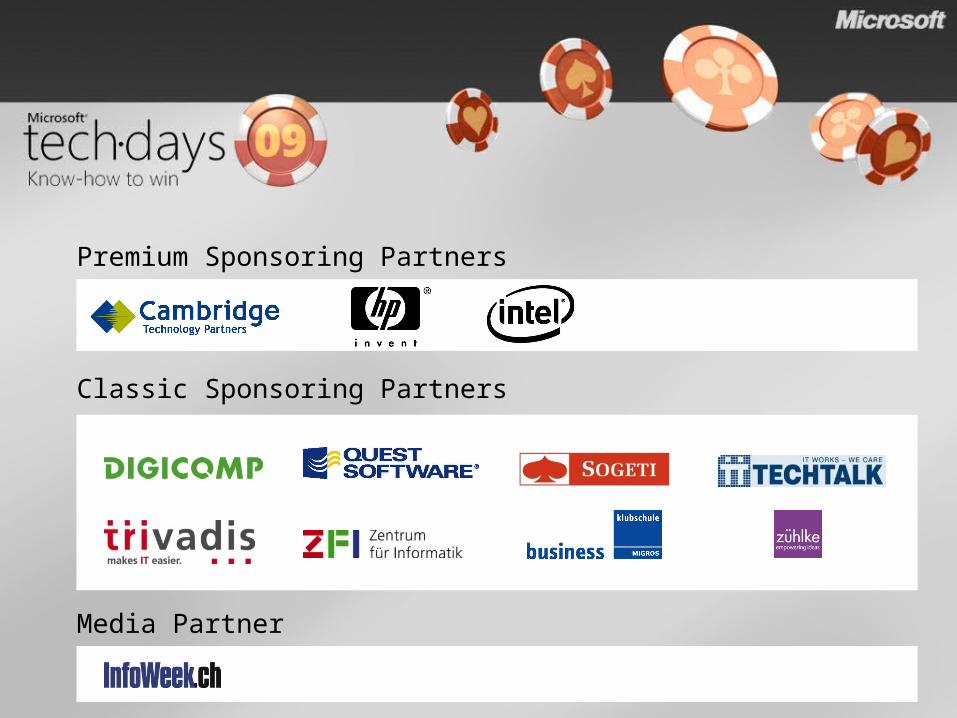
Classic Sponsoring Partners
Media Partner
Premium Sponsoring Partners