Embed Size (px)
Citation preview

Benchmarking Semiconductor Benchmarking Semiconductor Manufacturing and its Applicability to Manufacturing and its Applicability to
Pharmaceutical ManufacturingPharmaceutical Manufacturing
Jeffrey T. Macher Jackson A. Nickerson
Co-Principal Investigators
April 24, 2003

Presentation Agenda
Introduction to UC Berkeley CSM Research ProgramResearch program purpose and general approach.Manufacturing metric scores.Summary of best practices.Preliminary conclusions.
Pharmaceutical Manufacturing Research Project Description and value to industry.Funding and approach.

UC Berkeley CSM Research Program
Why?Perceived competitiveness gap among producers.
CharterMeasure manufacturing performance.Identify underlying determinants of performance.Benchmark wafer fabrication across industry.Carry out focus studies of important practices.
FundingOriginally by Alfred P. Sloan Foundation; additional funding by Sloan, International SEMATECH ,and semiconductor industry.

Value from CSM Research Program
Developed a new industry standard set of benchmarks for measuring manufacturing performance. Provided confidential “scorecard” to manufacturing fabs on how they performed against anonymous others. Identified managerial, organizational, and technical practices underlying good (and poor) performance.Identified advances in techniques for defect analysis, scheduling, process development, factory organization, etc..Industry view: Substantial positive financial impact to program participants.

Research Dissemination
Benchmarking reports (most recent: March 2002).Focus study reports (more than 50 reports to date).Industry and conference presentations.Extension classes for industry managers.Academic research papers.http://euler.berkeley.edu/esrc/csm/index.html.

Benchmarking Participants
36 semiconductor manufacturing facilities studied:Hyundai and Samsung (2) in Korea.TSMC (2) and UMC (2) in Taiwan.NEC, Oki, LSI Logic, Toshiba, Tohoku and Winbond in Japan.AMD, Cypress (2), DEC, Delco, Harris, IBM, Intel, LSI Logic, Lucent, Micron, Motorola, NSC, Sony, Sony/AMD and TI (2) in USA.DEC, ITT, Lucent, NSC (2) and ST Microelectronics in Europe.
Over the 1989-2001 period and several technology classes.

Data Collection
Mail-Out Questionnaire (MOQ).3-4 years of fab history.
Data collection:Equipment and facilities.Headcount and human resources.Managerial, organizational and technical practices.Production volumes, yields, cycle times, etc..
Data entered into relational database.Technical metric scores computed.
Yield, cycle time, equipment productivity, etc..

Site Visits
Two–three day visit with a structured inquiry protocol.Team of 6-8 faculty and graduate students (plus interpreter when required).Tour fab for evidence of self-measurement, communication, problem-solving activity.Interview cross-section of organization.
» Managers, engineers, technicians, operators.Conduct information sessions.
» On approaches to problem areas (yield, equipment efficiency, cycle time, on-time delivery, new process introductions, etc.).
» On problem solving resources (information systems, process control, work teams, human resources development, etc.).
Managerial expectations…

Cycle Time Per Layer
0
1
2
3
4
5
6
94 95 96 97 98 99Time
Cyc
le ti
me
per l
ayer
(CTP
L)
M1
M2
M3
M4
M5
M6
M7

I-Line 5X Stepper Productivity
0
100
200
300
400
500
600
700
800
900
1000
1100
1200
94 95 96 97 98 99 00 01
Time
Waf
er o
pera
tions
per
ste
pper
per
day
fab1015fab1050fab159fab254fab293fab350fab408fab458fab490fab510fab531fab561fab650fab716fab788fab848fab891fab974M1
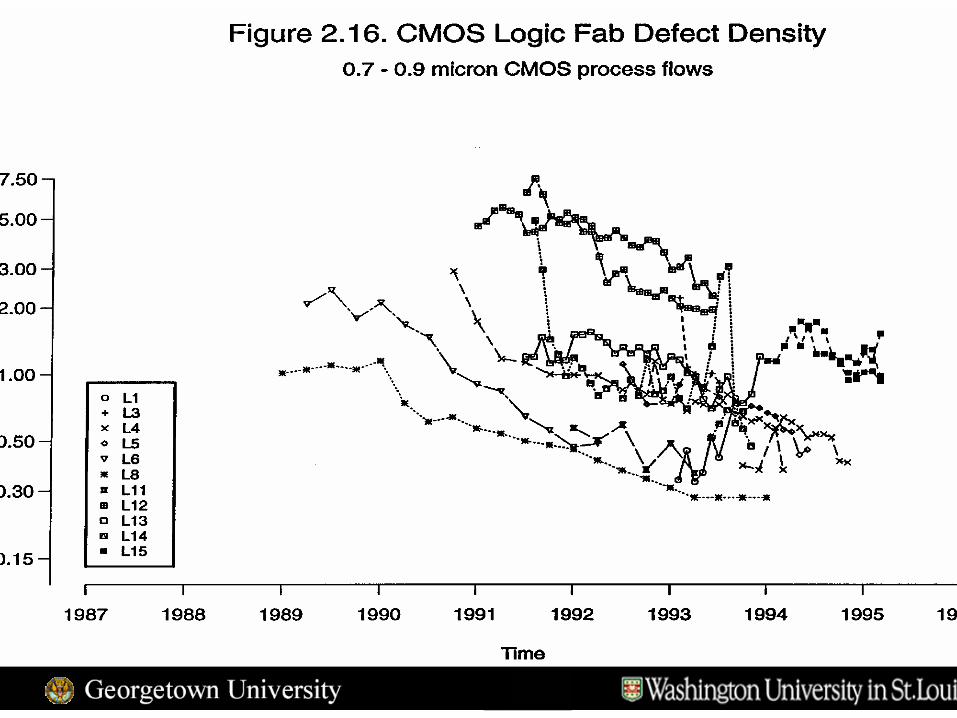
Direct Labor Productivity
0
20
40
60
80
100
120
140
160
94 95 96 97 98 99 00 01Time
Mas
k la
yers
per
dire
ct la
bor p
er d
ay
fab1015fab1050fab159fab2489fab254fab293fab350fab408fab458fab490fab510fab531fab561fab650fab716fab788fab848fab891

Determining Best Practices
Searched for managerial, organizational or technical practices that were correlated with metric scores.Typically, a good practice positively influenced several metric scores.
Firms tend to score well (or score poorly) across several metrics.
Almost every manufacturing fab had at least one practice that the other fabs would benefit by adopting.No fab was best-in-class in all practices or performance measures.

Key Operational Practices
Make manufacturing mistake-proof.Automate “information” handling.Integrate manufacturing data and analyze statistically. “Know” your equipment. Automate scheduling of manufacturing activity.
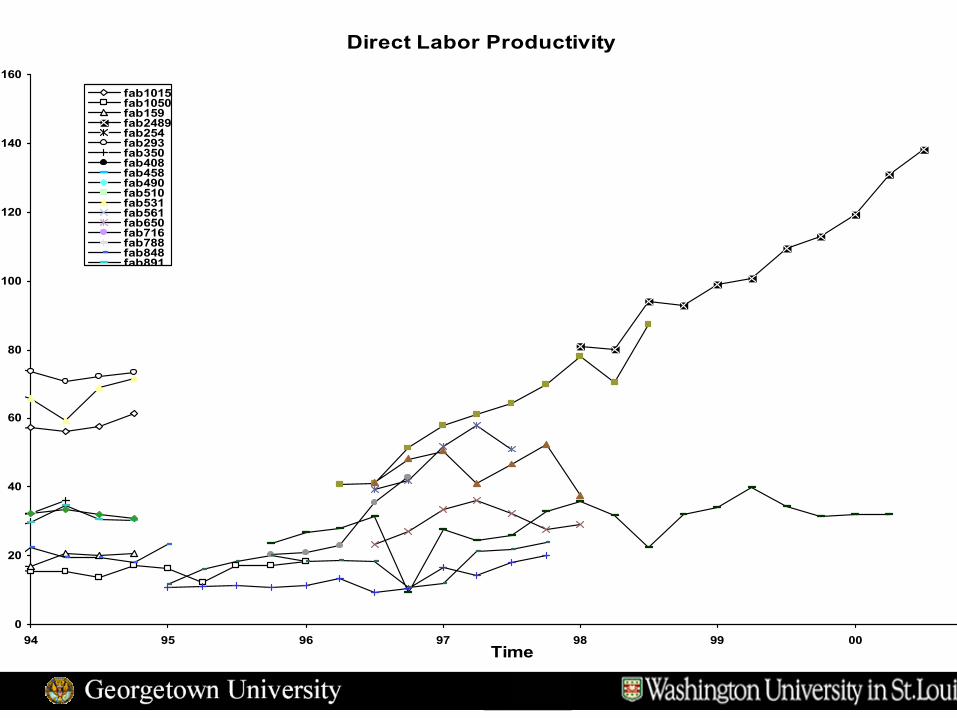
Key Organizational PracticesDevelop a problem-solving organization
Create member-diverse, problem-focused teams.Provide extensive training and mentoring.
Manage new process development and transferIncrementally introduce new process modules“Copy exactly” from pilot plant to production fab.Co-locate process development and manufacturing.
Reduce the division of laborAllow operators to do some TPM and troubleshooting.Focus engineers on “hardest” problems.

Summary of Major Findings of CSM Study
Biggest single factor explaining performance is the focus or “religion” of organization:
Total Quality Management and process control.Statistical analysis of yield vs. in-line data.Cycle time reduction and on-time delivery.TPM and equipment throughput.
Weak performers in a given category do not have the relevant focus.

Conclusions from CSM Study
Independent of technological differences, performance differences among manufacturing fabs studied were substantial.Various metrics have different levels of importance in different product segments.
Fast ramp of new production processes to high-volume manufacturing is very important.Rates of improvement in yields and throughput are very important.

Conclusions from CSM Study
Improvement requires rapid problem identification, characterization, and solution by a large, diverse team.Common Themes of Successful Approaches:
Leadership and development of personnel.Organizational participation, communication, accountability, responsibility for improvement.Information strategy and analytical techniques to support improvement; not blind automation.
Manufacturers could and did substantially improve performance by adopting CSM research program findings.

Pharmaceutical Manufacturing Research Project (PMRP)
GoalsBenchmark pharmaceutical production across industry.Identify managerial, organizational, and technical practices underlying manufacturing and regulatory performance.Transfer “learning” to industry.
Value to industryDevelop standard set of benchmarks for measuring manufacturing performance. Identify practices that lead to good (and poor) performance.Provide confidential “scorecard” to plants on how they perform against anonymous others.

PMRP – Funding and Approach
FundingSeed funding from Georgetown University and Washington University in St. Louis.Seeking addition funding from foundations.
ApproachCurrently in pilot phase.
» Interviews with FDA personnel.» Meetings with various manufacturing entities.» Developing internet-based survey and plant visit protocol.
Data collection phase will begin by year-end.

We Want You!
Jeffrey T. MacherMcDonough School of BusinessGeorgetown University202-687-4793 (O)[email protected]
Jackson A. NickersonOlin School of BusinessWashington University in St. Louis314-935-6374 (O)[email protected]
WE WANT YOU!TO PARTICIPATEIN THIS STUDY!