Embed Size (px)
Citation preview
Benchmarking Semiconductor Benchmarking Semiconductor Manufacturing and its Applicability to Manufacturing and its Applicability to
Pharmaceutical ManufacturingPharmaceutical Manufacturing
Jeffrey T. Macher Jackson A. Nickerson
Co-Principal Investigators
April 24, 2003
Presentation Agenda
Introduction to UC Berkeley CSM Research ProgramResearch program purpose and general approach.Manufacturing metric scores.Summary of best practices.Preliminary conclusions.
Pharmaceutical Manufacturing Research Project Description and approach.Principal investigator capabilities.Research project funding, staffing and timeline.
UC Berkeley CSM Research Program
Why?Perceived competitiveness gap among producers.
CharterMeasure manufacturing performance.Identify underlying determinants of performance.Benchmark wafer fabrication across industry.Carry out focus studies of important practices.
FundingOriginally by Alfred P. Sloan Foundation; additional funding by Sloan, International SEMATECH ,and semiconductor industry.
Value from CSM Research Program
Developed a new industry standard set of benchmarks for measuring manufacturing performance. Provided confidential “scorecard” to manufacturing fabs on how they performed against anonymous others. Identified managerial, organizational, and technical practices underlying good (and poor) performance.Identified advances in techniques for defect analysis, scheduling, process development, factory organization, etc..Industry view: Substantial positive financial impact to program participants.
Research Dissemination
Benchmarking reports (most recent: March 2002).Focus study reports (more than 50 reports to date).Industry and conference presentations.Extension classes for industry managers.Academic research papers.http://euler.berkeley.edu/esrc/csm/index.html.
Benchmarking Participants
36 semiconductor manufacturing facilities studied:Hyundai and Samsung (2) in Korea.TSMC (2) and UMC (2) in Taiwan.NEC, Oki, LSI Logic, Toshiba, Tohoku and Winbond in Japan.AMD, Cypress (2), DEC, Delco, Harris, IBM, Intel, LSI Logic, Lucent, Micron, Motorola, NSC, Sony, Sony/AMD and TI (2) in USA.DEC, ITT, Lucent, NSC (2) and ST Microelectronics in Europe.
Over the 1989-2001 period and several technology classes.
Data Collection
Mail-Out Questionnaire (MOQ).3-4 years of fab history.
» Equipment and facilities.» Headcount and human resources data.» Production volumes, yields, cycle times, etc..
Data entered into relational database.Technical metric scores computed.
Yield, cycle time, equipment productivity, etc..
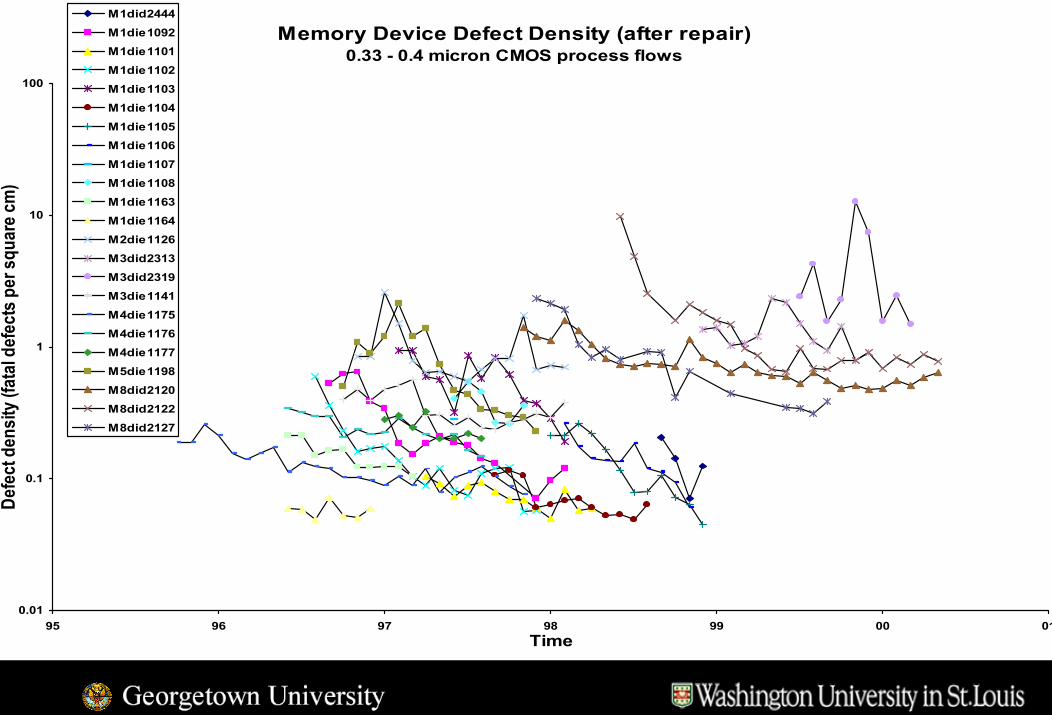
Memory Device Defect Density (after repair)0.33 - 0.4 micron CMOS process flows
0.01
0.1
1
10
100
95 96 97 98 99 00 01Time
Defe
ct d
ensit
y (fa
tal d
efec
ts p
er sq
uare
cm)
M1did2444M1die1092M1die1101M1die1102M1die1103M1die1104M1die1105M1die1106M1die1107M1die1108M1die1163M1die1164M2die1126M3did2313M3did2319M3die1141M4die1175M4die1176M4die1177M5die1198M8did2120M8did2122M8did2127
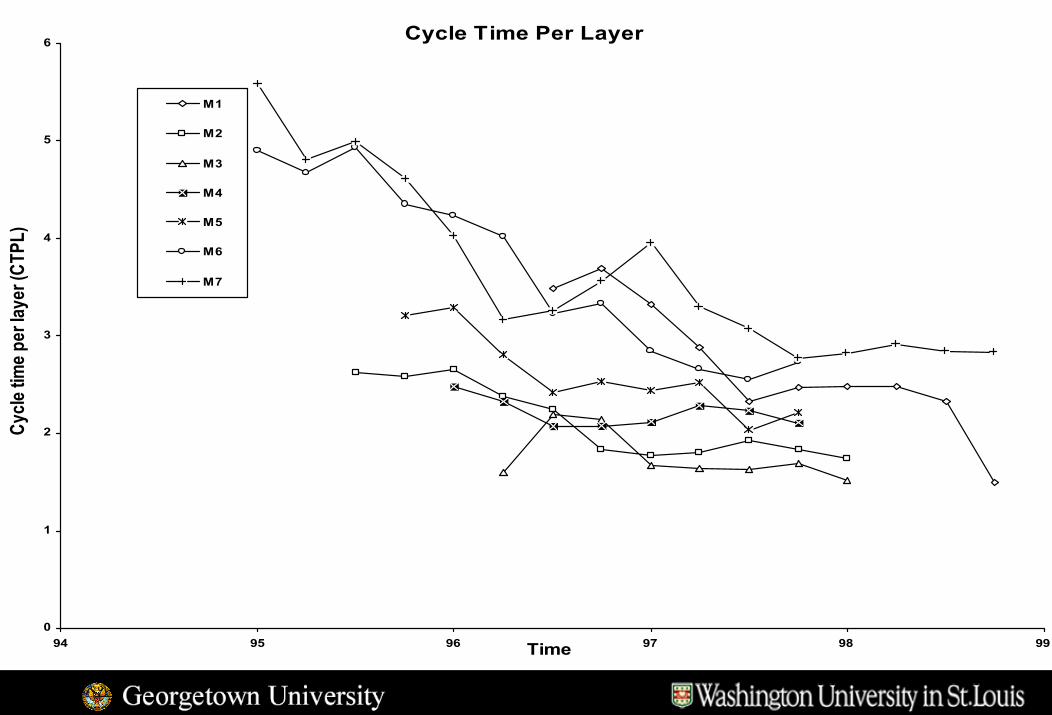
Cycle Time Per Layer
0
1
2
3
4
5
6
94 95 96 97 98 99Time
Cycle
time p
er la
yer (
CTPL
)
M1
M2
M3
M4
M5
M6
M7
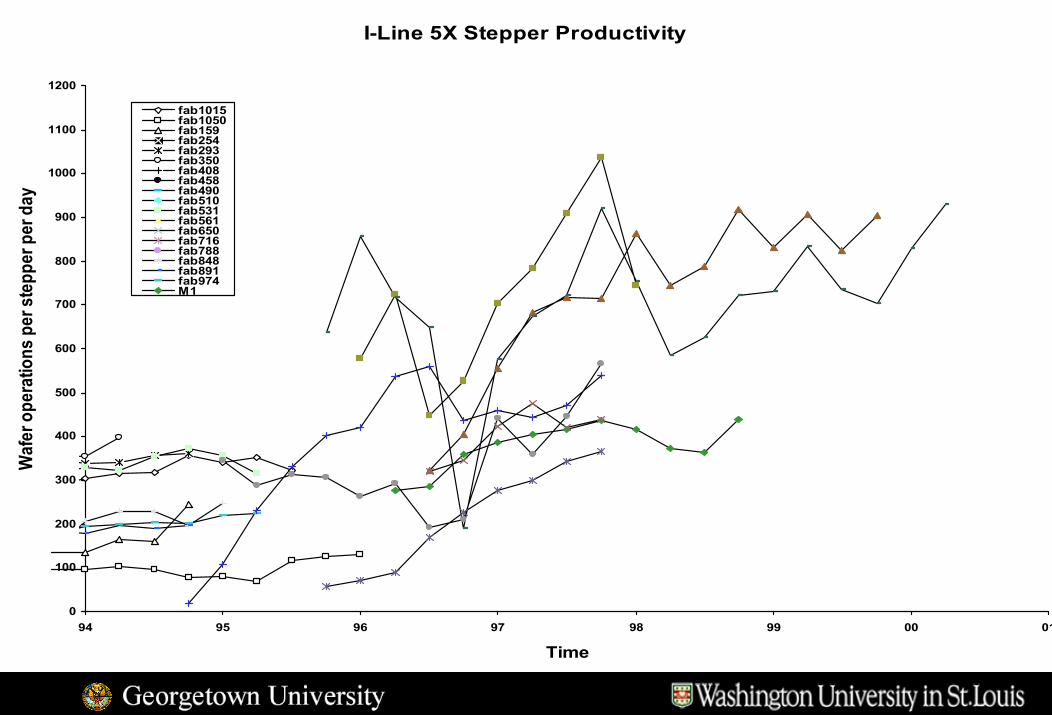
I-Line 5X Stepper Productivity
0
100
200
300
400
500
600
700
800
900
1000
1100
1200
94 95 96 97 98 99 00 01
Time
Waf
er o
pera
tions
per
step
per p
er d
ay
fab1015fab1050fab159fab254fab293fab350fab408fab458fab490fab510fab531fab561fab650fab716fab788fab848fab891fab974M1
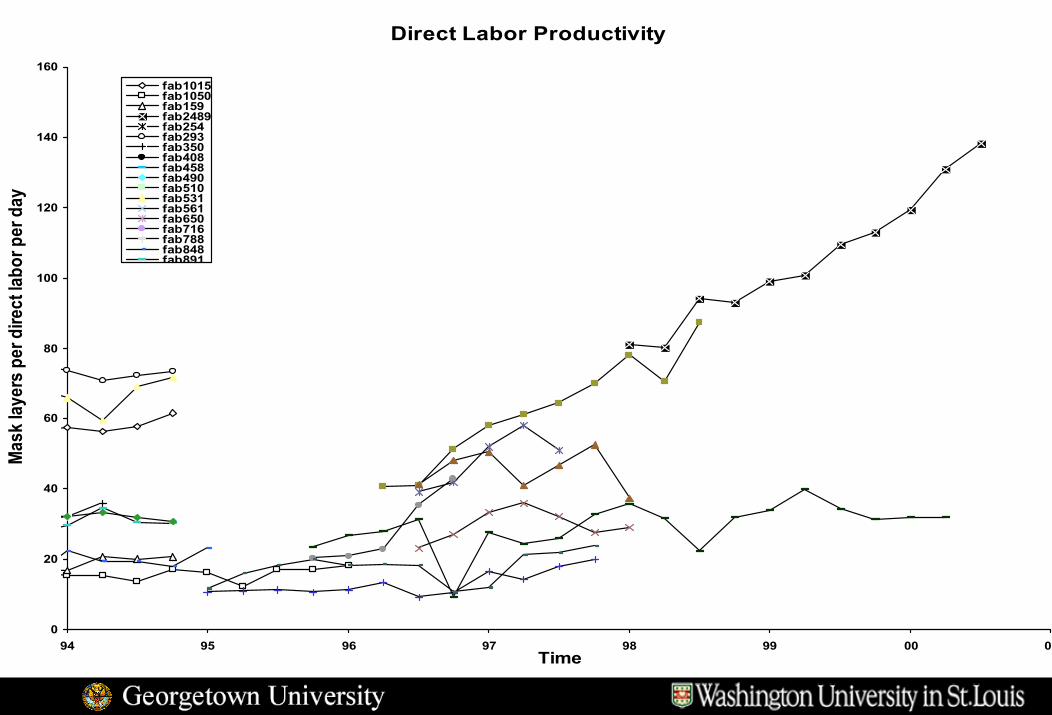
Direct Labor Productivity
0
20
40
60
80
100
120
140
160
94 95 96 97 98 99 00 01Time
Mask
laye
rs p
er d
irect
labo
r per
day
fab1015fab1050fab159fab2489fab254fab293fab350fab408fab458fab490fab510fab531fab561fab650fab716fab788fab848fab891
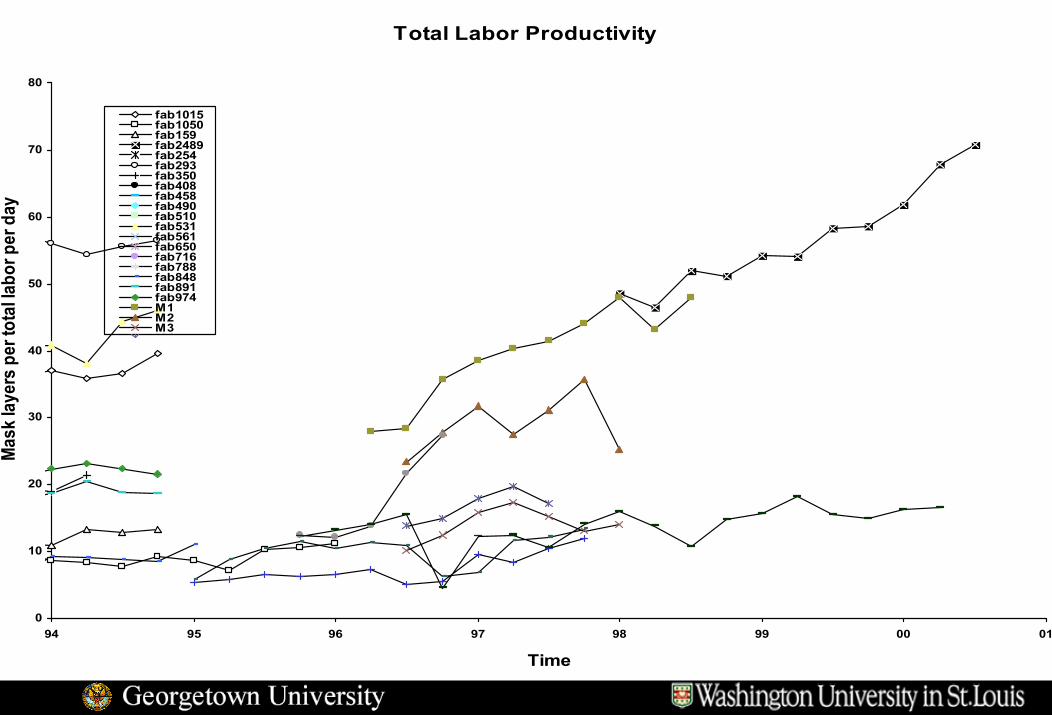
Total Labor Productivity
0
10
20
30
40
50
60
70
80
94 95 96 97 98 99 00 01
Time
Mask
laye
rs p
er to
tal la
bor p
er d
ay
fab1015fab1050fab159fab2489fab254fab293fab350fab408fab458fab490fab510fab531fab561fab650fab716fab788fab848fab891fab974M1M2M3M4
Site Visits
Two – three day visit with a structured inquiry protocol.Team of 6-8 faculty and graduate students (plus interpreter when required).Tour fab for evidence of self-measurement, communication, problem-solving activity.Interview cross-section of organization.
» Managers, engineers, technicians, operators.Conduct information sessions.
» On approaches to problem areas (yield, equipment efficiency, cycle time, on-time delivery, new process introductions, etc.).
» On problem solving resources (CIM and information systems, process control, work teams, human resources development, etc.).
Determining Best Practices
Searched for managerial, technical or organizational practices that were correlated with metric scores.Typically, a good practice positively influences several metric scores.
Participants tended to score well or score poorly across severalmetrics.
Even so, almost every participant had at least one practice that the other participants would benefit by adopting.
Summary of major findings of CSM study
Wide variations in performance and focus.Key operational practices:
mistake-proof manufacturing, “information” handling automation,data collection and yield analysis integration,TPM and equipment efficiency measurement, equipment modification scheduling, automated planning and scheduling.
Key organizational practices: team-based problem-solving approaches,new process development and transfer management,division of labor reductions.
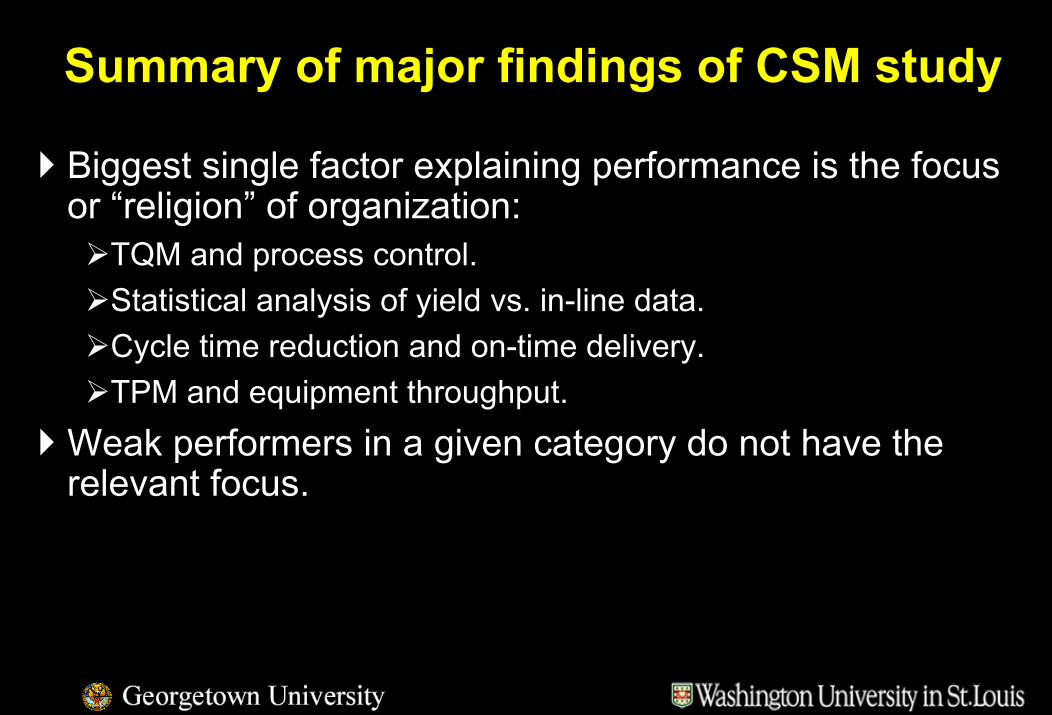
Summary of major findings of CSM study
Biggest single factor explaining performance is the focus or “religion” of organization:
TQM and process control.Statistical analysis of yield vs. in-line data.Cycle time reduction and on-time delivery.TPM and equipment throughput.
Weak performers in a given category do not have the relevant focus.
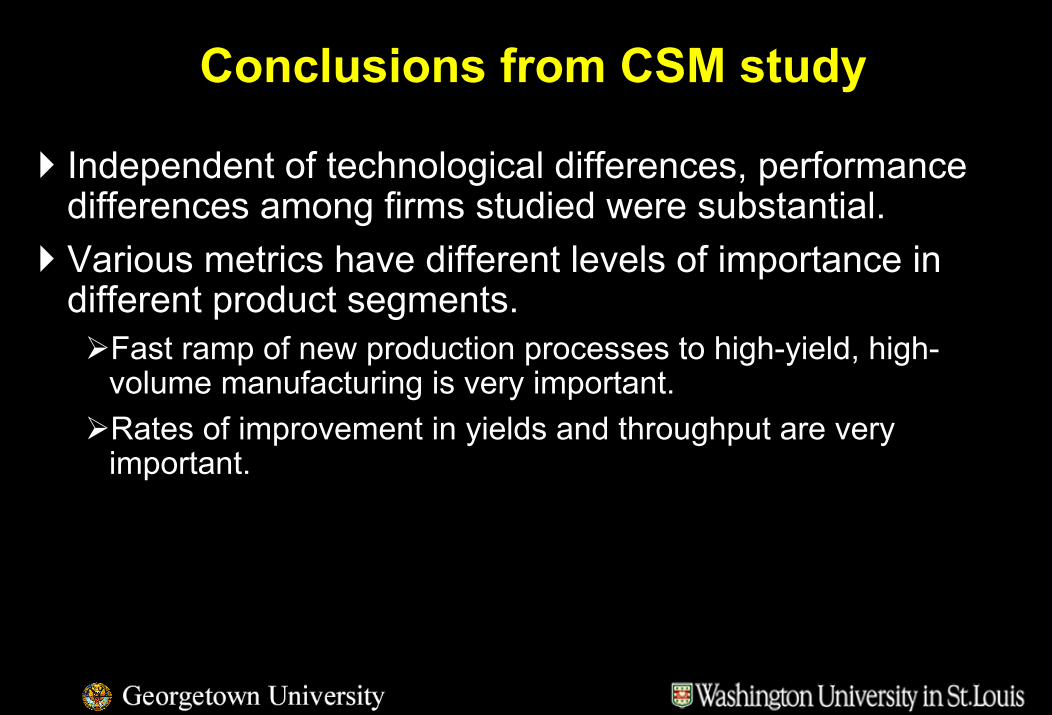
Conclusions from CSM study
Independent of technological differences, performance differences among firms studied were substantial.Various metrics have different levels of importance in different product segments.
Fast ramp of new production processes to high-yield, high-volume manufacturing is very important.Rates of improvement in yields and throughput are very important.
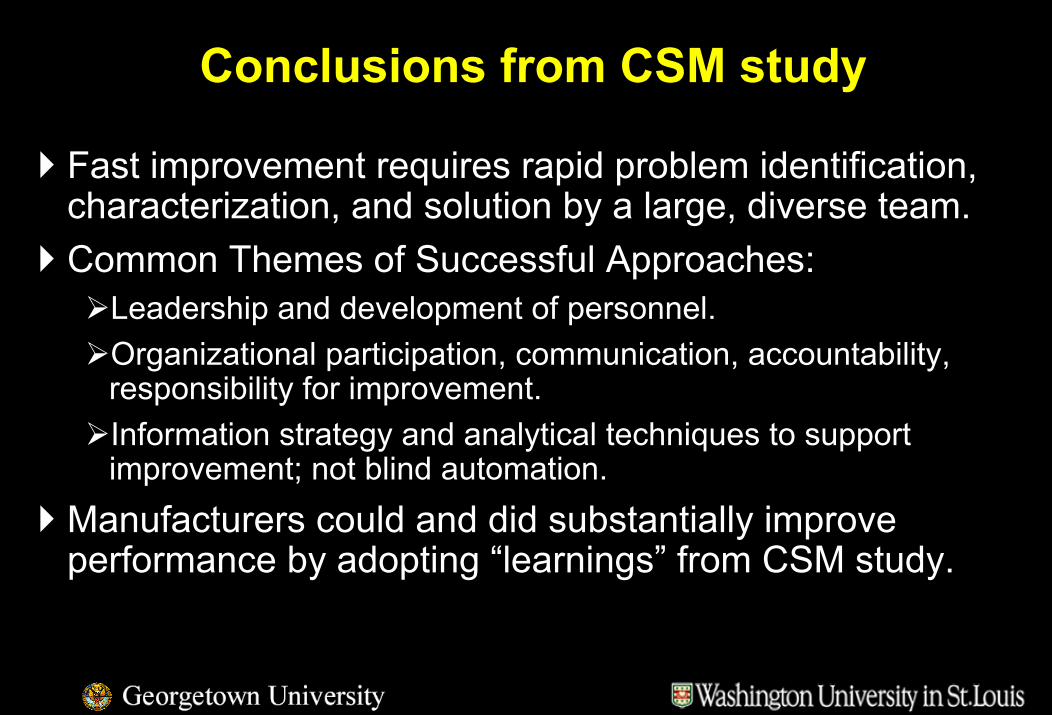
Conclusions from CSM study
Fast improvement requires rapid problem identification, characterization, and solution by a large, diverse team.Common Themes of Successful Approaches:
Leadership and development of personnel.Organizational participation, communication, accountability, responsibility for improvement.Information strategy and analytical techniques to support improvement; not blind automation.
Manufacturers could and did substantially improve performance by adopting “learnings” from CSM study.
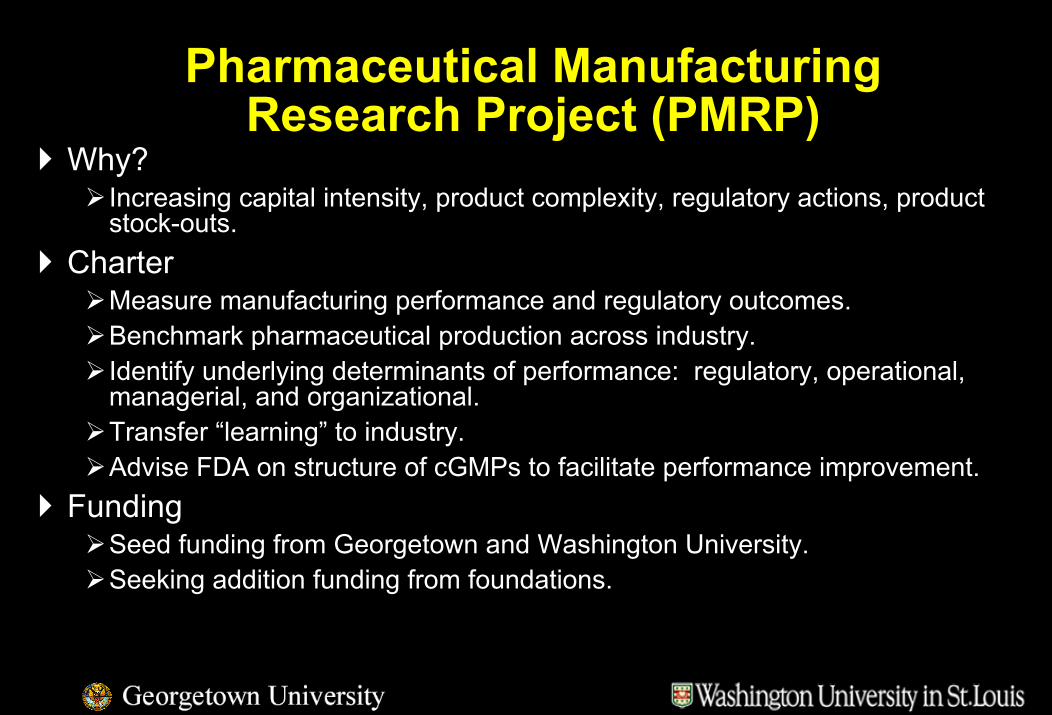
Pharmaceutical Manufacturing Research Project (PMRP)
Why?Increasing capital intensity, product complexity, regulatory actions, product stock-outs.
CharterMeasure manufacturing performance and regulatory outcomes.Benchmark pharmaceutical production across industry.Identify underlying determinants of performance: regulatory, operational, managerial, and organizational.Transfer “learning” to industry.Advise FDA on structure of cGMPs to facilitate performance improvement.
FundingSeed funding from Georgetown and Washington University.Seeking addition funding from foundations.
Proposed Value from PMRP
Develop industry-standard set of benchmarks for measuring manufacturing performance. Provided confidential “scorecard” to plants on how they performed against anonymous others. Identified managerial, organizational, and technical practices underlying good (and poor) performance.Identify regulatory effects on manufacturing performance.Provide positive financial impact to program participants and provide insight to FDA on ways to structure cGMPsfor the 21st Century
PMRP Anticipated Research Dissemination
Benchmarking reports.Industry, FDA, and conference presentations.Extension classes for industry managers.Academic research papers.
PMRP Data Collection
Confidentiality agreement with FDA.Separate confidentiality agreements with manufacturers.Work with manufacturers to determine appropriate benchmarks.
Product is the unit of analysis.Secure web-based questionnaire.Follow-up visits for random sample of participants.FDA actions and outcomes.
PMRP Data Analysis
Assess manufacturing and regulatory performance as a function of managerial, technical organizational, and regulatory practices.Account for product, technology, and locational factors in statistical analysis.Identify best practices that can combine to improve manufacturing and regulatory performance.
PMRP Principal Investigators
Jeffrey Macher, Georgetown UniversityB.S.E., Computer Engineering, University of Michigan.M.B.A., Amos Tuck School of Business, Dartmouth College.Ph.D., Walter A. Haas School of Business, UC Berkeley.
Jackson Nickerson, Washington University in St. LouisB.S.M.E., Worcester Polytechnic Institute.M.B.A., M.S.M.E., Ph.D. UC Berkeley.
Our combined research focuses on the intersection of organization and technology choice, business strategy, and performance.
Next Steps
Currently in pilot phase.Received cooperation of Dr. Janet Woodcock and CDER.Interviewing FDA personnel.Seeking level of interest and cooperation from industry. Meeting with various manufacturing entities.Develop internet-based survey and plant visit protocol.
Data collection phase will begin later this year.