Embed Size (px)
Citation preview

7. LS-DYNA Anwenderforum, Bamberg 2008
© 2008 Copyright by DYNAmore GmbH
Modeling Techniques for Predictive and Robust Dummy Models
- Comparison with Validation and Verification Considerations in other Applications
Ulrich Franz, Sebastian Stahlschmidt, Oliver Graf (DYNAmore GmbH)
Abbreviations: FAT: German Association for Research on Automobile Technology
PDB: Partnership for Dummy Technology and Biomechanics V&V: Validation and Verification
PIRT: Phenomena Identification and Ranking Table SQA: software quality assurance
Keywords: FE Dummy Model Development, Validation, Verification
Validierung / Verifikation
I - I - 1

7. LS-DYNA Anwenderforum, Bamberg 2008
© 2008 Copyright by DYNAmore GmbH
ABSTRACT In many load cases models from third parties are used during vehicle development. Since many years the authors work in development on different dummy models. The projects are in cooperation with organizations of the German automotive industry. The models are world wide used by the LS-DYNA user community. The paper describes the methodology of the development and the techniques applied to achieve reliable, robust and predictive models. In nuclear and defense industry a systematic process called Verification and Validation (V&V) is applied to ensure the predictability and reliability of computational analyses. Since the consequences of a wrong simulation result might cause huge damage in such applications a significant effort is put in developing reliable and accurate numerical models. A summary of the state of the art V&V process is published in ‘Verification, Validation, and Predictive Capability in computational engineering and Physics’ from Oberkampf, Trucano and Hirsch [1]. This paper presents aspects of the V&V methodology published in [1] and examines if the methods used in dummy model development are comparable. TERMINOLOGY In the following a very condensed summary of terms used in V&V process is given. According to needs in the later discussion only limited aspects of the terms are mentioned. Papers providing more details are referenced. Verification and Validation The terms verification and validation are used with different meanings in technical disciplines. This paper will use the terms as defined in [1]: Verification: The process of determining that a model implementation accurately represents the developer's conceptual description of the model and the solution to the model. Validation: The process of determining the degree to which a model is an accurate representation of the real world from the perspective of the intended uses of the model. A graphical representation of the terms V&V is depicted in Figure 1. Figure 1: Phases of modeling and simulation and the role of V&V [2].
Validierung / Verifikation
I - I - 2

7. LS-DYNA Anwenderforum, Bamberg 2008
© 2008 Copyright by DYNAmore GmbH
Phenomena Identification and Ranking Table The Phenomena Identification and Ranking Technique (PIRT) is a systematic way of gathering information from experts on a specific subject, and ranking the importance of the information. In first step for each phenomenon the importance is estimated as high (H), medium (M) or low (L). Furthermore, the knowledge level is assessed as known (K), partially known (P) and unknown (U). Figure 2 shows how this information can be used to determine fields for further investigations or research. Figure 2: Matrix showing importance versus knowledge level [3]. In an expert panel the importance ranking (IR) can be determined by defining rations with the following scheme. The ratios are defined as 100*(S1+S2/2)/ (S1+S2+S3) where the scores Sn go from highest importance/most well-known down as n goes from 1 to 3. An example of a PIRT is depicted in Figure 3. More information on PIRT can be found for instance in [4, 5]. Figure 3: Example of a PIRT [3]. Validation and Application Domain The predictive capability of models is limited to specific load ranges. [1] proposes a chart to visualize the limitations of a model. In the validation domain we have high confidence that the relevant physics is understood, and modeled with high accuracy. In the validation domain the accuracy has been proven by showing the correlation with tests. The boundary of the application domain indicates that outside this region there is a degradation of confidence in the predictive capability of the model. Additionally, an application domain can be visualized and compared with the validation domain. Figure 4 depicts the domains, as presented in [1].
Validierung / Verifikation
I - I - 3

7. LS-DYNA Anwenderforum, Bamberg 2008
© 2008 Copyright by DYNAmore GmbH
Figure 4: Validation and application domain with different overlaps [1]. Validation Experiment A validation experiment is considered as a specific test with the primary purpose to generate data for model enhancement or to prove the model quality. Hence, additional requirements are needed for validation experiments. For instance, very detailed descriptions of the initial and boundary conditions are indispensable. For validation purposes usually a very high number of measurements are used to understand the occurring phenomena. An additional requirement proposed by [1] is to use a hierarchical measurement of increasing computational difficulty, for example from globally integrated to local measurements. Furthermore, [1] suggests designing validation tests to estimate the components of random and systematic error. Validation Hierarchy, Hierarchical Tier Structure In [1] the following explanation is given: ‘The purpose of the validation hierarchy is to help identify a range of experiments, possible separation of coupled physics, and levels of complexity—all of which are related to an engineering system—so that computer codes from different disciplines can be evaluated. Stated differently, the validation hierarchy must be application driven to be of engineering value, not code capability driven’. Often the assemblies of the system lead to a natural tier structure and the hierarchical order follows the assembly sequence. Figure 5 depicts a validation hierarchy for a Hypersonic Cruise Missile [6].
Validierung / Verifikation
I - I - 4

7. LS-DYNA Anwenderforum, Bamberg 2008
© 2008 Copyright by DYNAmore GmbH
Figure 5: Validation hierarchy for a Hypersonic Cruise Missile [6]. Validation Metrics A metric is used to asses the difference between the experimental data and the computational results. It maps the difference to a scalar value that easily allows estimating the overall correlation of the simulation with the experiment. INTRODUCTION The authors developed several finite element models of dummies for LS-DYNA in the last decade. Figure 6 depicts the different models. The models are frequently used by the automotive industry to enhance passive safety of vehicles. The models are developed with two consortiums of the German automotive industry. The initial consortium is the German Research Institute for Automotive Research (FAT). The FAT is part of the German Association of the Automotive Industry (VDA). The VDA consists of members of automobile manufacturers and their development partners, the suppliers, as well as manufacturers of trailers, body superstructures and containers - in total more than 580 companies. The predecessor organization of the VDA was founded in January 1901. The FAT itself was founded in 1971 with the aim of joining topics of scientific research of the automotive industry. The FAT does not conduct this research itself but places orders with selected partners within the framework of joint industrial research. For each project a steering committee is established that defines the tests and controls the model development and guides the development. The members also use the models in vehicle analyses and provide feedback for further enhancements. A project for a new model usually runs 3-4 years in total. Approximately 1.5 years after a project start a model for vehicle development is available. Members of the consortium to develop the ES-2 model have been: Audi AG, Autoliv GmbH, BMW AG, Ford AG, Johnson Controls GmbH, Keiper GmbH & Co, Daimler AG, Adam Opel GmbH, Dr. Ing h.c. F. Porsche AG, and Volkswagen AG. With very few changes the participating companies stayed the same during several projects to develop dummy models. This is almost the same for the representatives in the working group.
Validierung / Verifikation
I - I - 5

7. LS-DYNA Anwenderforum, Bamberg 2008
© 2008 Copyright by DYNAmore GmbH
Since the projects are no longer research-related the responsible organization has changed from FAT to the PDB. The latest activities for new models are hosted by the Partnership for Dummy Technology and Biomechanics (PDB) - an organization of the German OEMs. The companies and representatives in the PDB work group contributed formerly to the dummy development projects in the FAT framework. The PDB adopts exact the same procedure as the FAT. The group also launches new projects to extend the validation domain of a model in case new load scenarios appear. A current project for model enhancement is on the ES-2re model under an oblique load following the FMVSS214 pole test. A current project to develop a new model is launched for the WorldSID. Figure 6: LS-DYNA models developed and constantly enhanced by DYNAmore. In the projects a first test set of material, component, sled, and pendulum tests is performed. Subsequently, a first finite element model is developed with accurate CAD data and the first set of tests. This model is then used in vehicles to understand load paths and levels in the model and to define new tests. This leads to development cycles for each model. The development loops are constantly guided by the responsible FAT or PDB work group. The development scheme is depicted in Figure 7. In addition to the new test data new features of LS-DYNA are implemented. New material laws, new element types, new ways of handling pre-stress easily were adapted in the updated models. The ongoing testing and development together with the strong involvement of the users group of the FAT or PDB is one of the characteristics of the projects. For comparison Figure 8 depicts a diagram of the development process proposed in the V&V discussion. The blue icons symbolize the hierarchical tier structure.
Validierung / Verifikation
I - I - 6

7. LS-DYNA Anwenderforum, Bamberg 2008
© 2008 Copyright by DYNAmore GmbH
Define appropriate testsEnhance the FE model
Generate a first model
Predict the loads by simulation
Material testsAccurate mesh and detailed geometry
Figure 7: Diagram on development cycle in dummy model development. Figure 8: Diagram on V&V development cycle [8]. Blue icon symbols hierarchical tier structure. COMPARISON Although the phenomena occurring in nuclear and defense applications are significantly more complex and the V&V approach is more general the majority of methods are also valuable in development of simpler models. Thus, the methods could help to develop processes for better dummy models. In the closing remarks of [1] the authors propose to improve the V&V activities by contrasting processes that are ideal, possible and ineffective. The authors give examples to the various V&V activities with the three classifications. The following subsections start with a classification for a V&V activity (citation
Validierung / Verifikation
I - I - 7

7. LS-DYNA Anwenderforum, Bamberg 2008
© 2008 Copyright by DYNAmore GmbH
from [1]). The citation is followed by the description of the respective activity in current dummy model development at DYNAmore. If applicable the activity is assigned to one of the three cited classifications. Application Domain Ideal: The application domain for the modeling and simulation capability is well understood and carefully defined, and the accuracy requirements are known. Possible: Portions of the application domain are understood and some of the accuracy requirements are known. Ineffective: The modeling and simulation capability is expected to accurately compute results for every advertised option in the code. The work group of the FAT or PDB is staffed with engineers from occupant analysis groups of the participating companies. Their daily work is occupant safety analysis. Usually, they are in close contact with the test department of their companies. Hence, the knowledge of application domain for the modeling is very well established. In case the application domain is extended by some requirements, new tests for validation will be defined. Subsequently, the model will be enhanced to cover this application domain entirely. The accuracy requirements are driven by several in-house requirements of the OEMs and influenced by the measurements in the different NCAP rankings. Current status of this activity is close to ideal. Figure 9 depicts investigations to determine the application area of the WorldSID in respect to an oblique pole test. Different car designs are considered to estimate the load. Figure 9: Development of barrier shapes according to results from OEMs for oblique pole test. Tier Hierarchy Ideal: The validation tier hierarchy, analogous to the validation pyramid discussed, has been carefully constructed using a systems engineering approach. Possible: The validation hierarchy has been constructed for individual subsystems or components, but the interactions between subsystems have not been studied. Ineffective: No validation hierarchy has been constructed and only expedient validation experiments have been identified. For dummy modeling the validation tier hierarchy can be built analogously to the assembly process. The hierarchy is built by the materials, the parts, the components and the fully assembled dummy. Since the relevant effects are non-linear dynamics for structures and continua the validation tier hierarchy is much less complex than for a missile as shown in Figure 5. But even for the much simpler dummy a huge test matrix is needed to overlap the application domain. Extended material tests, followed by component tests and pendulum and sled tests with fully assembled sled tests are in the validation tier hierarchy. Figure 10 depicts the component tests for the ES-2 rib cage. Only for this sole impact test on the single rib assembly 25 different tests were performed. Figure 11 depicts pendulum impact locations for the ES-2. Figure 12 depicts the various sled shapes used to validate the ES-2 model. This test is performed with different speeds. More details are presented in [7]. The current status of this activity is close to ideal.
Validierung / Verifikation
I - I - 8

7. LS-DYNA Anwenderforum, Bamberg 2008
© 2008 Copyright by DYNAmore GmbH
Figure 10: Different ES-2 component tests of single rib assembly. Figure 11: Different pendulum impact locations for fully assembled dummy. Figure 12: Different barrier shapes used for dummy validation of ES-2.
Validierung / Verifikation
I - I - 9

7. LS-DYNA Anwenderforum, Bamberg 2008
© 2008 Copyright by DYNAmore GmbH
PIRT of physical effects Ideal: The PIRT has been used to identify and rank the importance of physical processes and interactions of processes for all tiers and faces of the validation pyramid. Possible: The PIRT has been used to identify and rank processes on one face of the validation pyramid. Ineffective: No PIRT was constructed and only well exercised physical-process options in the code are considered for V&V activities. The PIRT method is not used formally. But a lot of discussions about priorities and physical effects take place in the work groups. For instance, the friction between interacting parts is considered as an important effect and many different tests were performed to penetrate the effects and its importance. Figure 13 depicts three tests to investigate influence of friction of a cable that is guided through the neck. A physical effect that has been ranked low is for instance the outflow of gas of the soft rib foam during compression. It can be modeled in the application domain by the simple equation of states without detailed modeling of gas pressure in the foam. The current status of this activity is rated as (weak) possible. Figure 13: Test for BioRID 2 to identify importance of friction in cable. PIRT for Verification Ideal: Using the results of the PIRT, code verification activities have been defined and prioritized, schedules set, and needed resources allocated. Possible: Using the results of the PIRT, some of the code verification activities are defined, but the code development resources or schedule dictate which activities will be conducted. Ineffective: No PIRT was constructed and code verification activities are haphazard and only conducted if resources and time become available. The general approach of V&V includes also the verification of the used simulation code. For the dummy model development this consideration is not of interest since the physical problems are much easier and the code verification for this application is not addressed by the work group. Software Quality Assurance (SQA) Ideal: SQA procedures have been defined, implemented, consistently adhered to, and documented. Possible: SQA procedures are poorly defined and partially implemented, only adhered to just before a new code release, and informally documented. Ineffective: SQA procedures have not been considered or implemented, and are only mentioned if the code customer asks about them. The finite element code SQA is provided by others, similar to the verification. If we consider the mod-els as software a few SQA issues can be listed. The current models are tested with several model checkers and the performance of the model is checked on different platforms with SMP and MPP technology. Furthermore, the performance with different executables is tested exemplary. For the applicable issues the current status of the activities is between possible and ideal. PIRT for Validation Ideal: Using the results of the PIRT, model validation activities, both computational and experimental, have been defined and prioritized, schedules set, and needed resources allocated. Possible: The PIRT is used to define and prioritize some model validation activities, but code-application schedules and limited resources require elimination of many validation activities.
Validierung / Verifikation
I - I - 10

7. LS-DYNA Anwenderforum, Bamberg 2008
© 2008 Copyright by DYNAmore GmbH
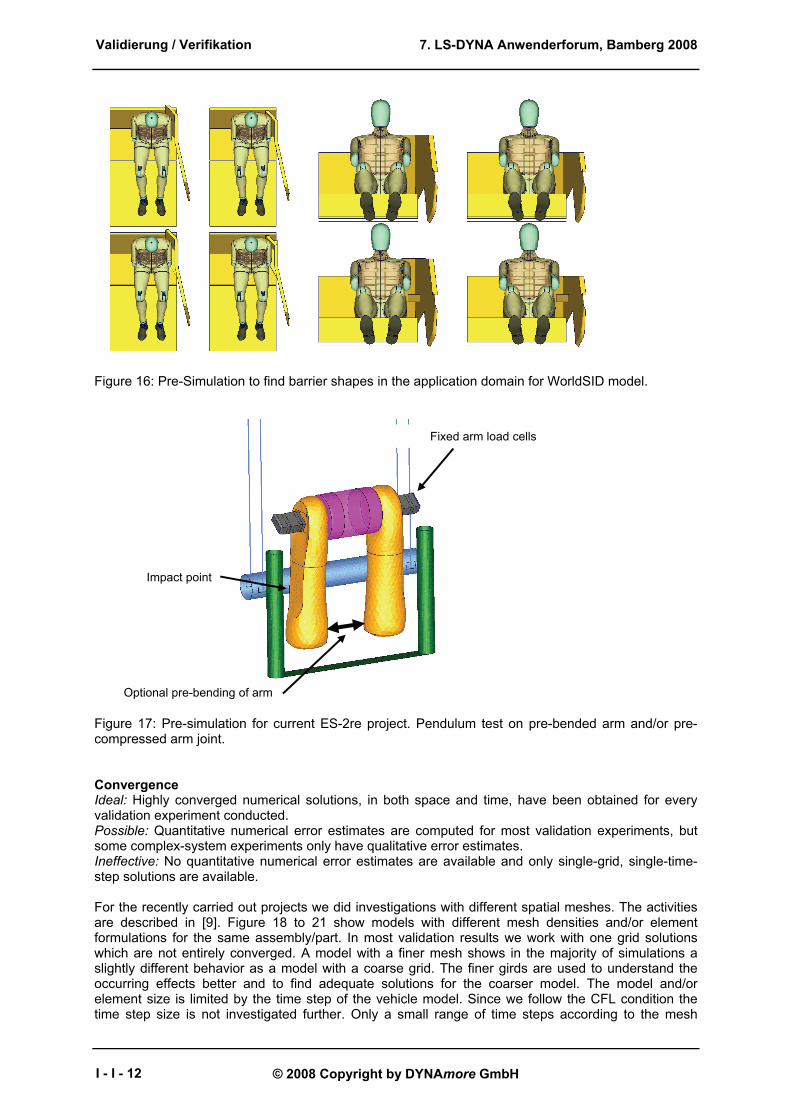
Ineffective: No PIRT was constructed and model validation will only be conducted using existing experimental data. For the dummy model development process all above listed ideal requirements are fulfilled with one exception. The PIRT is not used. The current status of the activity might be rated between ideal and possible. Simulation and Experiment Ideal: The code is used to define, design, and analyze all of the validation experiments. Possible: The code is applied to define and design some of the validation experiments, but many of the code results are only available after the validation experiment is completed. Ineffective: The validation experiments are conducted completely separate from any input from the code development team and code results. In all projects finite element simulation is used intensively to analyze and define the validation experiments. Figure 14 shows a pre-simulation to define an adequate test for the lumbar spine of the WorldSID. Figure 15 shows pre-simulations to define adequate barrier shapes. Figure 17 depicts a pre-simulation to test pre-loaded arm and joint under impact. The current status of the activity might be rated as ideal.
Figure 15: Pre-simulation for lumbar spine test of WorldSID model. First row depicts initial geometry of different test set ups. The second row depicts deformation during lateral pulse for different test set ups.
Validierung / Verifikation
I - I - 11
7. LS-DYNA Anwenderforum, Bamberg 2008
© 2008 Copyright by DYNAmore GmbH
Figure 16: Pre-Simulation to find barrier shapes in the application domain for WorldSID model.
Figure 17: Pre-simulation for current ES-2re project. Pendulum test on pre-bended arm and/or pre-compressed arm joint. Convergence Ideal: Highly converged numerical solutions, in both space and time, have been obtained for every validation experiment conducted. Possible: Quantitative numerical error estimates are computed for most validation experiments, but some complex-system experiments only have qualitative error estimates. Ineffective: No quantitative numerical error estimates are available and only single-grid, single-time-step solutions are available. For the recently carried out projects we did investigations with different spatial meshes. The activities are described in [9]. Figure 18 to 21 show models with different mesh densities and/or element formulations for the same assembly/part. In most validation results we work with one grid solutions which are not entirely converged. A model with a finer mesh shows in the majority of simulations a slightly different behavior as a model with a coarse grid. The finer girds are used to understand the occurring effects better and to find adequate solutions for the coarser model. The model and/or element size is limited by the time step of the vehicle model. Since we follow the CFL condition the time step size is not investigated further. Only a small range of time steps according to the mesh
Optional pre-bending of arm
Impact point
Fixed arm load cells
Validierung / Verifikation
I - I - 12

7. LS-DYNA Anwenderforum, Bamberg 2008
© 2008 Copyright by DYNAmore GmbH
densities at the OEMs is considered. Hence, the current status of this activity is ineffective following the assessment of [1]. The poor assessment is due to a different focus of the dummy model projects compared to the V&V process described in [1]. A main boundary condition of the dummy models is to perform in a given frame work, provided by the vehicle crash models used in passive safety analysis. The V&V process in [1] lacks such a limitation. Figure 18: Models with different element types for WorldSID pelvis. Figure 19: Models with different mesh densities and element types for neck of ES-2. Figure 20: Models with different mesh densities for clavicle box of ES-2.
Validierung / Verifikation
I - I - 13

7. LS-DYNA Anwenderforum, Bamberg 2008
© 2008 Copyright by DYNAmore GmbH
Figure 21: Different mesh densities and element types for model of thorax of ES-2. Validation Experiments Ideal: Validation-experiment data are well characterized, and a large number of experimental realizations are available for estimating random and bias errors. Possible: The experimental data are moderately characterized, and only two experimental realizations are obtained. Ineffective: Only one experimental realization is available and no estimates are available for random or bias errors in needed computational quantities or in measured experimental results. The validation experiments are well characterized and fulfill the requirements listed in [1]. The dummies are fully equipped and many additional signals are measured. The tests are usually performed 3 times and with 3 different dummies. The dummies are provided by different car companies and calibrated at different labs. A systematic error that might occur at a certain test lab has not been investigated. A set of tests is usually performed at only one lab. The current activity might be rated between possible and ideal, may by closer to ideal. Validation Metrics Ideal: Validation metrics are carefully defined and requirements stated, and clearly connected to modeling and simulation requirements for the application domain. Possible: Validation metrics are only defined and requirements stated for high-level system responses, and not defined or requirements stated for low-level (i.e., unit tier) physical response. Ineffective: Validation metrics are not defined and only qualitative assessment is to be used for low-level physical responses. The FAT/PDB developed a metric to assess the correlation of simulation with experimental data. During the dummy development the correlation is usually assessed visually, since the main effort is to
Validierung / Verifikation
I - I - 14

7. LS-DYNA Anwenderforum, Bamberg 2008
© 2008 Copyright by DYNAmore GmbH
determine the time and source of deviation. Hence, a small deviation might be more important than a significant difference in the maximum value. We have not developed a metric that takes this particular interest into account. The FAT/PDB metric assess the deviation in respect to the final application. Therefore, it has less relevance for the model development. For the recently carried out releases an assessment with the FAT/PDB measurement is scheduled. The current status of this activity might be rated as possible. Statistics Ideal: Using statistical data for both computational and experimental results for the validation metrics, one is able to precisely quantify the accuracy of the model for all validation experiments. Possible: Statistical data are available from the experimental results but computational results are limited to deterministic metrics because of highly constrained budgets and schedules. Ineffective: Validation metrics are not defined and the ‘view-graph norm’ is used for assessment. For applying statistics the experimental data base I is too small. For the models we use optimization and robustness techniques to enhance the models. Paper [9] presents stochastic methods during development of the BioRID 2 model. Figure 22 shows standard deviation of in displacements during a robustness study. Figure 23 depicts the correlation matrix of the BioRID 2 model and Figure 24 depicts the results predicted using meta models. The current status of this activity might be rated as weak possible.
Figure 22: BioRID 2 model in sled test. Left: Initial condition; Right: Standard deviation in x dis-placement during robustness analysis. Figure 23: Correlation matrix of sled test of BioRID 2 model.
Validierung / Verifikation
I - I - 15

7. LS-DYNA Anwenderforum, Bamberg 2008
© 2008 Copyright by DYNAmore GmbH
Figure 24: Head rotation angel and acceleration results depending on changes in a dummy material. Information extracted from respond surfaces. Documentation Ideal: Lessons learned from all of the validation activities are clearly formulated, documented, and broadly communicated. Possible: Lessons learned from some validation experiments are documented, but only those where the validation experiment and the code accuracy was considered a success. Ineffective: No time or resources are available for determining or documenting lessons learned, and lessons that are learned are verbally and randomly communicated. The experiences with experiments are used to constantly enhance a generic part of the specifications for new experiments. Thus, many problems in the tests occur only once. The experimental knowledge is only communicated with the test labs that are performing tests for validation purposes. Experiences in the modeling are less well documented. Since they are the key knowledge of the model developer they are not broadly communicated. The current status of this activity might be rated as possible.
CONCLUSION During the last decade DYNAmore developed several LS-DYNA models of dummies. All models were jointly developed with the German automotive industry. During the projects the methodology was refined and enhanced constantly. The models are commercially available and supported by local software suppliers. All models are frequently used world wide to enhance passive safety behavior of vehicles. The paper outlines roughly aspects of the validation and verification process applied to simulations in nuclear and defense industry. The main focus is on validation since majority of verification activities is not part of the dummy model development. The physical phenomena in nuclear or defense industry are significantly more complex than for dummy modeling. The dominant discipline in dummy modeling is nonlinear dynamics for continua and structures, which is also an important phenomenon in the referenced V&V processes. The comparison of the validation methodologies in the 2 applications shows a lot of similarities. That in the dummy model development the validation process is much less formalized can be regarded as main difference. The requirements on validation experiments, work groups, metrics, quality assurance, hierarchical tier are very similar. For certain activities the dummy development has already achieved the status “ideal” if we follow the assessment proposed by [1]. Since the investigation for V&V processes in nuclear and defense applications are very well developed and also backed by legal requirements, the result is understood as positive finding for the dummy model development at DYNAmore with the FAT and PDB consortia. DYNAmore will adapt more and more the V&V process outlined in [1].
Validierung / Verifikation
I - I - 16
7. LS-DYNA Anwenderforum, Bamberg 2008
© 2008 Copyright by DYNAmore GmbH
REFERENCES [1] W. L. Oberkampf, T. G. Trucano, and C. Hirsch: “Verification, Validation, and Predictive Capability in Computational Engineering and Physics”, Foundations for Verification and Validation in the 21 Century Workshop, John Hopkins University, Maryland, 2002. [2] C. J. Roy, M. A. McWherter-Payne, and W. L. Oberkampf: “Verification and Validation for Laminar Hypersonic Flowfields”, AIAA2000-2550, Fluids 2000 Conference, Denver, 2000. [3] D. J. Diamond: “Experience Using Phenomena Identification and Ranking Technique (PIRT) for Nuclear Analysis”, PHYSOR-2006 Topical Meeting, Vancouver, Canada, 2006. [4] B. E. Boyak, et al.: “Phenomenon Identification and Ranking Tables (PIRTs) for Rod Ejection Accidents in Pressurized Water Reactors Containing High Burnup Fuel.”, NUREG/CR-6742, U.S. Nuclear Regulatory Commission, September 2001. [5] B. E. Boyak, et al.: “Phenomenon Identification and Ranking Tables (PIRTs) for Power Oscillations without Scram in Boiling Water Reactors Containing High Burnup Fuel.”, NUREG/CR-6743, U.S. Nuclear Regulatory Commission, September 2001. [6] W. L. Oberkampf, D.P. Aeschliman, R. E. Tate, and J. F. Henfling: “Experimental Aerodynamics Research on a Hypersonic Vehicle”, Sandia National Laboratories, SAND92- 1411, Albuquerque, NM, 1993. [7] U. Franz , S. Stahlschmidt, E. Schelkle, T. Frank: “15 Years of Finite Element Dummy Model Development within the German Association for Research on Automobile Technology (FAT)”, JRI Japanese LS-DYNA Conference, Nagoya, Japan 2008. [8] B. Thacker: “Reliability Methods for Uncertainty Quantification and Propagation in Model V&V”, IMAC-XXVI Conference & Exposition on Structural Dynamics, Orlando, FL, 2008. [9] U. Franz, A. Gromer, M. Walz, J. Zschieschack, Y. Huang: “Ideas On Applying Very Fine Models in Dummy Model Development”, 10th International LS-DYNA Conference, Detroit, 2008. [10] S. Stahlschmidt, B. Keding, K. Witowski, H. Müllerschön, U. Franz: „ BioRID-II Dummy Model Development -Stochastic Investigations”, DYNAmore LS-DYNA Conference 2006, Ulm 2006.
Validierung / Verifikation
I - I - 17

7. LS-DYNA Anwenderforum, Bamberg 2008
© 2008 Copyright by DYNAmore GmbH
Validierung / Verifikation
I - I - 18