Embed Size (px)
Citation preview
continued on page 3
for Business Spring 2015
Esri News
Dylan’s Candy Bar, a Willy Wonka-like retail outlet dedicated to the sweet things in life, gets a boost in choosing a new retail outlet—thanks to a new data layer that displays pedestrian traffic throughout New York City at various times of the day. Forget the phrase “like a kid in a candy store”—Dylan’s Candy Bar has raised the chocolate bar to new heights. Adults feel right at home in the 13,000-square-foot, three-story flagship store, which also boasts a café and even a bar. Customers over 21 can imbibe in specialty drinks like Pink Cotton Candy, made with Pinnacle cotton candy-flavored vodka, and the
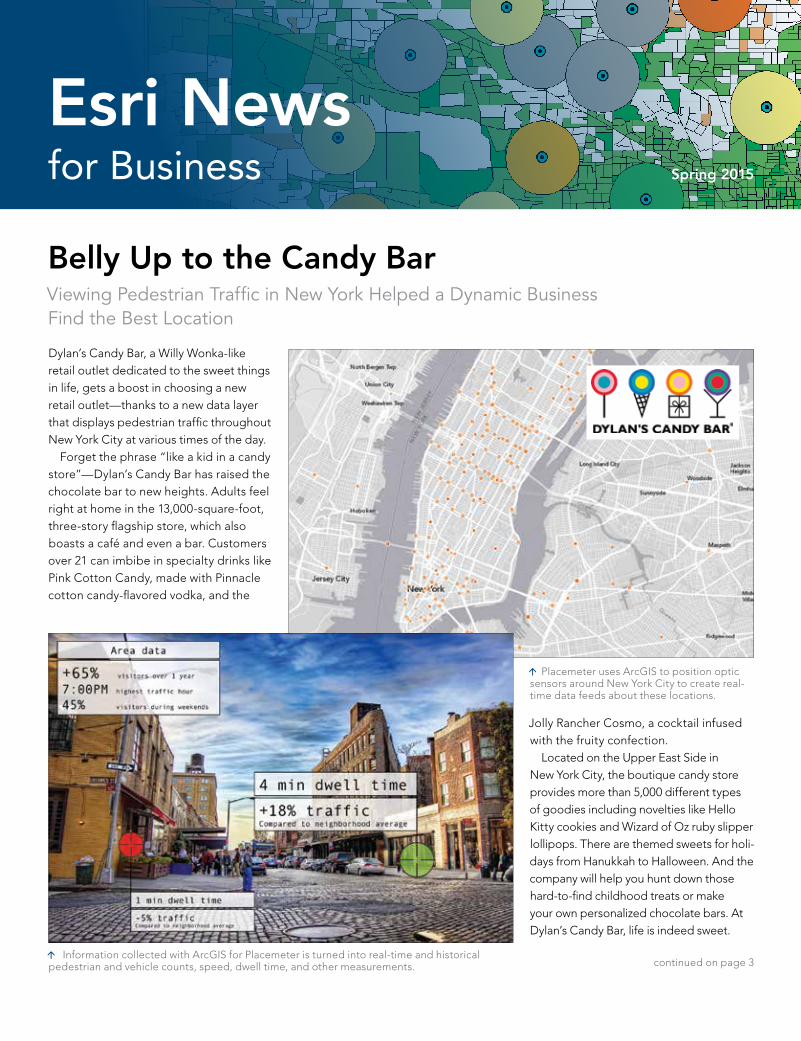
Belly Up to the Candy BarViewing Pedestrian Traffic in New York Helped a Dynamic Business Find the Best Location
Jolly Rancher Cosmo, a cocktail infused with the fruity confection. Located on the Upper East Side in New York City, the boutique candy store provides more than 5,000 different types of goodies including novelties like Hello Kitty cookies and Wizard of Oz ruby slipper lollipops. There are themed sweets for holi-days from Hanukkah to Halloween. And the company will help you hunt down those hard-to-find childhood treats or make your own personalized chocolate bars. At Dylan’s Candy Bar, life is indeed sweet.
Information collected with ArcGIS for Placemeter is turned into real-time and historical pedestrian and vehicle counts, speed, dwell time, and other measurements.
Placemeter uses ArcGIS to position optic sensors around New York City to create real-time data feeds about these locations.
Spring 2015
Esri News for Business is a publication of the Business Solutions Group of Esri.To contact the Esri Desktop Order Center, call 1-800-447-9778 within the United States or 909-793-2853, extension 1-1235, outside the United States.
Visit the Esri website at esri.com.
View Esri News for Business online at esri.com/business or scan the code below with your smartphone.
Advertise with UsE-mail [email protected].
Submit ContentTo submit articles for publication in Esri News for Business, contact Karen Richardson at [email protected].
Manage Your SubscriptionTo subscribe, unsubscribe or make changes to your Esri publications please go to esri.com/updates.
Outside the United States please contact your international distributor to subscribe, unsubscribe, or change your address. For a directory of distributors, visit esri.com/distributors.
Circulation ServicesFor back issues, missed issues, and other circulation services, e-mail [email protected]; call 909-793-2853, extension 1-2778; or fax 909-798-0560.
2 Esri News for Business Spring 2015
Contents
Cover
1 Belly Up to the Candy Bar
Case Study
4 Breaking through the Poverty Barrier
5 Reliable Growth in the Restaurant Market
5 Business Sense
Partner Spotlight
6 Beer, Beards, and Batteries: Leveraging Weather to Maximize Profitability
7 Free Apps for ArcGIS Subscribers
Data Spotlight
8 One Platform for a World of Street Data
Apps Spotlight
10 Mapping Social Media in Esri Maps for Office
The information contained in this work is the exclusive property of Esri or its licensors. This work is protected under United States copyright law and other international copyright treaties and conventions. No part of this work may be reproduced or transmitted in any form or by any means, electronic or mechanical, including photocopying and recording, or by any information storage or retrieval system, except as expressly permitted in writing by Esri. All requests should be sent to Attention: Contracts and Legal Services Manager, Esri, 380 New York Street, Redlands, CA 92373-8100 USA.
The information contained in this work is subject to change without notice.
@esri.com, 3D Analyst, ACORN, Address Coder, ADF, AML, ArcAtlas, ArcCAD, ArcCatalog, ArcCOGO, ArcData, ArcDoc, ArcEdit, ArcEditor, ArcEurope, ArcExplorer, ArcExpress, ArcGIS, arcgis.com, ArcGlobe, ArcGrid, ArcIMS, ARC/INFO, ArcInfo, ArcInfo Librarian, ArcLessons, ArcLocation, ArcLogistics, ArcMap, ArcNetwork, ArcNews, ArcObjects, ArcOpen, ArcPad, ArcPlot, ArcPress, ArcPy, ArcReader, ArcScan, ArcScene, ArcSchool, ArcScripts, ArcSDE, ArcSdl, ArcSketch, ArcStorm, ArcSurvey, ArcTIN, ArcToolbox, ArcTools, ArcQuest, ArcUSA, ArcUser, ArcView, ArcVoyager, ArcWatch, ArcWeb, ArcWorld, ArcXML, Atlas GIS, AtlasWare, Avenue, BAO, Business Analyst, Business Analyst Online, BusinessMAP, CityEngine, Community, Community Analyst, CommunityInfo, Community Maps, Database Integrator, DBI Kit, EDN, Esri, esri.com, Esri—Team GIS, Esri—The GIS Company, Esri—The GIS People, Esri—The GIS Software Leader, FormEdit, GeoCollector, GeoEnrichment, Geographic Design System, Geography Matters, Geography Network, geographynetwork.com, Geoloqi, Geotrigger, GIS by Esri, gis.com, GISData Server, GIS Day, gisday.com, GIS for Everyone, JTX, MapIt, Maplex, MapObjects, MapStudio, ModelBuilder, MOLE, MPS—Atlas, PLTS, Rent-a-Tech, SDE, SML, Sourcebook•America, SpatiaLABS, Spatial Database Engine, StreetMap, Tapestry, the ARC/INFO logo, the ArcGIS Explorer logo, the ArcGIS logo, the ArcPad logo, the Esri globe logo, the Esri Press logo, The Geographic Advantage, The Geographic Approach, the GIS Day logo, the MapIt logo, The World’s Leading Desktop GIS, Water Writes, and Your Personal Geographic Information System are trademarks, service marks, or registered marks of Esri in the United States, the European Community, or certain other jurisdictions. CityEngine is a registered trademark of Procedural AG and is distributed under license by Esri.
Other companies and products or services mentioned herein may be trademarks, service marks, or registered marks of their respective mark owners.
Copyright © 2015 Esri.All rights reserved. Printed in the United States of America.
continued on page 11
3Spring 2015 esri.com/business
Cover
Belly Up to the Candy Bar continued from cover
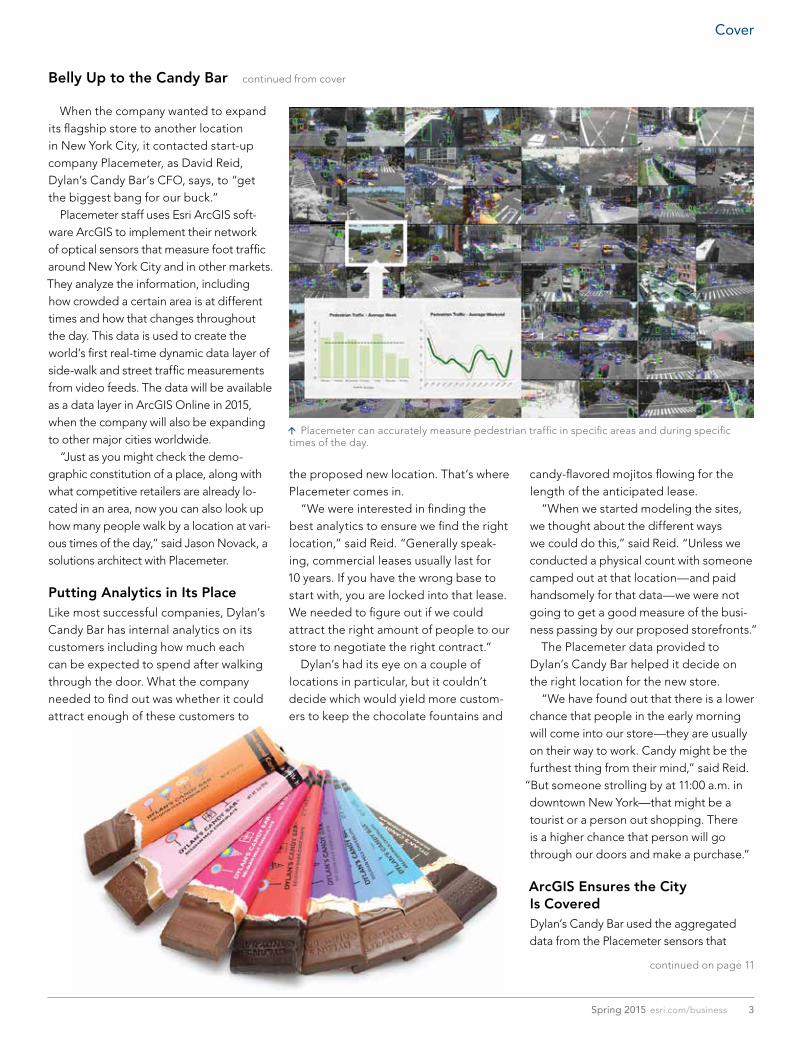
Placemeter can accurately measure pedestrian traffic in specific areas and during specific times of the day.
When the company wanted to expand its flagship store to another location in New York City, it contacted start-up company Placemeter, as David Reid, Dylan’s Candy Bar’s CFO, says, to “get the biggest bang for our buck.” Placemeter staff uses Esri ArcGIS soft-ware ArcGIS to implement their network of optical sensors that measure foot traffic around New York City and in other markets. They analyze the information, including how crowded a certain area is at different times and how that changes throughout the day. This data is used to create the world’s first real-time dynamic data layer of side-walk and street traffic measurements from video feeds. The data will be available as a data layer in ArcGIS Online in 2015, when the company will also be expanding to other major cities worldwide. “Just as you might check the demo-graphic constitution of a place, along with what competitive retailers are already lo-cated in an area, now you can also look up how many people walk by a location at vari-ous times of the day,” said Jason Novack, a solutions architect with Placemeter.
Putting Analytics in Its PlaceLike most successful companies, Dylan’s Candy Bar has internal analytics on its customers including how much each can be expected to spend after walking through the door. What the company needed to find out was whether it could attract enough of these customers to
the proposed new location. That’s where Placemeter comes in. “We were interested in finding the best analytics to ensure we find the right location,” said Reid. “Generally speak-ing, commercial leases usually last for 10 years. If you have the wrong base to start with, you are locked into that lease. We needed to figure out if we could attract the right amount of people to our store to negotiate the right contract.” Dylan’s had its eye on a couple of locations in particular, but it couldn’t decide which would yield more custom-ers to keep the chocolate fountains and
candy-flavored mojitos flowing for the length of the anticipated lease. “When we started modeling the sites, we thought about the different ways we could do this,” said Reid. “Unless we conducted a physical count with someone camped out at that location—and paid handsomely for that data—we were not going to get a good measure of the busi-ness passing by our proposed storefronts.” The Placemeter data provided to Dylan’s Candy Bar helped it decide on the right location for the new store. “We have found out that there is a lower chance that people in the early morning will come into our store—they are usually on their way to work. Candy might be the furthest thing from their mind,” said Reid.
“But someone strolling by at 11:00 a.m. in downtown New York—that might be a tourist or a person out shopping. There is a higher chance that person will go through our doors and make a purchase.”
ArcGIS Ensures the City Is CoveredDylan’s Candy Bar used the aggregated data from the Placemeter sensors that
4 Esri News for Business Spring 2015
Grameen America is a nonprofit organization dedicated to help-ing women who live in poverty build small businesses to create better lives for themselves and their families. It offers microloans, training, and support to create jobs and transform communities throughout the United States. Based on the Nobel Prize-winning model of the Grameen Bank in Bangladesh, Grameen America has demonstrated that there is a tremendous need for access to credit and alternative financial services in the United States. In just six years, Grameen America has disbursed over $171 million to more than 32,000 women. Grameen America utilizes Esri Business Analyst to identify areas of need to determine and prioritize new locations for expansion. Since opening in 2008, Grameen America has expanded to 11 cities across the United States including New York City, Los Angeles, Indianapolis, Omaha, Charlotte, the San Francisco Bay Area, Austin, Boston, Union City, San Juan, and San Jose. Branches are located in areas with a high concentration of people living below the federal poverty line that are in need of Grameen America’s financial products and services. In the United States, there are more than 46 million people living below the poverty line. Of this group, approximately 19.4 million are located in principal cities of major metropolitan areas. The organization’s leadership sought a tool that could help sift through this landscape of infor-mation. “We knew we needed a smart technology that would take us there,” said Katherine Rosenberg, executive vice president.
Business Analyst Finds Those in NeedEsri Business Analyst is a tool used by many organizations to look closely at geodemographic information to better manage busi-ness processes like expansion and localized marketing. In 2009, Grameen America joined the Esri Nonprofit Organization Program, which helps conservation and humanitarian nonprofit organiza-tions around the world acquire ArcGIS software and services. Esri worked closely with the Grameen America team to deter-mine which demographic variables are indicators of successful markets. Using these indicators to identify ideal target markets, Grameen America has used Business Analyst to prioritize metro-politan areas for program expansion. Furthermore, Esri has helped to pinpoint specific neighborhoods that Grameen America should target upon market selection. “Now, as we look to enter new markets, we are able to more easily select which cities to prioritize for growth,” said Rosenberg. “We have also started using the soft-ware more frequently to identify potential locations within cities. As we grow, we can see a clearer picture of where our borrowers are coming from and can better understand the effects that new branches have on our borrower growth.”
Breaking through the Poverty BarrierGrameen America Uses Business Analyst to Find a Pathway Leading the Poor to Prosperity
Today, Grameen America uses Business Analyst to build custom datasets that identify the high-density populations the organiza-tion is trying to serve. “We were amazed at how easy it was to combine all of our different criteria to be able to see areas that had the highest concentration or the densest clusters,” said Rosenberg.
Astute Business Planning Helps Nonprofits Grow, Create ChangeWith the help of this software, Grameen America was able to determine that Los Angeles was a prime location with great need of its services. Bertha, a member at Grameen America’s Los Angeles branch, is a perfect example. Bertha works side by side with her husband in a bakery in Boyle Heights. Sharing a space with another baker has saved Bertha’s business money and given her all the equipment she needs, including industrial-sized ovens and large mixers. But even with this equipment, Bertha’s production had remained slow because she did not have enough ingredients on hand. With her first Grameen America microloan, she bought flour and sugar in bulk to increase production. Today, she and her husband alternate traveling up to 90 miles outside of Los Angeles to sell their cookies at Mexican fairs and farmers’ markets. Her goal is to expand her business by opening more bakeries in the high-demand markets outside of the city. Using Business Analyst, Grameen America has been able to harness the power of data collection and analysis to better serve communities across the country. “All people are entre-preneurs, but many don’t have the opportunity to find that out,” explained Grameen America founder and board chair professor Muhammad Yunus. “All we need to get poor people out of poverty is to create an enabling environment.”
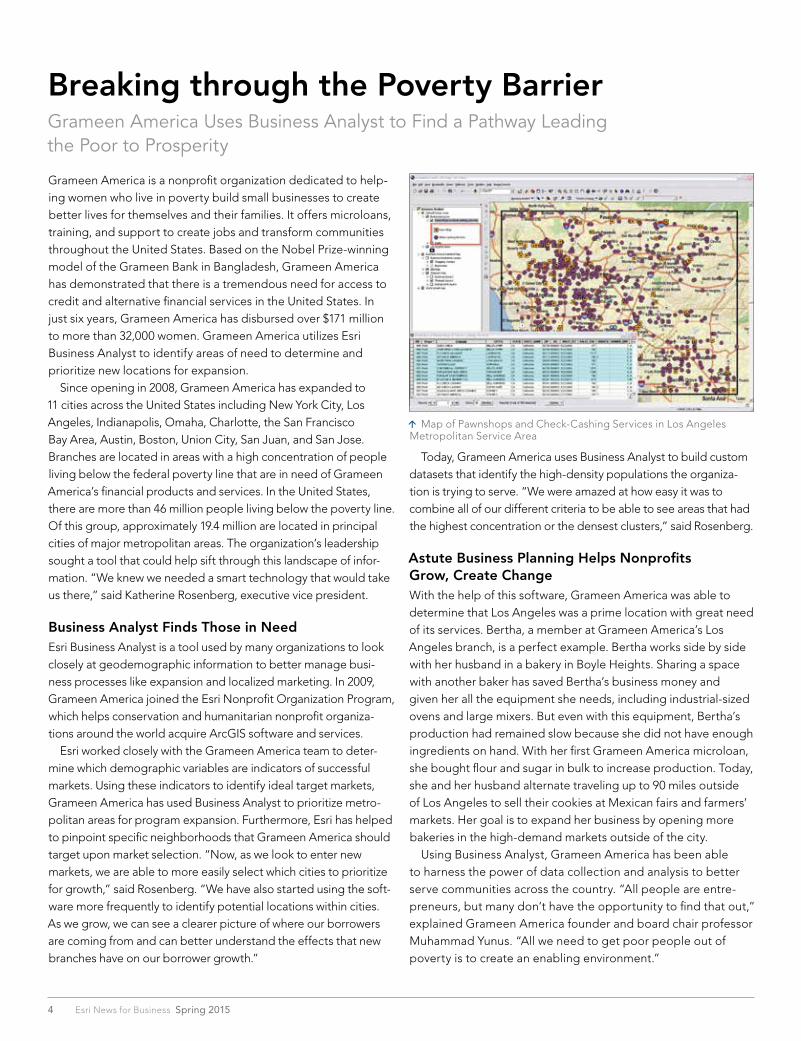
Map of Pawnshops and Check-Cashing Services in Los Angeles Metropolitan Service Area
Business SenseSimon ThompsonDirector of Commercial Industry, Esri
As smartphones and tablets become a more integral part of the shopping experience, the boundary between online and offline shopping is becoming increasingly blurred. This is where geography and location analytics can help. Geography brings together and allows us to analyze differ-ent types of data using location indicators, from the ping of an iBeacon to a bar code scan to where a coupon is used to tracking anonymous shoppers in stores and malls.
Today, every twenty-first-century dataset contains location information. And with location analytics, we are empow-ered with tools and techniques to exploit it. What does this mean? Locating stores near a particular demographic is no longer the most important rule of site location. It’s no longer a negative for 95 percent of your customers to live more than 10 miles away from your stores. If you can connect with them, they will buy.
With Esri Location Analytics, you can create a unified concept that includes store layouts, demographics, planograms, and 3D visualizations within your business intelligence (BI) and customer relationship management (CRM) platforms. Don’t use fiction and anecdotes. Base your decisions on facts and validated insights—customer profiles based on behaviors, true travel zones, and real spheres of influence, all the way down to understanding who passes in front of your door, when, and how many. You can even analyze which direction customers go when they enter a store, including their dwell times in front of product displays and endcaps.
As the multichannel data becomes more important, data complexity and size are only going to increase. It is para-mount that successful retailers get on board.
Use location to create a “digital sandwich” of layers containing insight, patterns of behavior, and key facts. Discover new strategies. Breathe new life into old ones. Try Esri Location Analytics on for size.
5Spring 2015 esri.com/business
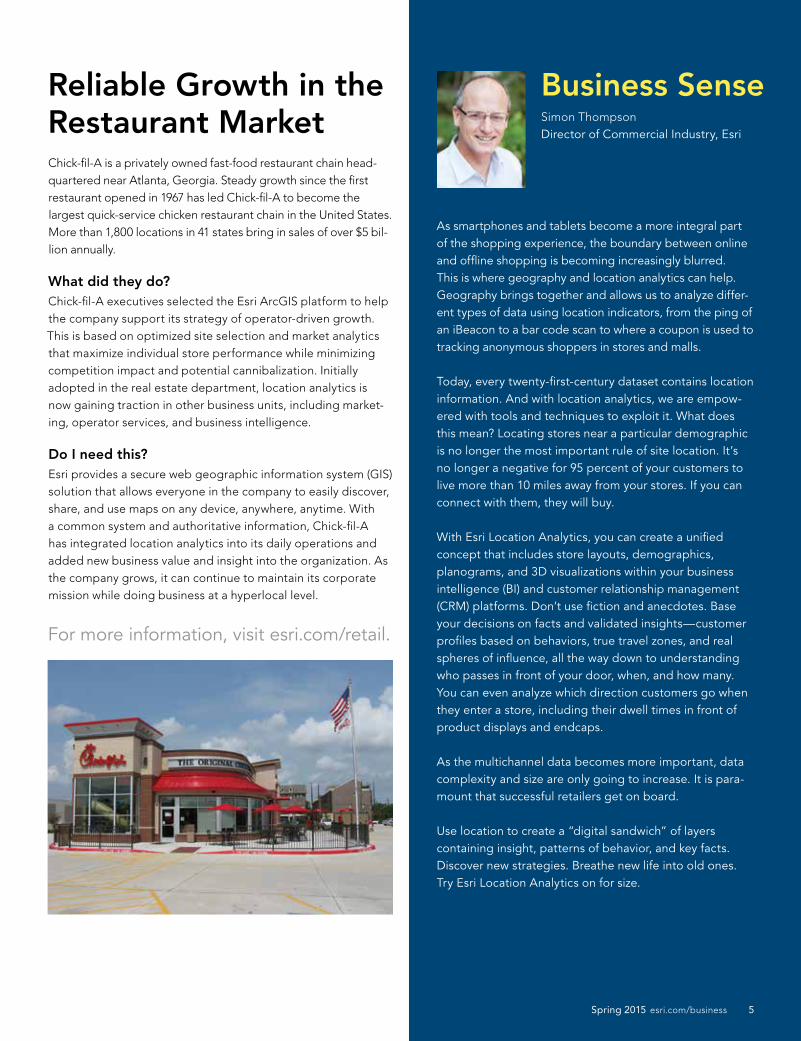
Chick-fil-A is a privately owned fast-food restaurant chain head-quartered near Atlanta, Georgia. Steady growth since the first restaurant opened in 1967 has led Chick-fil-A to become the largest quick-service chicken restaurant chain in the United States. More than 1,800 locations in 41 states bring in sales of over $5 bil-lion annually.
What did they do? Chick-fil-A executives selected the Esri ArcGIS platform to help the company support its strategy of operator-driven growth. This is based on optimized site selection and market analytics that maximize individual store performance while minimizing competition impact and potential cannibalization. Initially adopted in the real estate department, location analytics is now gaining traction in other business units, including market-ing, operator services, and business intelligence.
Do I need this?Esri provides a secure web geographic information system (GIS) solution that allows everyone in the company to easily discover, share, and use maps on any device, anywhere, anytime. With a common system and authoritative information, Chick-fil-A has integrated location analytics into its daily operations and added new business value and insight into the organization. As the company grows, it can continue to maintain its corporate mission while doing business at a hyperlocal level.
For more information, visit esri.com/retail.
Reliable Growth in the Restaurant Market
6 Esri News for Business Spring 2015
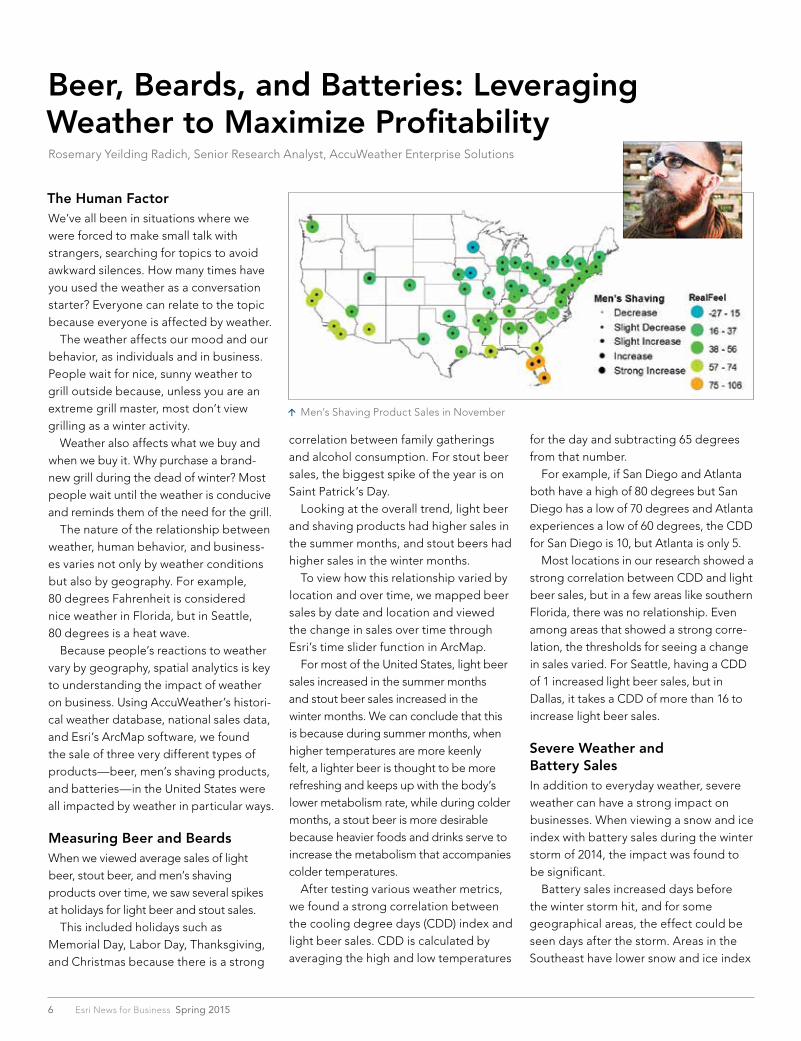
The Human FactorWe’ve all been in situations where we were forced to make small talk with strangers, searching for topics to avoid awkward silences. How many times have you used the weather as a conversation starter? Everyone can relate to the topic because everyone is affected by weather. The weather affects our mood and our behavior, as individuals and in business. People wait for nice, sunny weather to grill outside because, unless you are an extreme grill master, most don’t view grilling as a winter activity. Weather also affects what we buy and when we buy it. Why purchase a brand-new grill during the dead of winter? Most people wait until the weather is conducive and reminds them of the need for the grill. The nature of the relationship between weather, human behavior, and business-es varies not only by weather conditions but also by geography. For example, 80 degrees Fahrenheit is considered nice weather in Florida, but in Seattle, 80 degrees is a heat wave. Because people’s reactions to weather vary by geography, spatial analytics is key to understanding the impact of weather on business. Using AccuWeather’s histori-cal weather database, national sales data, and Esri’s ArcMap software, we found the sale of three very different types of products—beer, men’s shaving products, and batteries—in the United States were all impacted by weather in particular ways.
Measuring Beer and BeardsWhen we viewed average sales of light beer, stout beer, and men’s shaving products over time, we saw several spikes at holidays for light beer and stout sales. This included holidays such as Memorial Day, Labor Day, Thanksgiving, and Christmas because there is a strong
Beer, Beards, and Batteries: Leveraging Weather to Maximize ProfitabilityRosemary Yeilding Radich, Senior Research Analyst, AccuWeather Enterprise Solutions
correlation between family gatherings and alcohol consumption. For stout beer sales, the biggest spike of the year is on Saint Patrick’s Day. Looking at the overall trend, light beer and shaving products had higher sales in the summer months, and stout beers had higher sales in the winter months. To view how this relationship varied by location and over time, we mapped beer sales by date and location and viewed the change in sales over time through Esri’s time slider function in ArcMap. For most of the United States, light beer sales increased in the summer months and stout beer sales increased in the winter months. We can conclude that this is because during summer months, when higher temperatures are more keenly felt, a lighter beer is thought to be more refreshing and keeps up with the body’s lower metabolism rate, while during colder months, a stout beer is more desirable because heavier foods and drinks serve to increase the metabolism that accompanies colder temperatures. After testing various weather metrics, we found a strong correlation between the cooling degree days (CDD) index and light beer sales. CDD is calculated by averaging the high and low temperatures
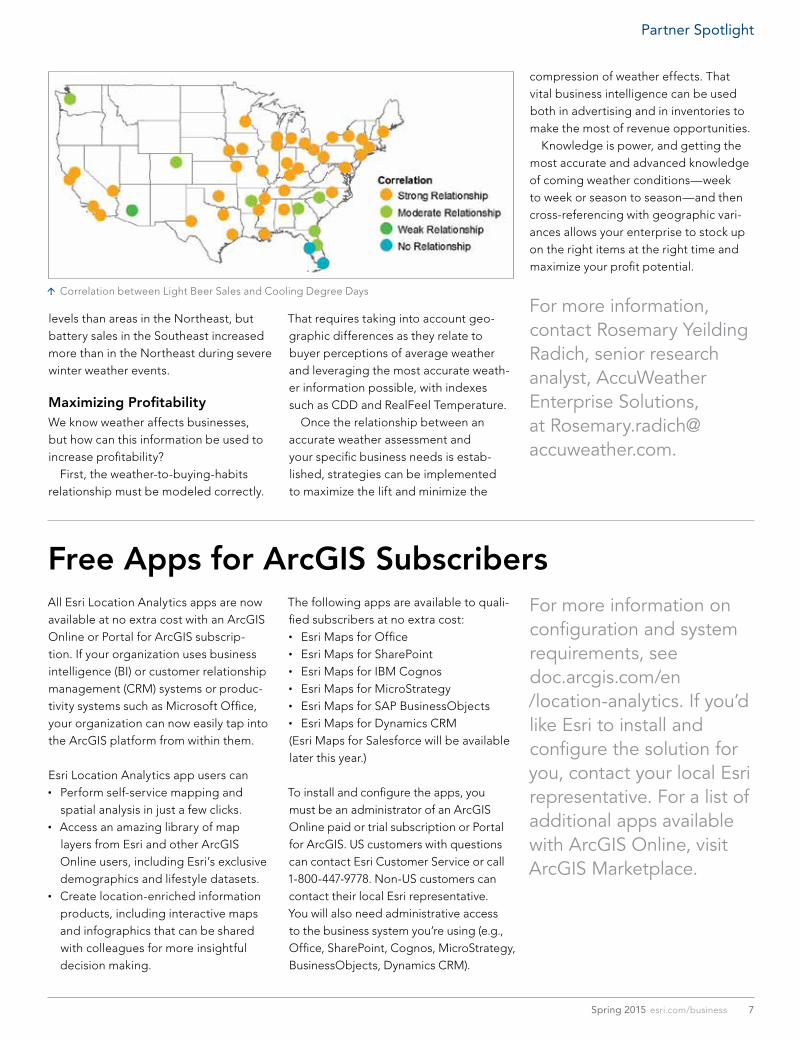
for the day and subtracting 65 degrees from that number. For example, if San Diego and Atlanta both have a high of 80 degrees but San Diego has a low of 70 degrees and Atlanta experiences a low of 60 degrees, the CDD for San Diego is 10, but Atlanta is only 5. Most locations in our research showed a strong correlation between CDD and light beer sales, but in a few areas like southern Florida, there was no relationship. Even among areas that showed a strong corre-lation, the thresholds for seeing a change in sales varied. For Seattle, having a CDD of 1 increased light beer sales, but in Dallas, it takes a CDD of more than 16 to increase light beer sales.
Severe Weather and Battery SalesIn addition to everyday weather, severe weather can have a strong impact on businesses. When viewing a snow and ice index with battery sales during the winter storm of 2014, the impact was found to be significant. Battery sales increased days before the winter storm hit, and for some geographical areas, the effect could be seen days after the storm. Areas in the Southeast have lower snow and ice index
Men’s Shaving Product Sales in November
7Spring 2015 esri.com/business
levels than areas in the Northeast, but battery sales in the Southeast increased more than in the Northeast during severe winter weather events.
Maximizing ProfitabilityWe know weather affects businesses, but how can this information be used to increase profitability? First, the weather-to-buying-habits relationship must be modeled correctly.
All Esri Location Analytics apps are now available at no extra cost with an ArcGIS Online or Portal for ArcGIS subscrip-tion. If your organization uses business intelligence (BI) or customer relationship management (CRM) systems or produc-tivity systems such as Microsoft Office, your organization can now easily tap into the ArcGIS platform from within them.
Esri Location Analytics app users can • Perform self-service mapping and
spatial analysis in just a few clicks. • Access an amazing library of map
layers from Esri and other ArcGIS Online users, including Esri’s exclusive demographics and lifestyle datasets.
• Create location-enriched information products, including interactive maps and infographics that can be shared with colleagues for more insightful decision making.
Correlation between Light Beer Sales and Cooling Degree Days
That requires taking into account geo-graphic differences as they relate to buyer perceptions of average weather and leveraging the most accurate weath-er information possible, with indexes such as CDD and RealFeel Temperature. Once the relationship between an accurate weather assessment and your specific business needs is estab-lished, strategies can be implemented to maximize the lift and minimize the
compression of weather effects. That vital business intelligence can be used both in advertising and in inventories to make the most of revenue opportunities. Knowledge is power, and getting the most accurate and advanced knowledge of coming weather conditions—week to week or season to season—and then cross-referencing with geographic vari-ances allows your enterprise to stock up on the right items at the right time and maximize your profit potential.
For more information, contact Rosemary Yeilding Radich, senior research analyst, AccuWeather Enterprise Solutions, at [email protected].
Free Apps for ArcGIS SubscribersThe following apps are available to quali-fied subscribers at no extra cost: • Esri Maps for Office • Esri Maps for SharePoint • Esri Maps for IBM Cognos • Esri Maps for MicroStrategy • Esri Maps for SAP BusinessObjects • Esri Maps for Dynamics CRM
(Esri Maps for Salesforce will be available later this year.)
To install and configure the apps, you must be an administrator of an ArcGIS Online paid or trial subscription or Portal for ArcGIS. US customers with questions can contact Esri Customer Service or call 1-800-447-9778. Non-US customers can contact their local Esri representative. You will also need administrative access to the business system you’re using (e.g., Office, SharePoint, Cognos, MicroStrategy, BusinessObjects, Dynamics CRM).
For more information on configuration and system requirements, see doc.arcgis.com/en /location-analytics. If you’d like Esri to install and configure the solution for you, contact your local Esri representative. For a list of additional apps available with ArcGIS Online, visit ArcGIS Marketplace.
Partner Spotlight
8 Esri News for Business Spring 2015
In-car navigation started in 1984 with a single BMW. Today, four out of five cars with in-vehicle navigation use HERE map content. Many personal navigation device (PND) companies, like Garmin, use HERE, as do popular web navigation platforms Bing Maps and Yahoo, and, of course, Esri uses HERE map content across its entire ArcGIS platform. What does HERE use to create the world’s leading naviga-tional map technology? It uses Esri’s ArcGIS platform.
The Whole World in a GeodatabaseHERE has built a legacy by capturing and maintaining its core asset—street information used to build navigation products—in which ArcGIS plays a critical role. In fact, HERE has more than 1,200 geographic analysts worldwide using ArcGIS to create accurate, up-to-date mapping data for 196 countries. This is no small feat—the software manages almost three million updates from 80,000 sources each day. With more than two million features and tens of thousands of attributes, HERE needed a solution to streamline the collection, maintenance, and productizing of all its street information. HERE is an Esri Platinum Tier partner, and because of its long relationship with Esri, it made sense for HERE to continue using ArcGIS to build its products. HERE implemented a geodata-base to help manage the vast amount of data that is created and edited. This spatial data storage system can be leveraged in desktop, server, and mobile environments while storing the data in a central location everyone can access.
Scaling to a Global EnterpriseHERE is organized around its map data products (e.g., postal and census boundaries, streets, administration boundaries, and points of interest [POIs]), which are, in turn, divided by regions
One Platform for a World of Street DataHERE Provides Navigation-Quality Street, Traffic, and POI Data Worldwide Using the ArcGIS Platform
(e.g., North America, APAC). As products are closed, they are placed in the geodatabase. Once complete, a continental product that covers the entire globe is created. “Creating this continental product wouldn’t have been pos-sible without using a geodatabase,” said Skip Parker, Esri senior sales manager, HERE. “It has made it easier and more intuitive to manage our data across so many platforms and applications.” HERE collects up to 154 different feature classes for its street data to enhance routing. These maps are the most used in the GIS world for navigation and location intelligence. In fact, Esri uses HERE map content in many of its products, including StreetMap Premium for ArcGIS; Esri Business Analyst; Data Appliance for ArcGIS; ArcGIS for Transportation Analytics; and, of course, ArcGIS Online. Other specialized data products available through ArcGIS Online include HERE Traffic, providing continuous traffic updates through dynamic content feeds; HERE pedestrian content, which is used to generate pedestrian routes as well as pedestrian service areas; and, in the near future, Street Level Imagery (SLI). The most realistic view of street locations and their surroundings will be provided as content for ArcGIS Online in ArcGIS Marketplace beginning Q2 2015.
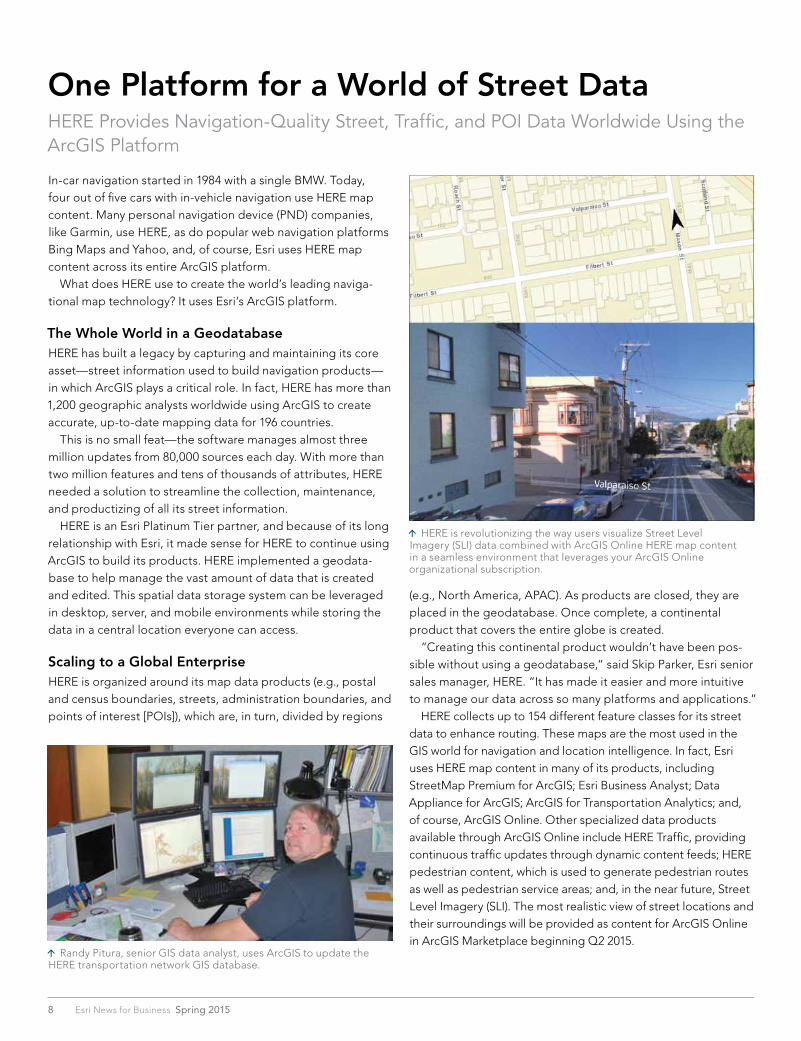
Randy Pitura, senior GIS data analyst, uses ArcGIS to update the HERE transportation network GIS database.
HERE is revolutionizing the way users visualize Street Level Imagery (SLI) data combined with ArcGIS Online HERE map content in a seamless environment that leverages your ArcGIS Online organizational subscription.

9Spring 2015 esri.com/business
An ELA Makes Data Management ManageableHERE manages the massive number of software licenses it uses to create all this data with an Esri enterprise license agreement (ELA). An ELA provides HERE with ready and unlimited access to all the ArcGIS software it needs, as well as timely and expert assistance from Esri support staff. “The ELA helps to ensure that our staff has access to the technology they need to do their work, when they need it,” said Joe Jaszkowiak, director of IT Services, HERE. “We are able to centrally manage the software licenses and deployment all around the world quickly.” About a thousand licenses of the entire ArcGIS platform are used throughout the enterprise, including field collection. HERE worked closely with Esri to create a flexible ELA program to help manage, disseminate, and maintain its own licenses at all its offices. All ELAs include maintenance and technical support for named authorized callers, new software releases, patches and updates, complimentary registration to the Esri User Conference (Esri UC), and free subscriptions to ArcNews and ArcUser. With the ELA, scheduled payments are exchanged for a prescribed set of software, services, and training over the term of the agreement. Unlimited licenses of ArcGIS for Server and ArcGIS for Desktop and the extensions are available when-ever staff around the world need them. While the licensing model for such a large quantity of licenses was attractive, what was imperative for HERE was the ability to disseminate licenses quickly to staff. “Many times, we may find out that an analyst needs a license for a particular project the day before it’s actually needed,” said Jaszkowiak. “By being able to deploy licenses ourselves, we can provide the software almost instantly. This has been a true business changer for us.”
Mapping the Future—Both in 3D and IndoorsAs the world moves into representing information in a more realistic format, HERE is at the cutting edge. HERE has been collecting detailed, 3D mapping information using lidar for years. A fleet of cars gathers point cloud information on fea-tures along the roadway including the width of roads, distances between signs, and the heights of bridges. It will be available as street-level information for the ArcGIS platform, and it will also be used to enhance the automotive industry’s advanced driver assistance system. Information that is collected about the street, including slope, absolute height, and curvature, can be used by vehicle companies to optimize car engines, for example. Navigation and location intelligence don’t stop with the vehicle. HERE researchers are working hard to provide a “con-nected driving experience” for drivers to continue navigation even when they leave their cars. This means that HERE needs to map and understand the insides of public venues that people frequent every day so it can help consumers navigate indoor locations, enabling them to find the best entrance and make their experience easier and more efficient. “We are solving the conundrum of that ‘last meter guid-ance’ that so many of us are faced with once we get to a public venue,” said Parker. “Now, we can provide in-vehicle venue and extended navigation that provides precise directions to a particular store in the mall.” To date, HERE has mapped over one billion square feet of indoor space in 27 countries. This includes 3,784 malls and stores, 134 airports, 822 universities, and 125 stadiums in North America. Approximately 3,000 new venue maps and 15 coun-tries were added by the end of 2014.
For more information, contact Milton Ospina at [email protected].
Data Spotlight
HERE Traffic Center Headquarters—Chicago, Illinois
10 Esri News for Business Spring 2015
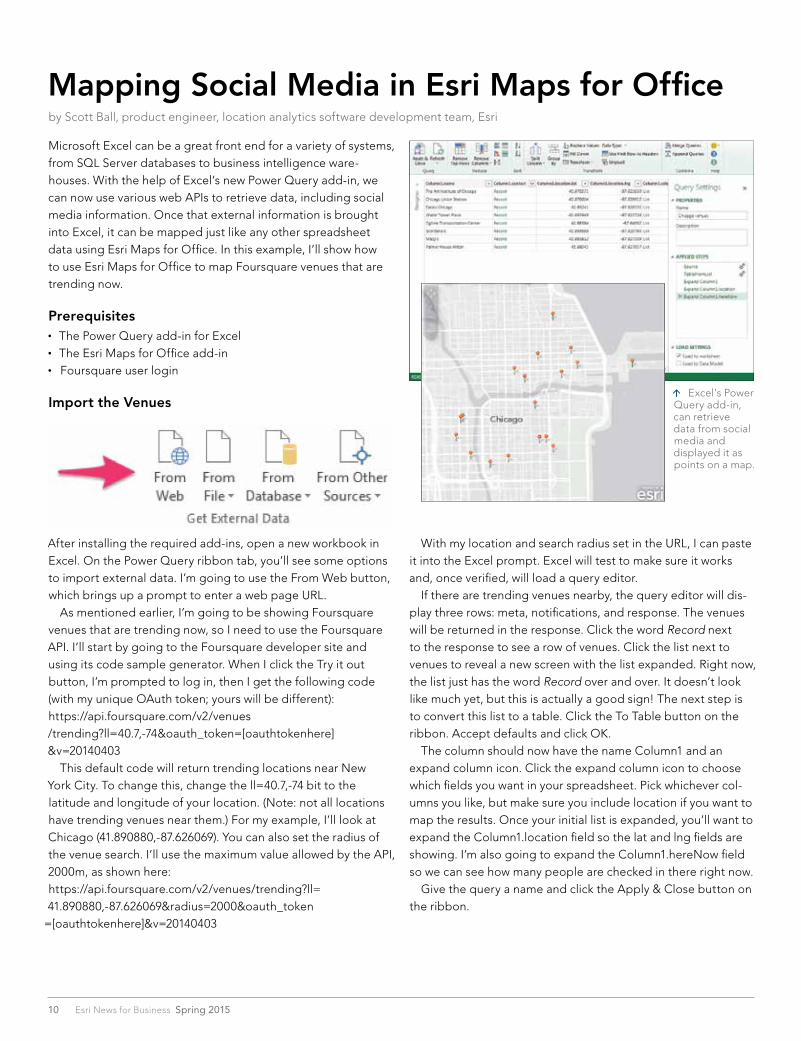
Microsoft Excel can be a great front end for a variety of systems, from SQL Server databases to business intelligence ware-houses. With the help of Excel’s new Power Query add-in, we can now use various web APIs to retrieve data, including social media information. Once that external information is brought into Excel, it can be mapped just like any other spreadsheet data using Esri Maps for Office. In this example, I’ll show how to use Esri Maps for Office to map Foursquare venues that are trending now.
Prerequisites • The Power Query add-in for Excel • The Esri Maps for Office add-in • Foursquare user login
Import the Venues
After installing the required add-ins, open a new workbook in Excel. On the Power Query ribbon tab, you’ll see some options to import external data. I’m going to use the From Web button, which brings up a prompt to enter a web page URL. As mentioned earlier, I’m going to be showing Foursquare venues that are trending now, so I need to use the Foursquare API. I’ll start by going to the Foursquare developer site and using its code sample generator. When I click the Try it out button, I’m prompted to log in, then I get the following code (with my unique OAuth token; yours will be different):https://api.foursquare.com/v2/venues /trending?ll=40.7,-74&oauth_token=[oauthtokenhere]&v=20140403 This default code will return trending locations near New York City. To change this, change the ll=40.7,-74 bit to the latitude and longitude of your location. (Note: not all locations have trending venues near them.) For my example, I’ll look at Chicago (41.890880,-87.626069). You can also set the radius of the venue search. I’ll use the maximum value allowed by the API, 2000m, as shown here:https://api.foursquare.com/v2/venues/trending?ll= 41.890880,-87.626069&radius=2000&oauth_token
=[oauthtokenhere]&v=20140403
Mapping Social Media in Esri Maps for Officeby Scott Ball, product engineer, location analytics software development team, Esri
With my location and search radius set in the URL, I can paste it into the Excel prompt. Excel will test to make sure it works and, once verified, will load a query editor. If there are trending venues nearby, the query editor will dis-play three rows: meta, notifications, and response. The venues will be returned in the response. Click the word Record next to the response to see a row of venues. Click the list next to venues to reveal a new screen with the list expanded. Right now, the list just has the word Record over and over. It doesn’t look like much yet, but this is actually a good sign! The next step is to convert this list to a table. Click the To Table button on the ribbon. Accept defaults and click OK. The column should now have the name Column1 and an expand column icon. Click the expand column icon to choose which fields you want in your spreadsheet. Pick whichever col-umns you like, but make sure you include location if you want to map the results. Once your initial list is expanded, you’ll want to expand the Column1.location field so the lat and lng fields are showing. I’m also going to expand the Column1.hereNow field so we can see how many people are checked in there right now. Give the query a name and click the Apply & Close button on the ribbon.
Excel’s Power Query add-in, can retrieve data from social media and displayed it as points on a map.
11Spring 2015 esri.com/business
recorded the comings and goings of pedestrians for the two loca-tions. The sensors in this case were company-installed, live-video cameras, but Placemeter also runs a program in which people can apply to place a sensor at their place of residence or busi-ness. These sensors can be as simple as an old smartphone that is propped up in a storefront or apartment window. Placemeter checks to see if the location has a street view and if the location is needed for coverage. If the application is reviewed and accepted, the company will pay a stipend each month for the data feed. Placemeter uses ArcGIS to position optic sensors around New York City. The company then uses computer vision algo-rithms to turn these feeds into real-time data about locations, streets, and neighborhoods. The information collected includes historical and real-time pedestrian and vehicle counts, speed, dwell time, and other measurements. “ArcGIS provides us with the spatial analysis power we need to understand where we have gaps and which areas people are requesting the most,” said Novack. “It’s a lot like trying to figure out what places we are missing in the middle of the ocean, but in this case, our ocean is Times Square. We couldn’t get that analysis in any other mapping software we looked at.“
When Less Is MoreIn Dylan’s Candy Bar’s case, staff chose a location that yielded consistent traffic throughout the weekday.
Belly Up to the Candy Bar continued from page 3
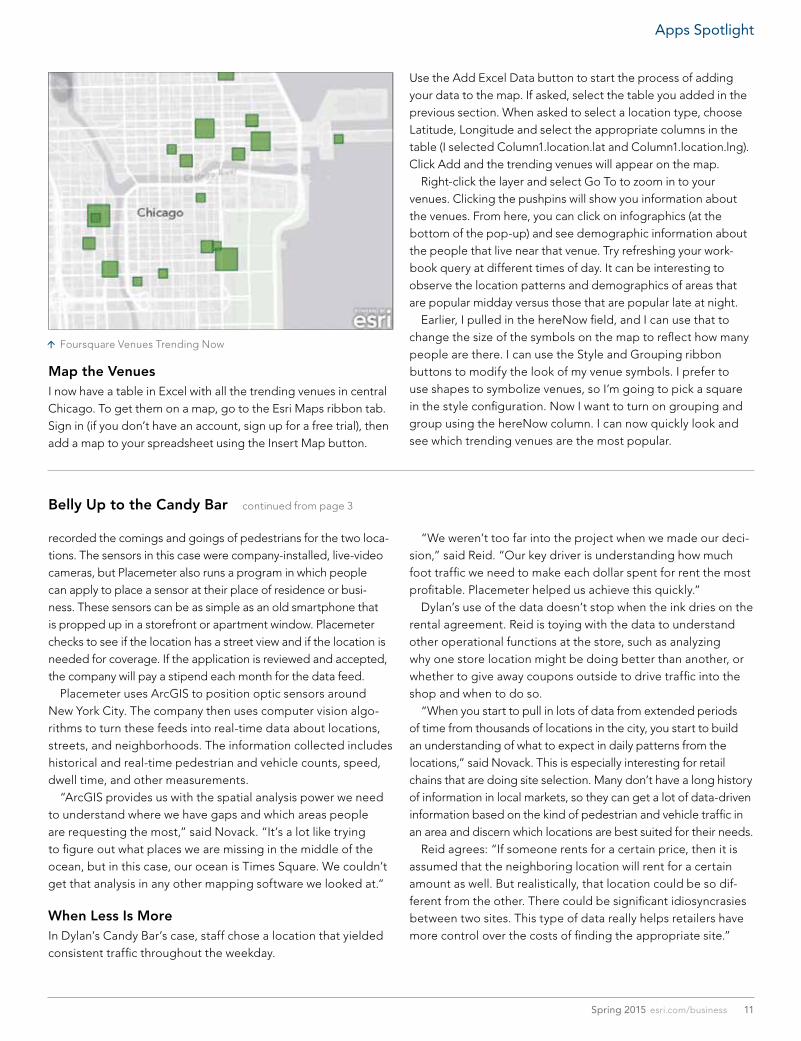
Map the VenuesI now have a table in Excel with all the trending venues in central Chicago. To get them on a map, go to the Esri Maps ribbon tab. Sign in (if you don’t have an account, sign up for a free trial), then add a map to your spreadsheet using the Insert Map button.
Foursquare Venues Trending Now
“We weren’t too far into the project when we made our deci-sion,” said Reid. “Our key driver is understanding how much foot traffic we need to make each dollar spent for rent the most profitable. Placemeter helped us achieve this quickly.” Dylan’s use of the data doesn’t stop when the ink dries on the rental agreement. Reid is toying with the data to understand other operational functions at the store, such as analyzing why one store location might be doing better than another, or whether to give away coupons outside to drive traffic into the shop and when to do so. “When you start to pull in lots of data from extended periods of time from thousands of locations in the city, you start to build an understanding of what to expect in daily patterns from the locations,” said Novack. This is especially interesting for retail chains that are doing site selection. Many don’t have a long history of information in local markets, so they can get a lot of data-driven information based on the kind of pedestrian and vehicle traffic in an area and discern which locations are best suited for their needs. Reid agrees: “If someone rents for a certain price, then it is assumed that the neighboring location will rent for a certain amount as well. But realistically, that location could be so dif-ferent from the other. There could be significant idiosyncrasies between two sites. This type of data really helps retailers have more control over the costs of finding the appropriate site.”
Apps Spotlight
Use the Add Excel Data button to start the process of adding your data to the map. If asked, select the table you added in the previous section. When asked to select a location type, choose Latitude, Longitude and select the appropriate columns in the table (I selected Column1.location.lat and Column1.location.lng). Click Add and the trending venues will appear on the map. Right-click the layer and select Go To to zoom in to your venues. Clicking the pushpins will show you information about the venues. From here, you can click on infographics (at the bottom of the pop-up) and see demographic information about the people that live near that venue. Try refreshing your work-book query at different times of day. It can be interesting to observe the location patterns and demographics of areas that are popular midday versus those that are popular late at night. Earlier, I pulled in the hereNow field, and I can use that to change the size of the symbols on the map to reflect how many people are there. I can use the Style and Grouping ribbon buttons to modify the look of my venue symbols. I prefer to use shapes to symbolize venues, so I’m going to pick a square in the style configuration. Now I want to turn on grouping and group using the hereNow column. I can now quickly look and see which trending venues are the most popular.
Presorted Standard
US Postage Paid Esri
380 New York Street Redlands, California 92373-8100 usa
144678 3/15sp
Copyright © 2014 Esri. All rights reserved.
“I have 10 pages of notes, at this point, of either things we need to do or people we need to talk to. And I’ll be taking that back and sharing with my colleagues, and we’ll come up with a plan.”
—Jonathan Voorhees, Senior Vice President, Retail Distribution Execution
ESRI BUSINESS SUMMITApply Geography. Change Your Business.
San Diego, California
esri.com/bizsummit2015
Like Voorhees, 79 percent of all Esri Business Summit attendees learned something new, and 89 percent gained an understanding of what others in their industry are doing.
Isn’t it your turn? Save the date: July 18–19, 2015.
G66337_Business_Sum_ad_11-14.indd 1 11/4/14 9:55 AM