Embed Size (px)
Citation preview
1
Belgian Veterinary Surveillance of Antibacterial Consumption
National consumption report
2019
Publication : 22 June 2020
2
SUMMARY
This annual BelVet-SAC report is now published for the 11th time and describes the antimicrobial use (AMU) in animals in
Belgium in 2019 and the evolution since 2011. For the second year this report combines sales data (collected at the level of
the wholesalers-distributors and the compound feed producers) and usage data (collected at farm level). This allows to dig
deeper into AMU at species and farm level in Belgium.
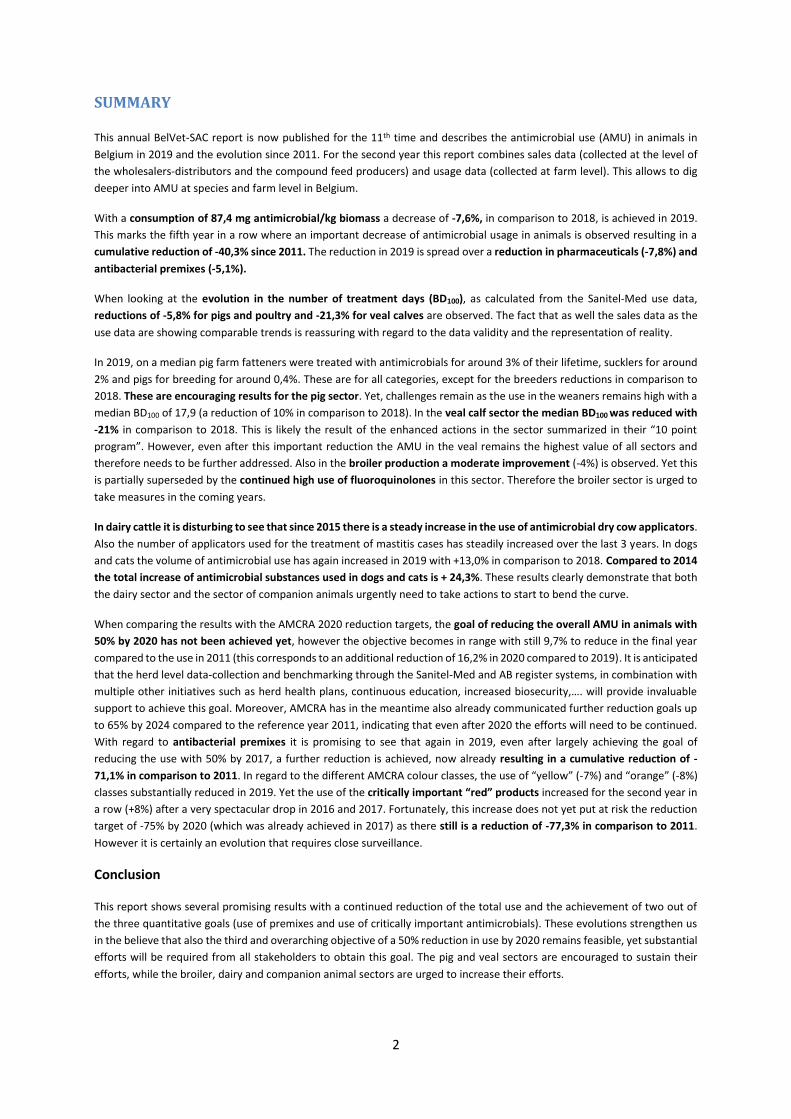
With a consumption of 87,4 mg antimicrobial/kg biomass a decrease of -7,6%, in comparison to 2018, is achieved in 2019.
This marks the fifth year in a row where an important decrease of antimicrobial usage in animals is observed resulting in a
cumulative reduction of -40,3% since 2011. The reduction in 2019 is spread over a reduction in pharmaceuticals (-7,8%) and
antibacterial premixes (-5,1%).
When looking at the evolution in the number of treatment days (BD100), as calculated from the Sanitel-Med use data,
reductions of -5,8% for pigs and poultry and -21,3% for veal calves are observed. The fact that as well the sales data as the
use data are showing comparable trends is reassuring with regard to the data validity and the representation of reality.
In 2019, on a median pig farm fatteners were treated with antimicrobials for around 3% of their lifetime, sucklers for around
2% and pigs for breeding for around 0,4%. These are for all categories, except for the breeders reductions in comparison to
2018. These are encouraging results for the pig sector. Yet, challenges remain as the use in the weaners remains high with a
median BD100 of 17,9 (a reduction of 10% in comparison to 2018). In the veal calf sector the median BD100 was reduced with
-21% in comparison to 2018. This is likely the result of the enhanced actions in the sector summarized in their “10 point
program”. However, even after this important reduction the AMU in the veal remains the highest value of all sectors and
therefore needs to be further addressed. Also in the broiler production a moderate improvement (-4%) is observed. Yet this
is partially superseded by the continued high use of fluoroquinolones in this sector. Therefore the broiler sector is urged to
take measures in the coming years.
In dairy cattle it is disturbing to see that since 2015 there is a steady increase in the use of antimicrobial dry cow applicators.
Also the number of applicators used for the treatment of mastitis cases has steadily increased over the last 3 years. In dogs
and cats the volume of antimicrobial use has again increased in 2019 with +13,0% in comparison to 2018. Compared to 2014
the total increase of antimicrobial substances used in dogs and cats is + 24,3%. These results clearly demonstrate that both
the dairy sector and the sector of companion animals urgently need to take actions to start to bend the curve.
When comparing the results with the AMCRA 2020 reduction targets, the goal of reducing the overall AMU in animals with
50% by 2020 has not been achieved yet, however the objective becomes in range with still 9,7% to reduce in the final year
compared to the use in 2011 (this corresponds to an additional reduction of 16,2% in 2020 compared to 2019). It is anticipated
that the herd level data-collection and benchmarking through the Sanitel-Med and AB register systems, in combination with
multiple other initiatives such as herd health plans, continuous education, increased biosecurity,…. will provide invaluable
support to achieve this goal. Moreover, AMCRA has in the meantime also already communicated further reduction goals up
to 65% by 2024 compared to the reference year 2011, indicating that even after 2020 the efforts will need to be continued.
With regard to antibacterial premixes it is promising to see that again in 2019, even after largely achieving the goal of
reducing the use with 50% by 2017, a further reduction is achieved, now already resulting in a cumulative reduction of -
71,1% in comparison to 2011. In regard to the different AMCRA colour classes, the use of “yellow” (-7%) and “orange” (-8%)
classes substantially reduced in 2019. Yet the use of the critically important “red” products increased for the second year in
a row (+8%) after a very spectacular drop in 2016 and 2017. Fortunately, this increase does not yet put at risk the reduction
target of -75% by 2020 (which was already achieved in 2017) as there still is a reduction of -77,3% in comparison to 2011.
However it is certainly an evolution that requires close surveillance.
Conclusion
This report shows several promising results with a continued reduction of the total use and the achievement of two out of
the three quantitative goals (use of premixes and use of critically important antimicrobials). These evolutions strengthen us
in the believe that also the third and overarching objective of a 50% reduction in use by 2020 remains feasible, yet substantial
efforts will be required from all stakeholders to obtain this goal. The pig and veal sectors are encouraged to sustain their
efforts, while the broiler, dairy and companion animal sectors are urged to increase their efforts.
3
SAMENVATTING
Dit 11de BelVet-SAC rapport beschrijft de resultaten van het antibioticumgebruik bij dieren in België in 2019 en de evolutie
sinds 2011. Voor het tweede jaar op rij combineert het rapport zowel verkoopdata (verzameld ter hoogte van de
groothandelaars – verdelers en mengvoederfabrikanten) als gebruiksdata (verzameld op het niveau van de veehouderij).
Deze combinatie laat toe om het gebruik meer in detail te bestuderen per diercategorie.
Met een consumptie van 87,4 mg antibiotica/kg biomassa werd in 2019 een reductie van -7,6% gerealiseerd in vergelijking
met 2018. Hiermee wordt voor het vijfde jaar op rij een belangrijke reductie gerealiseerd wat resulteert in een cumulatieve
reductie van -40,3% sinds 2011. De reductie is verdeeld over een reductie in de ‘pharmaceuticals’ (-7,8%) en in de
antibacteriële premixen (-5,1%).
Bekijken we de evolutie in het aantal behandeldagen (BD100), berekend uit de Sanitel-Med gebruiksdata, dan zien we
reducties van -5,8% voor varkens en pluimvee en -21,3% voor vleeskalveren. Het feit dat zowel de verkoopdata als de
gebruiksdata een vergelijkbare evolutie weergeven geeft vertrouwen in de validiteit van de data en de weergave van de reële
evoluties.
In een mediaan varkensbedrijf in België werden in 2019 de vleesvarkens ongeveer 3% van hun levensdagen behandeld met
antibiotica, voor de zuigende biggen was dat 2% en voor de zeugen en beren 0,4%. Dit zijn, in vergelijking met 2019, reducties
in alle categorieën behalve bij de zeugen en beren. Dit zijn bemoedigende resultaten voor de varkenssector. Echter blijven
er nog uitdagingen aangezien het gebruik bij de gespeende biggen, met een BD100 van 17,9 (een reductie van -10% t.o.v.
2018), nog steeds erg hoog blijft. In de sector van de vleeskalveren is de mediane BD100 gedaald met -21% in vergelijking met
2018. Dit is waarschijnlijk een gevolg van de acties ondernomen in deze sector die werden samengevat in hun “10 punten
plan” met als doel het antibioticumgebruik te verminderen. Zelfs na deze belangrijke reductie blijft het gebruik in de
vleeskalveren echter het hoogste van alle sectoren en dringt verdere actie zich dus op. In de braadkippen sector wordt een
bescheiden reductie van -4% opgemeten. Dit goed resultaat wordt evenwel deels teniet gedaan door het aanhoudende
hoge gebruik van fluoroquinolones. Daarom wordt de braadkippensector opgeroepen om dringend bijkomende maatregelen
te nemen.
In de melkveehouderij is het verontrustend om vast te stellen dat dat er sinds 2015 een continue stijging van het gebruik
van droogzetpreparaten wordt waargenomen. Ook het gebruik van intramammaire producten voor de behandeling van
uierontsteking neemt de laatste 3 jaar toe. Bij honden en katten is het volume van gebruikte antibiotica in 2019 met 13%
toegenomen. In vergelijking met 2014 is de stijging zelfs +24,3%. Deze resultaten tonen duidelijk aan dat zowel de melkvee
sector als de sector van de gezelschapsdieren dringend actie moeten ondernemen om de curve van het gebruik af te buigen.
Als we deze resultaten uitzetten tegenover de AMCRA 2020 reductiedoelstellingen dan zien we dat het doel van 50% reductie
van het totaal gebruik tegen 2020 nog niet gerealiseerd is. Echter het objectief komt steeds dichter bij en met een verdere
reductie van 9,7% in het laatste jaar ten opzichte van het gebruik in 2011 is het objectief binnen bereik (Dit stemt overeen
met een bijkomende reductie van 16,2% in 2020 ten opzichte van 2019). Er wordt vanuit gegaan dat de datacollectie van het
AB gebruik op bedrijfsniveau in combinatie met een veelvoud aan andere initiatieven, zoals het bedrijfsgezondheidsplan,
blijvende opleiding, toenemende bioveiligheid, … zal bijdragen om het doel te bereiken. Daarenboven heeft AMCRA recent
ook een reductie van -65% ten opzichte van het referentiejaar 2011 als doelstelling voor 2024 vooropgesteld, waardoor er
een blijvende inspanning zal nodig zijn ook na 2020. Voor wat betreft de antimicrobiële premixen is het hoopgevend om te
zien dat, zelf na het ruimschoots behalen van de reductiedoelstelling van -50% in 2017, er nog steeds verdere reducties
worden gerealiseerd wat resulteert in een cumulatieve reductie van -71,1% in vergelijking met 2011. Wat betreft het gebruik
van de verschillende soorten antibiotica hebben we in 2019 een duidelijke reductie gezien van het gebruik van “gele” (-7%)
en “oranje” (-8%) antibiotica terwijl het gebruik van de kritisch belangrijke “rode” antibiotica voor het tweede jaar op rij
terug is gestegen (+8%) na de spectaculaire daling in 2016 en 2017. Gelukkig heeft deze stijging nog niet tot gevolg dat de
reductie doelstelling van -75% t.o.v. 2011 (die in 2017 werd gerealiseerd) niet wordt gehaald aangezien er nog steeds een
totale reductie van -77,3% wordt opgetekend. Desalniettemin is dit een zorgwekkende evolutie die van nabij dient opgevolgd
te worden.
Conclusie
Dit rapport toont verschillende hoopgevende resultaten met een aanhoudende daling van het totaal antibioticumgebruik en
het behouden van twee van de drie kwantitatieve doelstellingen (gebruik van antimicrobiële premixen en kritisch belangrijke
4
antibiotica). Deze evoluties sterken ons in het geloof dat ook de derde, overkoepelende, doelstelling van -50% reductie tegen
2020 haalbaar blijft. Echter hiervoor zullen belangrijke inspanningen noodzakelijk zijn van alle betrokkenen. De varkens- en
de vleeskalversector worden aangemoedigd om verder te gaan op het ingeslagen pad terwijl de braadkippen, melkvee en
gezelschapsdierensectoren wordt opgeroepen om bijkomende inspanningen te leveren om de nodige reducties te realiseren.
5
RESUME
Ce 11e rapport BelVet-SAC décrit les résultats de la consommation d’antibiotiques chez les animaux en Belgique en 2019 et
son évolution depuis 2011. Pour la deuxième fois, le rapport combine les données des ventes (collectées au niveau des
grossistes - distributeurs et fabricants d’aliments composés pour animaux) et les données de consommation (collectées au
niveau de l’élevage). Cette combinaison permet d’étudier plus en détail la consommation par catégorie d’animal et au niveau
des élevages.
Avec une consommation moyenne de 87,4 mg d’antibiotiques/kg de biomasse, une réduction de 7,6 % a été réalisée en
2019 par rapport à 2018. Cela représente une diminution significative pour la cinquième année consécutive, aboutissant à
une réduction cumulée de 40,3 % depuis 2011. La diminution se répartit en une réduction de 7,8 % pour les produits
pharmaceutiques et de 5,1 % pour les prémélanges antibactériens.
Si l'on observe l'évolution du nombre de jours de traitement (BD 100) calculée sur la base des données de consommation
collectées via SANITEL-MED, nous constatons des réductions de 5,8 % pour les porcs et la volaille et de 21,3 % pour les veaux
de boucherie. Le fait que les données relatives à la vente et celles qui concernent la consommation suivent une évolution
comparable permet de confirmer la validité des données et la représentation des évolutions réelles.
Dans une exploitation porcine médiane en Belgique, en 2019, les porcs de boucherie ont été traités avec des antibiotiques
pendant environ 3 % de leur durée de vie, 2 % pour les porcelets allaitants et 0,4 % pour les truies et verrats. Par rapport à
2019, il s’agit de réductions dans toutes les catégories, excepté celles des truies et des verrats. Ces résultats sont
encourageants pour le secteur porcin. Cependant, des défis subsistent en ce qui concerne l’utilisation chez les porcelets
sevrés, avec un BD 100 de 17,9 (une réduction de 10 % par rapport à 2018) qui reste encore très élevé. Dans le secteur des
veaux de boucherie, le BD 100 médian a diminué de 21 % par rapport à 2018. Ce chiffre est probablement le résultat des
actions entreprises dans ce secteur, qui ont été résumées dans le « plan en 10 points » dans le but de réduire l’utilisation
d’antibiotiques. Cependant, même après cette réduction importante, l’utilisation chez les veaux de boucherie reste la plus
élevée de tous les secteurs et une action supplémentaire est donc impérative. Dans le secteur des poulets de chair, une
modeste réduction de 4 % est enregistrée. Cependant, ce bon résultat est partiellement compensé par la forte utilisation
continue des fluoroquinolones. Par conséquent, le secteur du poulet de chair est appelé à prendre d’urgence des mesures
supplémentaires pour les années à venir.
En élevage laitier, il est inquiétant de constater, depuis 2015, une augmentation continue de l’utilisation des antibiotiques
intramammaires pour vache en tarissement . L’utilisation de produits intramammaires pour le traitement de la mammite a
également augmenté au cours des 3 dernières années. Chez les chiens et les chats, le volume d’antibiotiques utilisés a
augmenté de 13 % en 2019. Par rapport à 2014, la progression est même de 24,3 %. Ces résultats démontrent clairement
que tant le secteur laitier que celui des animaux de compagnie ont besoin d’une action urgente pour aplanir la courbe
d’utilisation au sein de leur secteur.
Si nous comparons ces résultats avec les objectifs de réduction AMCRA 2020, nous constatons que l'objectif d’une réduction
de 50 % de l’utilisation totale d’ici 2020 n’a pas encore été atteint. Cependant, l’objectif se rapproche et avec une nouvelle
réduction de 9,7 % l’année dernière par rapport à la consommation de 2011, il est à portée de main (cela correspond à une
réduction supplémentaire de 16,2 % en 2020 par rapport à 2019). On suppose que la collecte de données sur l’utilisation d’AB
au niveau de l’entreprise, combinée à une multitude d’autres initiatives, contribuera à atteindre l’objectif. En outre, l’AMCRA
a également récemment fixé les objectifs de réduction pour 2024 à -65 % par rapport à l’année de référence 2011, de sorte
qu’un effort soutenu sera également nécessaire après 2020. En ce qui concerne les prémélanges antimicrobiens, il est
encourageant de voir que, même après avoir dépassé les objectifs de réduction de 50 % en 2017, de nouvelles réductions
sont encore en cours, ce qui se traduit par une réduction cumulée de 71,1 % par rapport à 2011. En ce qui concerne
l’utilisation des différents types d’antibiotiques, nous avons observé une nette réduction de l’utilisation d’antibiotiques
« jaunes » et « orange » en 2019, tandis que l’utilisation des antibiotiques « rouges » d’une importance cruciale a augmenté
pour la deuxième année consécutive (+ 8 %) après la baisse spectaculaire de 2016 et 2017. Heureusement, cette
augmentation n’a pas encore entraîné l’impossibilité d'atteindre l’objectif de réduction de 75 % par rapport à l’année 2011
(qui avait été réalisé en 2017) étant donné qu'il y a toujours une réduction totale de 77,3 %. Il s’agit néanmoins d’une
évolution préoccupante qui doit être suivie de près.
6
Conclusion
Ce rapport montre des résultats prometteurs avec une baisse persistante de l’utilisation totale d'antibiotiques et la
confirmation que deux des trois objectifs quantitatifs (utilisation de prémélanges antimicrobiens et d’antibiotiques
d’importance critique) sont atteints. Ces évolutions renforcent notre conviction que le troisième objectif primordial restera
également réalisable. Cependant, cela nécessitera des efforts importants de la part de toutes les parties concernées. Le
secteur des porcs et des veaux de boucherie est encouragé à poursuivre sur la voie empruntée, tandis que les secteurs des
poulets de chair, des vaches laitières et des animaux de compagnie sont appelés à faire des efforts supplémentaires pour
réaliser les réductions nécessaires.
7
PREFACE
Antibacterial products are valuable tools in the preservation of animal health and animal welfare, and must be used
responsibly as they may save lives and prevent animal suffering. However, the use of antibacterial products invariably leads
to selection of bacteria that are resistant against the substance used. Resistance can then spread in populations and the
environment.
Antibacterial consumption in animals selects for antibacterial resistant bacteria in animals, leading to therapy failure in
bacterial infections. Yet it might also jeopardize human health through transfer of resistant bacteria or their resistance genes
from animals to humans and vice versa via direct or indirect contact.
Today, antibacterial consumption and its link to antibacterial resistance in humans and animals is a worldwide point of
concern. The World Health Organization has indicated the follow up of antibacterial resistance as one of the top priorities for
the coming years. In 2013, the world economic forum has indicated the emergence of antibacterial resistance a global threat
with the ability of destabilizing health systems, profound cost implications for economic systems and for the stability of social
systems. In 2015 the World Health Assembly unanimously adopted the Global Action Plan1 (GAP) on Antimicrobial Resistance
developed by the World Health Organization (WHO) with the contribution of the Food and Agricultural Organization (FAO)
and the World Organization for Animal Health (OIE), calling all Member States of the World Health Organization to put in
place national action plans against AMR by mid-2017.
Given the importance in securing public as well as animal health and since it is by far the leading driver for antibacterial
resistance, it is crucial to measure the level of antibacterial consumption and antibacterial resistance in animals. This is
moreover also required at the European level where consumption data of antibacterial products in veterinary medicine are
collected by EMA (European Medicines Agency) in the framework of the ESVAC (European Surveillance of Veterinary
Antibacterial Consumption) project. Therefore the data collected and presented in this report also fit into the European
commitments of Belgium. This tenth BelVet-SAC report gives an overview of the consumption of antibacterial products in
veterinary medicine in Belgium in 2018 and describes evolutions in use since 2011.
1 http://apps.who.int/gb/ebwha/pdf_files/WHA68/A68_ACONF1Rev1-en.pdf?ua=1
8
CONTENTS
SUMMARY .................................................................................................................................................. 2
SAMENVATTING ........................................................................................................................................... 3
RÉSUMÉ ..................................................................................................................................................... 5
PREFACE ..................................................................................................................................................... 7
CONTENTS .................................................................................................................................................. 8
THE AUTHORS ........................................................................................................................................... 11
MATERIALS AND METHODS ......................................................................................................................... 12
Antimicrobial Sales Data.................................................................................................................... 12
Data collection .............................................................................................................................................. 12
a) Antibacterials for veterinary use ...................................................................................................................... 12
i. Antibacterial pharmaceuticals ..................................................................................................................... 12
ii. Antibacterial premixes ................................................................................................................................ 12
iii. Antibacterial classes included ..................................................................................................................... 13
b) Animal population ............................................................................................................................................ 14
Data analysis ................................................................................................................................................ 14
Data validation ............................................................................................................................................. 15
a) External data validation ................................................................................................................................... 15
b) Internal data validation .................................................................................................................................... 15
Antimicrobial Use Data ...................................................................................................................... 16
Data collection in Sanitel-Med ..................................................................................................................... 16
a) Notification of antimicrobial use at farm-level ................................................................................................ 16
b) Number of animals present at farm level ........................................................................................................ 18
i. Veal calf farms ............................................................................................................................................. 18
ii. Poultry farms ............................................................................................................................................... 18
iii. Pig farms ...................................................................................................................................................... 18
c) Number of active farms.................................................................................................................................... 18
Data analysis ................................................................................................................................................ 19
a) Determination of the numerator ..................................................................................................................... 19
i. Mg active substance used ........................................................................................................................... 19
ii. Number of DDDAbel used ............................................................................................................................. 19
b) Determination of the denominator .................................................................................................................. 20
i. Kg at risk per species ................................................................................................................................... 20
ii. Kg at risk per animal category at farm level ................................................................................................ 20
c) Indicators ......................................................................................................................................................... 20
i. Mg used ....................................................................................................................................................... 20
ii. BD100 ............................................................................................................................................................ 20
9
iii. BD100-species ............................................................................................................................................... 21
Quality control for defining the yearly and core reference populations for benchmarking ......................... 21
a) Active during the whole year ........................................................................................................................... 21
b) Notification errors ............................................................................................................................................ 21
c) Empty stables ................................................................................................................................................... 22
d) Minimum herd size requirements .................................................................................................................... 22
e) Zero-use and use farms .................................................................................................................................... 22
RESULTS ................................................................................................................................................... 23
Antimicrobial Sales Data.................................................................................................................... 23
Response rate and data validation ............................................................................................................... 23
Number of antibacterial pharmaceuticals and premixes available on the Belgian market ......................... 23
Animal biomass produced in Belgium .......................................................................................................... 24
Total consumption of antibacterial drugs for veterinary use in Belgium ..................................................... 25
Antibacterial use versus biomass ................................................................................................................. 28
Positioning of Belgium in comparison to the EU member states. ................................................................ 30
Species specific antibacterial use.................................................................................................................. 31
Intramammary products in dairy cattle ....................................................................................................... 33
a) Total use of intramammary products ............................................................................................................... 33
b) Number of DC and LC injector per dairy cow. .................................................................................................. 34
Antibacterial pharmaceuticals in dogs and cats........................................................................................... 35
Antibacterial use per class of antibacterial compound ................................................................................ 36
a) Total consumption (antibacterial pharmaceuticals and premixes) .................................................................. 36
b) Antibacterial pharmaceuticals ......................................................................................................................... 40
c) Antibacterial premixes ..................................................................................................................................... 40
Antibacterial use per active substance ......................................................................................................... 41
Antimicrobial Use Data ...................................................................................................................... 45
Notifications in Sanitel-Med ......................................................................................................................... 45
Sanitel-Med coverage of sales data ............................................................................................................. 45
a) General ............................................................................................................................................................. 45
b) Per species/animal category ............................................................................................................................ 46
c) Per antimicrobial class ..................................................................................................................................... 47
Use of critical substances in the Sanitel-Med animal species ....................................................................... 47
Species-level antimicrobial use ..................................................................................................................... 49
a) BD100-species .................................................................................................................................................... 49
Farm-level antimicrobial use ........................................................................................................................ 49
a) 2019 reference populations for benchmarking ................................................................................................ 49
b) Farm-level antimicrobial use in 2019 ............................................................................................................... 50
10
c) 2018-2019 core reference populations for benchmarking .............................................................................. 51
d) Evolution of farm-level antimicrobial use from 2018 to 2019 ......................................................................... 51
i. Summary ..................................................................................................................................................... 51
i. Suckling piglets ............................................................................................................................................ 52
ii. Weaned piglets ............................................................................................................................................ 52
iii. Fattening pigs .............................................................................................................................................. 53
iv. Breeding pigs ............................................................................................................................................... 53
v. Broilers ........................................................................................................................................................ 54
vi. Laying hens .................................................................................................................................................. 54
vii. Veal calves ................................................................................................................................................... 55
e) Farm-level use of the various antimicrobial classes ......................................................................................... 55
DISCUSSION .............................................................................................................................................. 57
CONCLUSION ............................................................................................................................................. 59
ACKNOWLEDGEMENTS ................................................................................................................................ 60
APPENDIX ................................................................................................................................................. 61
Appendix A. ATC-vet codes included in the different classes of antibacterial products .................. 61
11
THE AUTHORS
The 2018 data collection and analysis was performed by the Veterinary Epidemiology Unit of the faculty of Veterinary
Medicine from the Ghent University (sales data) and the Data Analysis Unit of the centre of expertise on Antimicrobial
Consumption and Resistance in Animals (AMCRA) (consumption data) under the authority of the Federal Agency for
Medicines and Health products.
The data collection and analysis of the sales data has been performed by:
Drs. Reshat Jashari,
Prof. dr. Jeroen Dewulf,
Veterinary Epidemiology Unit
Faculty of Veterinary Medicine
Ghent University
Belgium
The data analysis of the use data has been performed by:
Dr. Wannes Vanderhaeghen,
Dr. Jorien De Loor,
Dr. Ghislain Barré
AMCRA vzw
Belgium
The report has been written by:
Prof. dr. Jeroen Dewulf,
Veterinary Epidemiology Unit
Faculty of Veterinary Medicine
Ghent University
Belgium
Dr. Wannes Vanderhaeghen
Dr. Bénédicte Callens
Dr. Fabiana Dal Pozzo
AMCRA vzw
Belgium
Dr. Bart Hoet,
Apr. Dries Minne,
DG PRE
Federal Agency for Medicines and Health products
Belgium
Funded by: Federal Agency for Medicines and Health products
Suggested citation: Belgian veterinary surveillance on antimicrobial consumption report 2019 (BELVETSAC 2019). Brussels:
Federal Agency For Medicines and Health Products.
Contact: [email protected]
12
MATERIALS AND METHODS
ANTIMICROBIAL SALES DATA
Data collection
a) Antibacterials for veterinary use
i. Antibacterial pharmaceuticals
Sales data of all products in all pharmaceutical formulations registered on the Belgian market that contain antibacterials were
aggregated. These data were asked from the 22 wholesaler-distributors that are registered and active for supplying
veterinarians and pharmacies in Belgium with veterinary medicines during the observation period. The distributors are
obliged by law (article 12sexies, Law on medicines 25th March 1964; Articles 221 and 228 Royal Decree 14th December 2006
on medicines for human and veterinary use) to keep record of all sales and to deliver these records to the competent authority
of the Belgian authority (Federal Agency for Medicines and Health Products, FAMHP) on demand. They were asked by letter
dd. January 2020 to upload the required data via a secured web-application (www.belvetsac.ugent.be). The required data
consisted of all veterinary antibacterials sold in the year 2019 to a veterinarian or pharmacist in Belgium. In Belgium,
antibacterial products are only available on prescription or by delivery from the veterinarian. Belgian veterinarians can both
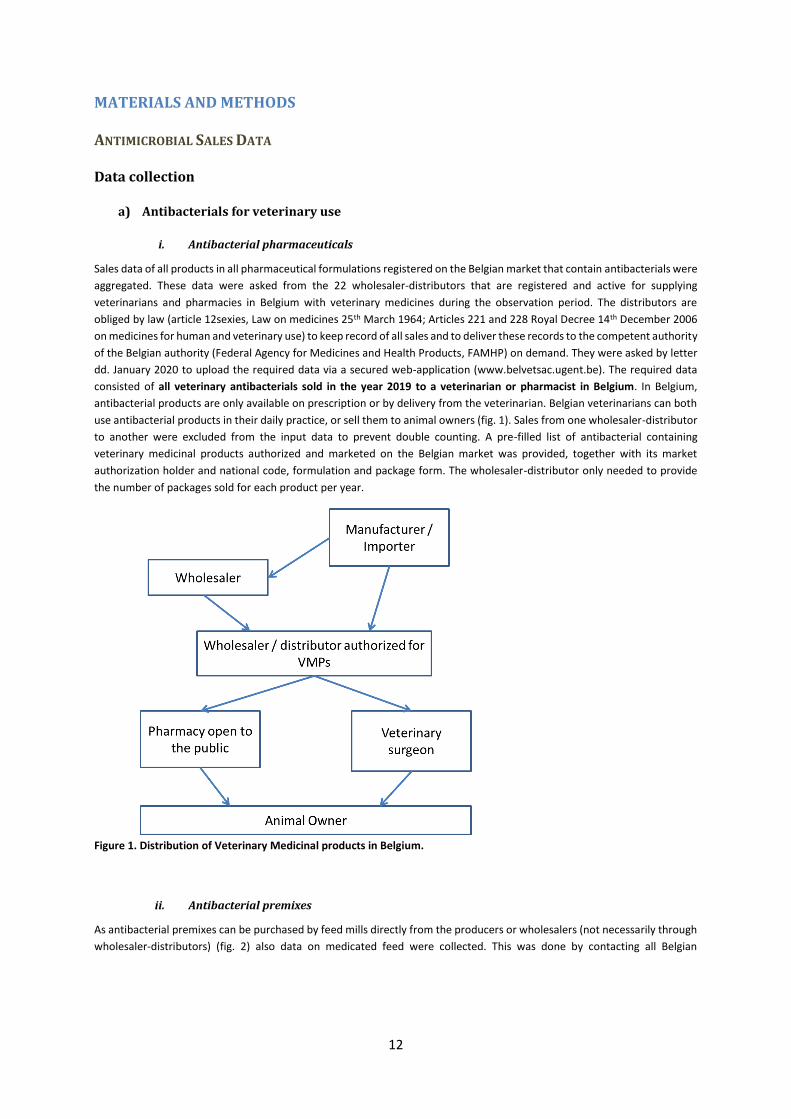
use antibacterial products in their daily practice, or sell them to animal owners (fig. 1). Sales from one wholesaler-distributor
to another were excluded from the input data to prevent double counting. A pre-filled list of antibacterial containing
veterinary medicinal products authorized and marketed on the Belgian market was provided, together with its market
authorization holder and national code, formulation and package form. The wholesaler-distributor only needed to provide
the number of packages sold for each product per year.
Figure 1. Distribution of Veterinary Medicinal products in Belgium.
ii. Antibacterial premixes
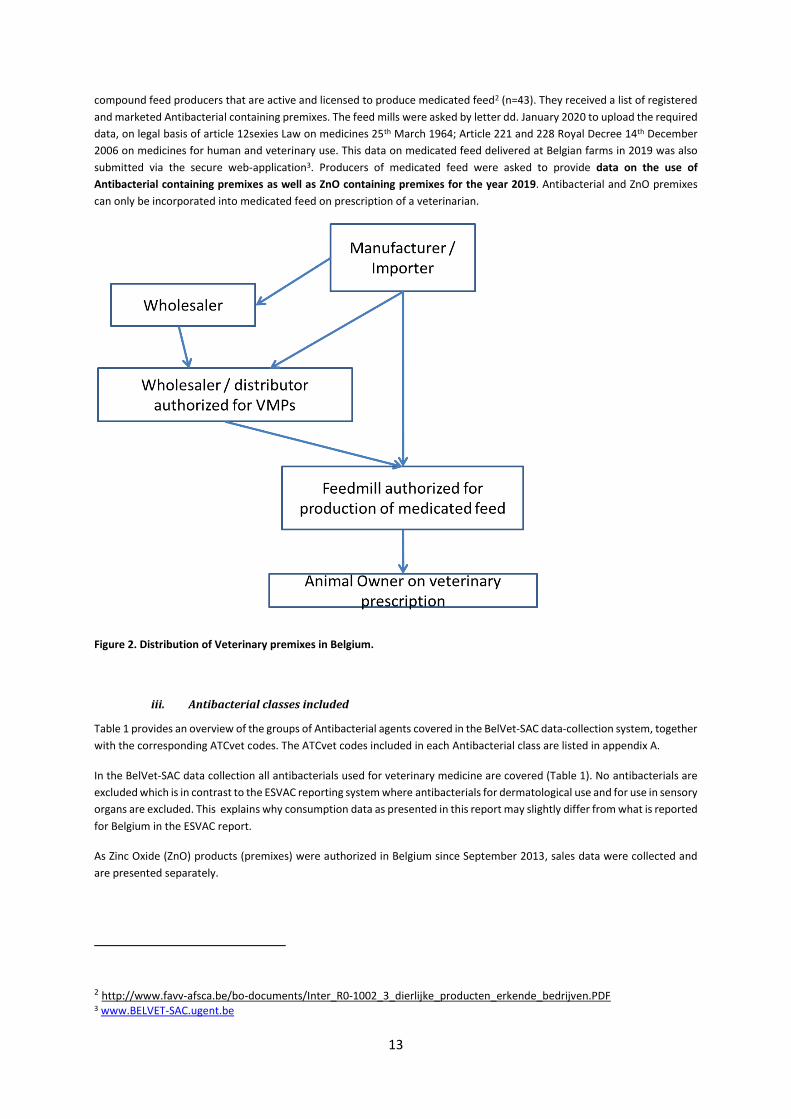
As antibacterial premixes can be purchased by feed mills directly from the producers or wholesalers (not necessarily through
wholesaler-distributors) (fig. 2) also data on medicated feed were collected. This was done by contacting all Belgian
13
compound feed producers that are active and licensed to produce medicated feed2 (n=43). They received a list of registered
and marketed Antibacterial containing premixes. The feed mills were asked by letter dd. January 2020 to upload the required
data, on legal basis of article 12sexies Law on medicines 25th March 1964; Article 221 and 228 Royal Decree 14th December
2006 on medicines for human and veterinary use. This data on medicated feed delivered at Belgian farms in 2019 was also
submitted via the secure web-application3. Producers of medicated feed were asked to provide data on the use of
Antibacterial containing premixes as well as ZnO containing premixes for the year 2019. Antibacterial and ZnO premixes
can only be incorporated into medicated feed on prescription of a veterinarian.
Figure 2. Distribution of Veterinary premixes in Belgium.
iii. Antibacterial classes included
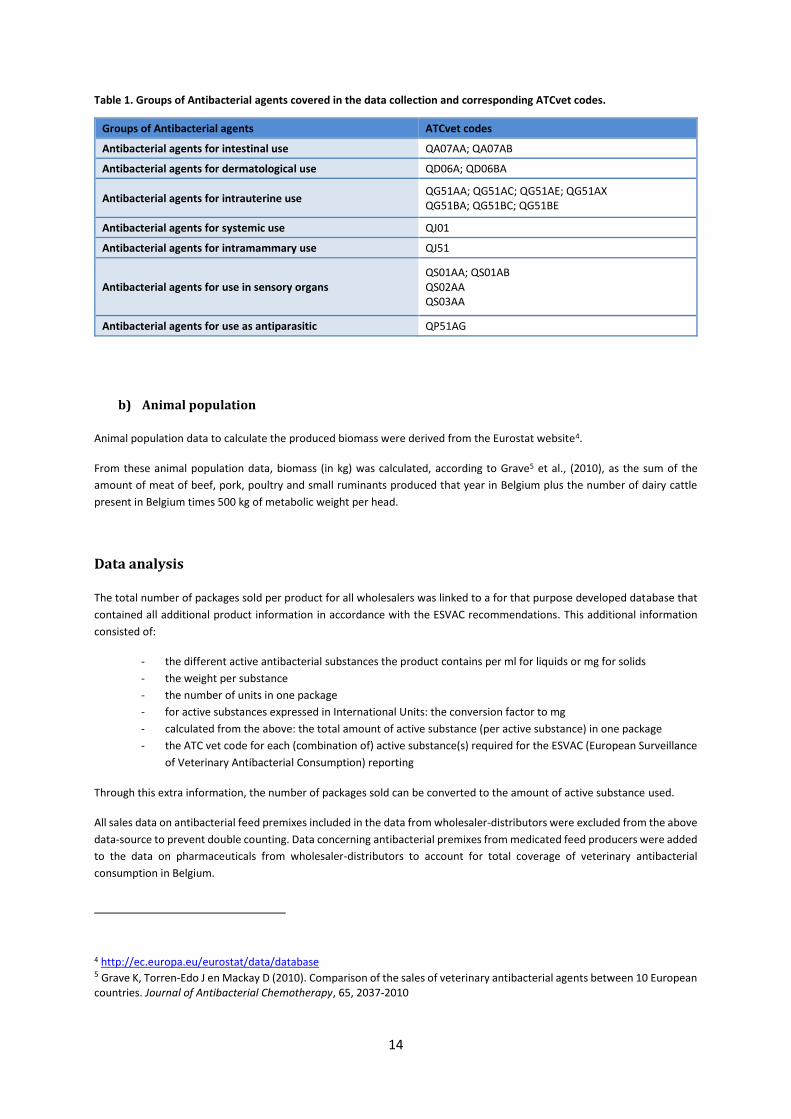
Table 1 provides an overview of the groups of Antibacterial agents covered in the BelVet-SAC data-collection system, together
with the corresponding ATCvet codes. The ATCvet codes included in each Antibacterial class are listed in appendix A.
In the BelVet-SAC data collection all antibacterials used for veterinary medicine are covered (Table 1). No antibacterials are
excluded which is in contrast to the ESVAC reporting system where antibacterials for dermatological use and for use in sensory
organs are excluded. This explains why consumption data as presented in this report may slightly differ from what is reported
for Belgium in the ESVAC report.
As Zinc Oxide (ZnO) products (premixes) were authorized in Belgium since September 2013, sales data were collected and
are presented separately.
2 http://www.favv-afsca.be/bo-documents/Inter_R0-1002_3_dierlijke_producten_erkende_bedrijven.PDF 3 www.BELVET-SAC.ugent.be
14
Table 1. Groups of Antibacterial agents covered in the data collection and corresponding ATCvet codes.
Groups of Antibacterial agents ATCvet codes
Antibacterial agents for intestinal use QA07AA; QA07AB
Antibacterial agents for dermatological use QD06A; QD06BA
Antibacterial agents for intrauterine use QG51AA; QG51AC; QG51AE; QG51AX QG51BA; QG51BC; QG51BE
Antibacterial agents for systemic use QJ01
Antibacterial agents for intramammary use QJ51
Antibacterial agents for use in sensory organs QS01AA; QS01AB QS02AA QS03AA
Antibacterial agents for use as antiparasitic QP51AG
b) Animal population
Animal population data to calculate the produced biomass were derived from the Eurostat website4.
From these animal population data, biomass (in kg) was calculated, according to Grave5 et al., (2010), as the sum of the
amount of meat of beef, pork, poultry and small ruminants produced that year in Belgium plus the number of dairy cattle
present in Belgium times 500 kg of metabolic weight per head.
Data analysis
The total number of packages sold per product for all wholesalers was linked to a for that purpose developed database that
contained all additional product information in accordance with the ESVAC recommendations. This additional information
consisted of:
- the different active antibacterial substances the product contains per ml for liquids or mg for solids
- the weight per substance
- the number of units in one package
- for active substances expressed in International Units: the conversion factor to mg
- calculated from the above: the total amount of active substance (per active substance) in one package
- the ATC vet code for each (combination of) active substance(s) required for the ESVAC (European Surveillance
of Veterinary Antibacterial Consumption) reporting
Through this extra information, the number of packages sold can be converted to the amount of active substance used.
All sales data on antibacterial feed premixes included in the data from wholesaler-distributors were excluded from the above
data-source to prevent double counting. Data concerning antibacterial premixes from medicated feed producers were added
to the data on pharmaceuticals from wholesaler-distributors to account for total coverage of veterinary antibacterial
consumption in Belgium.
4 http://ec.europa.eu/eurostat/data/database 5 Grave K, Torren-Edo J en Mackay D (2010). Comparison of the sales of veterinary antibacterial agents between 10 European countries. Journal of Antibacterial Chemotherapy, 65, 2037-2010
15
As in the previous reports (BELVET-SAC 2007-2018)6, yearly consumption figures were put versus biomass as a yearly adjusted
denominator according to the methodology described by Grave et al. (2010). The animal species included were based upon
the vast majority of the biomass present (estimated to be 93% of the total biomass present in Belgium). It should however
be made clear that the calculation of the biomass does not contain other animal species such as horses, rabbits and
companion animals (dogs, cats, …) (estimated to be 7% of the biomass present in Belgium), whereas the collected data on
antibacterial use also covers the use in these species. The biomass also includes animals slaughtered in Belgium but raised in
other countries and it excludes animals raised in Belgium but slaughtered abroad.
Data validation
a) External data validation
To check for correctness and completeness the collected data on premixes were compared to data collected by the compound
feed producing industry7. The datasets do not provide exactly the same information as the used data collection methodology
is slightly different. However, trends and evolutions in the different datasets can be compared. If large discrepancies were
observed data validity was further investigated and corrected, if needed.
To check for correctness of the reported pharmaceuticals data trends are compared with the data obtained from the market
authorization holders (MAH) collected in the framework of the antibiotic tax as well as with the reported use data in Sanitel-
Med.
b) Internal data validation
For each of the data entries of the wholesaler-distributor or compound feed producers results were compared with the data
entries of the previous years by the same companies. If large, unexpected, discrepancies were observed between the data
provided in the subsequent years data validity was further investigated and corrected, if needed.
6 http://www.belvetsac.ugent.be/ 7 www.bfa.be
16
ANTIMICROBIAL USE DATA
Data collection in Sanitel-Med
a) Notification of antimicrobial use at farm-level
Since 27 February 2017, veterinarians are legally obliged (RD of 02.07.2017 modifying RD of 21.07.2016) to register in the
secured online data collection system Sanitel-Med all prescriptions, administrations and deliveries of antimicrobial products
(pharmaceuticals as well as premixes, incl. premixes containing ZnO as an antidiarrheal substance) on Belgian farms raising
pigs, broilers, laying hens and veal calves. The system, developed and maintained by the FAMHP, is accessible as a web
application or through automated data transfer using xml (webservices).
Registration is done by first creating a ‘Medicinal Delivery Document’ containing the identification of the veterinarian and the
farm as well as the type, number and date of the reference document (Treatment and Delivery Document, prescription or
‘register out’ of the veterinarian). To this Medicinal Delivery Document, one or more ‘notifications’ are added, each
representing a specific prescription, delivery or administration of an antimicrobial product.
The following data need to be included in a notification:
The animal species and category for which the antimicrobial product is intended.
The categories that can be selected are
Pigs:
sows (PIGB);
gilts (PIGI);
fattening pigs (PIGF);
weaned piglets (PIGLW);
suckling piglets (PIGLU)
Poultry:
broilers (BROIR);
laying hens (LAYIH)
Veal:
Veal calves (VECLF)
The name and quantity of the antimicrobial product.
The product needs to be selected from a regularly updated medicinal product list containing all antimicrobial product
packages commercialized in Belgium, identified through a unique cti-ext key. As for the antimicrobial sales data, all groups of
antimicrobial agents listed in Table 1 are included. For pharmaceuticals, the number of packages needs to be registered, with
the possibility of using decimals. For premixes, either the number of packages, the kg premix or the kg medicated feed in
combination with the parts-per-million premix needs to be registered; using decimals is also possible.
Products used off-label need to be registered from the same list. Products used through cascade (products not registered in
Belgium, products for human use or products prepared extemporaneously) need to be registered as ‘Self-Defined Product’
(SDP), requiring additional data fields to allow calculation of the delivered quantity of active substance (see below).
Veterinarians can register the data at any moment under the premise that all data from a given quarter need to be registered
at the latest the 14th day of the following quarter. The farmer or responsible of the animals must check the correctness of the
data from a given quarter at the latest the final day of the first month of the following quarter. This last day is called the ‘Data-
Lock-Point’, hence, there are four DLP in a year.
17
So-called ‘third parties’ (i.c. other Belgian data collection systems) can transfer the required data on behalf of a veterinarian
and/or farmer. Nonetheless, the respective veterinarian and/or farmer remain responsible for the completeness, correctness
and timeliness of the registrations.
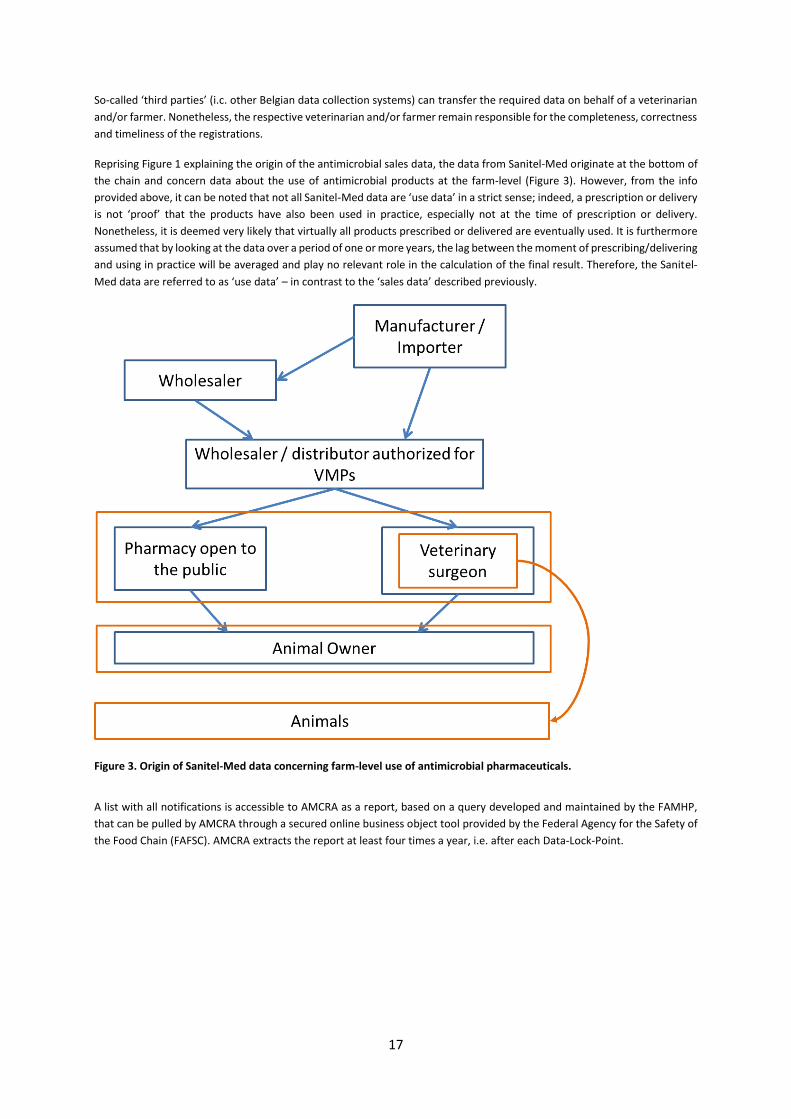
Reprising Figure 1 explaining the origin of the antimicrobial sales data, the data from Sanitel-Med originate at the bottom of
the chain and concern data about the use of antimicrobial products at the farm-level (Figure 3). However, from the info
provided above, it can be noted that not all Sanitel-Med data are ‘use data’ in a strict sense; indeed, a prescription or delivery
is not ‘proof’ that the products have also been used in practice, especially not at the time of prescription or delivery.
Nonetheless, it is deemed very likely that virtually all products prescribed or delivered are eventually used. It is furthermore
assumed that by looking at the data over a period of one or more years, the lag between the moment of prescribing/delivering
and using in practice will be averaged and play no relevant role in the calculation of the final result. Therefore, the Sanitel-
Med data are referred to as ‘use data’ – in contrast to the ‘sales data’ described previously.
Figure 3. Origin of Sanitel-Med data concerning farm-level use of antimicrobial pharmaceuticals.
A list with all notifications is accessible to AMCRA as a report, based on a query developed and maintained by the FAMHP,
that can be pulled by AMCRA through a secured online business object tool provided by the Federal Agency for the Safety of
the Food Chain (FAFSC). AMCRA extracts the report at least four times a year, i.e. after each Data-Lock-Point.
18
b) Number of animals present at farm level
The number of animals present at each farm is needed to calculate the animal mass ‘at risk of treatment’ at the farm (cfr.
calculation of BD100). The number is deduced from identification and registration data present in the SANITEL8 -database or,
specifically for poultry farms for the year 2018, from SANITEL-data combined with data from the yearly ‘Biosecurity-survey’
organized by the FASFC.
i. Veal calf farms
The average number of calves present at each farm is calculated per semester, as the average over the six corresponding
monthly numbers of animals. From January 2018 till July 2019, the monthly number of animals was calculated as the average
occupation number taking into account the number of arrivals, births, departures and deaths per month on the farm as
notified in SANITEL. From August 2019 onwards, the monthly number of animals is calculated as the average of the number
of calves notified as present in SANITEL each 1st, 11th and 21st day of each month and the 1st day of the subsequent month.
ii. Poultry farms
For 2019, SANITEL-capacity data of a poultry facility were calculated as the sum of the SANITEL-capacity data of the
corresponding poultry sanitary units.
For 2018, preference was given to the yearly FAFSC ‘Biosecurity-survey’ capacity numbers above SANITEL-data. These are
either a separate capacity for broilers and laying hens on a facility, a total capacity for broilers and laying hens on a facility,
or a total capacity for either broilers or laying hens on a facility. If for a given facility notifications were present in Sanitel-Med
for a poultry category missing from the Biosecurity-survey but for which capacity data was available in SANITEL, the SANITEL-
capacity was used.
iii. Pig farms
SANITEL-data include capacity data (updated whenever a change is made to the capacity, for example by building a new or
changing an existing stable) as well as count data (the number of animals present needs to be registered in SANITEL by the
herd veterinarian at least three times a year). The capacity is the preferred animal number in the calculations. If not available,
count data are used. The number of suckling piglets is calculated from the number of sows using the formula # 𝑠𝑢𝑐𝑘𝑙𝑒𝑟𝑠 =
# 𝑠𝑜𝑤𝑠 × 2712⁄ . The number of gilts is added to the number of sows if these are present at the farm; if not, the gilts are
counted as fattening pigs. No separate analysis is done for gilts.
c) Number of active farms
The number of active farms (i.e. having raised animals, hence, where antibacterial products could have been used), is needed
to determine the reference population for benchmarking (cfr. further in the text). Being ‘active’ is encoded as a separate
feature in SANITEL.
8 http://www.afsca.be/dierlijkeproductie/dieren/sanitel/
19
Data analysis
The analysis of the Sanitel-Med data is split in three parts:
A first part that focusses on the coverage of the Sanitel-Med use data of the sales data and is based only on the
mass used (numerator).
A second part that focusses on the evolution of the use at the species-level, and is based on the number of
treatment days calculated with a species-specific denominator.
A third part that focusses on the use at the farm-level, and is based on the number of treatment days calculated
with a farm-specific denominator.
For the first and second part of the analyses, the data were not subjected to the farm-level quality controls for defining the
reference populations for benchmarking (see further in the text). Hence, the analyses include all numerator data (all
notifications) submitted to Sanitel-Med, except those that were considered erroneous and have not been confirmed as being
correct. The errors concerned include notifications that lead to an extremely high used quantity. For the third part,
benchmarking reference populations were calculated after subjecting the data to quality controls as described further below.
a) Determination of the numerator
i. Mg active substance used
This is calculated per Sanitel-Med notification, using the formula
𝑎𝑐𝑡𝑖𝑣𝑒 𝑠𝑢𝑏𝑠𝑡𝑎𝑛𝑐𝑒 𝑢𝑠𝑒𝑑 (𝑚𝑔) = 𝑞𝑢𝑎𝑛𝑡𝑖𝑡𝑦 𝑎𝑛𝑡𝑖𝑏𝑎𝑐𝑡𝑒𝑟𝑖𝑎𝑙 𝑝𝑟𝑜𝑑𝑢𝑐𝑡 × 𝑠𝑡𝑟𝑒𝑛𝑔𝑡ℎ
The quantity of antimicrobial product is the number of packages times the number of units of antimicrobial product per
package. The strength is the number of units of active substance per unit of antimicrobial product and is taken from the
products’ summary of product characteristics (SPC). If the active substance unit is given in international units, a
transformation to mg is done using the conversion factors provided on the webpage of the AMCRA data analysis unit9. If the
product contains more than one active substance, the calculation is done for each substance and the sum is made.
After calculating the total mg of active substance used per notification, the amounts can be aggregated by farm, by type of
active substance, by animal category and by animal species, and recalculated to kg or tonnes used.
ii. Number of DDDAbel used
The DDDAbel (the Defined Daily Dose Animal for Belgium) is the daily dose (in mg) per kg live bodyweight. This is calculated
per notification using the formula
# 𝐷𝐷𝐷𝐴𝑏𝑒𝑙 = 𝑚𝑔 𝑎𝑐𝑡𝑖𝑣𝑒 𝑠𝑢𝑏𝑠𝑡𝑎𝑛𝑐𝑒 𝐷𝐷𝐷𝐴𝑏𝑒𝑙⁄
The DDDAbel-values for all antibacterial products in the Sanitel-Med medicinal product list and for all self-defined products
are defined and maintained by AMCRA in ‘Antibacterial-dosing’ lists made up per animal species10. The lists also contain the
LAbel (Long-acting factor defined for Belgium) of each product. This LAbel factor corrects the longer duration of action of certain
products in the calculation of the BD100 (cfr. Further in the text). For not-long-acting products, the LAbel equals 1. The
procedures for determining the DDDbel and LAbel values are also available on the AMCRA website10.
9https://www.amcra.be/swfiles/files/Principes%20voor%20bepalen%20van%20DDD-
bel%20op%20productniveau(2)_109.pdf 10 https://www.amcra.be/nl/analyse-antibioticagebruik/
20
b) Determination of the denominator
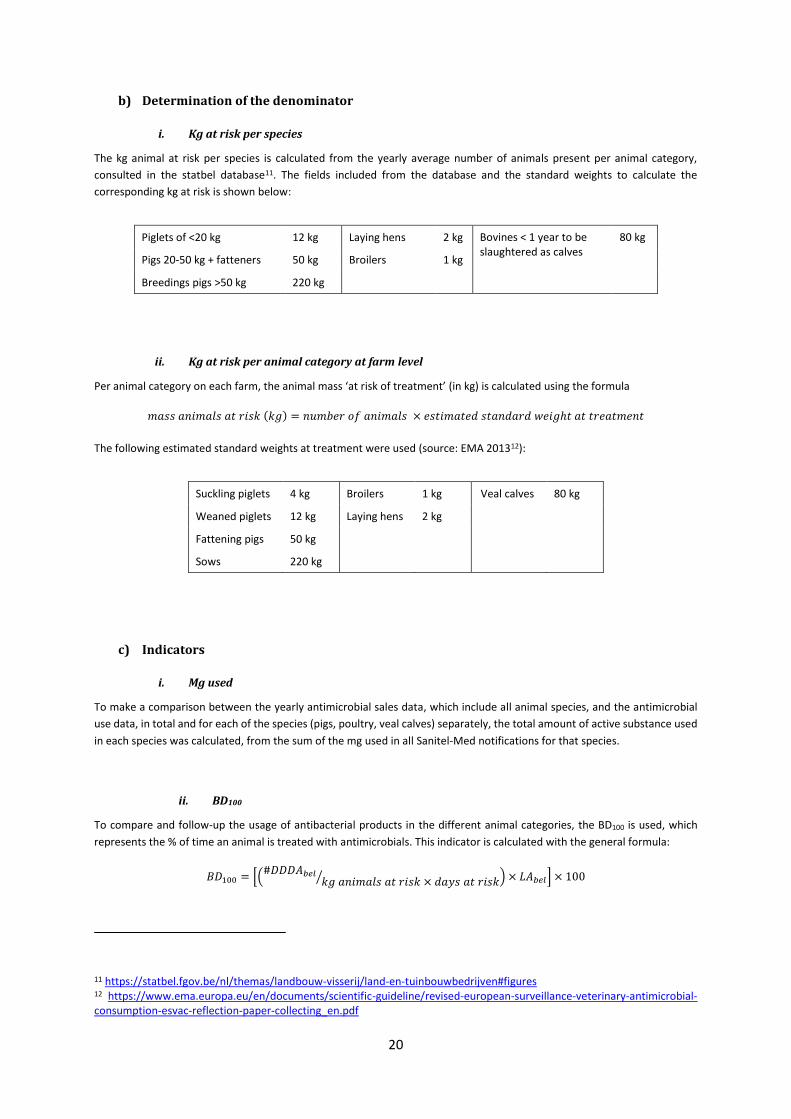
i. Kg at risk per species
The kg animal at risk per species is calculated from the yearly average number of animals present per animal category,
consulted in the statbel database11. The fields included from the database and the standard weights to calculate the
corresponding kg at risk is shown below:
Piglets of <20 kg 12 kg Laying hens 2 kg Bovines < 1 year to be slaughtered as calves
80 kg
Pigs 20-50 kg + fatteners 50 kg Broilers 1 kg
Breedings pigs >50 kg 220 kg
ii. Kg at risk per animal category at farm level
Per animal category on each farm, the animal mass ‘at risk of treatment’ (in kg) is calculated using the formula
𝑚𝑎𝑠𝑠 𝑎𝑛𝑖𝑚𝑎𝑙𝑠 𝑎𝑡 𝑟𝑖𝑠𝑘 (𝑘𝑔) = 𝑛𝑢𝑚𝑏𝑒𝑟 𝑜𝑓 𝑎𝑛𝑖𝑚𝑎𝑙𝑠 × 𝑒𝑠𝑡𝑖𝑚𝑎𝑡𝑒𝑑 𝑠𝑡𝑎𝑛𝑑𝑎𝑟𝑑 𝑤𝑒𝑖𝑔ℎ𝑡 𝑎𝑡 𝑡𝑟𝑒𝑎𝑡𝑚𝑒𝑛𝑡
The following estimated standard weights at treatment were used (source: EMA 201312):
Suckling piglets 4 kg Broilers 1 kg Veal calves 80 kg
Weaned piglets 12 kg Laying hens 2 kg
Fattening pigs 50 kg
Sows 220 kg
c) Indicators
i. Mg used
To make a comparison between the yearly antimicrobial sales data, which include all animal species, and the antimicrobial
use data, in total and for each of the species (pigs, poultry, veal calves) separately, the total amount of active substance used
in each species was calculated, from the sum of the mg used in all Sanitel-Med notifications for that species.
ii. BD100
To compare and follow-up the usage of antibacterial products in the different animal categories, the BD100 is used, which
represents the % of time an animal is treated with antimicrobials. This indicator is calculated with the general formula:
𝐵𝐷100 = [(#𝐷𝐷𝐷𝐴𝑏𝑒𝑙
𝑘𝑔 𝑎𝑛𝑖𝑚𝑎𝑙𝑠 𝑎𝑡 𝑟𝑖𝑠𝑘 × 𝑑𝑎𝑦𝑠 𝑎𝑡 𝑟𝑖𝑠𝑘⁄ ) × 𝐿𝐴𝑏𝑒𝑙] × 100
11 https://statbel.fgov.be/nl/themas/landbouw-visserij/land-en-tuinbouwbedrijven#figures 12 https://www.ema.europa.eu/en/documents/scientific-guideline/revised-european-surveillance-veterinary-antimicrobial-consumption-esvac-reflection-paper-collecting_en.pdf
21
To obtain a result per combination of farm and animal category, the BD100 is first calculated per Sanitel-Med notification and
per month (i.e. with 30,42 days at risk and with the animals at risk determined for that month). Then, the sum of these BD100
values over all notifications in one month is made, from which an average over the 12 months in the year is calculated,
resulting in a final month-average BD100 per animal category on a farm. The comparison between animal categories is then
done based on the frequency distribution over all farm-animal category combinations that belong to the core reference
population for benchmarking (cfr. below).
iii. BD100-species
The BD100-species is calculated with the BD100 formula but with the sum of the #DDDAbel*LAbel per species in the numerator
and the kg at risk per species in the denominator.
Quality control for defining the yearly and core reference populations for benchmarking
The yearly reference population for benchmarking is used to study the distribution of the BD100 in an animal category, and it
is per animal category defined as the group of farms that, for the whole year under consideration
were ‘active’ (see point a)
had no ‘errors’ in their Sanitel-Med notifications (see point b)
fulfilled the conditions with respect to ‘minimum herd size and empty stables’ (see points c and d).
The core reference population for benchmarking follows from the yearly refence populations for benchmarking and is used
to study the evolution of the distribution of the BD100 in an animal category over several years, and it is per animal category
defined as the group of farms that were part of the yearly reference population in all considered years.
In the reference populations, a further distinction is made between zero-use farms and use-farms (see point e).
a) Active during the whole year
A farm was eligible for inclusion in the benchmarking reference population when it was encoded active during the whole
year. For poultry farms, more specifically at least one sanitary unit needed to have been active during the whole year for the
facility to be included. Pig farms encoded as ‘active’ but not having any registration in Sanitel-Med and either having no recent
count date (i.e. count date before 2019) or having a recent count date (i.e. count date in 2019) but with counts for all pig
categories equalling zero, were excluded. Veal calf farms encoded as ‘active’ yet not having any registration in Sanitel-Med
and having zero animals in 2019 were excluded.
b) Notification errors
Two types of errors are distinguished:
i. Notifications that cannot be processed due to missing data on the number of animals present at the farm.
ii. Notifications where the delivered quantity is considered erratic.
Farmers are made aware of these errors through ‘error reports’, providing them the opportunity to take the necessary steps
to adjust the data. Farms that have notification errors that have not been adjusted or have not been confirmed as correct
were excluded from the benchmarking reference population.
22
c) Empty stables
Pig farms with recent count data equalling zero at the start of two consecutive trimesters, poultry farms with facility capacities
equalling zero at the start of two consecutive trimesters and veal calf farms with at least one semester without animals were
excluded from the benchmarking reference population.
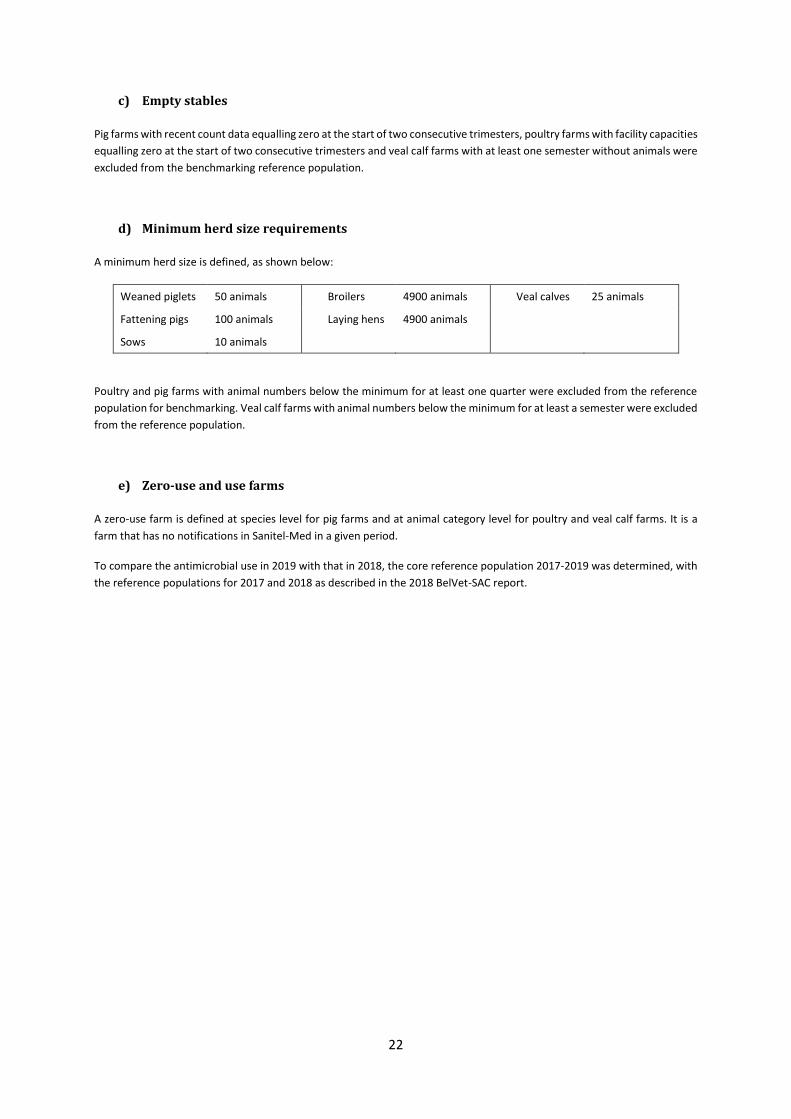
d) Minimum herd size requirements
A minimum herd size is defined, as shown below:
Weaned piglets 50 animals Broilers 4900 animals Veal calves 25 animals
Fattening pigs 100 animals Laying hens 4900 animals
Sows 10 animals
Poultry and pig farms with animal numbers below the minimum for at least one quarter were excluded from the reference
population for benchmarking. Veal calf farms with animal numbers below the minimum for at least a semester were excluded
from the reference population.
e) Zero-use and use farms
A zero-use farm is defined at species level for pig farms and at animal category level for poultry and veal calf farms. It is a
farm that has no notifications in Sanitel-Med in a given period.
To compare the antimicrobial use in 2019 with that in 2018, the core reference population 2017-2019 was determined, with
the reference populations for 2017 and 2018 as described in the 2018 BelVet-SAC report.
23
RESULTS
ANTIMICROBIAL SALES DATA
Response rate and data validation
All of the 22 wholesaler-distributors, requested to deliver their sales data on veterinary antibacterial products sold in 2019,
responded. All 44 compound feed producers, licensed for the production of medicated feed responded. One feed mill indicate
not to have produced any medicated feed (any more) while 43 feed producers delivered the data on antibacterial premixes
incorporated in medicated feed to be used in Belgium. Based on the response rate data coverage is assumed to be 100%.
Data providers get more and more accustomed to the system. In the last four years, the internal data validation step did not
identify unexpected data entries. Therefore no data corrections were needed.
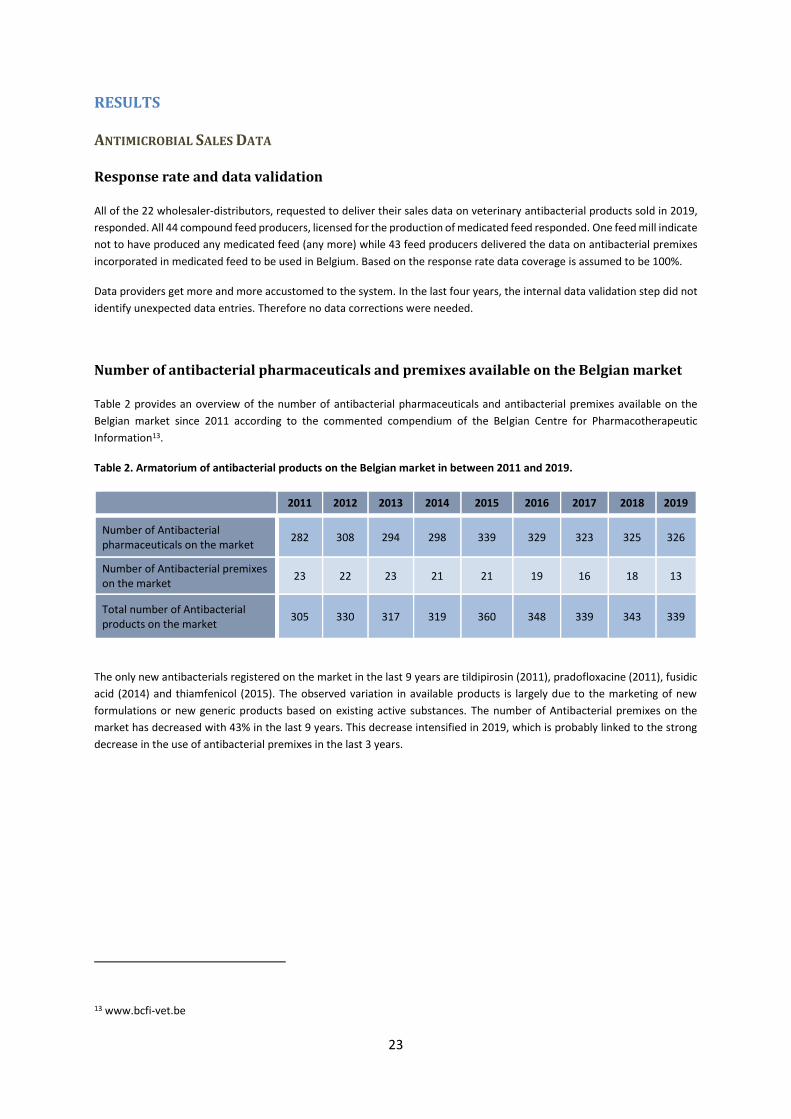
Number of antibacterial pharmaceuticals and premixes available on the Belgian market
Table 2 provides an overview of the number of antibacterial pharmaceuticals and antibacterial premixes available on the
Belgian market since 2011 according to the commented compendium of the Belgian Centre for Pharmacotherapeutic
Information13.
Table 2. Armatorium of antibacterial products on the Belgian market in between 2011 and 2019.
2011 2012 2013 2014 2015 2016 2017 2018 2019
Number of Antibacterial pharmaceuticals on the market 282 308 294 298 339 329 323 325 326
Number of Antibacterial premixes on the market 23 22 23 21 21 19 16 18 13
Total number of Antibacterial products on the market 305 330 317 319 360 348 339 343 339
The only new antibacterials registered on the market in the last 9 years are tildipirosin (2011), pradofloxacine (2011), fusidic
acid (2014) and thiamfenicol (2015). The observed variation in available products is largely due to the marketing of new
formulations or new generic products based on existing active substances. The number of Antibacterial premixes on the
market has decreased with 43% in the last 9 years. This decrease intensified in 2019, which is probably linked to the strong
decrease in the use of antibacterial premixes in the last 3 years.
13 www.bcfi-vet.be
24
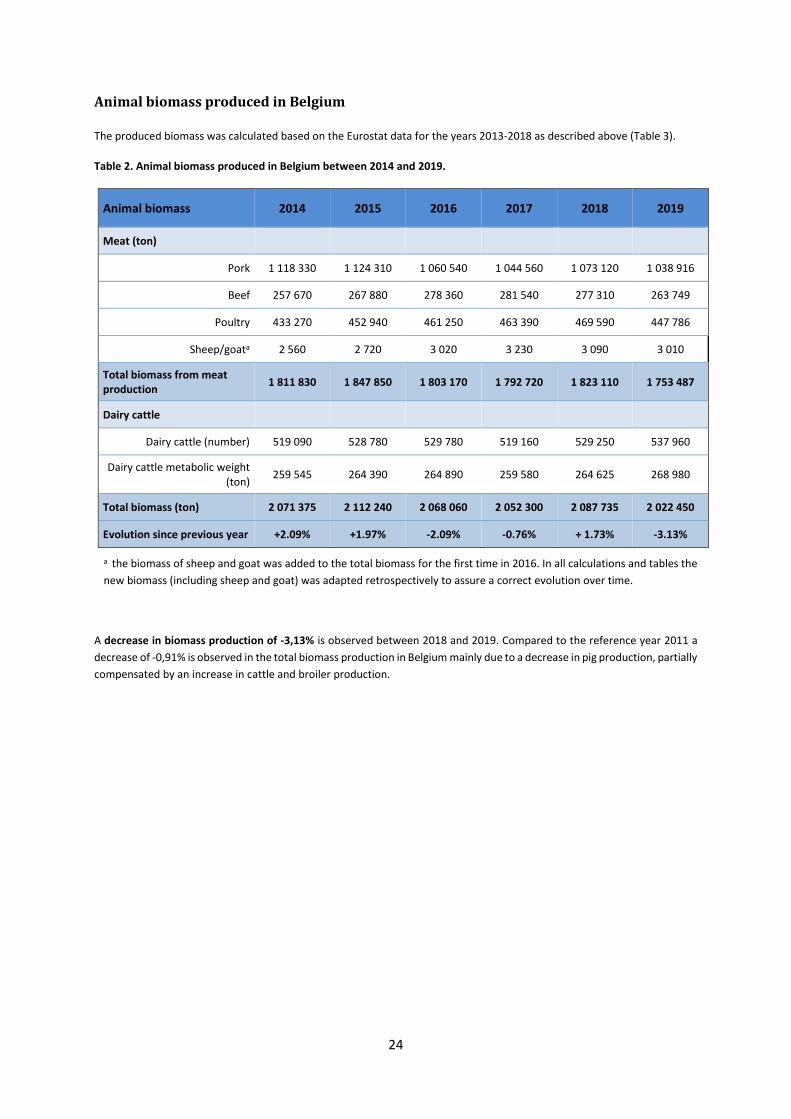
Animal biomass produced in Belgium
The produced biomass was calculated based on the Eurostat data for the years 2013-2018 as described above (Table 3).
Table 2. Animal biomass produced in Belgium between 2014 and 2019.
Animal biomass 2014 2015 2016 2017 2018 2019
Meat (ton)
Pork 1 118 330 1 124 310 1 060 540 1 044 560 1 073 120 1 038 916
Beef 257 670 267 880 278 360 281 540 277 310 263 749
Poultry 433 270 452 940 461 250 463 390 469 590 447 786
Sheep/goata 2 560 2 720 3 020 3 230 3 090 3 010
Total biomass from meat production
1 811 830 1 847 850 1 803 170 1 792 720 1 823 110 1 753 487
Dairy cattle
Dairy cattle (number) 519 090 528 780 529 780 519 160 529 250 537 960
Dairy cattle metabolic weight (ton)
259 545 264 390 264 890 259 580 264 625 268 980
Total biomass (ton) 2 071 375 2 112 240 2 068 060 2 052 300 2 087 735 2 022 450
Evolution since previous year +2.09% +1.97% -2.09% -0.76% + 1.73% -3.13%
a the biomass of sheep and goat was added to the total biomass for the first time in 2016. In all calculations and tables the
new biomass (including sheep and goat) was adapted retrospectively to assure a correct evolution over time.
A decrease in biomass production of -3,13% is observed between 2018 and 2019. Compared to the reference year 2011 a
decrease of -0,91% is observed in the total biomass production in Belgium mainly due to a decrease in pig production, partially
compensated by an increase in cattle and broiler production.
25
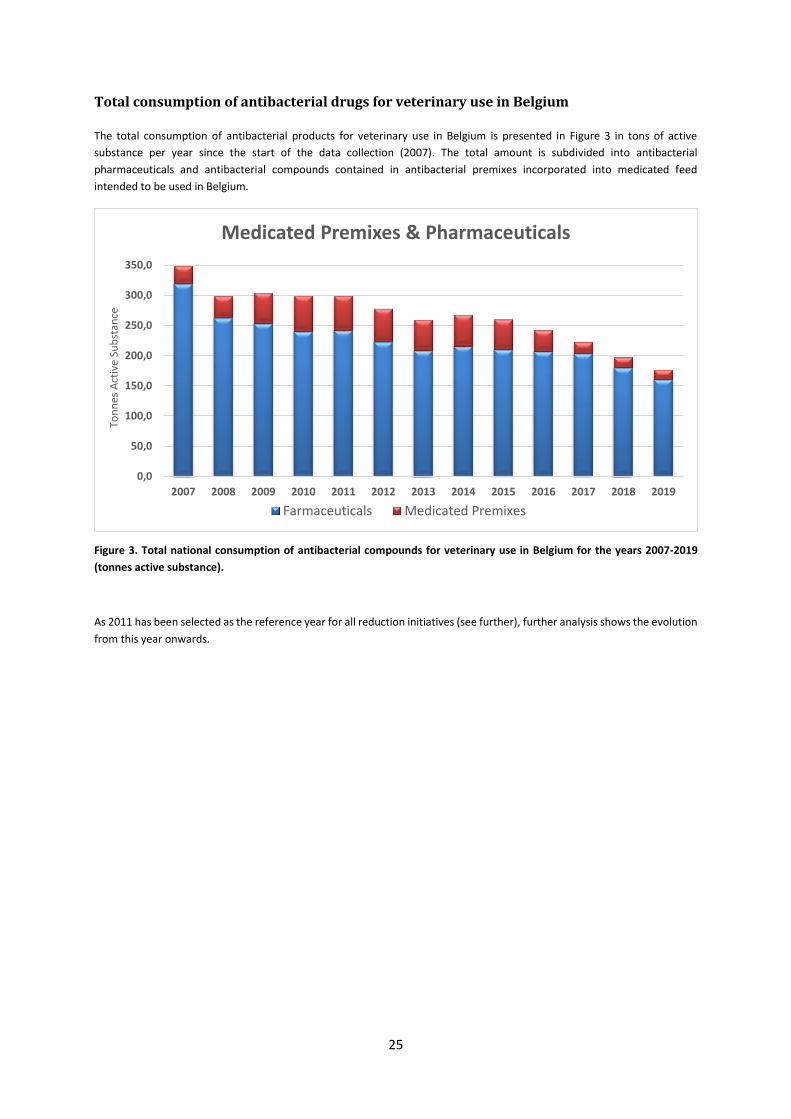
Total consumption of antibacterial drugs for veterinary use in Belgium
The total consumption of antibacterial products for veterinary use in Belgium is presented in Figure 3 in tons of active
substance per year since the start of the data collection (2007). The total amount is subdivided into antibacterial
pharmaceuticals and antibacterial compounds contained in antibacterial premixes incorporated into medicated feed
intended to be used in Belgium.
Figure 3. Total national consumption of antibacterial compounds for veterinary use in Belgium for the years 2007-2019
(tonnes active substance).
As 2011 has been selected as the reference year for all reduction initiatives (see further), further analysis shows the evolution
from this year onwards.
0,0
50,0
100,0
150,0
200,0
250,0
300,0
350,0
2007 2008 2009 2010 2011 2012 2013 2014 2015 2016 2017 2018 2019
Ton
nes
Act
ive
Sub
stan
ce
Medicated Premixes & Pharmaceuticals
Farmaceuticals Medicated Premixes
26
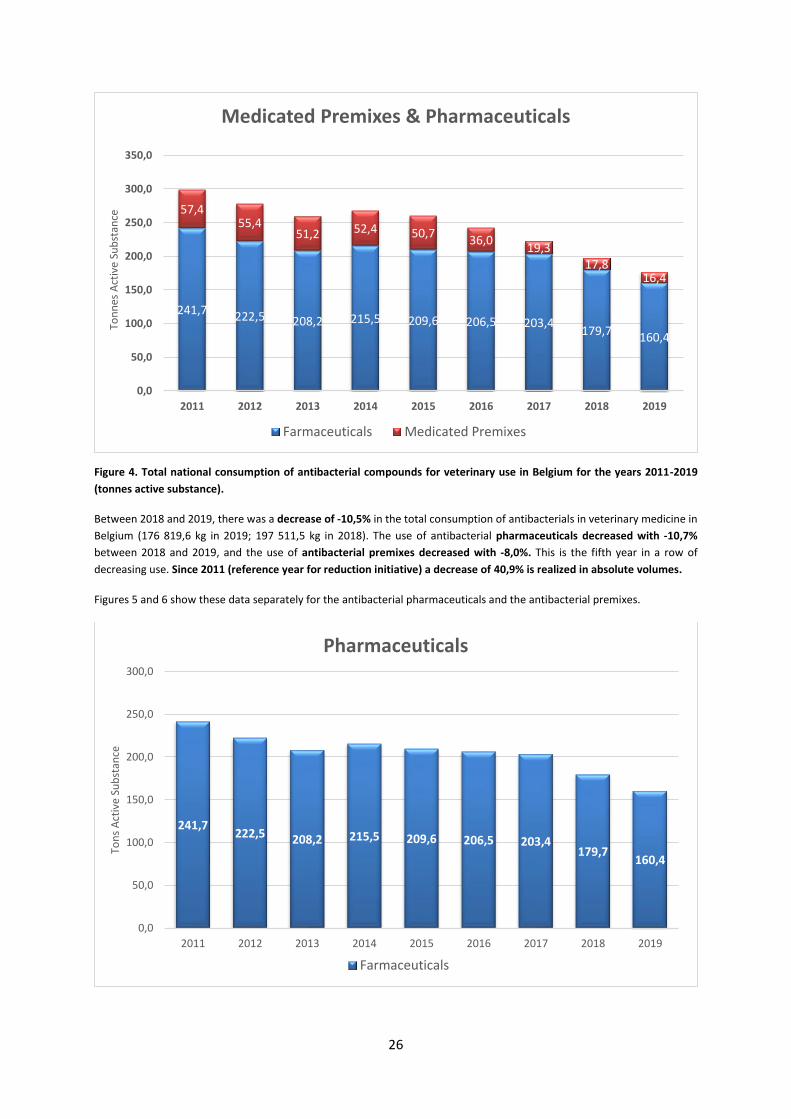
Figure 4. Total national consumption of antibacterial compounds for veterinary use in Belgium for the years 2011-2019
(tonnes active substance).
Between 2018 and 2019, there was a decrease of -10,5% in the total consumption of antibacterials in veterinary medicine in
Belgium (176 819,6 kg in 2019; 197 511,5 kg in 2018). The use of antibacterial pharmaceuticals decreased with -10,7%
between 2018 and 2019, and the use of antibacterial premixes decreased with -8,0%. This is the fifth year in a row of
decreasing use. Since 2011 (reference year for reduction initiative) a decrease of 40,9% is realized in absolute volumes.
Figures 5 and 6 show these data separately for the antibacterial pharmaceuticals and the antibacterial premixes.
241,7 222,5 208,2 215,5 209,6 206,5 203,4179,7 160,4
57,455,4
51,2 52,4 50,736,0
19,317,8
16,4
0,0
50,0
100,0
150,0
200,0
250,0
300,0
350,0
2011 2012 2013 2014 2015 2016 2017 2018 2019
Ton
nes
Act
ive
Sub
stan
ceMedicated Premixes & Pharmaceuticals
Farmaceuticals Medicated Premixes
241,7222,5 208,2 215,5 209,6 206,5 203,4
179,7160,4
0,0
50,0
100,0
150,0
200,0
250,0
300,0
2011 2012 2013 2014 2015 2016 2017 2018 2019
Ton
s A
ctiv
e Su
bst
ance
Pharmaceuticals
Farmaceuticals
27
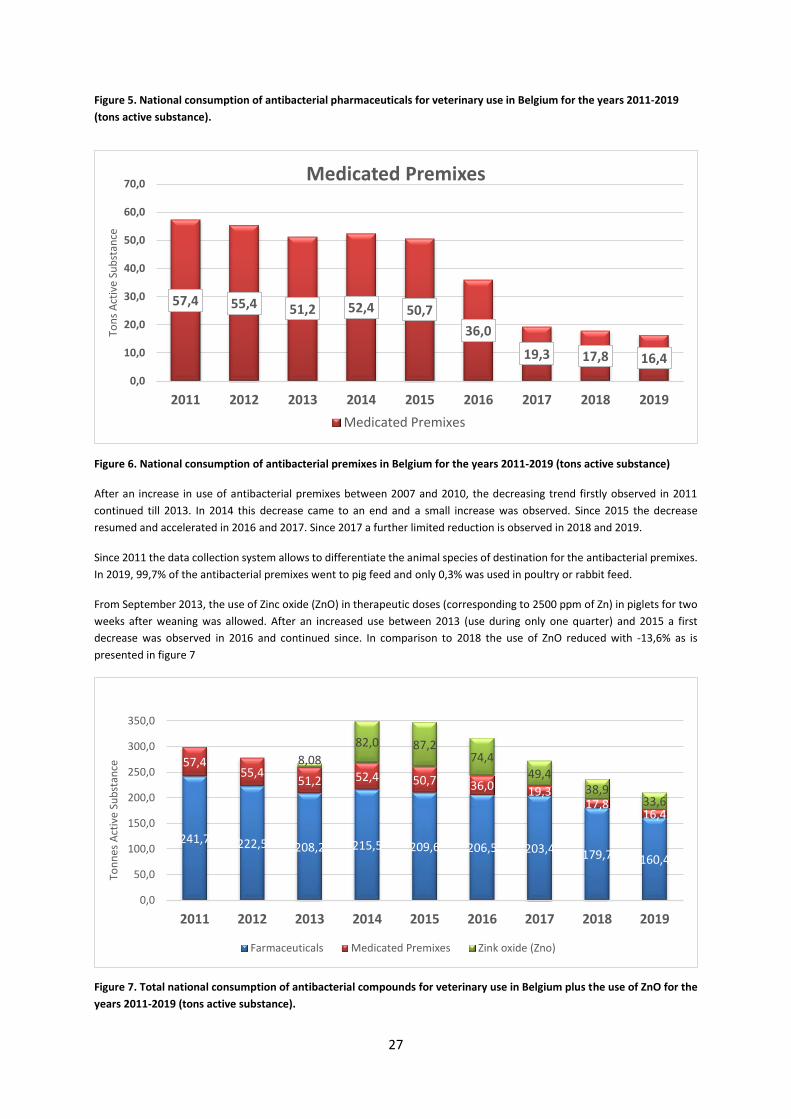
Figure 5. National consumption of antibacterial pharmaceuticals for veterinary use in Belgium for the years 2011-2019
(tons active substance).
Figure 6. National consumption of antibacterial premixes in Belgium for the years 2011-2019 (tons active substance)
After an increase in use of antibacterial premixes between 2007 and 2010, the decreasing trend firstly observed in 2011
continued till 2013. In 2014 this decrease came to an end and a small increase was observed. Since 2015 the decrease
resumed and accelerated in 2016 and 2017. Since 2017 a further limited reduction is observed in 2018 and 2019.
Since 2011 the data collection system allows to differentiate the animal species of destination for the antibacterial premixes.
In 2019, 99,7% of the antibacterial premixes went to pig feed and only 0,3% was used in poultry or rabbit feed.
From September 2013, the use of Zinc oxide (ZnO) in therapeutic doses (corresponding to 2500 ppm of Zn) in piglets for two
weeks after weaning was allowed. After an increased use between 2013 (use during only one quarter) and 2015 a first
decrease was observed in 2016 and continued since. In comparison to 2018 the use of ZnO reduced with -13,6% as is
presented in figure 7
Figure 7. Total national consumption of antibacterial compounds for veterinary use in Belgium plus the use of ZnO for the
years 2011-2019 (tons active substance).
57,4 55,4 51,2 52,4 50,7
36,0
19,3 17,8 16,4
0,0
10,0
20,0
30,0
40,0
50,0
60,0
70,0
2011 2012 2013 2014 2015 2016 2017 2018 2019
Ton
s A
ctiv
e Su
bst
ance
Medicated Premixes
Medicated Premixes
241,7 222,5 208,2 215,5 209,6 206,5 203,4 179,7 160,4
57,455,4
51,2 52,4 50,7 36,0 19,317,8
16,4
8,08
82,0 87,274,4
49,438,9
33,6
0,0
50,0
100,0
150,0
200,0
250,0
300,0
350,0
2011 2012 2013 2014 2015 2016 2017 2018 2019
Ton
nes
Act
ive
Sub
stan
ce
Farmaceuticals Medicated Premixes Zink oxide (Zno)
28
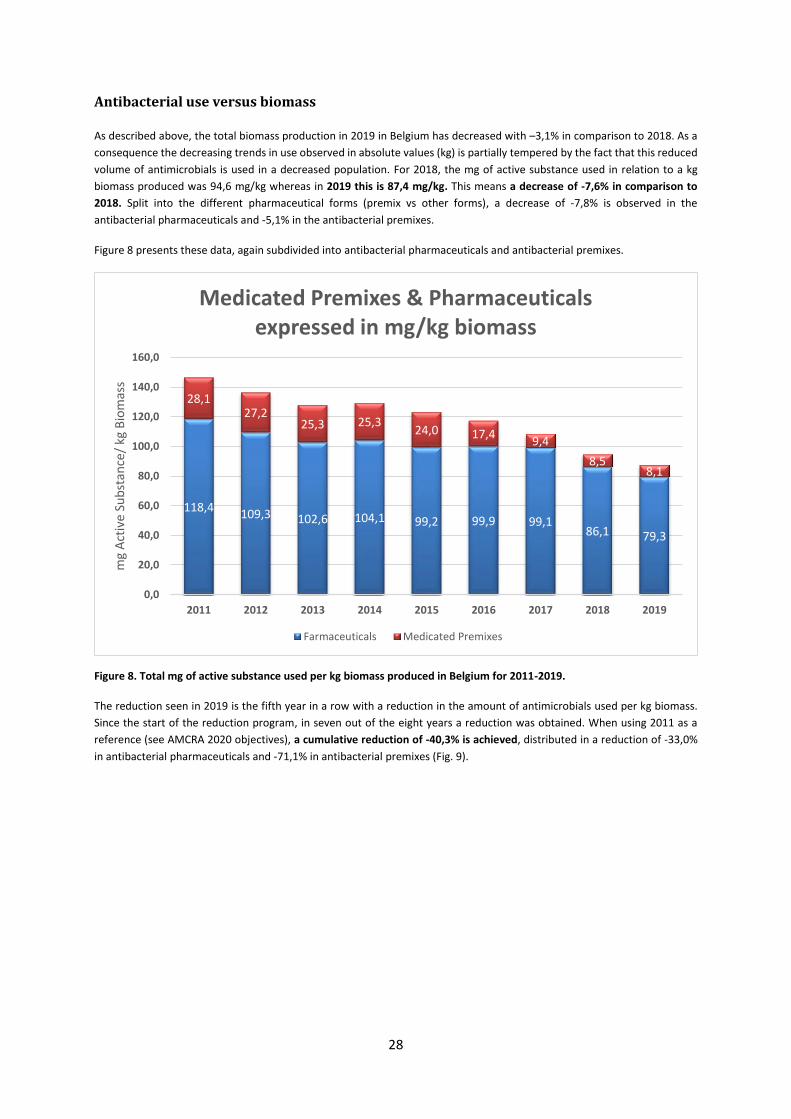
Antibacterial use versus biomass
As described above, the total biomass production in 2019 in Belgium has decreased with –3,1% in comparison to 2018. As a
consequence the decreasing trends in use observed in absolute values (kg) is partially tempered by the fact that this reduced
volume of antimicrobials is used in a decreased population. For 2018, the mg of active substance used in relation to a kg
biomass produced was 94,6 mg/kg whereas in 2019 this is 87,4 mg/kg. This means a decrease of -7,6% in comparison to
2018. Split into the different pharmaceutical forms (premix vs other forms), a decrease of -7,8% is observed in the
antibacterial pharmaceuticals and -5,1% in the antibacterial premixes.
Figure 8 presents these data, again subdivided into antibacterial pharmaceuticals and antibacterial premixes.
Figure 8. Total mg of active substance used per kg biomass produced in Belgium for 2011-2019.
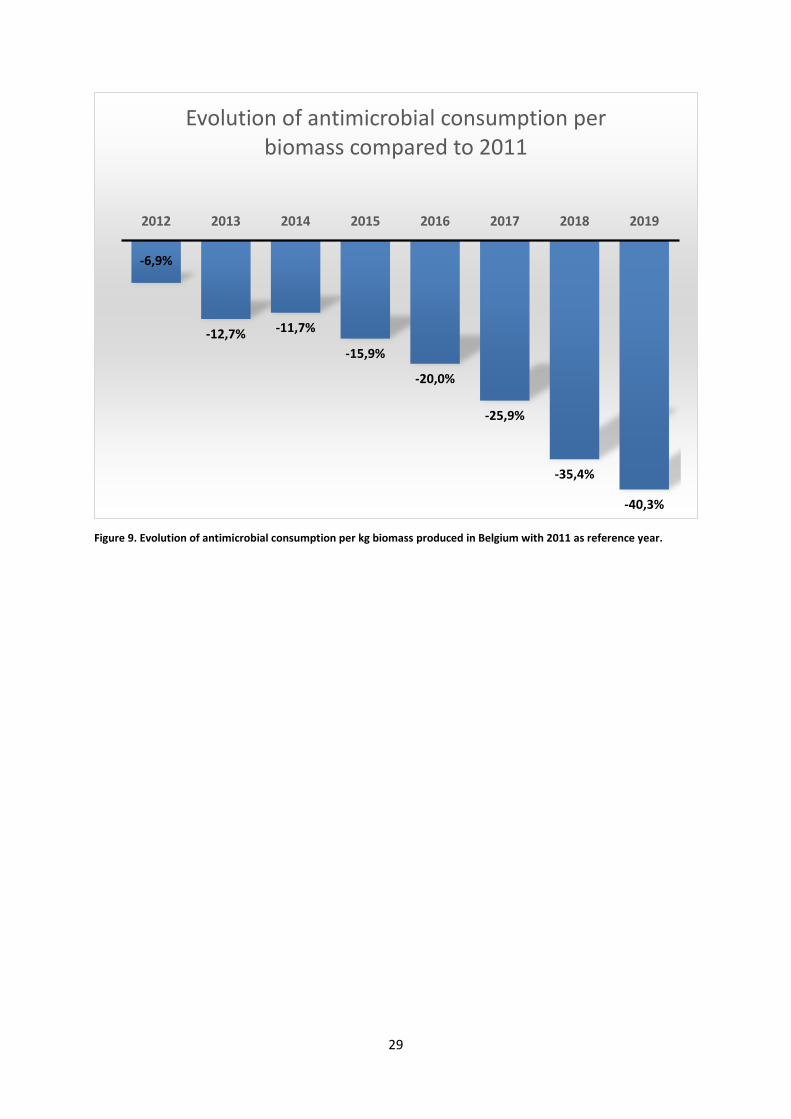
The reduction seen in 2019 is the fifth year in a row with a reduction in the amount of antimicrobials used per kg biomass.
Since the start of the reduction program, in seven out of the eight years a reduction was obtained. When using 2011 as a
reference (see AMCRA 2020 objectives), a cumulative reduction of -40,3% is achieved, distributed in a reduction of -33,0%
in antibacterial pharmaceuticals and -71,1% in antibacterial premixes (Fig. 9).
118,4109,3 102,6 104,1 99,2 99,9 99,1
86,1 79,3
28,127,2
25,3 25,324,0 17,4
9,4
8,58,1
0,0
20,0
40,0
60,0
80,0
100,0
120,0
140,0
160,0
2011 2012 2013 2014 2015 2016 2017 2018 2019
mg
Act
ive
Sub
stan
ce/
kg B
iom
ass
Medicated Premixes & Pharmaceuticals expressed in mg/kg biomass
Farmaceuticals Medicated Premixes
29
Figure 9. Evolution of antimicrobial consumption per kg biomass produced in Belgium with 2011 as reference year.
-6,9%
-12,7% -11,7%
-15,9%
-20,0%
-25,9%
-35,4%
-40,3%
2012 2013 2014 2015 2016 2017 2018 2019
Evolution of antimicrobial consumption per biomass compared to 2011
30
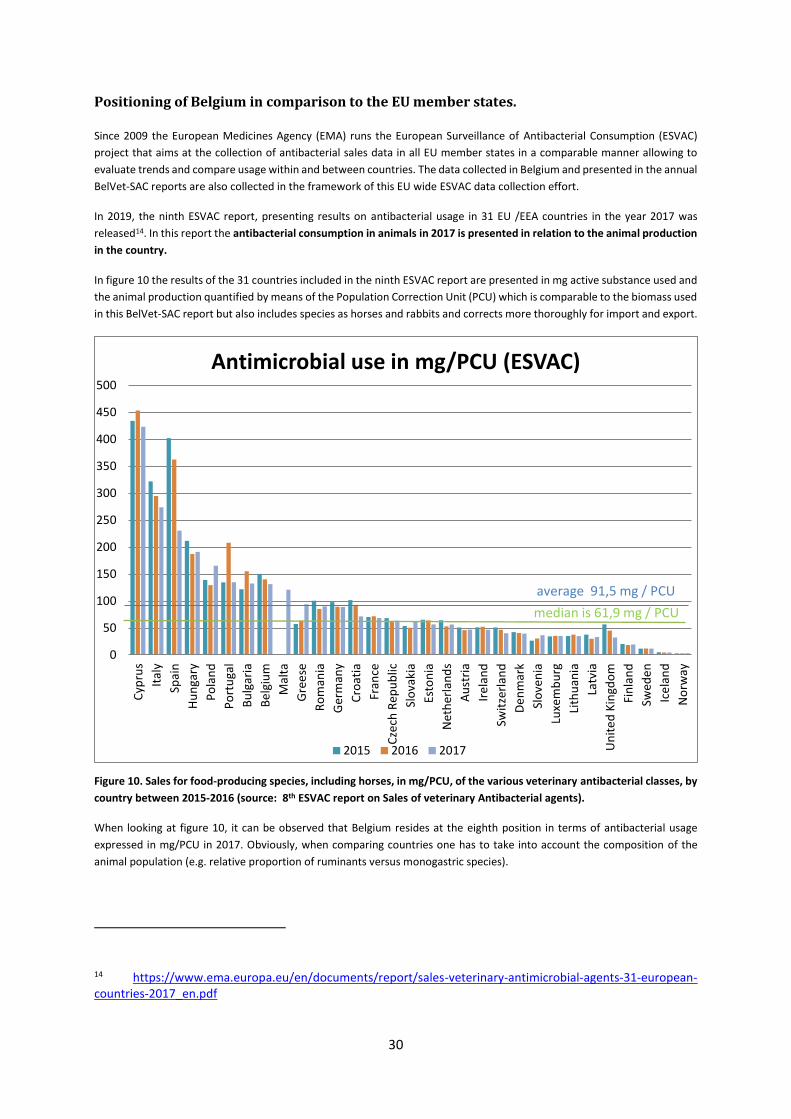
Positioning of Belgium in comparison to the EU member states.
Since 2009 the European Medicines Agency (EMA) runs the European Surveillance of Antibacterial Consumption (ESVAC)
project that aims at the collection of antibacterial sales data in all EU member states in a comparable manner allowing to
evaluate trends and compare usage within and between countries. The data collected in Belgium and presented in the annual
BelVet-SAC reports are also collected in the framework of this EU wide ESVAC data collection effort.
In 2019, the ninth ESVAC report, presenting results on antibacterial usage in 31 EU /EEA countries in the year 2017 was
released14. In this report the antibacterial consumption in animals in 2017 is presented in relation to the animal production
in the country.
In figure 10 the results of the 31 countries included in the ninth ESVAC report are presented in mg active substance used and
the animal production quantified by means of the Population Correction Unit (PCU) which is comparable to the biomass used
in this BelVet-SAC report but also includes species as horses and rabbits and corrects more thoroughly for import and export.
Figure 10. Sales for food-producing species, including horses, in mg/PCU, of the various veterinary antibacterial classes, by
country between 2015-2016 (source: 8th ESVAC report on Sales of veterinary Antibacterial agents).
When looking at figure 10, it can be observed that Belgium resides at the eighth position in terms of antibacterial usage
expressed in mg/PCU in 2017. Obviously, when comparing countries one has to take into account the composition of the
animal population (e.g. relative proportion of ruminants versus monogastric species).
14 https://www.ema.europa.eu/en/documents/report/sales-veterinary-antimicrobial-agents-31-european-countries-2017_en.pdf
0
50
100
150
200
250
300
350
400
450
500
Cyp
rus
Ital
y
Spai
n
Hu
nga
ry
Po
lan
d
Po
rtu
gal
Bu
lgar
ia
Be
lgiu
m
Mal
ta
Gre
ese
Ro
man
ia
Ger
man
y
Cro
atia
Fran
ce
Cze
ch R
epu
blic
Slo
vaki
a
Esto
nia
Net
her
lan
ds
Au
stri
a
Ire
lan
d
Swit
zerl
and
De
nm
ark
Slo
ven
ia
Luxe
mb
urg
Lith
uan
ia
Latv
ia
Un
ite
d K
ingd
om
Fin
lan
d
Swed
en
Ice
lan
d
No
rway
Antimicrobial use in mg/PCU (ESVAC)
2015 2016 2017
average 91,5 mg / PCU
median is 61,9 mg / PCU
31
Noteworthy, these data do not yet include the substantial decrease in use in Belgium achieved in 2018 and 2019. It is also
remarkable to see that although the mean value of use in Europe has decreased from 109 mg/PCU in 2013 to 91,5 mg/PCU
in 2017, the median value has remained more or less stable around 60 mg/PCU (62,3 mg/PCU in 2013 and 61,9 mg/PCU in
2017.
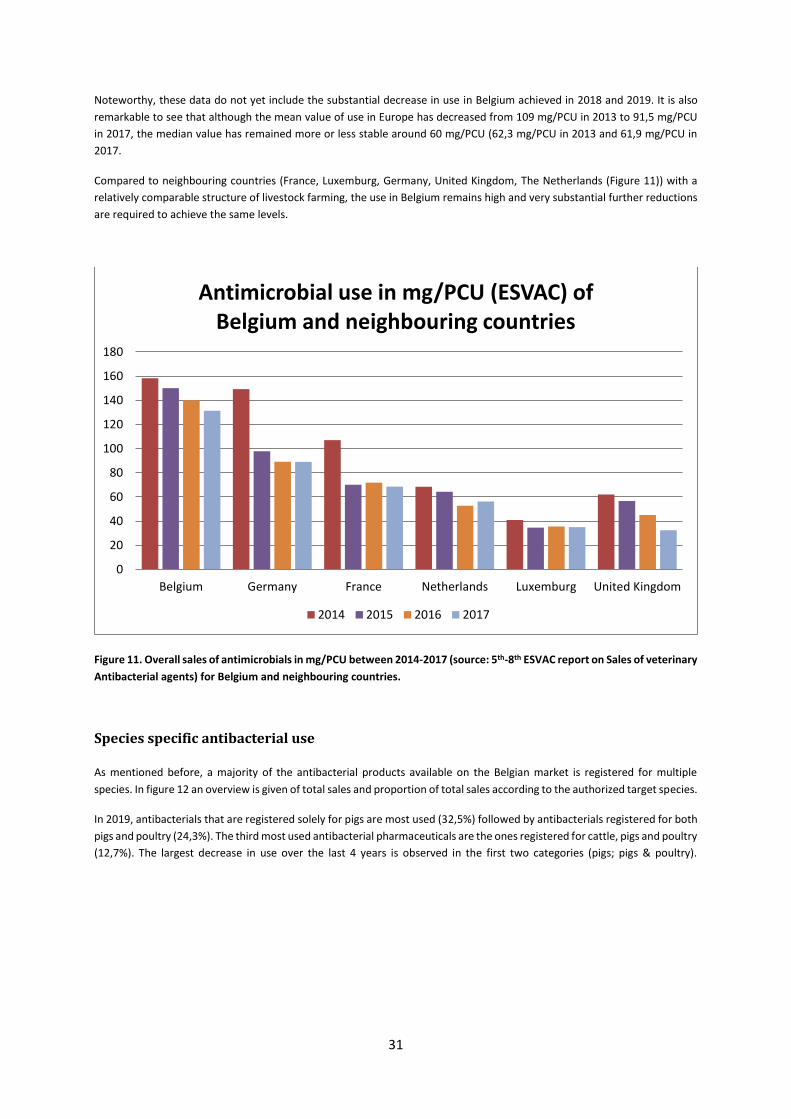
Compared to neighbouring countries (France, Luxemburg, Germany, United Kingdom, The Netherlands (Figure 11)) with a
relatively comparable structure of livestock farming, the use in Belgium remains high and very substantial further reductions
are required to achieve the same levels.
Figure 11. Overall sales of antimicrobials in mg/PCU between 2014-2017 (source: 5th-8th ESVAC report on Sales of veterinary
Antibacterial agents) for Belgium and neighbouring countries.
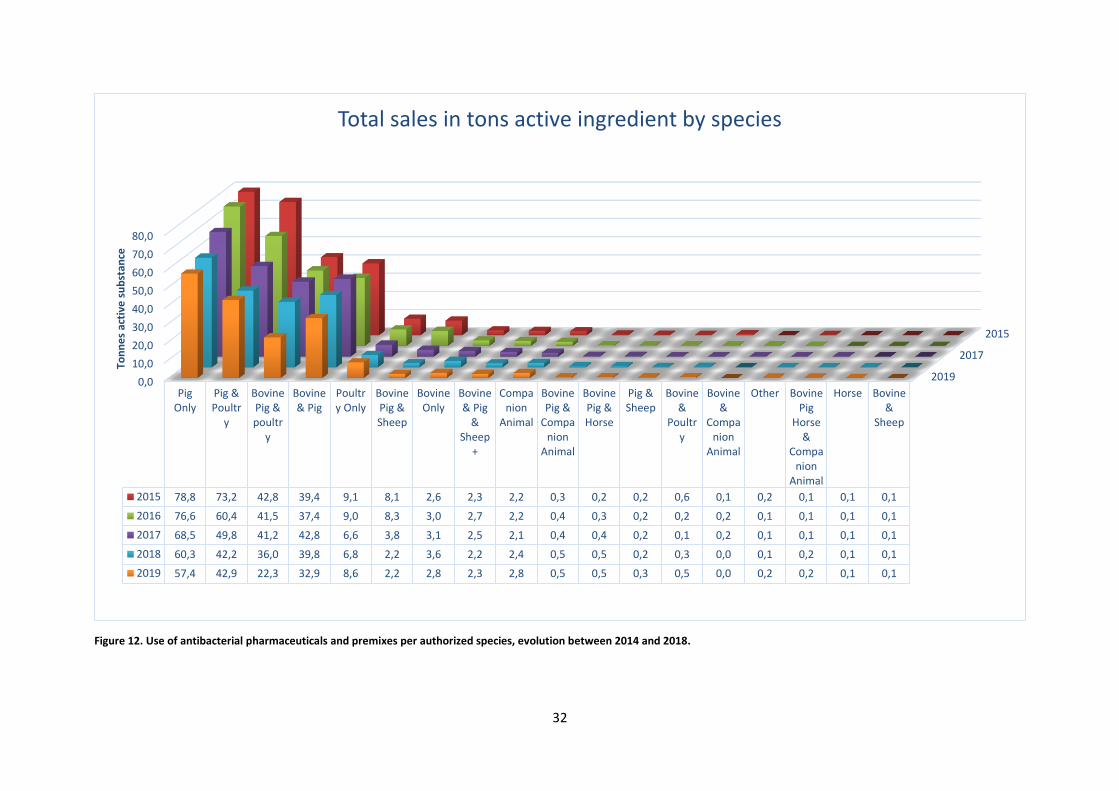
Species specific antibacterial use
As mentioned before, a majority of the antibacterial products available on the Belgian market is registered for multiple
species. In figure 12 an overview is given of total sales and proportion of total sales according to the authorized target species.
In 2019, antibacterials that are registered solely for pigs are most used (32,5%) followed by antibacterials registered for both
pigs and poultry (24,3%). The third most used antibacterial pharmaceuticals are the ones registered for cattle, pigs and poultry
(12,7%). The largest decrease in use over the last 4 years is observed in the first two categories (pigs; pigs & poultry).
0
20
40
60
80
100
120
140
160
180
Belgium Germany France Netherlands Luxemburg United Kingdom
Antimicrobial use in mg/PCU (ESVAC) of Belgium and neighbouring countries
2014 2015 2016 2017
32
Figure 12. Use of antibacterial pharmaceuticals and premixes per authorized species, evolution between 2014 and 2018.
2015
2017
20190,0
10,0
20,0
30,0
40,0
50,0
60,0
70,0
80,0
PigOnly
Pig &Poultr
y
BovinePig &poultr
y
Bovine& Pig
Poultry Only
BovinePig &Sheep
BovineOnly
Bovine& Pig
&Sheep
+
Companion
Animal
BovinePig &
Companion
Animal
BovinePig &Horse
Pig &Sheep
Bovine&
Poultry
Bovine&
Companion
Animal
Other BovinePig
Horse&
Companion
Animal
Horse Bovine&
Sheep
2015 78,8 73,2 42,8 39,4 9,1 8,1 2,6 2,3 2,2 0,3 0,2 0,2 0,6 0,1 0,2 0,1 0,1 0,1
2016 76,6 60,4 41,5 37,4 9,0 8,3 3,0 2,7 2,2 0,4 0,3 0,2 0,2 0,2 0,1 0,1 0,1 0,1
2017 68,5 49,8 41,2 42,8 6,6 3,8 3,1 2,5 2,1 0,4 0,4 0,2 0,1 0,2 0,1 0,1 0,1 0,1
2018 60,3 42,2 36,0 39,8 6,8 2,2 3,6 2,2 2,4 0,5 0,5 0,2 0,3 0,0 0,1 0,2 0,1 0,1
2019 57,4 42,9 22,3 32,9 8,6 2,2 2,8 2,3 2,8 0,5 0,5 0,3 0,5 0,0 0,2 0,2 0,1 0,1
Ton
ne
s ac
tive
su
bst
ance
Total sales in tons active ingredient by species
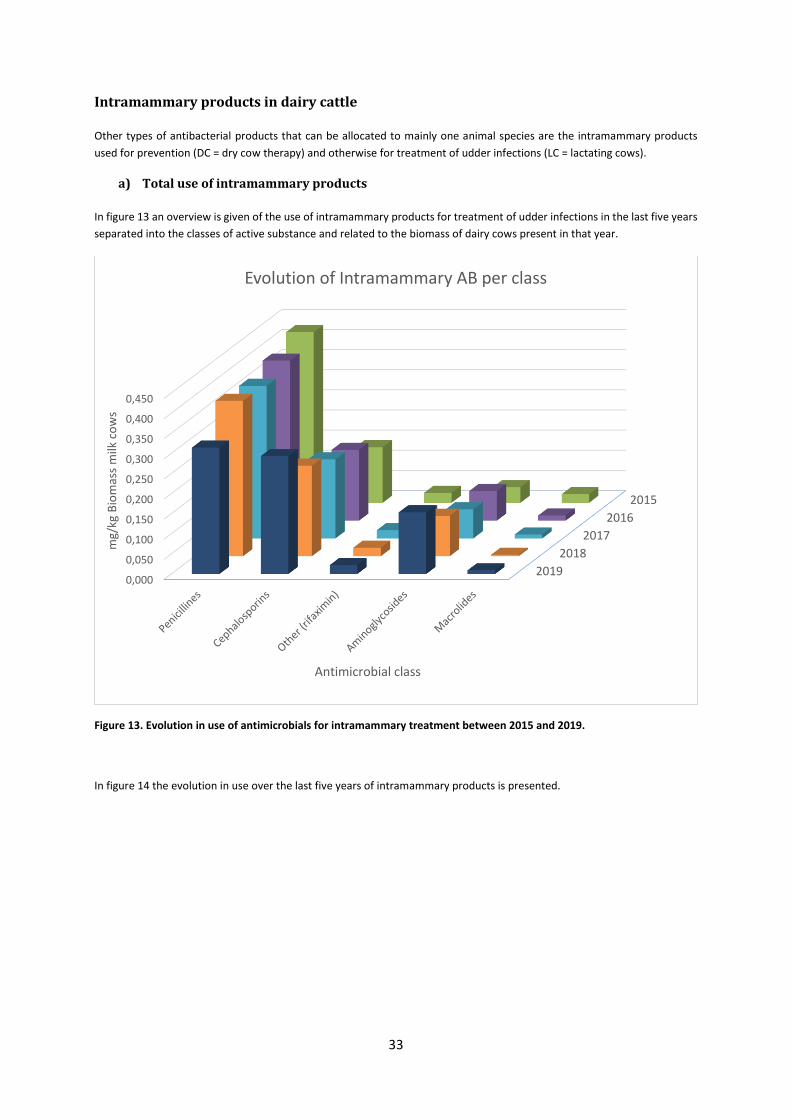
33
Intramammary products in dairy cattle
Other types of antibacterial products that can be allocated to mainly one animal species are the intramammary products
used for prevention (DC = dry cow therapy) and otherwise for treatment of udder infections (LC = lactating cows).
a) Total use of intramammary products
In figure 13 an overview is given of the use of intramammary products for treatment of udder infections in the last five years
separated into the classes of active substance and related to the biomass of dairy cows present in that year.
Figure 13. Evolution in use of antimicrobials for intramammary treatment between 2015 and 2019.
In figure 14 the evolution in use over the last five years of intramammary products is presented.
2019
2018
2017
2016
2015
0,000
0,050
0,100
0,150
0,200
0,250
0,300
0,350
0,400
0,450
mg/
kg B
iom
ass
milk
co
ws
Antimicrobial class
Evolution of Intramammary AB per class
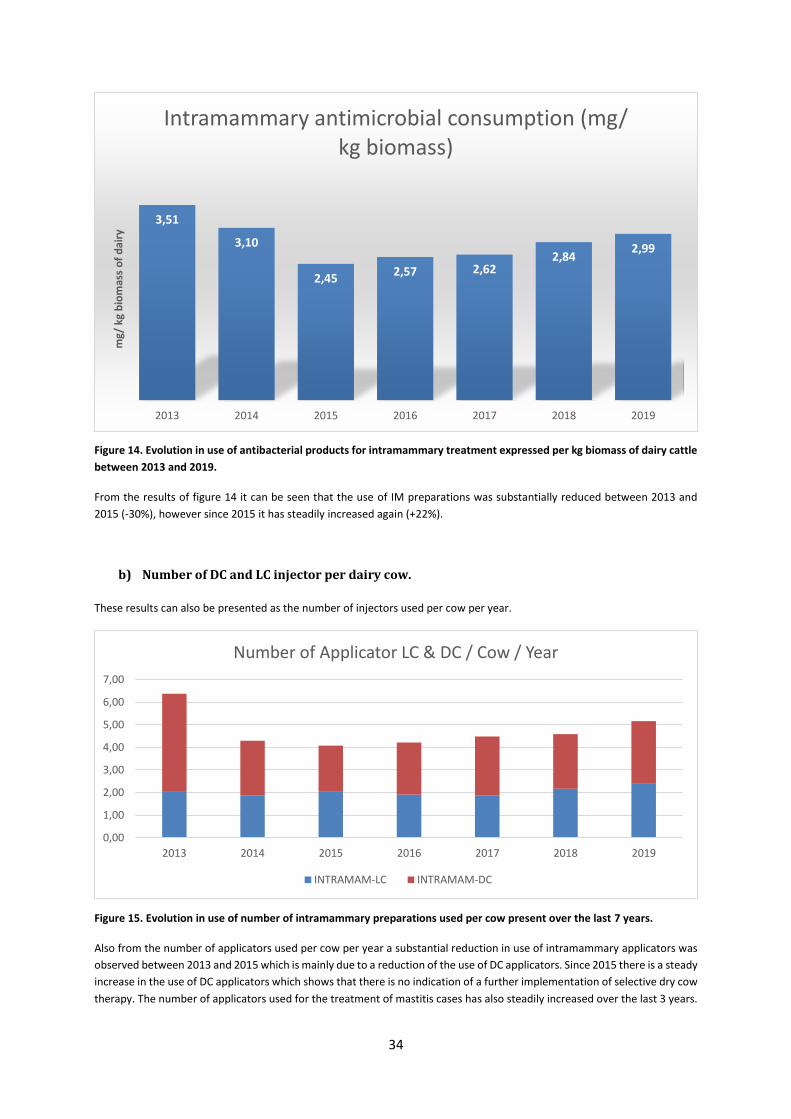
34
Figure 14. Evolution in use of antibacterial products for intramammary treatment expressed per kg biomass of dairy cattle
between 2013 and 2019.
From the results of figure 14 it can be seen that the use of IM preparations was substantially reduced between 2013 and
2015 (-30%), however since 2015 it has steadily increased again (+22%).
b) Number of DC and LC injector per dairy cow.
These results can also be presented as the number of injectors used per cow per year.
Figure 15. Evolution in use of number of intramammary preparations used per cow present over the last 7 years.
Also from the number of applicators used per cow per year a substantial reduction in use of intramammary applicators was
observed between 2013 and 2015 which is mainly due to a reduction of the use of DC applicators. Since 2015 there is a steady
increase in the use of DC applicators which shows that there is no indication of a further implementation of selective dry cow
therapy. The number of applicators used for the treatment of mastitis cases has also steadily increased over the last 3 years.
3,51
3,10
2,452,57 2,62
2,842,99
2013 2014 2015 2016 2017 2018 2019
mg/
kg
bio
mas
s o
f d
airy
Intramammary antimicrobial consumption (mg/ kg biomass)
0,00
1,00
2,00
3,00
4,00
5,00
6,00
7,00
2013 2014 2015 2016 2017 2018 2019
Number of Applicator LC & DC / Cow / Year
INTRAMAM-LC INTRAMAM-DC
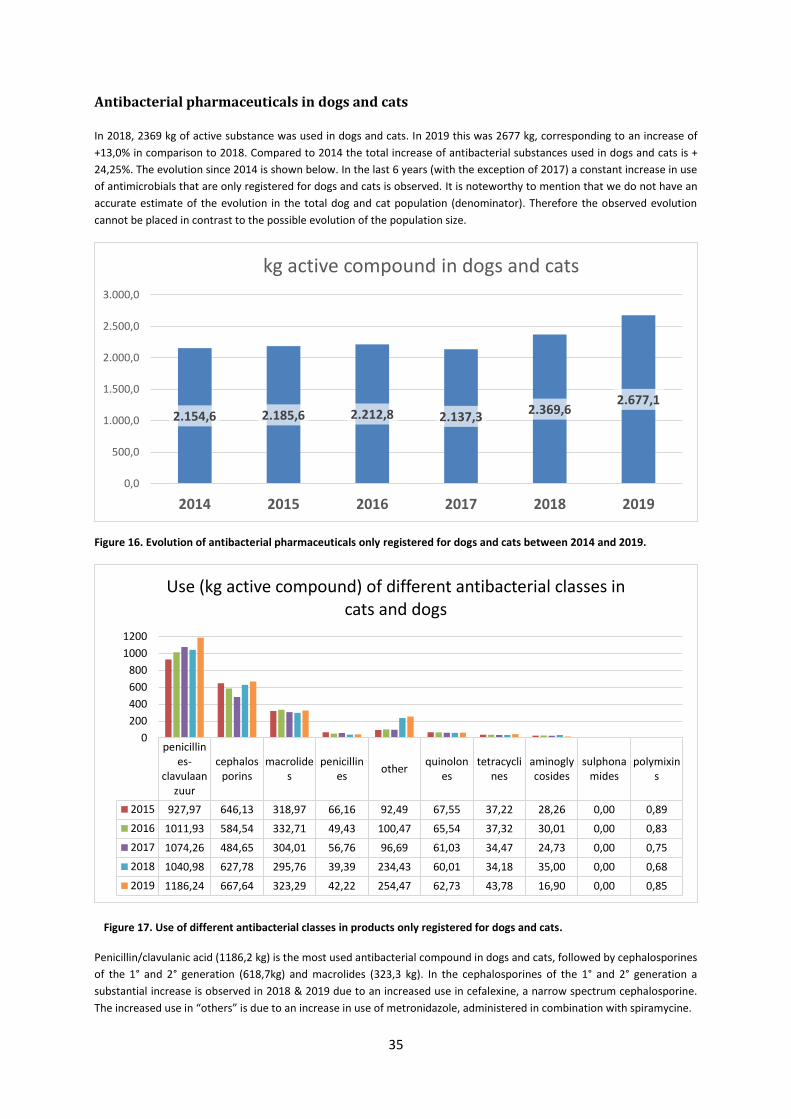
35
Antibacterial pharmaceuticals in dogs and cats
In 2018, 2369 kg of active substance was used in dogs and cats. In 2019 this was 2677 kg, corresponding to an increase of
+13,0% in comparison to 2018. Compared to 2014 the total increase of antibacterial substances used in dogs and cats is +
24,25%. The evolution since 2014 is shown below. In the last 6 years (with the exception of 2017) a constant increase in use
of antimicrobials that are only registered for dogs and cats is observed. It is noteworthy to mention that we do not have an
accurate estimate of the evolution in the total dog and cat population (denominator). Therefore the observed evolution
cannot be placed in contrast to the possible evolution of the population size.
Figure 16. Evolution of antibacterial pharmaceuticals only registered for dogs and cats between 2014 and 2019.
Figure 17. Use of different antibacterial classes in products only registered for dogs and cats.
Penicillin/clavulanic acid (1186,2 kg) is the most used antibacterial compound in dogs and cats, followed by cephalosporines
of the 1° and 2° generation (618,7kg) and macrolides (323,3 kg). In the cephalosporines of the 1° and 2° generation a
substantial increase is observed in 2018 & 2019 due to an increased use in cefalexine, a narrow spectrum cephalosporine.
The increased use in “others” is due to an increase in use of metronidazole, administered in combination with spiramycine.
2.154,6 2.185,6 2.212,8 2.137,32.369,6
2.677,1
0,0
500,0
1.000,0
1.500,0
2.000,0
2.500,0
3.000,0
2014 2015 2016 2017 2018 2019
kg active compound in dogs and cats
penicillines-
clavulaanzuur
cephalosporins
macrolides
penicillines
otherquinolon
estetracycli
nesaminoglycosides
sulphonamides
polymixins
2015 927,97 646,13 318,97 66,16 92,49 67,55 37,22 28,26 0,00 0,89
2016 1011,93 584,54 332,71 49,43 100,47 65,54 37,32 30,01 0,00 0,83
2017 1074,26 484,65 304,01 56,76 96,69 61,03 34,47 24,73 0,00 0,75
2018 1040,98 627,78 295,76 39,39 234,43 60,01 34,18 35,00 0,00 0,68
2019 1186,24 667,64 323,29 42,22 254,47 62,73 43,78 16,90 0,00 0,85
0
200
400
600
800
1000
1200
Use (kg active compound) of different antibacterial classes in cats and dogs
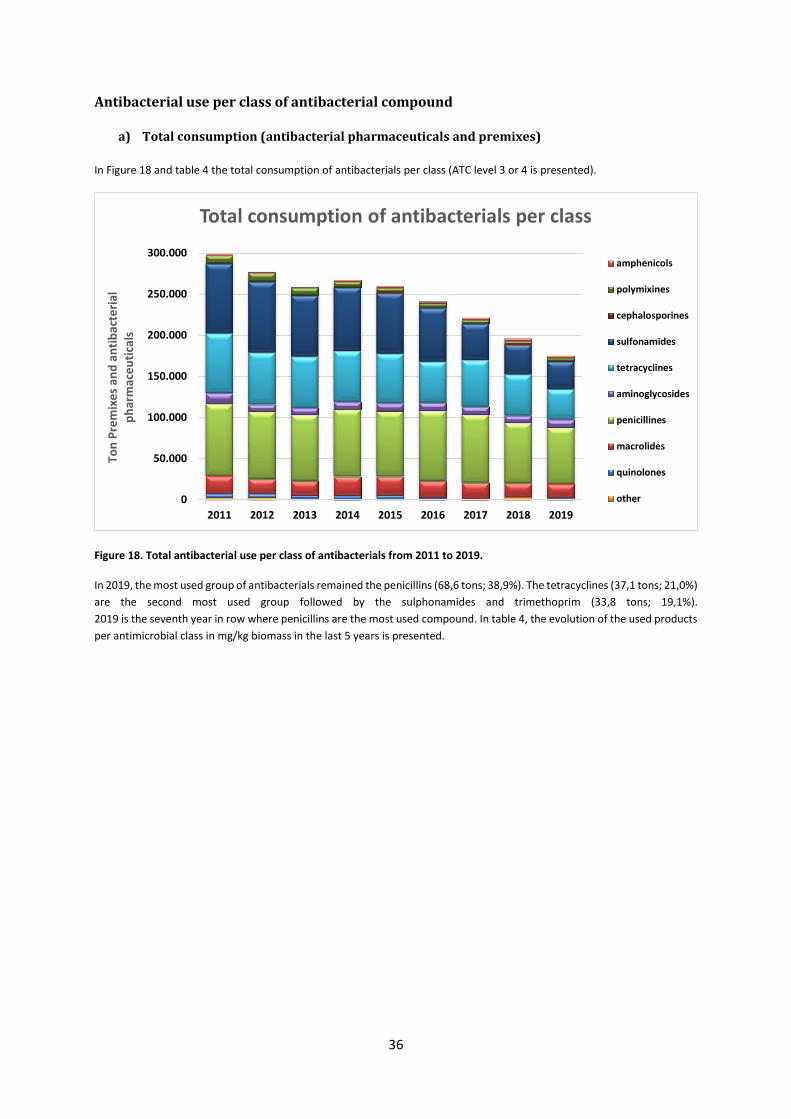
36
Antibacterial use per class of antibacterial compound
a) Total consumption (antibacterial pharmaceuticals and premixes)
In Figure 18 and table 4 the total consumption of antibacterials per class (ATC level 3 or 4 is presented).
Figure 18. Total antibacterial use per class of antibacterials from 2011 to 2019.
In 2019, the most used group of antibacterials remained the penicillins (68,6 tons; 38,9%). The tetracyclines (37,1 tons; 21,0%)
are the second most used group followed by the sulphonamides and trimethoprim (33,8 tons; 19,1%).
2019 is the seventh year in row where penicillins are the most used compound. In table 4, the evolution of the used products
per antimicrobial class in mg/kg biomass in the last 5 years is presented.
0
50.000
100.000
150.000
200.000
250.000
300.000
2011 2012 2013 2014 2015 2016 2017 2018 2019
Ton
Pre
mix
es
and
an
tib
acte
rial
p
har
mac
eu
tica
ls
Total consumption of antibacterials per class
amphenicols
polymixines
cephalosporines
sulfonamides
tetracyclines
aminoglycosides
penicillines
macrolides
quinolones
other
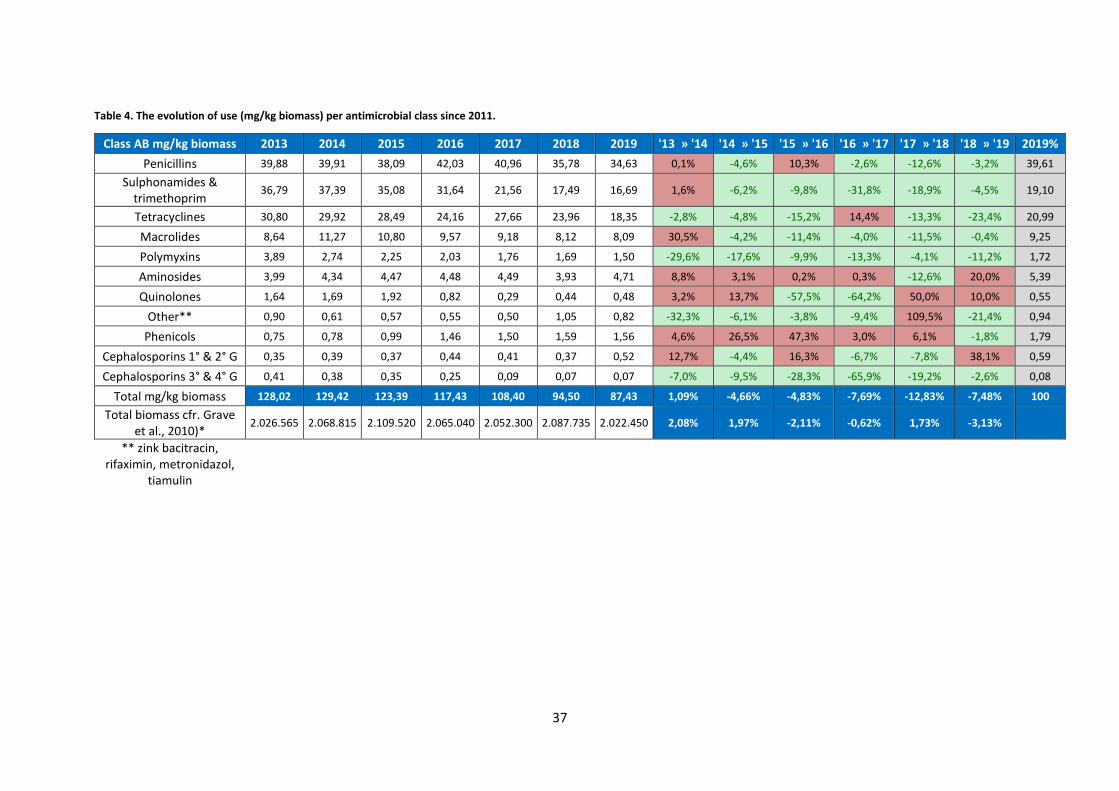
37
Table 4. The evolution of use (mg/kg biomass) per antimicrobial class since 2011.
Class AB mg/kg biomass 2013 2014 2015 2016 2017 2018 2019 '13 » '14 '14 » '15 '15 » '16 '16 » '17 '17 » '18 '18 » '19 2019%
Penicillins 39,88 39,91 38,09 42,03 40,96 35,78 34,63 0,1% -4,6% 10,3% -2,6% -12,6% -3,2% 39,61
Sulphonamides & trimethoprim
36,79 37,39 35,08 31,64 21,56 17,49 16,69 1,6% -6,2% -9,8% -31,8% -18,9% -4,5% 19,10
Tetracyclines 30,80 29,92 28,49 24,16 27,66 23,96 18,35 -2,8% -4,8% -15,2% 14,4% -13,3% -23,4% 20,99
Macrolides 8,64 11,27 10,80 9,57 9,18 8,12 8,09 30,5% -4,2% -11,4% -4,0% -11,5% -0,4% 9,25
Polymyxins 3,89 2,74 2,25 2,03 1,76 1,69 1,50 -29,6% -17,6% -9,9% -13,3% -4,1% -11,2% 1,72
Aminosides 3,99 4,34 4,47 4,48 4,49 3,93 4,71 8,8% 3,1% 0,2% 0,3% -12,6% 20,0% 5,39
Quinolones 1,64 1,69 1,92 0,82 0,29 0,44 0,48 3,2% 13,7% -57,5% -64,2% 50,0% 10,0% 0,55
Other** 0,90 0,61 0,57 0,55 0,50 1,05 0,82 -32,3% -6,1% -3,8% -9,4% 109,5% -21,4% 0,94
Phenicols 0,75 0,78 0,99 1,46 1,50 1,59 1,56 4,6% 26,5% 47,3% 3,0% 6,1% -1,8% 1,79
Cephalosporins 1° & 2° G 0,35 0,39 0,37 0,44 0,41 0,37 0,52 12,7% -4,4% 16,3% -6,7% -7,8% 38,1% 0,59
Cephalosporins 3° & 4° G 0,41 0,38 0,35 0,25 0,09 0,07 0,07 -7,0% -9,5% -28,3% -65,9% -19,2% -2,6% 0,08
Total mg/kg biomass 128,02 129,42 123,39 117,43 108,40 94,50 87,43 1,09% -4,66% -4,83% -7,69% -12,83% -7,48% 100
Total biomass cfr. Grave et al., 2010)*
2.026.565 2.068.815 2.109.520 2.065.040 2.052.300 2.087.735 2.022.450 2,08% 1,97% -2,11% -0,62% 1,73% -3,13%
** zink bacitracin, rifaximin, metronidazol,
tiamulin
38
In 2019, the use of the three main compounds (penicillins, sulphonamides and tetracyclines) all continued to decrease.
Especially the reduction of tetracycline use in 2019 is remarkable. Only in three antimicrobial classes an increase was seen
this year. First of all an increase of 20,0% in use of aminosides. This is in contrast to 2018 where a decrease in use of this
molecule of almost 13% was observed. Also the use of cephalosporines of the 1° and 2° generation grew substantially
(+38,1%). This is entirely due to an increase in the use of cefalexine registered for use in dogs and cats and in intramammary
products for cattle. And finally the use of quinolones increased for the second year in a row (+10%). The latter is worrisome
as the quinolones are categorized as “red” antimicrobials. The use of these molecules decreased very substantially in 2016
and 2017, however it increased again in 2018 and continued at this level in 2019. The increase in 2018 was entirely due to an
increase in the use of flumequine which is mainly applied in poultry. The use of flumequine stayed more or less at the same
level in 2019, the further increase in 2019 is largely due to an increase in use of enrofloxacin. The cephalosporines of the 3rd
and 4th generation (the second group of “red” molecules), continue to decrease in use again driven by a continued substantial
decrease in use of ceftiofur (table 5).
The decreased use of polymyxins (almost entirely colistin sulphate) is observed for the seventh year in a row with a decrease
of -11,2% in 2019. This is a positive trend given the simultaneous decrease in use of ZnO as an alternative for colistin in the
treatment of post-weaning diarrhoea in piglets, meaning that alternative treatments without use of antibiotics or ZnO may
have been used more frequently. When comparing to 2012 (before authorization of ZnO products), polymyxin use has
dropped with 66,4%.
AMCRA (centre of expertise on AntiMicrobial Consumption and Resistance in Animals)15 published its first guidelines on
responsible antibacterial consumption in 2013 and made them online available since 2016. In these guidelines, the different
antibacterial classes available in veterinary medicine are given a colour to differentiate them in terms of importance for
human and animal health. The ranking of importance is based on the WHO list on antibacterial with importance for human
health16 and the lists produced by the World Animal Health Organization (OIE) indicating the importance of antibacterials for
veterinary health17. When producing these lists, priority was given to human health.
The group of yellow products contains the antibacterial classes with the lowest importance for human medicine in terms of
resistance selection and transfer and therefore no additional restrictions, on top of the legal requirements, are suggested for
the use of these compounds. The yellow group contains the majority of the penicillins, the sulphonamides (and
diaminopyrimidines), the cephalosporins of the first generation and the phenicols.
The group of orange products are of higher importance for human medicine and should therefore be used restrictively and
only after good diagnostics allowing to target the therapy. The orange group contains the highest amount of different
molecules including all available macrolides, the polymyxins, the aminoglycosides, the tetracyclines and the aminopenicillins.
The red group of products are the products of the highest importance for human medicine and therefore their use should be
avoided in veterinary medicine as much as possible. AMCRA advises to use these molecules only under very strict regulations.
This group contains the cephalosporins of the 3rd and 4th generation and the quinolones.
In figure 19, the evolution of use of the different colour groups of antibacterials over the last 4 years is presented. From this
figure it can be seen that the orange group remains the most widely used group whereas the red molecules are only limitedly
used when expressed in mg active substance per kg biomass. Yet the red molecules are generally more modern molecules
with a high potency and therefore a low molecular weight in relation to their treatment potential. In 2019, a substantial
decrease in the yellow (-7 %) and orange (-8%) groups is observed, whereas the red group shows an increase of +8%. The
latter increase is entirely due to the increased use in the quinolone group as was discussed already before. In comparison to
2011 (reference year) the reduction of red molecules is still -77,3% which remains below the aim of minus 75% by 2020.
15 www.amcra.be 16 http://apps.who.int/iris/bitstream/10665/77376/1/9789241504485_eng.pdf 17 http://web.oie.int/downld/Antibacterials/OIE_list_Antibacterials.pdf
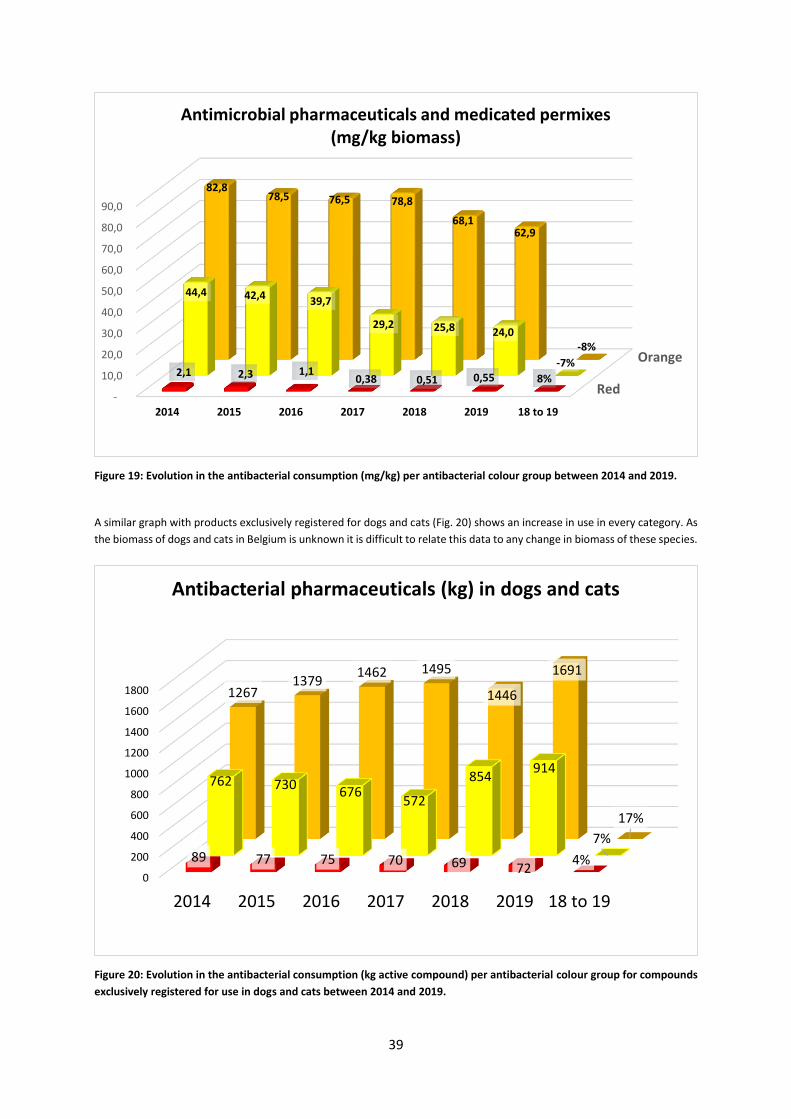
39
Figure 19: Evolution in the antibacterial consumption (mg/kg) per antibacterial colour group between 2014 and 2019.
A similar graph with products exclusively registered for dogs and cats (Fig. 20) shows an increase in use in every category. As
the biomass of dogs and cats in Belgium is unknown it is difficult to relate this data to any change in biomass of these species.
Figure 20: Evolution in the antibacterial consumption (kg active compound) per antibacterial colour group for compounds
exclusively registered for use in dogs and cats between 2014 and 2019.
Red
Orange
-
10,0
20,0
30,0
40,0
50,0
60,0
70,0
80,0
90,0
2014 2015 2016 2017 2018 2019 18 to 19
2,1 2,3 1,1 0,38 0,51 0,55 8%
44,4 42,4 39,7
29,2 25,8 24,0
-7%
82,8 78,5 76,5 78,8
68,1 62,9
-8%
Antimicrobial pharmaceuticals and medicated permixes (mg/kg biomass)
0
200
400
600
800
1000
1200
1400
1600
1800
2014 2015 2016 2017 2018 2019 18 to 19
89 77 75 70 69 724%
762 730676
572
854914
7%
12671379
1462 1495
1446
1691
17%
Antibacterial pharmaceuticals (kg) in dogs and cats
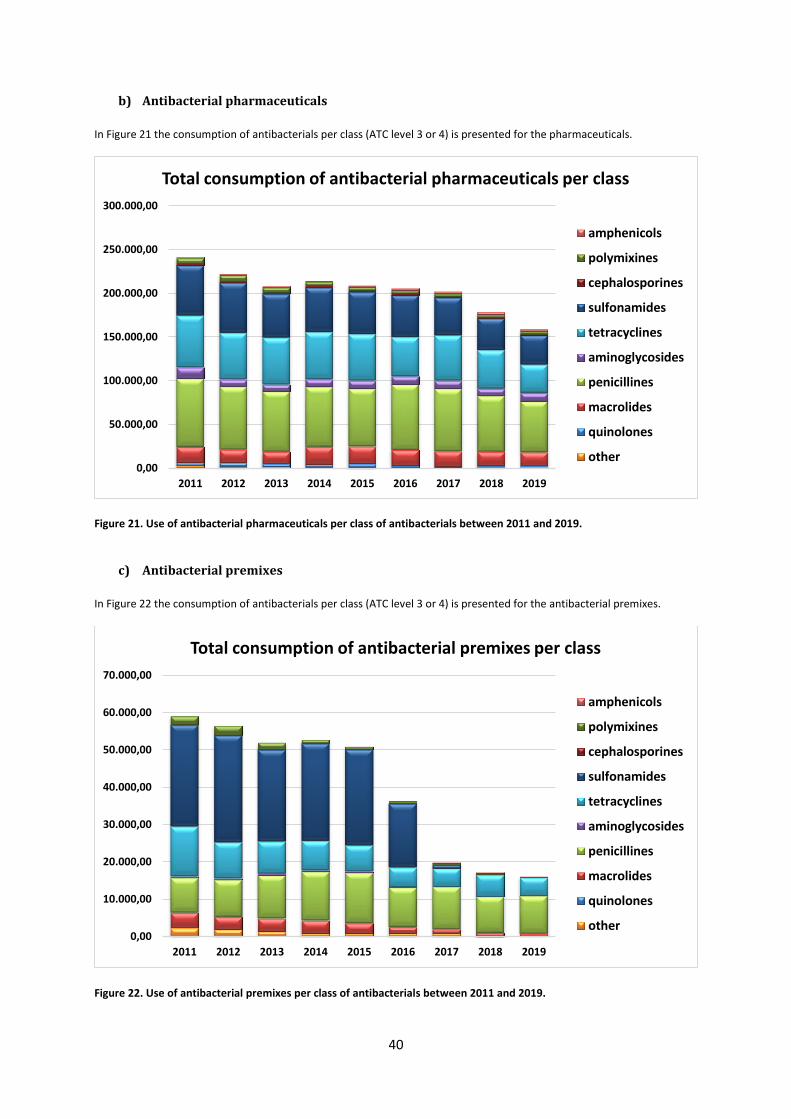
40
b) Antibacterial pharmaceuticals
In Figure 21 the consumption of antibacterials per class (ATC level 3 or 4) is presented for the pharmaceuticals.
Figure 21. Use of antibacterial pharmaceuticals per class of antibacterials between 2011 and 2019.
c) Antibacterial premixes
In Figure 22 the consumption of antibacterials per class (ATC level 3 or 4) is presented for the antibacterial premixes.
Figure 22. Use of antibacterial premixes per class of antibacterials between 2011 and 2019.
0,00
50.000,00
100.000,00
150.000,00
200.000,00
250.000,00
300.000,00
2011 2012 2013 2014 2015 2016 2017 2018 2019
Total consumption of antibacterial pharmaceuticals per class
amphenicols
polymixines
cephalosporines
sulfonamides
tetracyclines
aminoglycosides
penicillines
macrolides
quinolones
other
0,00
10.000,00
20.000,00
30.000,00
40.000,00
50.000,00
60.000,00
70.000,00
2011 2012 2013 2014 2015 2016 2017 2018 2019
Total consumption of antibacterial premixes per class
amphenicols
polymixines
cephalosporines
sulfonamides
tetracyclines
aminoglycosides
penicillines
macrolides
quinolones
other
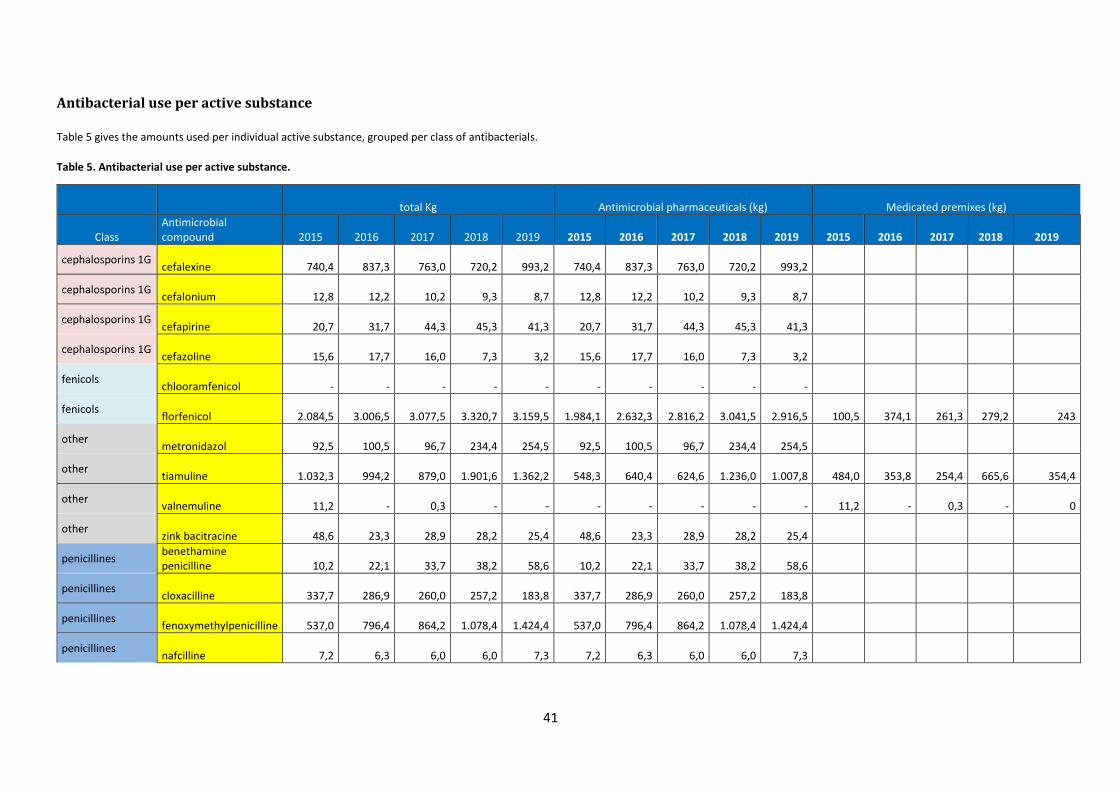
41
Antibacterial use per active substance
Table 5 gives the amounts used per individual active substance, grouped per class of antibacterials.
Table 5. Antibacterial use per active substance.
total Kg Antimicrobial pharmaceuticals (kg)
Medicated premixes (kg)
Class Antimicrobial compound 2015 2016 2017 2018 2019 2015 2016 2017 2018 2019 2015 2016 2017 2018 2019
cephalosporins 1G cefalexine
740,4
837,3
763,0
720,2
993,2
740,4
837,3
763,0
720,2
993,2
cephalosporins 1G cefalonium
12,8
12,2
10,2
9,3
8,7
12,8
12,2
10,2
9,3
8,7
cephalosporins 1G cefapirine
20,7
31,7
44,3
45,3
41,3
20,7
31,7
44,3
45,3
41,3
cephalosporins 1G cefazoline
15,6
17,7
16,0
7,3
3,2
15,6
17,7
16,0
7,3
3,2
fenicols chlooramfenicol
-
-
-
-
-
-
-
-
-
-
fenicols florfenicol
2.084,5
3.006,5
3.077,5
3.320,7
3.159,5
1.984,1
2.632,3
2.816,2
3.041,5
2.916,5
100,5
374,1
261,3
279,2 243
other metronidazol
92,5
100,5
96,7
234,4
254,5
92,5
100,5
96,7
234,4
254,5
other tiamuline
1.032,3
994,2
879,0
1.901,6
1.362,2
548,3
640,4
624,6
1.236,0
1.007,8
484,0
353,8
254,4
665,6 354,4
other valnemuline
11,2
-
0,3
-
-
-
-
-
-
-
11,2
-
0,3
- 0
other zink bacitracine
48,6
23,3
28,9
28,2
25,4
48,6
23,3
28,9
28,2
25,4
penicillines benethamine penicilline
10,2
22,1
33,7
38,2
58,6
10,2
22,1
33,7
38,2
58,6
penicillines cloxacilline
337,7
286,9
260,0
257,2
183,8
337,7
286,9
260,0
257,2
183,8
penicillines fenoxymethylpenicilline
537,0
796,4
864,2
1.078,4
1.424,4
537,0
796,4
864,2
1.078,4
1.424,4
penicillines nafcilline
7,2
6,3
6,0
6,0
7,3
7,2
6,3
6,0
6,0
7,3
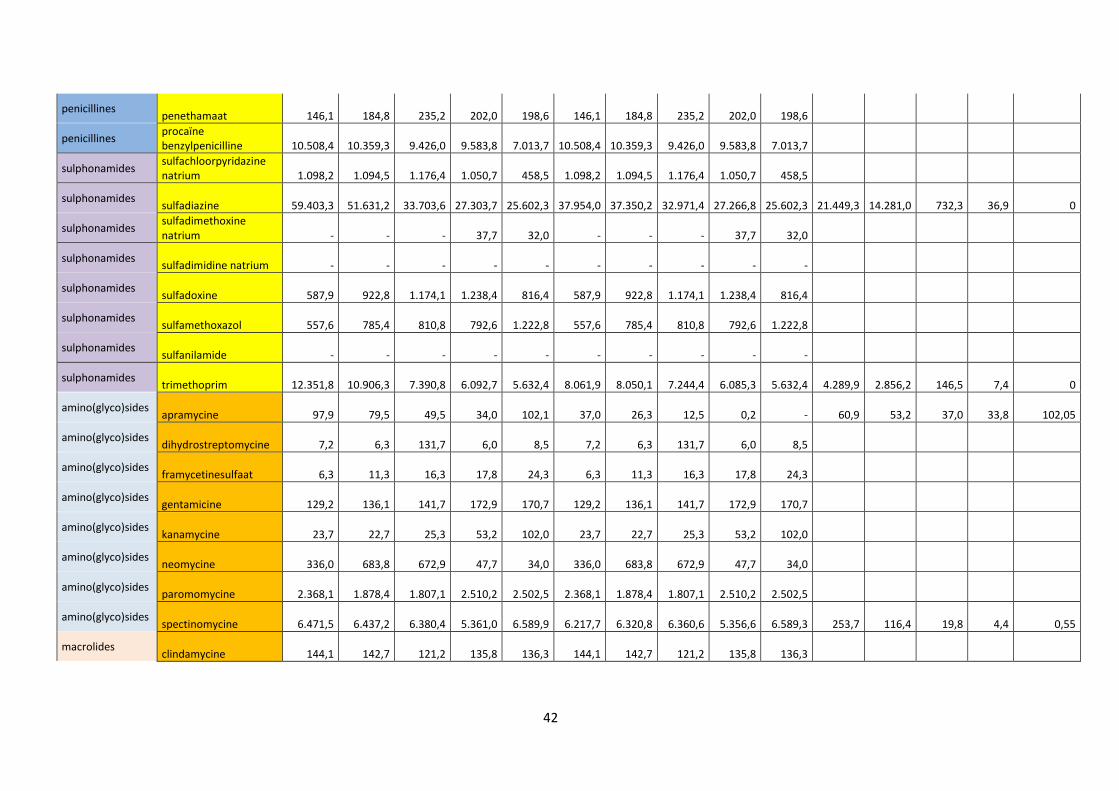
42
penicillines penethamaat
146,1
184,8
235,2
202,0
198,6
146,1
184,8
235,2
202,0
198,6
penicillines procaïne benzylpenicilline
10.508,4
10.359,3
9.426,0
9.583,8
7.013,7
10.508,4
10.359,3
9.426,0
9.583,8
7.013,7
sulphonamides sulfachloorpyridazine natrium
1.098,2
1.094,5
1.176,4
1.050,7
458,5
1.098,2
1.094,5
1.176,4
1.050,7
458,5
sulphonamides sulfadiazine
59.403,3
51.631,2
33.703,6
27.303,7
25.602,3
37.954,0
37.350,2
32.971,4
27.266,8
25.602,3
21.449,3
14.281,0
732,3
36,9 0
sulphonamides sulfadimethoxine natrium
-
-
-
37,7
32,0
-
-
-
37,7
32,0
sulphonamides sulfadimidine natrium
-
-
-
-
-
-
-
-
-
-
sulphonamides sulfadoxine
587,9
922,8
1.174,1
1.238,4
816,4
587,9
922,8
1.174,1
1.238,4
816,4
sulphonamides sulfamethoxazol
557,6
785,4
810,8
792,6
1.222,8
557,6
785,4
810,8
792,6
1.222,8
sulphonamides sulfanilamide
-
-
-
-
-
-
-
-
-
-
sulphonamides trimethoprim
12.351,8
10.906,3
7.390,8
6.092,7
5.632,4
8.061,9
8.050,1
7.244,4
6.085,3
5.632,4
4.289,9
2.856,2
146,5
7,4 0
amino(glyco)sides apramycine
97,9
79,5
49,5
34,0
102,1
37,0
26,3
12,5
0,2
-
60,9
53,2
37,0
33,8 102,05
amino(glyco)sides dihydrostreptomycine
7,2
6,3
131,7
6,0
8,5
7,2
6,3
131,7
6,0
8,5
amino(glyco)sides framycetinesulfaat
6,3
11,3
16,3
17,8
24,3
6,3
11,3
16,3
17,8
24,3
amino(glyco)sides gentamicine
129,2
136,1
141,7
172,9
170,7
129,2
136,1
141,7
172,9
170,7
amino(glyco)sides kanamycine
23,7
22,7
25,3
53,2
102,0
23,7
22,7
25,3
53,2
102,0
amino(glyco)sides neomycine
336,0
683,8
672,9
47,7
34,0
336,0
683,8
672,9
47,7
34,0
amino(glyco)sides paromomycine
2.368,1
1.878,4
1.807,1
2.510,2
2.502,5
2.368,1
1.878,4
1.807,1
2.510,2
2.502,5
amino(glyco)sides spectinomycine
6.471,5
6.437,2
6.380,4
5.361,0
6.589,9
6.217,7
6.320,8
6.360,6
5.356,6
6.589,3
253,7
116,4
19,8
4,4 0,55
macrolides clindamycine
144,1
142,7
121,2
135,8
136,3
144,1
142,7
121,2
135,8
136,3
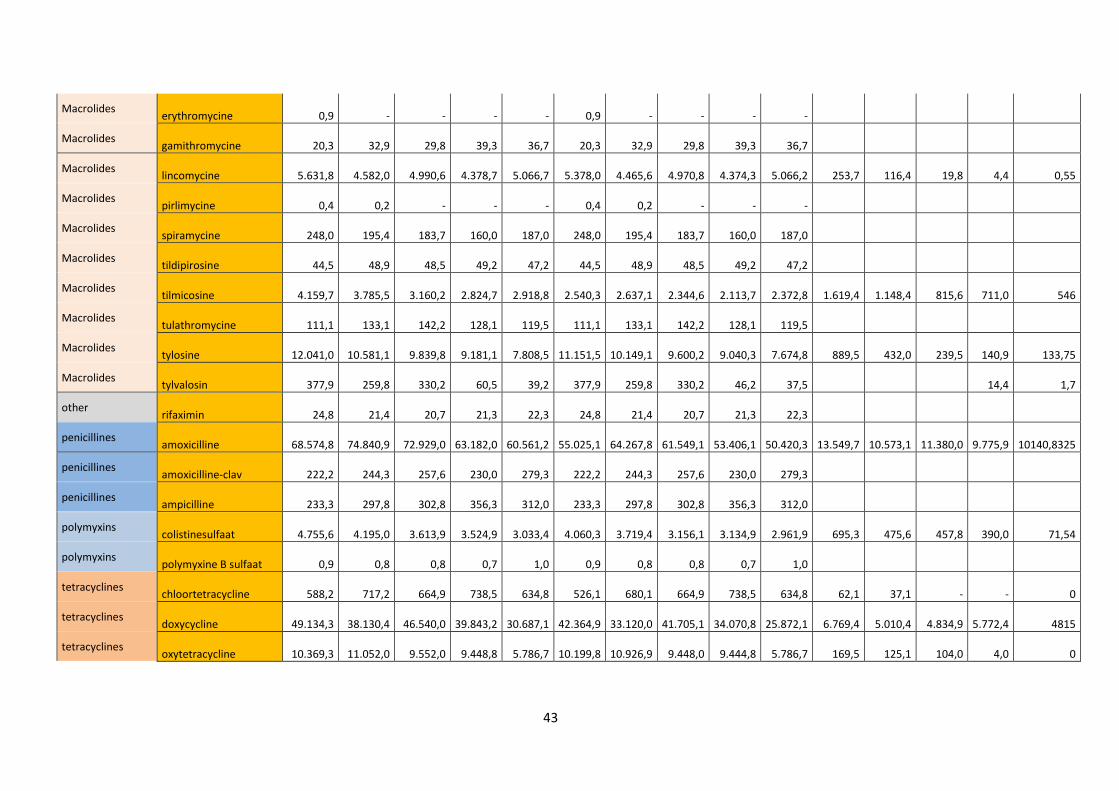
43
Macrolides erythromycine
0,9
-
-
-
-
0,9
-
-
-
-
Macrolides gamithromycine
20,3
32,9
29,8
39,3
36,7
20,3
32,9
29,8
39,3
36,7
Macrolides lincomycine
5.631,8
4.582,0
4.990,6
4.378,7
5.066,7
5.378,0
4.465,6
4.970,8
4.374,3
5.066,2
253,7
116,4
19,8
4,4 0,55
Macrolides pirlimycine
0,4
0,2
-
-
-
0,4
0,2
-
-
-
Macrolides spiramycine
248,0
195,4
183,7
160,0
187,0
248,0
195,4
183,7
160,0
187,0
Macrolides tildipirosine
44,5
48,9
48,5
49,2
47,2
44,5
48,9
48,5
49,2
47,2
Macrolides tilmicosine
4.159,7
3.785,5
3.160,2
2.824,7
2.918,8
2.540,3
2.637,1
2.344,6
2.113,7
2.372,8
1.619,4
1.148,4
815,6
711,0 546
Macrolides tulathromycine
111,1
133,1
142,2
128,1
119,5
111,1
133,1
142,2
128,1
119,5
Macrolides tylosine
12.041,0
10.581,1
9.839,8
9.181,1
7.808,5
11.151,5
10.149,1
9.600,2
9.040,3
7.674,8
889,5
432,0
239,5
140,9 133,75
Macrolides tylvalosin
377,9
259,8
330,2
60,5
39,2
377,9
259,8
330,2
46,2
37,5
14,4 1,7
other rifaximin
24,8
21,4
20,7
21,3
22,3
24,8
21,4
20,7
21,3
22,3
penicillines amoxicilline
68.574,8
74.840,9
72.929,0
63.182,0
60.561,2
55.025,1
64.267,8
61.549,1
53.406,1
50.420,3
13.549,7
10.573,1
11.380,0
9.775,9 10140,8325
penicillines amoxicilline-clav
222,2
244,3
257,6
230,0
279,3
222,2
244,3
257,6
230,0
279,3
penicillines ampicilline
233,3
297,8
302,8
356,3
312,0
233,3
297,8
302,8
356,3
312,0
polymyxins colistinesulfaat
4.755,6
4.195,0
3.613,9
3.524,9
3.033,4
4.060,3
3.719,4
3.156,1
3.134,9
2.961,9
695,3
475,6
457,8
390,0 71,54
polymyxins polymyxine B sulfaat
0,9
0,8
0,8
0,7
1,0
0,9
0,8
0,8
0,7
1,0
tetracyclines chloortetracycline
588,2
717,2
664,9
738,5
634,8
526,1
680,1
664,9
738,5
634,8
62,1
37,1
-
- 0
tetracyclines doxycycline
49.134,3
38.130,4
46.540,0
39.843,2
30.687,1
42.364,9
33.120,0
41.705,1
34.070,8
25.872,1
6.769,4
5.010,4
4.834,9
5.772,4 4815
tetracyclines oxytetracycline
10.369,3
11.052,0
9.552,0
9.448,8
5.786,7
10.199,8
10.926,9
9.448,0
9.444,8
5.786,7
169,5
125,1
104,0
4,0 0
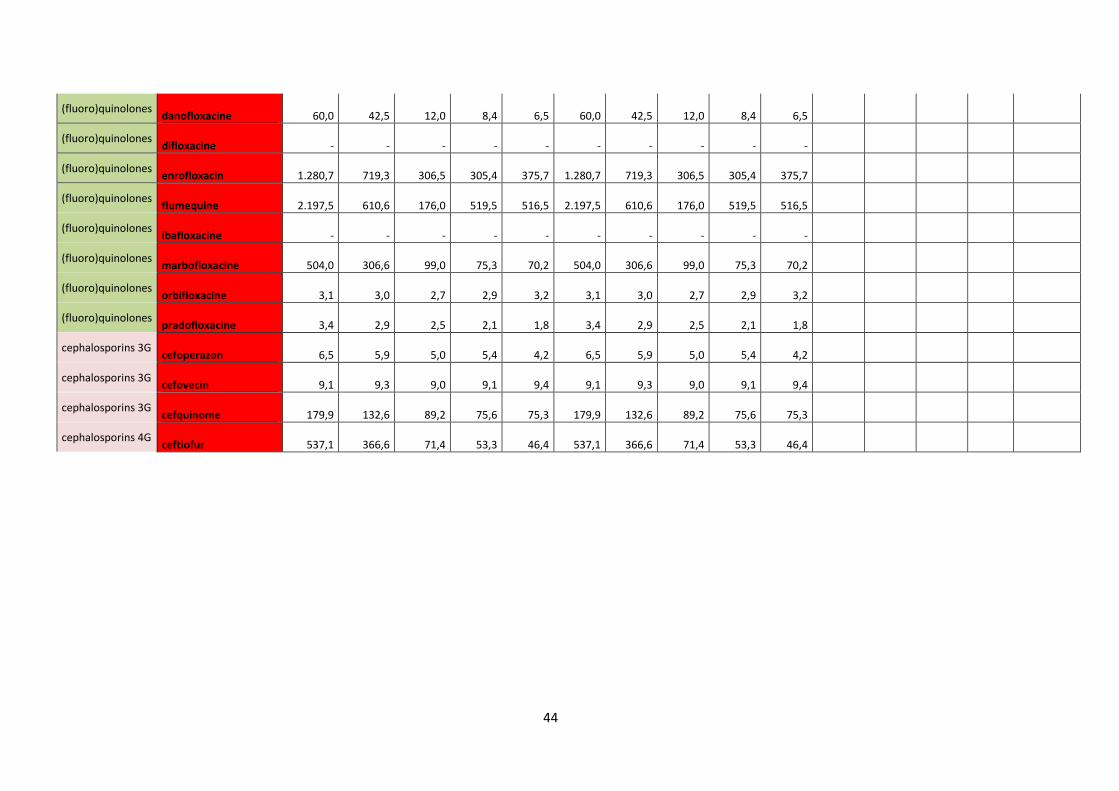
44
(fluoro)quinolones danofloxacine
60,0
42,5
12,0
8,4
6,5
60,0
42,5
12,0
8,4
6,5
(fluoro)quinolones difloxacine
-
-
-
-
-
-
-
-
-
-
(fluoro)quinolones enrofloxacin
1.280,7
719,3
306,5
305,4
375,7
1.280,7
719,3
306,5
305,4
375,7
(fluoro)quinolones flumequine
2.197,5
610,6
176,0
519,5
516,5
2.197,5
610,6
176,0
519,5
516,5
(fluoro)quinolones ibafloxacine
-
-
-
-
-
-
-
-
-
-
(fluoro)quinolones marbofloxacine
504,0
306,6
99,0
75,3
70,2
504,0
306,6
99,0
75,3
70,2
(fluoro)quinolones orbifloxacine
3,1
3,0
2,7
2,9
3,2
3,1
3,0
2,7
2,9
3,2
(fluoro)quinolones pradofloxacine
3,4
2,9
2,5
2,1
1,8
3,4
2,9
2,5
2,1
1,8
cephalosporins 3G cefoperazon
6,5
5,9
5,0
5,4
4,2
6,5
5,9
5,0
5,4
4,2
cephalosporins 3G cefovecin
9,1
9,3
9,0
9,1
9,4
9,1
9,3
9,0
9,1
9,4
cephalosporins 3G cefquinome
179,9
132,6
89,2
75,6
75,3
179,9
132,6
89,2
75,6
75,3
cephalosporins 4G ceftiofur
537,1
366,6
71,4
53,3
46,4
537,1
366,6
71,4
53,3
46,4
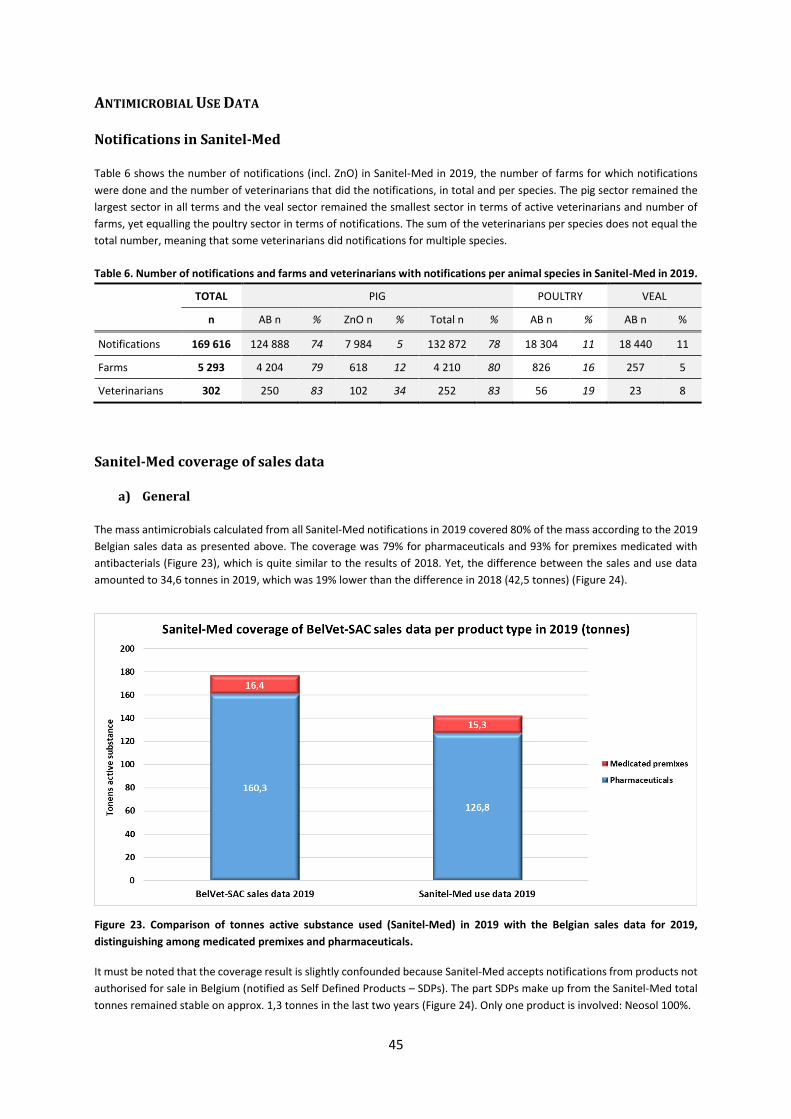
45
ANTIMICROBIAL USE DATA
Notifications in Sanitel-Med
Table 6 shows the number of notifications (incl. ZnO) in Sanitel-Med in 2019, the number of farms for which notifications
were done and the number of veterinarians that did the notifications, in total and per species. The pig sector remained the
largest sector in all terms and the veal sector remained the smallest sector in terms of active veterinarians and number of
farms, yet equalling the poultry sector in terms of notifications. The sum of the veterinarians per species does not equal the
total number, meaning that some veterinarians did notifications for multiple species.
Table 6. Number of notifications and farms and veterinarians with notifications per animal species in Sanitel-Med in 2019.
TOTAL PIG POULTRY VEAL
n AB n % ZnO n % Total n % AB n % AB n %
Notifications 169 616 124 888 74 7 984 5 132 872 78 18 304 11 18 440 11
Farms 5 293 4 204 79 618 12 4 210 80 826 16 257 5
Veterinarians 302 250 83 102 34 252 83 56 19 23 8
Sanitel-Med coverage of sales data
a) General
The mass antimicrobials calculated from all Sanitel-Med notifications in 2019 covered 80% of the mass according to the 2019
Belgian sales data as presented above. The coverage was 79% for pharmaceuticals and 93% for premixes medicated with
antibacterials (Figure 23), which is quite similar to the results of 2018. Yet, the difference between the sales and use data
amounted to 34,6 tonnes in 2019, which was 19% lower than the difference in 2018 (42,5 tonnes) (Figure 24).
Figure 23. Comparison of tonnes active substance used (Sanitel-Med) in 2019 with the Belgian sales data for 2019,
distinguishing among medicated premixes and pharmaceuticals.
It must be noted that the coverage result is slightly confounded because Sanitel-Med accepts notifications from products not
authorised for sale in Belgium (notified as Self Defined Products – SDPs). The part SDPs make up from the Sanitel-Med total
tonnes remained stable on approx. 1,3 tonnes in the last two years (Figure 24). Only one product is involved: Neosol 100%.
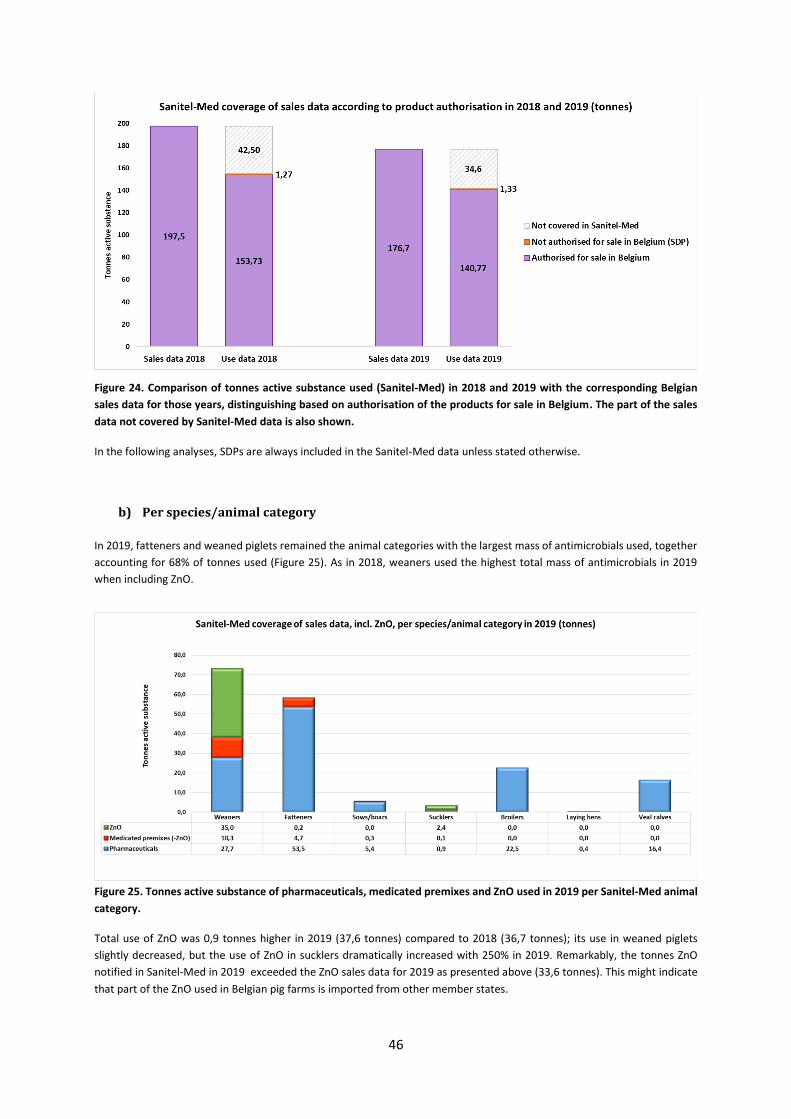
46
Figure 24. Comparison of tonnes active substance used (Sanitel-Med) in 2018 and 2019 with the corresponding Belgian
sales data for those years, distinguishing based on authorisation of the products for sale in Belgium. The part of the sales
data not covered by Sanitel-Med data is also shown.
In the following analyses, SDPs are always included in the Sanitel-Med data unless stated otherwise.
b) Per species/animal category
In 2019, fatteners and weaned piglets remained the animal categories with the largest mass of antimicrobials used, together
accounting for 68% of tonnes used (Figure 25). As in 2018, weaners used the highest total mass of antimicrobials in 2019
when including ZnO.
Figure 25. Tonnes active substance of pharmaceuticals, medicated premixes and ZnO used in 2019 per Sanitel-Med animal
category.
Total use of ZnO was 0,9 tonnes higher in 2019 (37,6 tonnes) compared to 2018 (36,7 tonnes); its use in weaned piglets
slightly decreased, but the use of ZnO in sucklers dramatically increased with 250% in 2019. Remarkably, the tonnes ZnO
notified in Sanitel-Med in 2019 exceeded the ZnO sales data for 2019 as presented above (33,6 tonnes). This might indicate
that part of the ZnO used in Belgian pig farms is imported from other member states.
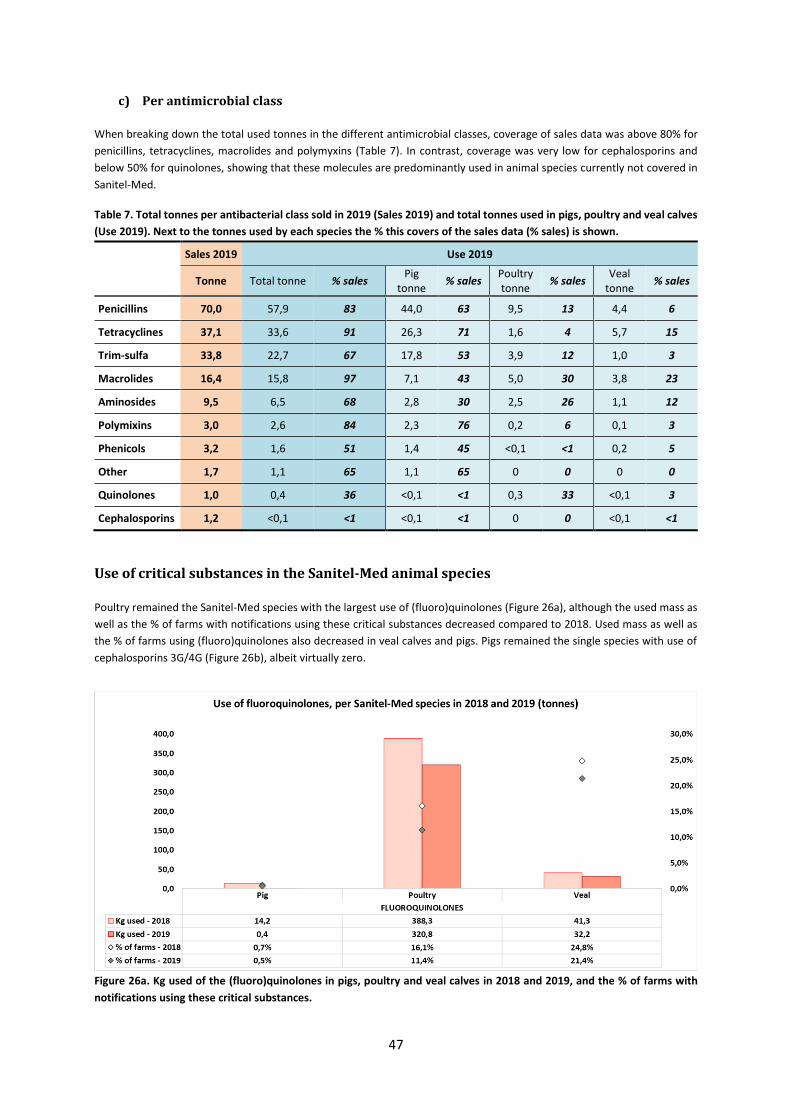
47
c) Per antimicrobial class
When breaking down the total used tonnes in the different antimicrobial classes, coverage of sales data was above 80% for
penicillins, tetracyclines, macrolides and polymyxins (Table 7). In contrast, coverage was very low for cephalosporins and
below 50% for quinolones, showing that these molecules are predominantly used in animal species currently not covered in
Sanitel-Med.
Table 7. Total tonnes per antibacterial class sold in 2019 (Sales 2019) and total tonnes used in pigs, poultry and veal calves
(Use 2019). Next to the tonnes used by each species the % this covers of the sales data (% sales) is shown.
Sales 2019 Use 2019
Tonne Total tonne % sales Pig
tonne % sales
Poultry tonne
% sales Veal
tonne % sales
Penicillins 70,0 57,9 83 44,0 63 9,5 13 4,4 6
Tetracyclines 37,1 33,6 91 26,3 71 1,6 4 5,7 15
Trim-sulfa 33,8 22,7 67 17,8 53 3,9 12 1,0 3
Macrolides 16,4 15,8 97 7,1 43 5,0 30 3,8 23
Aminosides 9,5 6,5 68 2,8 30 2,5 26 1,1 12
Polymixins 3,0 2,6 84 2,3 76 0,2 6 0,1 3
Phenicols 3,2 1,6 51 1,4 45 <0,1 <1 0,2 5
Other 1,7 1,1 65 1,1 65 0 0 0 0
Quinolones 1,0 0,4 36 <0,1 <1 0,3 33 <0,1 3
Cephalosporins 1,2 <0,1 <1 <0,1 <1 0 0 <0,1 <1
Use of critical substances in the Sanitel-Med animal species
Poultry remained the Sanitel-Med species with the largest use of (fluoro)quinolones (Figure 26a), although the used mass as
well as the % of farms with notifications using these critical substances decreased compared to 2018. Used mass as well as
the % of farms using (fluoro)quinolones also decreased in veal calves and pigs. Pigs remained the single species with use of
cephalosporins 3G/4G (Figure 26b), albeit virtually zero.
Figure 26a. Kg used of the (fluoro)quinolones in pigs, poultry and veal calves in 2018 and 2019, and the % of farms with
notifications using these critical substances.
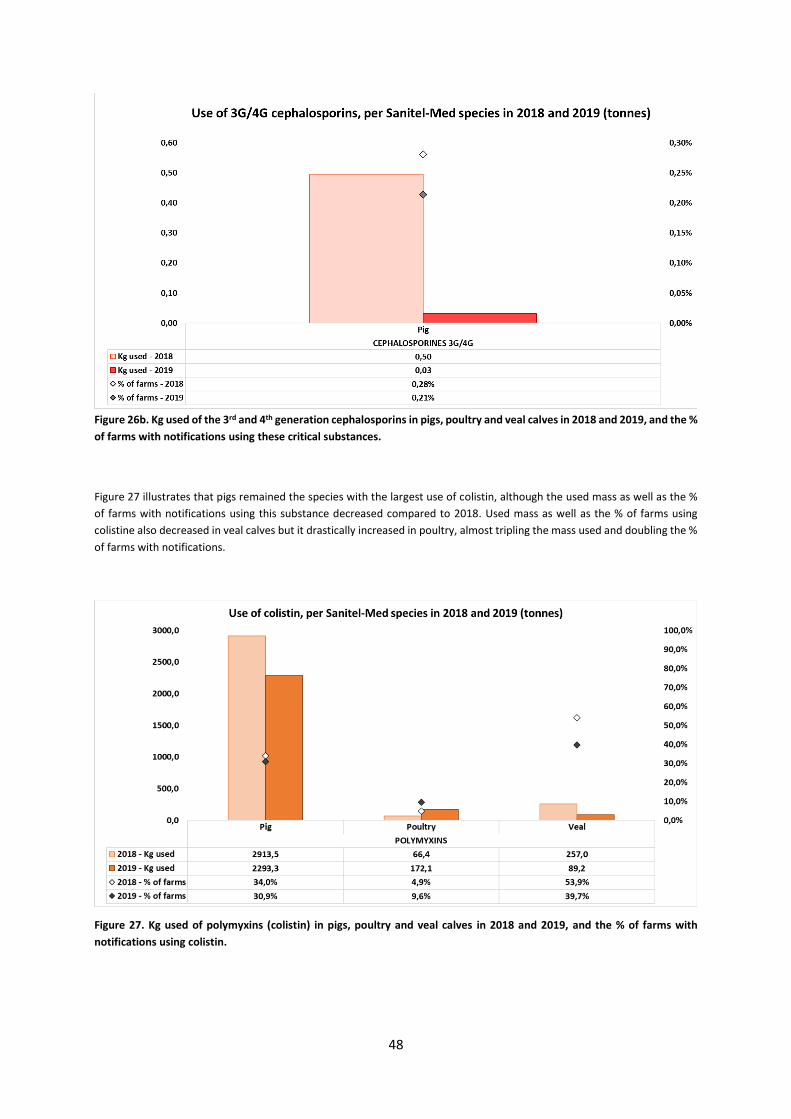
48
Figure 26b. Kg used of the 3rd and 4th generation cephalosporins in pigs, poultry and veal calves in 2018 and 2019, and the %
of farms with notifications using these critical substances.
Figure 27 illustrates that pigs remained the species with the largest use of colistin, although the used mass as well as the %
of farms with notifications using this substance decreased compared to 2018. Used mass as well as the % of farms using
colistine also decreased in veal calves but it drastically increased in poultry, almost tripling the mass used and doubling the %
of farms with notifications.
Figure 27. Kg used of polymyxins (colistin) in pigs, poultry and veal calves in 2018 and 2019, and the % of farms with
notifications using colistin.
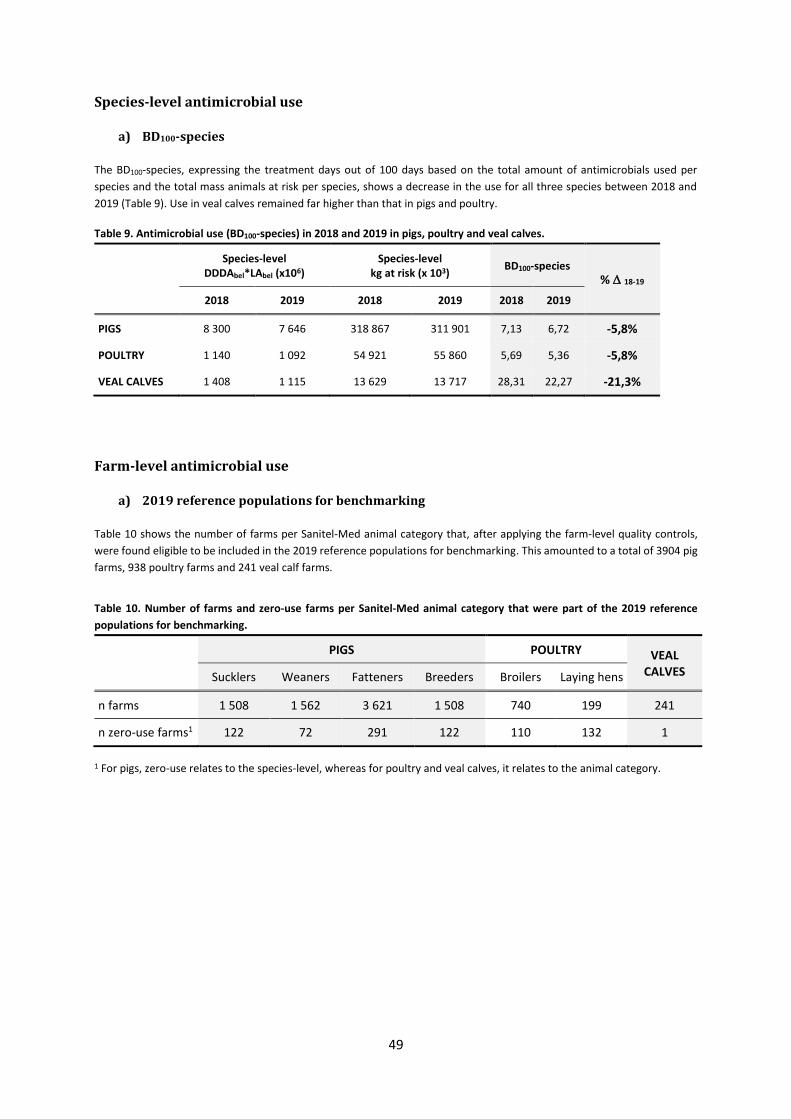
49
Species-level antimicrobial use
a) BD100-species
The BD100-species, expressing the treatment days out of 100 days based on the total amount of antimicrobials used per
species and the total mass animals at risk per species, shows a decrease in the use for all three species between 2018 and
2019 (Table 9). Use in veal calves remained far higher than that in pigs and poultry.
Table 9. Antimicrobial use (BD100-species) in 2018 and 2019 in pigs, poultry and veal calves.
Species-level
DDDAbel*LAbel (x106) Species-level
kg at risk (x 103) BD100-species
% 18-19
2018 2019 2018 2019 2018 2019
PIGS 8 300 7 646 318 867 311 901 7,13 6,72 -5,8%
POULTRY 1 140 1 092 54 921 55 860 5,69 5,36 -5,8%
VEAL CALVES 1 408 1 115 13 629 13 717 28,31 22,27 -21,3%
Farm-level antimicrobial use
a) 2019 reference populations for benchmarking
Table 10 shows the number of farms per Sanitel-Med animal category that, after applying the farm-level quality controls,
were found eligible to be included in the 2019 reference populations for benchmarking. This amounted to a total of 3904 pig
farms, 938 poultry farms and 241 veal calf farms.
Table 10. Number of farms and zero-use farms per Sanitel-Med animal category that were part of the 2019 reference
populations for benchmarking.
PIGS POULTRY VEAL
CALVES Sucklers Weaners Fatteners Breeders Broilers Laying hens
n farms 1 508 1 562 3 621 1 508 740 199 241
n zero-use farms1 122 72 291 122 110 132 1
1 For pigs, zero-use relates to the species-level, whereas for poultry and veal calves, it relates to the animal category.
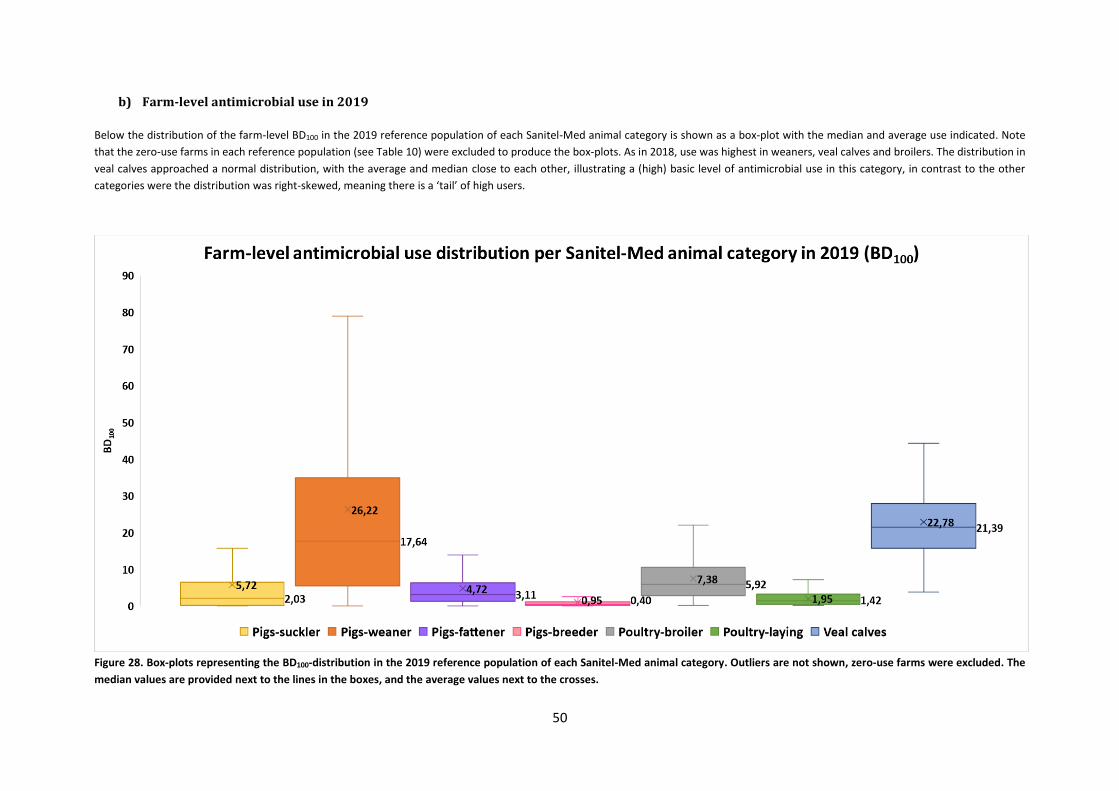
50
b) Farm-level antimicrobial use in 2019
Below the distribution of the farm-level BD100 in the 2019 reference population of each Sanitel-Med animal category is shown as a box-plot with the median and average use indicated. Note
that the zero-use farms in each reference population (see Table 10) were excluded to produce the box-plots. As in 2018, use was highest in weaners, veal calves and broilers. The distribution in
veal calves approached a normal distribution, with the average and median close to each other, illustrating a (high) basic level of antimicrobial use in this category, in contrast to the other
categories were the distribution was right-skewed, meaning there is a ‘tail’ of high users.
Figure 28. Box-plots representing the BD100-distribution in the 2019 reference population of each Sanitel-Med animal category. Outliers are not shown, zero-use farms were excluded. The
median values are provided next to the lines in the boxes, and the average values next to the crosses.

51
c) 2018-2019 core reference populations for benchmarking
Table 11 shows the number of farms per Sanitel-Med animal category that were part of the reference populations for
benchmarking in 2018 as well as 2019, hence forming the 2018-2019 core reference populations for benchmarking. This
amounted to a total of 3590 pig farms, 869 poultry farms and 241 veal calf farms.
Table 11. Number of farms and zero-use farms per Sanitel-Med animal category that were part of the 2018-2019 core
reference populations for benchmarking.
PIGS POULTRY VEAL
CALVES Sucklers Weaners Fatteners Breeders Broilers Laying hens
n farms 1 481 1 405 3 350 1 481 689 181 241
n zero-use farms1 121 78 351 121 110 143 2
1 Zero-use farms in either 2018, 2019 or both. For pigs, this relates to the species-level, whereas for poultry and veal, it relates
to the animal category.
d) Evolution of farm-level antimicrobial use from 2018 to 2019
i. Summary
The evolution of the median farm-level BD100 in the 2018-2019 core reference populations shows that use decreased in most
Sanitel-Med animal categories between 2018 to 2019, with highest reductions in sucklers and veal calves. Use slightly
increased in breeders and strongly increased in laying hens. However, use in the latter category is generally very low, with
almost 80% of zero-use farms (Table 11) which were excluded for the analysis shown in Figure 29. Note that the BD100 values
for 2019 slightly differ from those shown in Figure 28, which is explained by the slightly different composition of the 2018-
2019 core reference populations, comprising two years, and the 2019 reference populations, looking only at 2019.
Figure 29. Evolution of the median of the BD100-distribution in the 2018-2019 core reference population of each Sanitel-
Med animal category. Zero-use farms were excluded for the analysis.
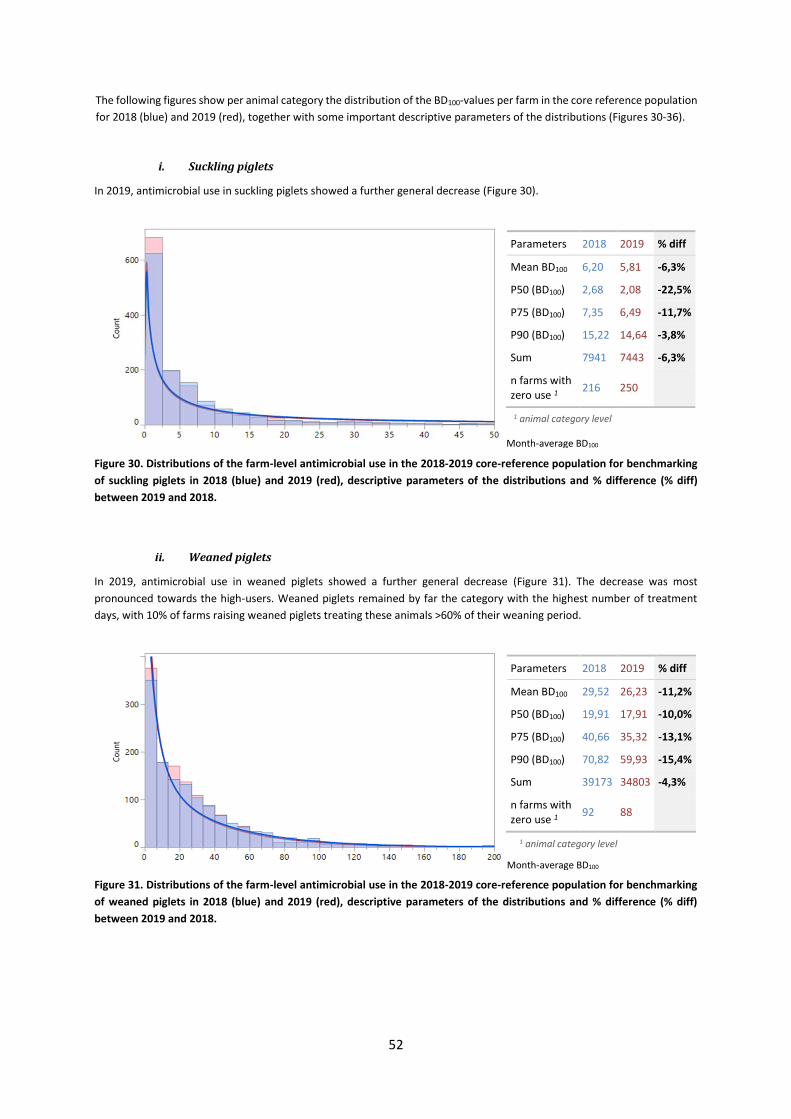
52
The following figures show per animal category the distribution of the BD100-values per farm in the core reference population
for 2018 (blue) and 2019 (red), together with some important descriptive parameters of the distributions (Figures 30-36).
i. Suckling piglets
In 2019, antimicrobial use in suckling piglets showed a further general decrease (Figure 30).
Figure 30. Distributions of the farm-level antimicrobial use in the 2018-2019 core-reference population for benchmarking
of suckling piglets in 2018 (blue) and 2019 (red), descriptive parameters of the distributions and % difference (% diff)
between 2019 and 2018.
ii. Weaned piglets
In 2019, antimicrobial use in weaned piglets showed a further general decrease (Figure 31). The decrease was most
pronounced towards the high-users. Weaned piglets remained by far the category with the highest number of treatment
days, with 10% of farms raising weaned piglets treating these animals >60% of their weaning period.
Figure 31. Distributions of the farm-level antimicrobial use in the 2018-2019 core-reference population for benchmarking
of weaned piglets in 2018 (blue) and 2019 (red), descriptive parameters of the distributions and % difference (% diff)
between 2019 and 2018.
Parameters 2018 2019 % diff
Mean BD100 6,20 5,81 -6,3%
P50 (BD100) 2,68 2,08 -22,5%
P75 (BD100) 7,35 6,49 -11,7%
P90 (BD100) 15,22 14,64 -3,8%
Sum 7941 7443 -6,3%
n farms with zero use 1 216 250
Month-average BD100
Parameters 2018 2019 % diff
Mean BD100 29,52 26,23 -11,2%
P50 (BD100) 19,91 17,91 -10,0%
P75 (BD100) 40,66 35,32 -13,1%
P90 (BD100) 70,82 59,93 -15,4%
Sum 39173 34803 -4,3%
n farms with zero use 1 92 88
Month-average BD100
1 animal category level
1 animal category level
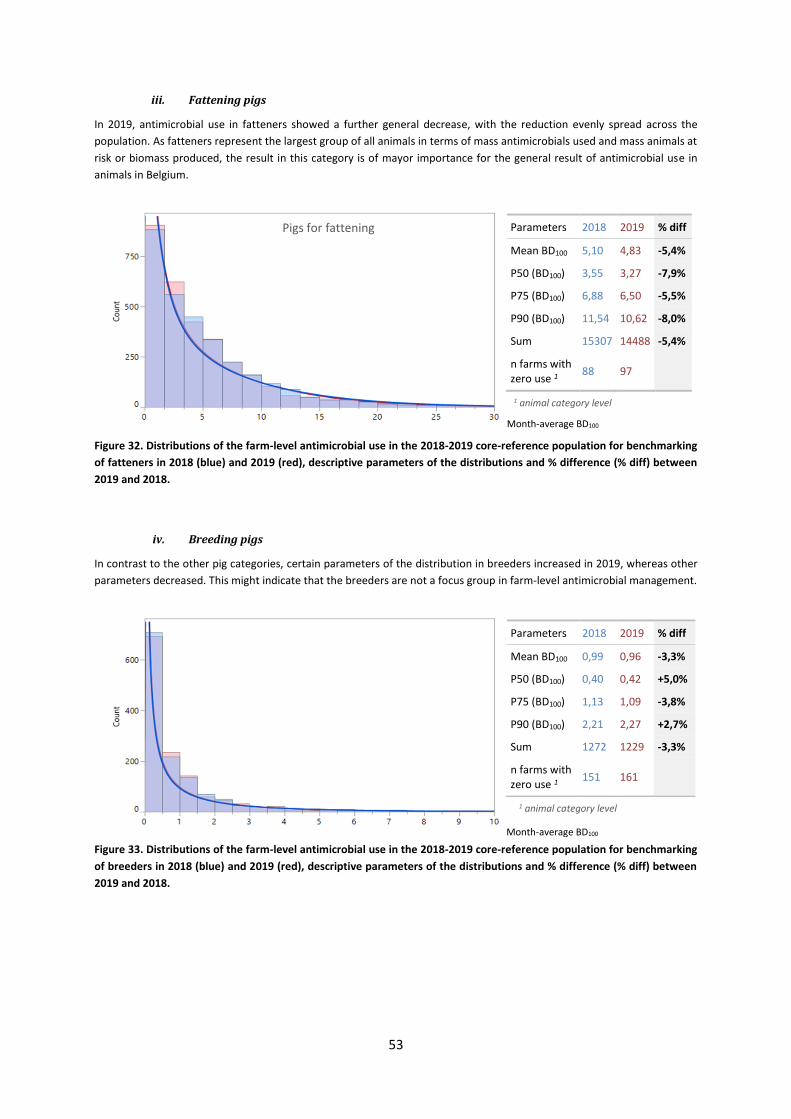
53
iii. Fattening pigs
In 2019, antimicrobial use in fatteners showed a further general decrease, with the reduction evenly spread across the
population. As fatteners represent the largest group of all animals in terms of mass antimicrobials used and mass animals at
risk or biomass produced, the result in this category is of mayor importance for the general result of antimicrobial use in
animals in Belgium.
Figure 32. Distributions of the farm-level antimicrobial use in the 2018-2019 core-reference population for benchmarking
of fatteners in 2018 (blue) and 2019 (red), descriptive parameters of the distributions and % difference (% diff) between
2019 and 2018.
iv. Breeding pigs
In contrast to the other pig categories, certain parameters of the distribution in breeders increased in 2019, whereas other
parameters decreased. This might indicate that the breeders are not a focus group in farm-level antimicrobial management.
Figure 33. Distributions of the farm-level antimicrobial use in the 2018-2019 core-reference population for benchmarking
of breeders in 2018 (blue) and 2019 (red), descriptive parameters of the distributions and % difference (% diff) between
2019 and 2018.
Parameters 2018 2019 % diff
Mean BD100 5,10 4,83 -5,4%
P50 (BD100) 3,55 3,27 -7,9%
P75 (BD100) 6,88 6,50 -5,5%
P90 (BD100) 11,54 10,62 -8,0%
Sum 15307 14488 -5,4%
n farms with zero use 1 88 97
Month-average BD100
Pigs for fattening
Parameters 2018 2019 % diff
Mean BD100 0,99 0,96 -3,3%
P50 (BD100) 0,40 0,42 +5,0%
P75 (BD100) 1,13 1,09 -3,8%
P90 (BD100) 2,21 2,27 +2,7%
Sum 1272 1229 -3,3%
n farms with zero use 1 151 161
Month-average BD100
1 animal category level
1 animal category level
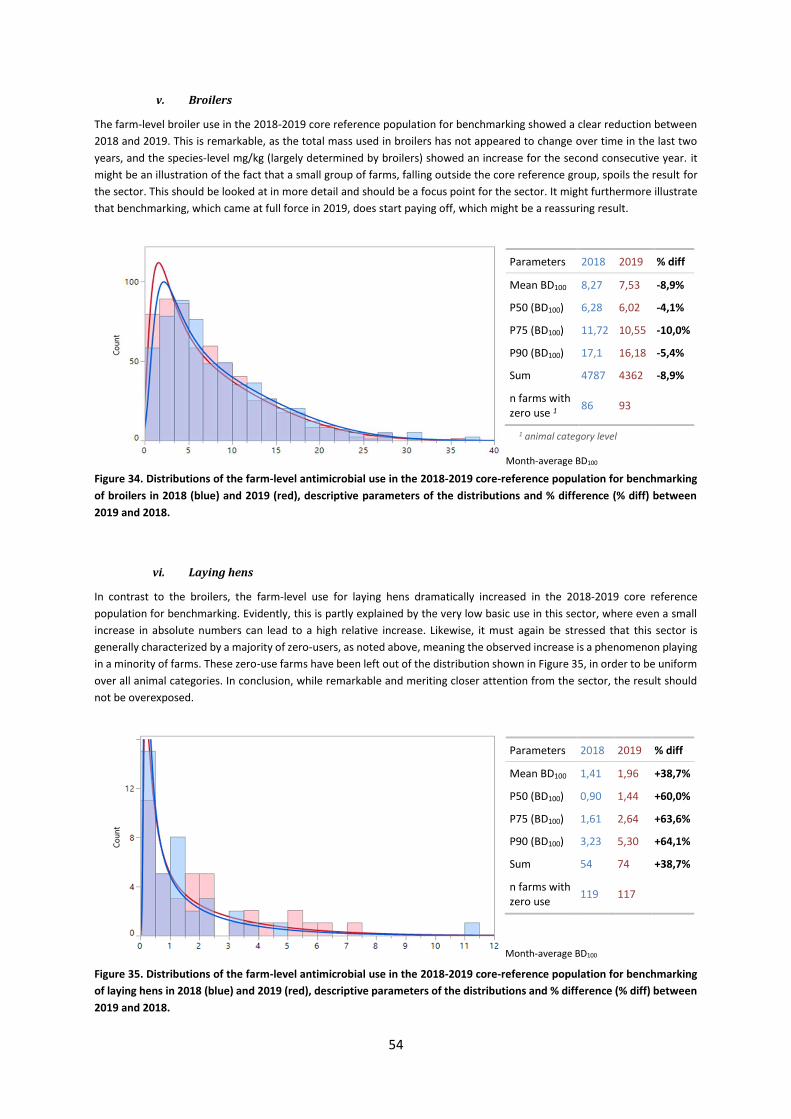
54
v. Broilers
The farm-level broiler use in the 2018-2019 core reference population for benchmarking showed a clear reduction between
2018 and 2019. This is remarkable, as the total mass used in broilers has not appeared to change over time in the last two
years, and the species-level mg/kg (largely determined by broilers) showed an increase for the second consecutive year. it
might be an illustration of the fact that a small group of farms, falling outside the core reference group, spoils the result for
the sector. This should be looked at in more detail and should be a focus point for the sector. It might furthermore illustrate
that benchmarking, which came at full force in 2019, does start paying off, which might be a reassuring result.
Figure 34. Distributions of the farm-level antimicrobial use in the 2018-2019 core-reference population for benchmarking
of broilers in 2018 (blue) and 2019 (red), descriptive parameters of the distributions and % difference (% diff) between
2019 and 2018.
vi. Laying hens
In contrast to the broilers, the farm-level use for laying hens dramatically increased in the 2018-2019 core reference
population for benchmarking. Evidently, this is partly explained by the very low basic use in this sector, where even a small
increase in absolute numbers can lead to a high relative increase. Likewise, it must again be stressed that this sector is
generally characterized by a majority of zero-users, as noted above, meaning the observed increase is a phenomenon playing
in a minority of farms. These zero-use farms have been left out of the distribution shown in Figure 35, in order to be uniform
over all animal categories. In conclusion, while remarkable and meriting closer attention from the sector, the result should
not be overexposed.
Figure 35. Distributions of the farm-level antimicrobial use in the 2018-2019 core-reference population for benchmarking
of laying hens in 2018 (blue) and 2019 (red), descriptive parameters of the distributions and % difference (% diff) between
2019 and 2018.
Parameters 2018 2019 % diff
Mean BD100 8,27 7,53 -8,9%
P50 (BD100) 6,28 6,02 -4,1%
P75 (BD100) 11,72 10,55 -10,0%
P90 (BD100) 17,1 16,18 -5,4%
Sum 4787 4362 -8,9%
n farms with zero use 1 86 93
Parameters 2018 2019 % diff
Mean BD100 1,41 1,96 +38,7%
P50 (BD100) 0,90 1,44 +60,0%
P75 (BD100) 1,61 2,64 +63,6%
P90 (BD100) 3,23 5,30 +64,1%
Sum 54 74 +38,7%
n farms with zero use
119 117
Month-average BD100
Month-average BD100
1 animal category level
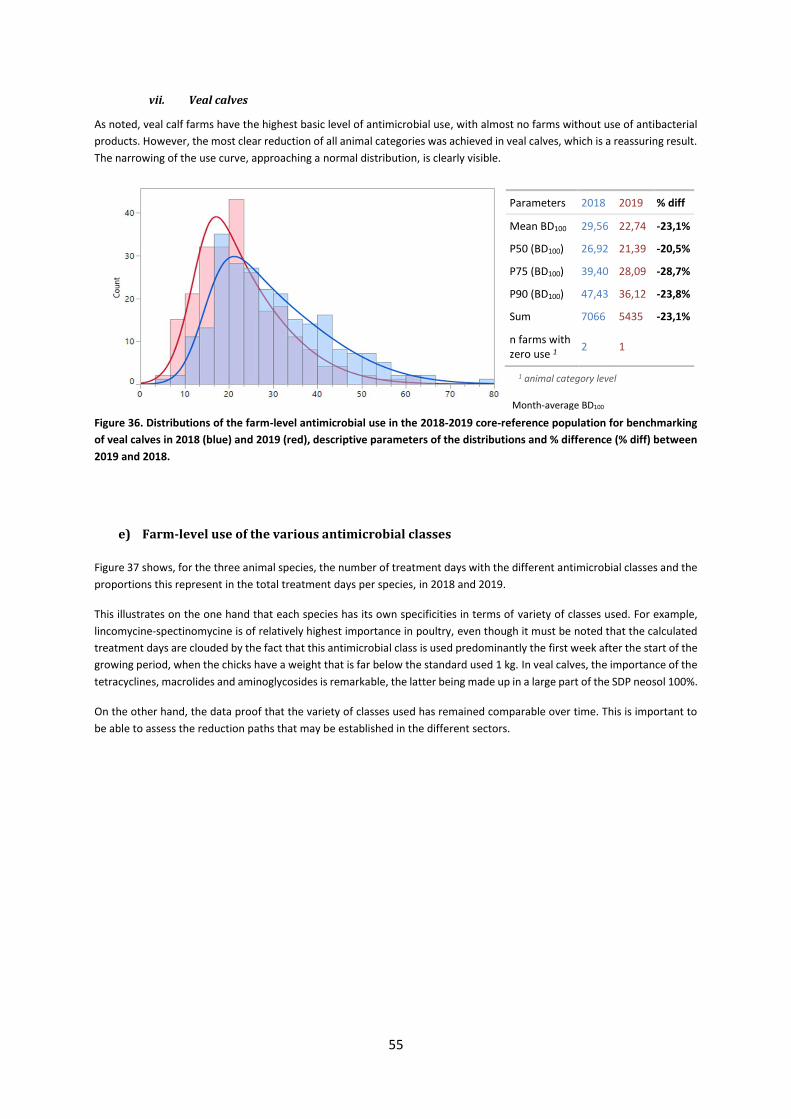
55
vii. Veal calves
As noted, veal calf farms have the highest basic level of antimicrobial use, with almost no farms without use of antibacterial
products. However, the most clear reduction of all animal categories was achieved in veal calves, which is a reassuring result.
The narrowing of the use curve, approaching a normal distribution, is clearly visible.
Figure 36. Distributions of the farm-level antimicrobial use in the 2018-2019 core-reference population for benchmarking
of veal calves in 2018 (blue) and 2019 (red), descriptive parameters of the distributions and % difference (% diff) between
2019 and 2018.
e) Farm-level use of the various antimicrobial classes
Figure 37 shows, for the three animal species, the number of treatment days with the different antimicrobial classes and the
proportions this represent in the total treatment days per species, in 2018 and 2019.
This illustrates on the one hand that each species has its own specificities in terms of variety of classes used. For example,
lincomycine-spectinomycine is of relatively highest importance in poultry, even though it must be noted that the calculated
treatment days are clouded by the fact that this antimicrobial class is used predominantly the first week after the start of the
growing period, when the chicks have a weight that is far below the standard used 1 kg. In veal calves, the importance of the
tetracyclines, macrolides and aminoglycosides is remarkable, the latter being made up in a large part of the SDP neosol 100%.
On the other hand, the data proof that the variety of classes used has remained comparable over time. This is important to
be able to assess the reduction paths that may be established in the different sectors.
Parameters 2018 2019 % diff
Mean BD100 29,56 22,74 -23,1%
P50 (BD100) 26,92 21,39 -20,5%
P75 (BD100) 39,40 28,09 -28,7%
P90 (BD100) 47,43 36,12 -23,8%
Sum 7066 5435 -23,1%
n farms with zero use 1 2 1
Month-average BD100
1 animal category level
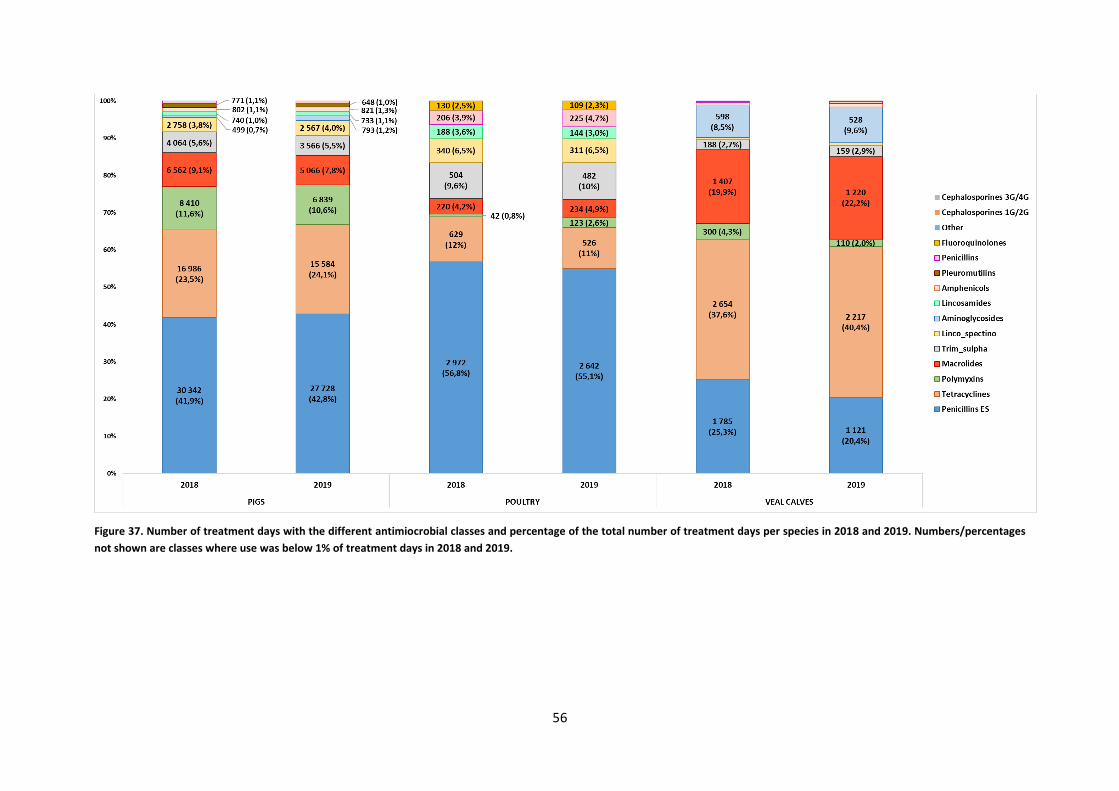
56
Figure 37. Number of treatment days with the different antimiocrobial classes and percentage of the total number of treatment days per species in 2018 and 2019. Numbers/percentages
not shown are classes where use was below 1% of treatment days in 2018 and 2019.
57
DISCUSSION
In the context of the increasing (awareness on) antimicrobial resistance development, comparable data and evolutions of
antimicrobial consumption (AMU) are of utmost importance. This annual BelVet-SAC report is now published for the eleventh
time and describes the antimicrobial use in animals in Belgium in 2019 and the evolution since 2011. For the second year this
report combines sales data (collected at the level of the wholesaler-distributors and the compound feed producers) and usage
data (collected at farm level). This allows to dig deeper into AMU at species and farm level in Belgium.
As always, in the sales data, the dependency on the biomass factor may influence the result. This means that changes
regarding the net import or export of slaughter animals (increasing or decreasing biomass in BE) will have an influence on the
outcome. Furthermore, we have to take into account that it is not 100% sure that all products sold in Belgium by the
wholesaler-distributors are also used in Belgium. Veterinarians living near the country borders may also use medicines bought
in Belgium to treat animals abroad. However, also the contrary may happen, i.e. veterinarians from neighbouring countries
using products in Belgium that are not included in the BelVet-SAC sales data. The usage data might help to shed some light
on this. Indeed, cascade use (‘import’) is requested to be registered in Sanitel-Med as ‘Self Defined Products’ and in 2019
approximately 1,3 ton of SDPs (predominantly Neosol 100%) was registered. In 2019, sales data were 34,6 tons higher than
usage data (not corrected for SDPs), which is a substantial improvement in comparison to 2018 where the difference was still
42,5 tons. As the usage data do not cover all animal species, most of this difference will be explained by usage in the non-
included species, most importantly bovines but also companion animals, horses,... It can also not be excluded that some
usage is not registered in Sanitel-Med for the currently obliged animal categories. The data-collection is still relatively new
and it likely takes time to get all veterinarians involved, especially those who have small practices. Adequate sensibilisation
and controls should therefore further ensure the completeness of the collected usage data.
With a consumption of 87,4 mg antimicrobial/kg biomass a decrease of -7,6% in comparison to 2018 is achieved in 2019.
This marks the fifth year in a row where an important decrease of antimicrobial usage in animals is observed resulting in a
cumulative reduction of -40,3% since 2011. As last year, the reduction in 2019 is balanced over a reduction in
pharmaceuticals (-7,8% mg/kg) and antimicrobial premixes (-5,1% mg/kg). In absolute values the observed reduction in
antimicrobial sales is even larger (-10,5%) yet this is partially nullified by the substantial decrease in biomass in Belgium in
2019. This effect may reflect a reduced size of the national herd, yet it might also be influenced by increased export of live
animals for slaughter abroad. In that latter case the observed reduction expressed in mg/kg biomass is even an
underestimation of the reality.
When looking at the evolution in the number of treatment days (BD100), as calculated from the SANITEL-MED use data,
comparable reductions of -5,8% for pigs and poultry and -21,3% for veal calves are observed. The fact that both data sources
are showing comparable trends is reassuring with regard to the data validity and the representation of reality.
As in 2018 the total AMU in animals in 2019 is in large part determined by the pig sector and more specifically, by the fatteners
and the weaners. Together, they accounted for 68% of tonnes used. Broilers and veal calves accounted for 16% and 12% of
tonnes used, respectively, and the remaining animal categories (sows/boars; sucklers; layers) for only 4%.
In 2019, on a median pig farm fatteners were treated with antimicrobials for around 3% of their livetime, sucklers for around
2% and pigs for breeding for around 0,4%. All but the breeders are reductions in comparison to 2018. These are encouraging
results for the pig sector, which has already put a lot of efforts in reducing their antimicrobial since many years, starting with
a private data-collection system (AB Register) already in 2014 and having also bore the entire weight of the antimicrobial
premix reduction up to 2017. Yet, challenges remain: despite the achieved reductions, the weaners remain a problem, being
among the three highest using categories with a median BD100 of 17,9. Yet also in this animal category a reduction of 10% in
comparison to 2018 is observed. Being the sector with the largest portion of total AMU, it will be important that pig producers
and veterinarians sustain their efforts in the coming years, especially in weaners.
Also in the broiler (-4%) and especially in the veal calve sector (-21%) the median BD100 was reduced in 2019 in comparison
to 2018. Especially the very substantial reduction in the veal calf production is remarkable and can likely be linked to the
enhanced actions organized in this production sector through the development of a “10 point program” aiming at reducing
the use in this sector. However, even after this important reduction the median use in the veal production still is at 21,4% of
the production period which remains the highest value of all sectors and therefore needs to be further reduced. Also in the
broiler production a moderate improvement is observed. Yet this is partially superseded by the continued high use of
58
fluoroquinolones in this production. An issue that urgently should be resolved. Therefore the broiler sector is urged to take
measures in the coming years. The results obtained in veal calves and pigs may serve as a source of inspiration.
For other species such as cattle, horses and companion animals no herd or animal level use date are yet available in Sanitel-
Med. Yet the BelVet-SAC sales data do allow to get a rough estimate of the antimicrobial use evolutions in these species. In
dairy cattle it is disturbing to see that since 2015 there is a steady increase in the use of antimicrobial dry cow applicators
which shows that there is no indication of a further implementation of selective dry cow therapy. Also the number of
applicators used for the treatment of mastitis cases has steadily increased over the last 3 years. Also in dogs and cats the
volume of antimicrobial use has again increased in 2019 with +13,0% in comparison to 2018. Compared to 2014 the total
increase of antimicrobial substances used in dogs and cats is +24,3%. These results clearly demonstrate, as has been already
mentioned in previous years, that the sector of companion animals urgently needs to take actions to start to bend the curve.
The details of the use of the different antimicrobial classes show – as in previous years – that penicillins (39,6%) form the
largest group of consumed antimicrobials, followed by tetracyclines (21,0%) and the sulphonamides (19,1%). For the majority
of the antimicrobial classes, a decrease in sales was observed in 2019. Especially the reduction of tetracycline use in 2019 is
remarkable. Only in three antimicrobial classes an increase was seen this year. First of all an increase of 20,0% in use of
aminosides. This is in contrast to 2018 where a decrease in use of this molecule of almost 13% was observed. Also the use of
cephalosporines of the 1° and 2° generation grew substantially (+38,1%). This is entirely due to an increase in the use of
cefalexine registered for use in dogs and cats and in intramammary products for cattle. And finally the use of quinolones
increased for the second year in a row (+10%). The latter is worrisome as the quinolones are categorized as “red”
antimicrobials. The use of these molecules decreased very substantially in 2016 and 2017, however it increased again in 2018
and continued at this level in 2019. The further increase of fluoroquinolones in 2019 is largely due to an increase in use of
enrofloxacin. The cephalosporines of the 3rd and 4th generation (the second group of “red” molecules), continue to decrease
in use again driven by a continued substantial decrease in use of ceftiofur. The decreased use of polymyxins is observed for
the seventh year in a row with a decrease of -11,2% in 2019. When comparing to 2012 polymyxin use has dropped with
66,4%.
Comparing the Belgian sales data with the results of other European countries and especially our neighbouring countries
clearly shows there is still a substantial gap to be bridged. Yet it should be taken into account that the European data (ESVAC)
are published with a two year delay (latest EU data are from 2017) and therefore do not take into account the very substantial
reductions achieved in 2018 and 2019 in Belgium.
When comparing the overall results achieved in 2019 with the three AMCRA 2020 reduction targets, the goal of reducing the
overall AMU in animals with 50% by 2020 has not been achieved yet, however the objective becomes in range with still
9,7% to reduce in the final year (corresponding to an additional reduction of 16,2% compared to the data of 2019). It is
anticipated that the herd level data-collection and benchmarking through the Sanitel-Med and AB register systems, in
combination with multiple other initiatives such as herd health plans, continuous education, increased biosecurity,…. will
provide invaluable support to achieve this goal. Moreover, AMCRA has in the meantime also already communicated further
reduction goals up to 65% by 2024 (compared to the reference year 2011)18, indicating that even after 2020 the efforts will
need to be continued. It is also very promising to see that again in 2019, even after largely achieving the goal of reducing the
use of antimicrobial premixes with 50% by 2017, a further reduction in the use of antimicrobial premixes is achieved, now
already resulting in a cumulative reduction of -71,1% in comparison to 2011. In regard to the different AMCRA colour classes,
use of “yellow” (-7%) and “orange” (-8%) classes substantially reduced. Yet the use of the “red” products increased for the
second year in a row (+8%) after a very spectacular drop in 2016 and 2017. Fortunately, this increase does not yet put at risk
the reduction target of -75% by 2020 (which was already achieved in 2017)as there still is a reduction of -77,3% in comparison
to 2011. However it is certainly an evolution that requires close surveillance.
18 https://www.amcra.be/nl/visie-2024/
59
CONCLUSION
This report shows several promising results with a continued reduction of the total use and the achievement of two out of
the three quantitative goals (use of premixes and use of critically important antimicrobials). These evolutions strengthen us
in the believe that also the third and overarching objective of a 50% reduction in use remains feasible, yet substantial efforts
will be required from all stakeholders to obtain this goal. The pig and veal sector is encouraged to sustain their efforts, while
the broiler, dairy and companion animal sector are urged to increase their efforts.
60
ACKNOWLEDGEMENTS
Belgian wholesaler-distributors and compound feed producers are much obliged for their cooperation and for providing the
data on the consumption of antimicrobials in animals in Belgium. All veterinarians and third party organisations who provide
data to the SANITEL_MED system are acknowledged for their efforts. We would like to thank Gudrun Sommereyns from the
Belgian Centre for Pharmacotherapeutic Information for providing the information on the commercialised medicinal
products.
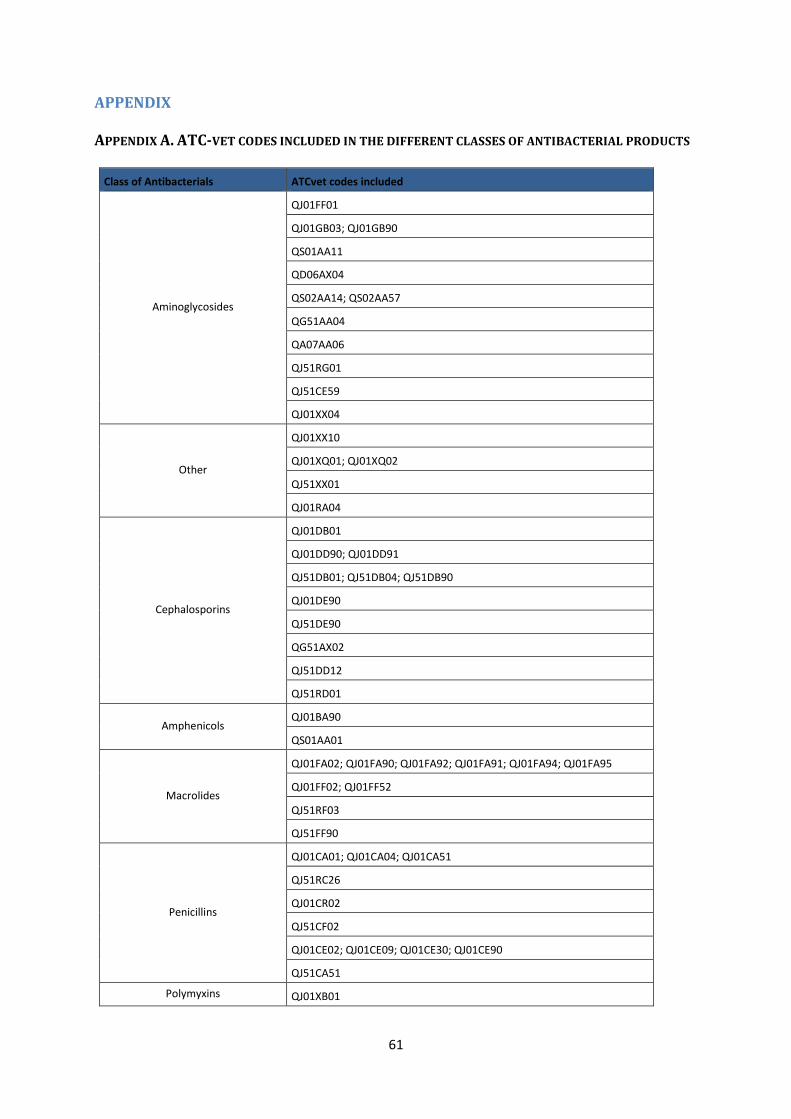
61
APPENDIX
APPENDIX A. ATC-VET CODES INCLUDED IN THE DIFFERENT CLASSES OF ANTIBACTERIAL PRODUCTS
Class of Antibacterials ATCvet codes included
Aminoglycosides
QJ01FF01
QJ01GB03; QJ01GB90
QS01AA11
QD06AX04
QS02AA14; QS02AA57
QG51AA04
QA07AA06
QJ51RG01
QJ51CE59
QJ01XX04
Other
QJ01XX10
QJ01XQ01; QJ01XQ02
QJ51XX01
QJ01RA04
Cephalosporins
QJ01DB01
QJ01DD90; QJ01DD91
QJ51DB01; QJ51DB04; QJ51DB90
QJ01DE90
QJ51DE90
QG51AX02
QJ51DD12
QJ51RD01
Amphenicols QJ01BA90
QS01AA01
Macrolides
QJ01FA02; QJ01FA90; QJ01FA92; QJ01FA91; QJ01FA94; QJ01FA95
QJ01FF02; QJ01FF52
QJ51RF03
QJ51FF90
Penicillins
QJ01CA01; QJ01CA04; QJ01CA51
QJ51RC26
QJ01CR02
QJ51CF02
QJ01CE02; QJ01CE09; QJ01CE30; QJ01CE90
QJ51CA51
Polymyxins QJ01XB01
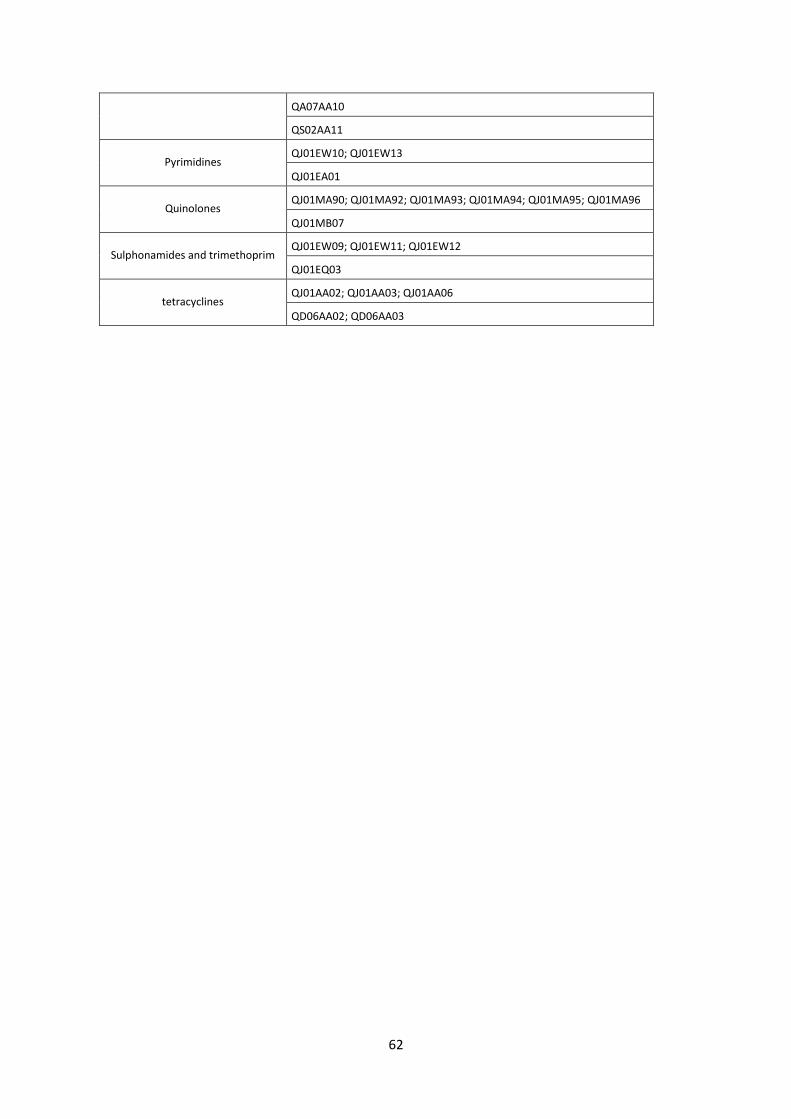
62
QA07AA10
QS02AA11
Pyrimidines QJ01EW10; QJ01EW13
QJ01EA01
Quinolones QJ01MA90; QJ01MA92; QJ01MA93; QJ01MA94; QJ01MA95; QJ01MA96
QJ01MB07
Sulphonamides and trimethoprim QJ01EW09; QJ01EW11; QJ01EW12
QJ01EQ03
tetracyclines QJ01AA02; QJ01AA03; QJ01AA06
QD06AA02; QD06AA03


![Module 1 C’est perso - Pearson Education · de jeux , le sport, la musique]? Oui, j’aime ça./ Non, je n’aime pas ça. les mangas, la tecktonik. le tennis, les chiens, la Nintendo](https://img.pdfslide.us/doc/110x75/5fdb0004e1109e78ad40035e/module-1-caest-perso-pearson-education-de-jeux-le-sport-la-musique-oui.jpg)