Embed Size (px)
Citation preview
BEFORE THE PUBLIC UTILITIES COMMISSION OF THE STATE OF CALIFORNIA
Application of Southern California Edison Company (U 338-E) for Approval of the Results of Its 2013 Application 14-11-016 Local Capacity Requirements Request for Offers for (Filed November 26, 2014) the Moorpark Sub-Area. _______________________________________________
TESTIMONY OF ROBERT PERRY
DIRECTOR OF ENERGY RESEARCH OF THE
WORLD BUSINESS ACADEMY
Laurence G. Chaset KEYES, FOX & WIEDMAN LLP 436 14th Street, Suite 1305 Oakland, CA 94612 E-mail: [email protected] Phone: (510) 314-8385
Attorney for World Business Academy
Date: April 8, 2015
TABLE OF CONTENTS
Page I. INTRODUCTION 1 II. SCE'S PROPOSED REFURBISHMENT OF THE ELLWOOD PLANT DOES NOT MEET THE IDENTIFIED LCR NEED 2 III. SCE'S PROPOSED REFURBISHMENT OF THE ELLWOOD PLANT WILL POSE SERIOUS ADVERSE ENVIRONMENTAL HAZARDS 10 IV. THE DISTRIBUTED ALTERNATIVE PROJECT THAT THE COMMISSION SHOULD DIRECT SCE TO PROCURE 12 V. THE ACADEMY'S DISTRIBUTED ALTERNATIVE PROJECT IS MORE COST EFFECTIVE THAN SCE'S PROPOSED GAS TURBINES 21 VI. OTHER ENVIRONMENTAL BENEFITS OF THE ACADEMY'S DISTRIBUTED ALTERNATIVE PROJECT 28 ATTACHMENT A CURRICULUM VITAE OF ROBERT PERRY DIRECTOR OF ENERGY RESEARCH OF THE WORLD BUSINESS ACADEMY ATTACHMENT B TABLES ATTACHMENT C AERIAL PHOTOS AND ESTIMATES REGARDING SOLAR PV CAPACITY ATTACHMENT D AERIAL PHOTOS AND ESTIMATES REGARDING POTENTIAL COMMUNITY SOLAR PROJECTS
1
TESTIMONY OF ROBERT PERRY 1
DIRECTOR OF ENERGY RESEARCH OF THE 2
WORLD BUSINESS ACADEMY 3
4
I. INTRODUCTION 5
6
Q: Please state your name and business address for the record. 7
A: Robert Perry. 2020 Alameda Padre Serra, Suite 135, Santa Barbara, CA 93103. 8
9
Q: What is your academic background and professional qualifications? 10
A: Attachment A to this testimony contains my Curriculum Vitae, which describes 11
my academic background and professional qualifications. 12
13
Q: What is the purpose of your testimony? 14
A: The World Business Academy ("Academy") has proposed, as a superior 15
alternative to the project that the Southern California Edison Company ("SCE") 16
has submitted for Commission approval in this proceeding: a hybrid power 17
generation and storage system relying on new, local solar PV generation along 18
with fuel cell and battery technologies. This hybrid system would be the first 19
stage in developing a community-wide energy “cloud” of networked microgrids 20
developed at the substation level. 21
22
The purpose of my testimony is to compare and contrast (i) the environmental, 23
operational and economic costs and benefits of installing the Academy's 24
proposed hybrid system against (ii) SCE’s proposed project within the context of 25
the inevitable failure of the solitary high-voltage transmission line that provides 26
most, if not all, power for the Santa Barbara Energy Needs Area (“ENA”), which 27
includes but is not limited to the cities of Santa Barbara, Goleta, Montecito, 28
2
Summerland and Carpinteria.1 Based on this analysis, my testimony will 1
demonstrate that by taking certain environmental, operational and economic 2
externalities into account, the overall costs of developing such distributed 3
generation and storage facilities will be lower than the actual costs of SCE's 4
proposed project and that the overall benefits of the Academy's proposed 5
alternative will be greater than the benefits from SCE's proposed project. 6
7
II. SCE'S PROPOSED REFURBISHMENT OF THE ELLWOOD PLANT 8
DOES NOT MEET THE IDENTIFIED LCR NEED 9
10
Q: Do you believe that Commission approval of the results of SCE’s 2013 LCR 11
RFO for the Moorpark sub-area would enhance the safe and reliable 12
operation of SCE’s electrical service? 13
A: In a word, NO. I agree with the Testimony of Rinaldo S. Brutoco, the 14
Academy's President, which is being submitted simultaneously with my 15
Testimony, that the reliability enhancements from the proposed refurbishment of 16
the Ellwood facility are illusory, and will fail to provide ratepayers with 17
sufficient energy to achieve near 100% operational reliability, even when 18
combined with net available capacity from sub-transmission lines under 19
development as a backstop against the failure of the compromised high-voltage 20
transmission lines currently providing power to the region.2 21
22
In its Response filed under in proceeding, SCE states that the Ellwood 23
Refurbishment Project is not part of the LCR procurement (italics added): 24
25 1 As disclosed by SCE in A.12-10-018, Application of Southern California Edison Company
(U338E) for a Permit to Construct Electrical Facilities with Voltages between 50 kV and 200 kV: Santa Barbara County Reliability Project, pp. 2-7. See also, Testimony of Rinaldo S. Brutoco, President of the World Business Academy, pp. 4-9, filed concurrently herewith.
2 A.12-10-018, at pp. 4-5.
3
"SCE is not proposing to count the 54 MW Ellwood Refurbishment 1
project toward its LCR procurement authorization for the Moorpark 2
sub-area. This unit was assumed to be online in CAISO’s LCR need 3
assessment. However, in the absence of a long-term PPA, the 4
likelihood of a permanent retirement of this resource, which plays an 5
important role for system reliability, would significantly increase, 6
which in turn would result in additional and higher LCR need in the 7
Moorpark sub-area. The proposed Ellwood Refurbishment PPA 8
avoids the need for SCE to develop additional new resources in 9
excess of SCE’s current LCR procurement authorization for the 10
Moorpark sub-area. 11
12
"Refurbishment of the Ellwood facility is necessary to enhance 13
certain operational characteristics of the unit to maintain system 14
reliability in the Goleta portion of the Moorpark sub-area. As 15
indicated in SCE’s LCR Procurement Plan, approved by the Energy 16
Division on September 4, 2013, reliable resources in the Goleta 17
area are needed to maintain system reliability for local communities 18
in the area."3 19
20
A footnote in the above excerpt references SCE’s Track 1 Procurement Plan, 21
where the gravity of the impact from the loss of the high-voltage transmission 22
lines is fully explained: 23
24
"As can be seen from Figure II-3, the Goleta substation area is 25
served radially from Santa Clara substation by two 230 kV lines, 26
3 See, Southern California Edison Company’s (U 338-E) Response to Protests to Its Application for
Approval of the Results of Its 2013 Local Capacity Requirements Request for Offers for the Moorpark Sub-Area, p. 7.
4
Santa Clara-Goleta No. 1 and No.2. The two Santa Clara-Goleta 230 1
kV lines are co-located on a single tower corridor through rugged 2
mountainous terrain in a wooded area that is subject to natural 3
hazards including soil erosion and wildfires. If an outage occurred 4
on the two Santa Clara-Goleta 230 kV lines, SCE can serve 5
approximately two-thirds of the peak loads served by Goleta 6
substation by being transferred to an adjacent 66 kV system once a 7
proposed upgrade to that system that presently awaiting CPUC 8
approval is completed. [A footnote appended to this sentence reads 9
as follows: Before completion of the upgrade to the 66 kV system 10
currently awaiting CPUC approval, SCE can only serve one-third of 11
peak load by transferred the load to an adjacent 66 kV system, if an 12
outage occurred on the two Santa Clara-Goleta 230 kV lines.] 13
However, the time period to restore full service to load served by 14
Goleta substation could be significant. Due to the rugged terrain, 15
loss of the Santa Clara-Goleta lines due to environmental hazards 16
could result in rolling blackouts in this area for an extended period. 17
There is significant value to the local communities in seeking 18
generation sited in this area."4 19
20
It appears from SCE's foregoing statements that the true purpose for 21
“refurbishing” this aging turbine plant is not to provide peaking services to the 22
Moorpark Sub-Area (which services would seem to be rarely needed, given the 23
extremely limited output of the Ellwood plant in recent years), but rather to act as 24
a "fail-safe" against the impending failure of the current compromised high-25
voltage transmission line. Furthermore, should the proposed 54 MW peaker 26
plant in the Ellwood neighborhood be completed, its capacity would not fully 27 4 See, Track 1 Procurement Plan of Southern California Edison Company Submitted Pursuant to
Energy Division Pursuant to D.13-02-015, p. 16.
5
cover the energy shortage resulting from the failure of the existing transmission 1
line, when power is rerouted through the sub-transmission lines connecting the 2
Moorpark Sub-Area grid to the opposite southern end of the Santa Barbara ENA 3
at the Carpinteria Substation. 4
5
The CAISO's 2014-2015 ISO Transmission Plan, dated March 27, 2015, 6
forecasts the 2016 summer peak load for the Goleta Substation at 321 MW.5 7
However, prior to completion of the currently proposed sub-transmission 8
upgrade, the Santa Barbara ENA faces a shortage of 66% of its peak load, or 214 9
MW, in the event of a transmission failure. Even if the proposed upgrade is 10
completed, the ENA is still short 33% of peak load, or 107 MW. Therefore, 11
under the most optimal scenario described above, the proposed peaker plant 12
would only partially mitigate a foreseeable catastrophe, and even with the 13
proposed refurbishment of the Ellwood plant and completion of the proposed 14
sub-transmission line upgrade, energy delivery services by SCE to the Santa 15
Barbara ENA in the event of a primary transmission line failure could in no 16
manner be described as “reliable.” 17
18
With regard to safety, the circumstances described in the previous paragraphs 19
would also require changing the function of the “peaker” plant, required to 20
operate only a few hours each day, to more of a baseload role, such that the 21
Ellwood plant would be required to be constantly operating to cover a portion of 22
the 33-66% power shortage for most of the day and well into the night. Under 23
this scenario, the emissions of carbon and hazardous fine particulates from the 24
refurbished Ellwood plant would likely triple or quadruple, and that plant would 25
likely be operating during school hours at Ellwood Elementary, which is situated 26
less than 1,000 feet from the plant site. 27
5 See, CAISO 2014-1015 ISO Transmission Plan, p. 122.
6
1
As for sound pollution, the Academy has yet not found relevant data concerning 2
the noise emissions from this plant, but it is a well-established fact that even 3
when enclosed, such jet engine turbine plants have a loud acoustic signature. 4
5
Q: Are the results of SCE’s 2013 LCR RFO for the Moorpark sub-area a 6
reasonable means to meet the 215 to 290 MW of identified LCR need 7
determined by D.13-02-015? 8
A: The procurement proposed in this proceeding is not reasonable in that (i) under 9
the best circumstances, the proposed peaker plant only serves the energy needs of 10
the larger Moorpark Sub-Area at the expense of adjacent Ellwood residents; (ii) 11
in the event of a transmission failure, the plant’s 54 MW capacity will be 12
insufficient to cover the shortage resulting from rerouting power to the 66 kV 13
sub-transmission lines; and (iii) in the event of a transmission failure, the plant 14
will operate far outside its intended parameters, subjecting the primarily 15
residential area, and particularly the school children attending the adjacent 16
elementary school located less than 1,000 feet from the facility site, to vastly 17
higher emissions of hazardous particulates which have been known to cause 18
major adverse medical conditions, including cancer. 19
20
Although the Commission’s Track 1 Decision in D.13-02-015 does not mandate 21
the procurement of any particular type of resource for the Moorpark Sub-Area, 22
there are numerous references in that Decision to the preference for preferred 23
resources as specified in the Loading Order (italics added): 24
25
"SCE is also authorized to procure between 215 and 290 MW of the 26
Moorpark sub-area of the Big Creek/Ventura local reliability area. 27
The LCRs require resources be located in a specific transmission-28
constrained area in order to ensure adequate available electrical 29
7
capacity to meet peak demand, and ensure the safety and reliability 1
of the local electrical grid. 2
. . . 3
"The long-term LCRs are expected to result from the retirement of 4
thousands of MW from current once-through cooling generators due 5
to compliance with State Water Quality Control Board regulations. 6
We anticipate that much of the additional LCR need currently 7
forecast by the California Independent System Operator can be filled 8
by preferred resources, either through procurement of capacity or 9
reduction in demand. Preferred resources include energy efficiency, 10
demand response, and distributed generation including combined 11
heat and power. Energy storage resources may also be available. 12
13
"In the next long-term procurement proceeding, expected to 14
commence in 2014, we will evaluate whether there are additional 15
LCR needs for local reliability areas in California.” 16
. . . 17
"SCE is directed to begin a solicitation process to procure authorized 18
LCR resources. The first step is a plan to issue one or more Request 19
for Offers and/or to enter into cost-of-service contracts per Assembly 20
Bill 1576 (Stats 2005, ch. 374). SCE should also actively pursue 21
locally-targeted and cost-effective preferred resources. SCE’s 22
procurement plan shall be consistent to the extent possible with the 23
multi-agency Energy Action Plan, which places cost-effective energy 24
efficiency and demand response resources first in the Loading 25
Order, followed by renewable resources and then fossil-fuel 26
8
resources. Energy storage resources should be considered along 1
with preferred resources.6 2
. . . 3
"As part of our review of SCE’s procurement plan, and when 4
considering SCE’s procurement application, we will require SCE to 5
show that it has done everything it could to obtain cost-effective 6
demand-side resources which can reduce the LCR need, and cost-7
effective preferred resources and energy storage resources to meet 8
LCR needs. This task includes efforts already underway and 9
approved in other Commission proceedings, with an eye to focusing 10
such efforts in the specific local geographic areas where LCR needs 11
exist."7 12
13
The Commission even takes notice of SCE’s acknowledgement that new 14
technologies embodied in preferred resources can better serve the Moorpark 15
Sub-Area (footnotes omitted, italics added): 16
17
"SCE recommends deferring authorization for procuring additional 18
local capacity in the Big Creek/Ventura local area until the next 19
LTPP cycle (expected to commence in 2014). SCE contends that 20
barriers to construction of new LCR generation is not as difficult in 21
the Big Creek/Ventura local area as in the LA basin local area, 22
because “this area does not have as many, or as stringent, siting 23
restrictions as the LA basin.” SCE further argues that newer 24
technology of various sizes is more likely to be the replacement 25
6 D.13-02-015, Decision Authorizing Long-Term Procurement for Local Capacity Requirements,
Summary, pp. 2-3. 7 D.13-02-015, p. 78.
9
generation in the Moorpark sub-area, which may be able to be built 1
in 5 to 7 years."8 2
3
The requirement to locate resources “in a specific transmission-constrained 4
area in order to ensure adequate available electrical capacity to meet peak 5
demand, and ensure the safety and reliability of the local electrical grid” 6
seems to prioritize the needs of the residents within the “transmission-7
constrained area” over the broader requirements of the Moorpark Sub-Area. 8
The focus on procuring demand-side resources, preferred resources and 9
energy storage also places a burden on SCE to look for a “better fit” for the 10
Santa Barbara ENA. Even SCE acknowledges these circumstances, 11
arguing that “newer technology of various sizes is more likely to be the 12
replacement generation in the Moorpark sub-area.”9 In this light, installing 13
a 54 MW peaker plant that is likely to exceed its operating parameters for 14
an extended period of time during a foreseeable emergency clearly does not 15
qualify as a “best fit” solution for the Santa Barbara ENA. 16
17
Q: Is the 54 MW Ellwood Refurbishment project appropriate for the 18
Commission to consider in this proceeding and, if so, is the contract 19
reasonable? 20
A: The 54 MW Ellwood Refurbishment project is neither an appropriate nor a 21
reasonable project for the Commission to approve, as this proposed facility is not 22
the “best fit” for the densely populated and extremely transmission-constrained 23
Santa Barbara ENA, which is already subject to a potentially catastrophic failure 24
of its high-voltage transmission system. Moreover, this proposed project is 25
located in the rapidly developing Ellwood residential area of Goleta, less than 26
1,000 feet away from the local elementary school. There are also large 27 8 D.13-02-015, pp. 68-69. 9 Id.

10
residential tracts located on both sides of the plant site that would be adversely 1
impacted should the plant need to operate longer hours than originally intended 2
due to the transmission line failure. 3
4
Q: Is the contract with NRG California South LP, for a 0.5 MW storage 5
project, reasonable? 6
A: For the near term, the small capacity of the proposed storage project is 7
reasonable in that there has not been much penetration to date by intermittent 8
renewable resources in the Santa Barbara ENA. However, the scale of 9
penetration by renewable resources in the Santa Barbara ENA is expected to 10
ramp up dramatically as area communities become aware of the fragile state of 11
the local transmission and distribution grid. Electricity customers in this area 12
will therefore soon be demanding a more reliable and resilient distributed 13
solution. This significant increase in demand for renewable generation will, in 14
turn, require much larger procurements of storage and distributed generation for 15
the Santa Barbara ENA in subsequent LCR proceedings. 16
17
III. SCE'S PROPOSED REFURBISHMENT OF THE ELLWOOD PLANT 18
WILL POSE SERIOUS ADVERSE ENVIRONMENTAL HAZARDS 19
20
Q: Are the LCR RFO contracts consistent with the Commission’s Emissions 21
Performance Standards ("EPS")? 22
A: No. In the event of a transmission failure as described above, the plant’s 23
proposed operation as a peaker facility, scheduled to run only a few hours a day 24
to supply extra energy during peak load periods, would be completely 25
undermined, as continuous operation during the foreseeable transmission failure 26
would inevitably be required to make up for a portion of the shortfall. 27
28
11
Peaker plants are designed to quickly deliver power for short periods and their 1
high emissions profile requires them to operate only a few hours a day in order to 2
remain within EPS requirements. As the impending transmission failure would 3
be deemed an “emergency,” SCE would certainly apply for an exemption from 4
EPS requirements until either the high-voltage transmission lines are repaired (at 5
an extremely high cost), or local generation and storage facilities are developed. 6
Ironically, it is just those types of facilities that the Academy is currently 7
proposing to implement on a proactive basis in lieu of the proposed peaker plant. 8
9
The fuel cell and battery technologies that would comprise these facilities are 10
wholly compliant with all EPS standards, as they have an extremely low 11
emissions footprint and are capable of operating free of all carbon and fine 12
particulate emissions. 13
14
Q: Should the Commission approve these contracts prior to completion and a 15
final decision by the California Energy Commission ("CEC") on the 16
required California Environmental Quality Act ("CEQA") review? 17
A: Given the likelihood that both of the peaker plants proposed for approval in this 18
Application will operate much longer than anticipated, with attendant carbon and 19
fine particulate emissions, the Academy urges the Commission to delay approval 20
of the contracts pending CEC CEQA approval and to use the interim period to 21
pursue a more distributed and resilient solution. Moreover, the CEQA review of 22
the proposed 54 MW Ellwood peaker plant should unquestionably include a 23
careful consideration of likelihood that there will be serious issues with the 24
primary transmission lines, which will require much longer, if not continuous, 25
operation of the plant during any interim period during which those lines are 26
being repaired. 27
28
12
IV. THE DISTRIBUTED ALTERNATIVE PROJECT THAT THE 1
COMMISSION SHOULD DIRECT SCE TO PROCURE 2
3
Q: What would be a more appropriate and reasonable procurement for the 4
Commission to consider in this proceeding? 5
A: A significantly more reasonable and appropriate procurement solution would be 6
to reallocate a substantial portion of the total 316 MW of capacity authorized 7
pursuant to the Commission's Track 1 Decision for development within the Santa 8
Barbara ENA to make up for the imminent energy shortage inherent in SCE’s 9
current proposal. All such reallocated resources can and should be Preferred 10
Resources. A mix of clean, distributed resources would be far superior to 11
replacing an old gas turbine plant with a “new” turbine combustion facility for 12
the next 25-30 years. (Indeed, there is a high likelihood that increasingly 13
stringent emission standards will render such a "new" turbine combustion facility 14
a “stranded asset” long before the end of its useful life.) 15
16
The Academy's proposed Distributed Alternative Project that the Commission 17
should direct SCE to procure instead of the two peaker plants proposed in the 18
Application under review would include: 19
20
Solar PV (Distributed Generation). The foundation for any distributed energy 21
system is locally sited generation. It is essential that the latent energy capacity of 22
solar PV within the Santa Barbara ENA be developed to the fullest extent 23
possible, with a concurrent development of storage capacity based on projected 24
solar PV penetration. As a result of its unique geography, the entire Santa 25
Barbara ENA is south-facing, providing ample opportunities to install solar PV 26
in areas exposed to direct sunlight for extended periods each day. 27
28
13
To date, the Santa Barbara ENA has a very little installed solar PV systems, and 1
there is plentiful commercial/industrial roof space on which to mount large PV 2
systems for an aggregate multi-megawatt capacity. Attached as Exhibit C to this 3
Testimony are aerial digital photographs10 of prime rooftop locations within the 4
Santa Barbara ENA that are within close proximity to substations. As is evident 5
from the attached aerials, the conversion of this fallow roof and parking lot space 6
is capable of generating between 50-100 MW of daily capacity for direct use 7
during the daytime or for storage for later use off-peak. 8
9
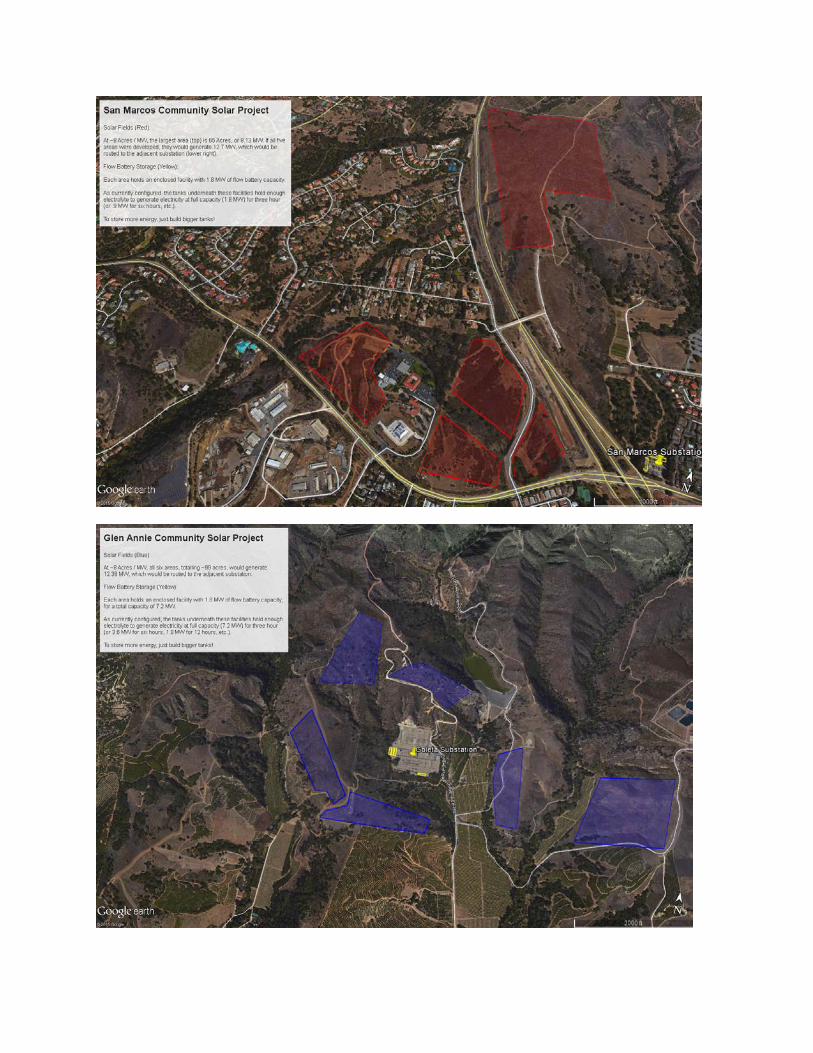
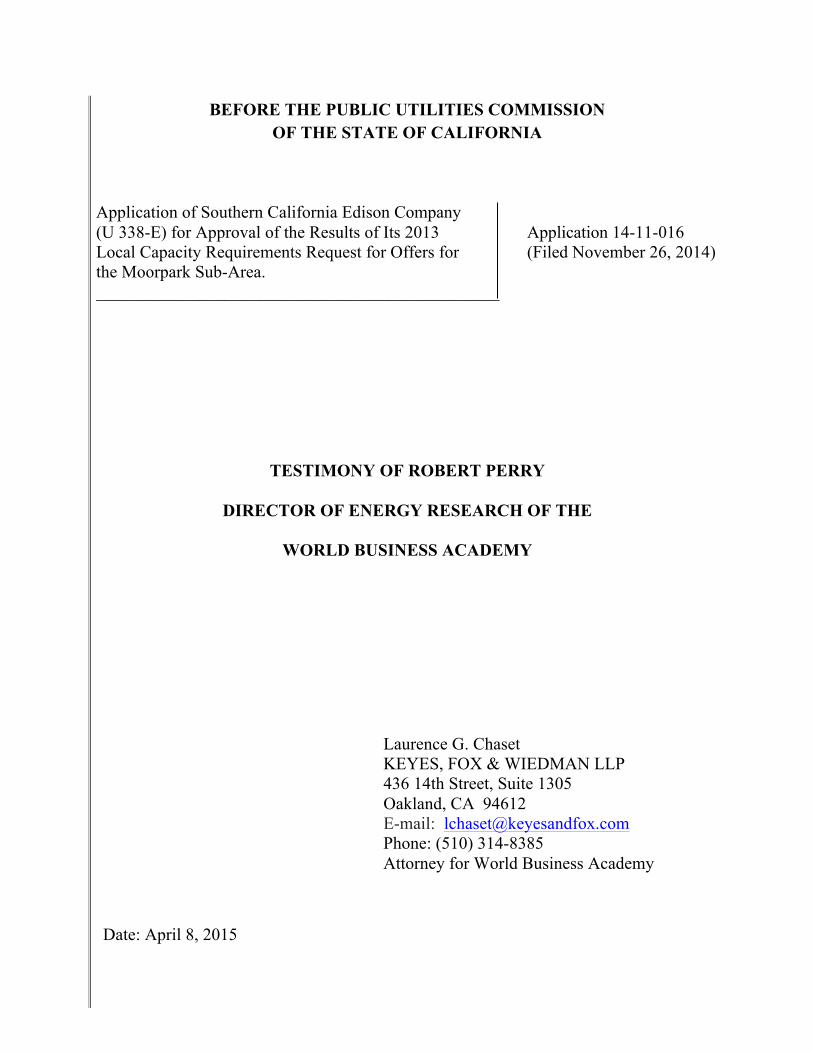
Additionally, undeveloped fields on south-facing hillsides adjacent to substations 10
can be developed as community solar projects, where investors and local citizens 11
can own equity shares of dedicated solar PV generation without having to 12
personally own PV systems, and receive dividends on their equity through a 13
credit reduction on their utility bill. There are south-facing hillsides, located 14
within proximity to substations, from the San Marcos Pass to Goleta and as far 15
north as Gaviota, to add at least another 50-100 MW of capacity, if needed. 16
17
Strategic development of existing rooftops, public and private parking areas and 18
south-facing hillsides will create enough renewable energy generation within the 19
Santa Barbara ENA to continuously power a properly managed microgrid 20
distribution system. With properly distributed and located generation, storage 21
and electrolysis facilities, there should be no concerns regarding grid instability 22
from over-generation, as the microgrid system will incorporate an established 23
hierarchy for the application of any surplus energy: first to serve microgrid load 24
and maximize local storage capacity; second, for transmission to the outer 25
Moorpark Sub-Area if needed; and finally, for the electrolysis of water into 26
hydrogen either for long-term storage or for sale to hydrogen fuel cell ("HFC") 27
10 These digital aerials were created using Google Earth software.
14
vehicle refueling stations as a secondary revenue source. With properly allocated 1
resources, there should be no scenario where surplus renewable energy would 2
have to be wasted through needless curtailment measures. 3
4
Hybrid Fuel Cell-Battery Plants Strategically Located at Wastewater, Landfill 5
and Desalination Sites. To the extent possible, these plants would utilize fuel 6
cell technology to provide essentially baseload, carbon-neutral power using 7
available biogas feedstock from anaerobic digesters at municipal wastewater and 8
landfill sites, while an appropriately sized battery component would provide 9
ramping, peak shaving and ancillary services to the adjacent area. The hybrid 10
plant servicing the city’s soon-to-be-activated desalination plant would play a 11
particularly unique role within the Santa Barbara ENA: connected to both the 12
plant and the distribution grid, this facility would be available on a continuous 13
standby basis to provide emergency grid support services by instantly diverting 14
all or a portion of its capacity from its baseload function serving the desalination 15
plant to other areas in order to meet peak load needs at either the distribution or 16
transmission grid levels when the primary solar PV generation is not available, or 17
in case of a transmission line failure, as described above. 18
19
Such a strategic position within the microgrid will effectively enable a baseload 20
energy source also to offer dispatchable energy via switchable grid service 21
functions. Furthermore, because fuel cells are modular, switching capabilities 22
would be assigned on a per unit basis, allowing for immediate or gradual 23
ramping during the early morning and late afternoon/early evening hours as 24
shown in the by now well-known “duck curve” graph.11 25
26
11 California ISO, “Fast Facts: What the Duck Curve Tells Us about Managing a Green Grid,” 2013.
15
Flow Batteries (Utility-Scale Energy Storage) at Substation Locations. These 1
utility-scale installations would be located adjacent to substations and calibrated 2
to store enough excess solar energy generated during peak periods for 3
transitional ramping needs, off-peak generation at night and for ancillary services 4
such as phase and voltage regulation to enhance grid reliability.12 The unique 5
characteristic of flow batteries is the capacity to hold large volumes of charged, 6
non-toxic13 electrolyte in underground tanks as stored energy, and then to 7
discharge that energy over many hours, with the only limiting factor being the 8
size of the tanks storing the electrolyte in either a charged or discharged state. 9
10
For example, a flow battery facility with a 5 MW capacity connected to 11
underground tanks holding 50 MW of charged electrolyte could provide energy 12
at full capacity for 10 hours, effectively bridging the nighttime portion of the 24-13
hour diurnal cycle until sunrise, when solar PV resources would again start 14
delivering power to the grid and recharging the discharged electrolyte. During 15
the day, the flow battery’s virtually instantaneous response capabilities allow for 16
load leveling of daily power fluctuations, providing a constant and even source 17
of energy to the surrounding area. As dusk approaches and renewable generation 18
begins to fade, flow batteries quickly pick up the slack, discharging stored energy 19
to meet demand. 20
21
Lithium-Ion Batteries (Distributed Energy Storage) in High Density Areas. Solar 22
PV systems at commercial-industrial sites and designated city blocks would be 23
supplemented by battery storage systems designed to provide 2-4 hours of power 24
12 Hardin, Mark and Brown, Amanda, “CPUC Energy Storage Use Case Analysis - Distribution
Energy Storage: Distributed Storage Peaker,” California Public Utilities Commission -- Energy Storage Proceeding, R.10-12-007.
13 Prior flow battery prototypes using toxic electrolyte materials initially made the technology environmentally untenable for consideration by the Academy. However, new methods incorporating zinc redox technology have alleviated those concerns.
16
(appropriately scaled to meet load requirements) in the event of an outage or to 1
support other areas in the distribution grid. Using advanced grid management 2
software, such “nanogrids” within the Santa Barbara ENA will also be able to 3
combine their aggregate storage to collectively act as a “virtual peaker” plant to 4
supplement utility-scale storage during high load periods, for daily ramping 5
requirements or to provide extended grid support to other affected areas during 6
outages. 14 7
8
Demand Response/Energy Efficiency Programs (Peak and System Load 9
Mitigation). Every credible energy system must develop efficiency and demand 10
response programs, which serve to reduce overall and peak system loads. SCE 11
should be required to procure a diverse program set of Demand Response and 12
Energy Efficiency resources to help close any gap between projected peak loads 13
and the emerging distributed energy system. 14
15
Q: How would you implement this proposed distributed resource plan within 16
the scope of this proceeding? 17
A: First and foremost, local capacity must be developed in an amount that exceeds 18
whatever shortage would be created from a failure of the primary transmission 19
line. As the IOU responsible for the Moorpark Sub-Area, SCE should be 20
required to reconcile existing and anticipated capacity (both before and following 21
completion of the sub-transmission line upgrade) with the CAISO’s 2016 22
projected peak load of 321 MW for the Goleta substation that currently serves as 23
the transmission-distribution nexus point for the Santa Barbara ENA. 24
25
Once SCE has conducted a transparent analysis that accurately quantifies the 26
shortage resulting from a transmission failure, the Commission should authorize 27
14 Hardin and Brown, “CPUC Energy Storage Use Case Analysis - Distribution Energy Storage:
Distributed Storage Peaker,” supra.
17
an comprehensive feasibility study that would include a requirement for SCE to 1
develop a detailed recommendation regarding the optimal set of Preferred 2
Resources (distributed generation, storage, and/or load reduction through demand 3
response and energy efficiency measures) to address the shortfall. 4
Following completion of the foregoing feasibility study, an accelerated RFO 5
process, similar in nature to SCE’s Preferred Resources Pilot Project recently 6
initiated for Orange County, would be completed on an expedited basis and 7
contracts negotiated and approved on a schedule similar to the Orange County 8
PRP. 15 9
10
Subject to completion of the foregoing measures, the Academy believes that 11
initial procurements should involve the development of utility-scale fuel cell 12
and/or battery plants at various substation locations. Appropriately sized fuel 13
cell plants would be installed at substations located near natural gas and biogas 14
sources such as wastewater treatment facilities and landfills. Within the Santa 15
Barbara ENA, these locations include the following facilities: 16
17
Tajiguas Landfill. The landfill facility currently processes enough biogas 18
from landfill emissions to generate approximately three megawatts (3 MW) 19
of power using an obsolete diesel reciprocal engine. Santa Barbara County 20
is also developing a Resource Recovery Project at the landfill to add an 21
additional amount of biogas to generate 1+ megawatt of power (as currently 22
delivered by the diesel engine), for an increase in volume of approximately 23
33% over current levels. The Academy believes that this biogas resource 24
would be better utilized in a fuel cell system, which would not only 25
generate electricity at an efficiency rate of ~47% (increased to ~80% 26
through CHP conversion), but would also produce a syngas that can be 27
15 SCE, “Preferred Resources Pilot,” June 2014. See also, “SCE’s Preferred Resources Pilot
("PRP"),” November 6, 2013 and “SCE PRP RFO Schedule.”
18
filtered into a pure hydrogen byproduct, to be used either by the fuel cells 1
to generate additional carbon-free electricity, or stored and sold as a 2
secondary revenue source to local refueling stations for advanced clean fuel 3
vehicles that are scheduled to come on-line by the end of 2015. 4
5
Depending on the relative efficiency rate of the engine currently operating 6
at the landfill, the Academy believes that this new facility at the landfill site 7
can increase energy production by at least 25%. It should also be noted that 8
there are many south-facing hillsides located adjacent to the landfill site 9
that could serve as utility-scale community solar projects to generate 10
additional renewable energy to the Santa Barbara ENA. 11
12
Goleta Wastewater Treatment Plant (“WWTP”). Subject to the volume of 13
biogas produced at the plant, a 1.4 or 2.8 MW fuel cell plant could be 14
installed, with the heat discharge from the fuel cells used to heat the 15
digester units at the wastewater treatment plant. In addition to carbon-16
neutral energy, which could be delivered to the University of California, 17
Santa Barbara campus in furtherance of their 2025 mandate, hydrogen by-18
product would also be produced and either sold to refueling stations for 19
secondary revenue or used by the fuel cells to produce more clean energy. 20
To the extent there is insufficient biogas, the fuel cells could also use 21
conventional natural gas to deliver power to the area until such time as a 22
more robust hydrogen delivery infrastructure is developed in California. 23 24
El Estero WWTP / Charles Meyer Desalination Plant. An appropriately 25
scaled fuel cell plant would be located at the wastewater treatment plant in 26
the same manner as at the Goleta WWTP. As discussed above, energy 27
from the fuel cell plant would be primarily used to power the desalination 28
plant, but would be also available on a standby basis for dispatch to the 29
19
distribution and/or transmission grid when needed. Because power would 1
always be needed to operate the desalination plant, deliverability of this 2
energy would only be limited by the ability to quickly switch the power 3
output of the fuel cells from the plant to the grid and back again. In this 4
unique arrangement, baseload generation by fuel cells can be used in a 5
flexible, dispatchable manner. 6 7
Other Substations. Depending on certain criteria, either fuel cells or flow 8
batteries would be located at all substation sites. For substations with 9
access to natural gas and biogas, fuel cells offer a clean, quiet source of 10
energy, while also providing heat and hydrogen byproducts for direct use or 11
for conversion into surplus energy for storage and/or sale to refueling 12
stations for hydrogen-powered vehicles. 13
14
One substation with locational features meriting the application of both 15
technologies is located in downtown Santa Barbara. This substation could 16
potentially access vast amounts of solar energy from solar PV on 17
commercial, industrial and retail rooftops and parking lots located within 18
the 800-acre area comprised of downtown Santa Barbara and adjacent areas 19
zoned for commercial, industrial and retail (“CIR”) use (collectively, the 20
“SBCIR”). 21
22
Applying a conservative metric of 100,000 square feet (100K SF) for every 23
megawatt (MW) of electricity using solar panels16 with a 12% efficiency 24
16 The standard solar panel on the market today is sized at 3 feet by 5 feet, or 15 sq. ft., and
produces about 260 watts. Thus, 100,000 sq. ft. could theoretically accommodate 1,733 kW of solar panels. Discounting that amount of generation by the standard factor of 15% to account for the conversation of DC solar generation into AC power for use on the grid, that leaves as much as 1,473 kW of AC power that could be generated in an area of 100,000 sq. ft. Thus, the 1 MW per 100,000 sq. ft. number being used in my subsequent calculations significantly understates the amount of electricity that could be generated by solar PV panels covering that amount of space.
20
rating17, and assuming 50% of the SBCIR contains rooftop, parking and 1
others surface areas capable of solar PV development, the energy capacity 2
of the SBCIR can be roughly estimated at varying penetrations of 25% 3
(43.67 MW), 35% (61.14 MW), 50% (87.35 MW) and 65% (113.55 MW). 4
Attached as Exhibit C are digital photos of the SBCIR and selected test 5
sites, along with calculations used to estimate available solar capacity. 6
7
Given the population density and diverse energy usage in the SBCIR, it 8
would be advisable to deploy fuel cell, flow battery and electrolysis 9
capacity and features to manage the large volumes of energy generated 10
once solar PV development in the SBCIR reaches a saturation point. 11
Although these modular technologies will not require immediate 12
installation of the entire projected capacity, space should be allocated so 13
that additional units can be added as solar PV capacity reaches targeted 14
milestones. Initially, while solar PV development is still low, an emphasis 15
on developing flow battery capacity will allow the SBCIR to store whatever 16
surplus renewable is generated for use at night. Once surplus energy 17
exceeds maximum flow battery capacity based on forecast nightly load 18
requirements, then such energy can be diverted to other areas within and 19
outside the Santa Barbara ENA or used for electrolysis of wastewater into 20
hydrogen as a long-term storage reserve or for sale to local HFC vehicle 21
refueling stations. 22
23
For substations located adjacent to south-facing hillsides, a flow battery 24
would be best for short-term storage and use within the 24-hour diurnal 25
cycle. Such substations located near potential renewable energy resources 26
include the, Goleta and San Marcos substations, which are located adjacent 27
17 See, Energy.gov, “Installing and Maintaining a Home Solar Electric System,” July 2, 2012.
21
to south-facing hillsides that could be developed as Solar Community 1
Projects for the generation of utility-scale energy. Attached as Exhibit D are 2
digital images of the area surrounding these substations, with areas of 3
potential solar development and possible flow battery installation sites 4
indicated thereon. 5
6
In summary, the Academy proposes that for this proceeding, the Commission 7
should direct SCE to initiate an RFO to procure the following energy projects in 8
lieu of SCE’s proposed refurbishment of the 54 MW Ellwood peaker plant: 9
10
Preferred Resource Type Site Location MW 11
PV with Battery Storage Large CIR Rooftops/Parking Areas 75.0 12
Fuel Cell Plants Ellwood/Landfill/WWTP/Desal Sites 42.0 13
1.8/3.6/7.2 MW Flow Battery Plants Substation Locations 18.0 14
Energy Efficiency / Demand Response Throughout SB ENA 15.0 15
Total Procurement 150.0 16
17
V. THE ACADEMY'S BETTER ALTERNATIVE PROJECT IS MORE 18
COST EFFECTIVE THAN SCE'S PROPOSED GAS TURBINES 19
20
Q: Can these Preferred Resources be procured on a cost-effective basis? 21
A: Yes. The cost of installing Solar PV panels on commercial and industrial sites 22
has plummeted in recent years and now has achieved parity with gas-fired peaker 23
plants on a levelized cost of energy (“LCOE”) basis.18 Likewise, energy 24
efficiency and demand response programs have been proven effective in 25
18 See, Lazard Ltd., Lazard’s Levelized Cost of Energy Analysis — Version 8.0, Sept. 2014, pp. 2-
4.
22
reducing peak and overall loads on a per-dollar basis. Fuel cell and flow battery 1
technologies, however, are just beginning to offer their products to the energy 2
marketplace and have not yet achieved economies of scale that will lower 3
production costs such that they can directly compete with established GFG 4
suppliers on a strictly economic, cost per kilowatt-hour, basis. 5
6
This does not mean, however, that procuring these advanced energy products as 7
part of a distributed resources plan to construct a community-wide microgrid is 8
not a cost effective endeavor, when incorporating various unaccounted-for 9
externalities, including but not limited to (i) the health benefits from avoided fine 10
particulate emissions from the Ellwood Peaker Plant, (ii) the avoided costs of 11
fully upgrading the high-voltage transmission lines to reliably bring enough 12
power to the Santa Barbara ENA, and last but not least, (iii) the extremely high 13
value to the State of California of successfully developing and operating a 14
community microgrid project in an extremely transmission-constrained area. 15
Numerous participants in many hearings before the Commission have called for 16
such a demonstration project in order to begin the transition towards a more 17
reliable and resilient distributed energy system.19 18
19
Furthermore, as shown below, the LCOE of fuel cells and flow batteries are very 20
competitive with peaker plants whose operation is limited to a few hours each 21
day. Combined together, both technologies offer a feature set that is modular, 22
scalable and more importantly, capable of operating completely carbon-free from 23
renewable sources. 24
25
19 Picker, Michael, “Guidance for Section 769 – Distribution Resource Planning,” as attached to the
Assigned Commissioner’s Ruling in CPUC Proceeding R.14-08-013, pp. 5-7. See also, “CA CEC PON-14-301: Demonstrating Secure, Reliable Microgrids and Grid-Linked Electric Vehicles to Build Resilient, Low-Carbon Facilities and Communities,” EnergyStorage.org.
23
Q: What are the primary sources of your analysis regarding the comparable 1
LCOE of fuel cells, flow batteries and gas turbine peaker plants? 2
A: The major reference relied on in developing this analysis is the most recent 3
report prepared by Lazard, a highly respected financial advisory and asset 4
management firm with offices all over the world ("Lazard Report"), regarding its 5
LCOE analysis of conventional and renewable technologies.20 Over the years, 6
the Lazard Report has become a standard reference point within the energy 7
industry and has received extensive and favorable press coverage.21 Also 8
incorporated into my analysis is a 2011 study on the added value of fuel cells 9
prepared by the National Fuel Cell Research Center at the University of 10
California, Irvine (the "NFCRC Report").22 The NFCRC Report evaluates fuel 11
cells from a wide range of data, including the additional value from avoided 12
health costs and emissions that were excluded in the Lazard Report. Regarding 13
efficacy of flow batteries, I am relying on a 2014 study comparing the 14
capabilities of flow battery energy storage against gas turbine peaker plants.23 15
16
Q: What is the conclusion of the Lazard Report with respect to the relative cost 17
advantages of fuel cells versus traditional gas peakers? 18
A: The Lazard Report confirms that in the range of LCOE values provided to 19
various technologies, the highest unsubsidized LCOE value assigned to fuel cells 20 20 See, Lazard Ltd., Lazard’s Levelized Cost Of Energy Analysis — Version 8.0, Sept. 2014.
Lazard has been publishing versions of this study since 2008 through its Global Power, Energy & Infrastructure Group. This group is active in all areas of the traditional and alternative energy industries, including regulated utilities, independent power producers, advanced transportation technologies, renewable energy technologies, meters, smart grid and energy efficiency technologies, and infrastructure.
21 See, e.g., "Lazard Releases New Levelized Cost of Energy Analysis,” Business Wire, September 18, 2014. See also, coverage of and references to the Lazard Report in The Financial Times, the Institute of Electrical and Electronics Engineers website, and Energy Industry Today.
22 National Fuel Cell Research Center, “Build-Up of Distributed Fuel Cell Value in California: 2011 Update / Background and Methodology,” University of California, Irvine, July 24, 2011.
23 Lyons, Chet, “Guide To Procurement of Flexible Peaking Capacity: Energy Storage or Combustion Turbines?,” Energy Strategies Group, October 7, 2014, p. 14.
24
($176) is less than the lowest such value assigned to gas peaker plants ($179).24 1
Also, when calculating the average unsubsidized LCOE of these technologies 2
based on the ranges provided in the Lazard Report, the average unsubsidized 3
LCOE of fuel cells ($145.50 = the average of $115 and $176) is $59 lower 4
(28.85%) than the unsubsidized LCOE to build a natural gas peaker plant 5
($204.50 = the average of $179 and $230) as proposed by SCE in this 6
Application. 7
8
Furthermore, after incorporating the benefit calculations of avoided health costs 9
and emissions provided in the NFCRC Report, the savings for adopting fuel cell 10
technology over a gas peaking plant increases to 55.89%, for a net LCOE of 11
$90.20/MWh.25 12
13
Q: Would you please describe some of the key assumptions underlying, and the 14
data supporting, this conclusion of the Lazard Report? 15
A: To quote from the Lazard Report itself, "[I]nputs were developed with a leading 16
consulting and engineering firm to the Power & Energy Industry, augmented 17
with Lazard’s commercial knowledge where relevant. This study (as well as 18
previous versions) has benefitted from additional input from a wide variety of 19
industry participants.”26 20
21
It is important to note that the Lazard Report excludes a number of other 22
important factors that would have produced an even more lopsided LCOE cost 23
advantage for fuel cells over gas turbines. Again, to quote from the report itself: 24
25
24 Lazard Report, Unsubsidized Levelized Cost of Energy Comparison, at p. 2. 25 See Table A in Attachment B, attached hereto. 26 Lazard Report, Summary Considerations, at p. 19.
25
"Other factors would also have a potentially significant effect on 1
the results contained herein, but have not been examined in the 2
scope of this current analysis. These additional factors, among 3
others, could include: capacity value vs. energy value; stranded 4
costs related to distributed generation or otherwise; network 5
upgrade, transmission or congestion costs; integration costs; and 6
costs of complying with various environmental regulations (e.g., 7
carbon emissions offsets, emissions control systems). The analysis 8
also does not address potential social and environmental 9
externalities, including, for example, the social costs and rate 10
consequences for those who cannot afford distribution generation 11
solutions, as well as the long-term residual and societal 12
consequences of various conventional generation technologies that 13
are difficult to measure (e.g., nuclear waste disposal, 14
environmental impacts, etc.)"27 [Emphasis added.] 15
16
Q: What are some of the other key assumptions used in the Lazard Report that 17
yield cost advantages for fuel cells over traditional gas turbines? 18
A: Lazard's assumptions include the following: 19
1. Net Facility Output. Lazard’s assumption for the output of fuel cell plants is 20
based on a small facility of 2.4MW (with an assumed average capital cost of 21
$5,650/KW), whereas the assumed size of gas peaking plants are in a range 22
from 103MW to 216MW (with an assumed average capital cost of 23
$900/KW). However, applying routine economies of scale that have been 24
achieved whenever "beta" technologies have become mass produced, it can 25
reasonably be assumed that the cost/KW of constructing a fuel cell plant of a 26
size similar to the assumed peaker plant (103-216MW) would drastically 27
27 See, Lazard Report, Introduction, at p. 1.
26
reduce fuel cell capital costs to a range that is more in line with the capital 1
costs associated with constructing a peaker plant. 2
2. CO2 Emissions. Both fuel cell and peaker plants are assumed to run on 3
natural gas. While peaker plants are assigned a fixed value of 117 4
lb/MMBtu, Lazard assigns fuel cells a range of 0 to 117 lb/MMBtu, 5
acknowledging that CO2 emissions from a fuel cell facility will ultimately lie 6
somewhere between the two extremes. 7
3. Construction Time (Months). Lazard assumes a 3-month construction period 8
for a 2.4MW fuel cell plant and a 35-month construction period for a peaker 9
plant. Confirming this timeline is Fuel Cell Energy’s 15MW plant in 10
Bridgeport, CT, which was designed and built within one year.28 While 11
constructing a fuel cell plant equivalent in size to a 103-216MW peaker plant 12
would undoubtedly take longer, most if not all of the additional build-out 13
associated with construction of a larger plant could occur simultaneously, 14
keeping project completion well below the 35-month time period ascribed by 15
Lazard for peaker plants. Thus, there is a significant public benefit in relying 16
on fuel cells and flow batteries, each of which can be constructed on a 17
modular basis, rather than on large gas turbines, because given the local 18
capacity requirements created by the shutdown of the San Onofre Nuclear 19
Power Plant ("SONGS") and numerous “once through cooling” (“OTC”) 20
facilities located throughout California, the installation of modular fuel cells 21
and flow batteries will be able to meet that need much more quickly than gas 22
turbines. 23
4. Heat Rate (Btu/KWh). Peaker plants are assigned a range of 9,000 to 10,300 24
Btu/KWh, while fuel cell plants operate at a much lower range of 6,600 to 25
7,260 Btu/KWh. Standard designs for stationary fuel cell facilities 26
incorporate combined cooling and/or heating and power (“CCHP”) features 27
28 “Fuel Cell Park Makes Polluted Plot into Clean Energy Exemplar,” Hartford Courant, January 2,
2014.
27
that increase overall efficiency by using the heat created during the catalytic 1
process that takes place within the fuel cell to cogenerate direct heating, 2
cooling (through the use of absorption chillers) and/or electricity. 3
4
Q: Could the fuel cells analyzed in the Lazard Report run on renewable 5
hydrogen rather than on natural gas? 6
A: Yes. 7
8
Q: How would that work? 9
A: Solar and other forms of renewable energy can be used to electrolyze water 10
(including gray water byproduct from waste treatment facilities) into hydrogen as 11
a feedstock for fuel cell plants. A hybrid power plant utilizing the combination 12
of fuel cells properly modified to run on hydrogen, and a flow battery component 13
able to store surplus renewable energy for dispatchability and phase and voltage 14
regulation services, would be able to provide both baseload and peaking 15
functions to address grid load fluctuations relying entirely on electrons generated 16
from renewable resources. This flexible ability to transition to hydrogen is 17
unique to fuel cell technology and is lost if conventional gas-fired technology is 18
chosen to address grid fluctuations. 19
20
Q: You stated that the Lazard Report excluded from its analysis a 21
consideration of various societal benefits, which would tilt their analysis 22
even further in favor of fuel cells over conventional gas turbines. Is there a 23
way to take such other factors into account? 24
A: Yes. 25
Q: How would that be done? 26
A: As noted above, the analysis in the Lazard Report does not address “long-term 27
residual and societal consequences of various conventional generation 28
technologies that are difficult to measure.” However, the NFCRC Report 29
28
aggregated the various benefits associated with fuel cell technology to calculate 1
the additional value that can be realized by ratepayers by using fuel cells as 2
opposed to conventional gas-fired facilities. Averaging the range of values from 3
health benefits and avoided emissions (CO2, NOX, SOX, VOC, PM10 and 4
PM2.5) associated with the use of fuel cells that is provided in the NFCRC 5
Report,29 I calculated the additional fuel cell value from these benefits and found 6
that in a scenario with a fuel cell plant operating on natural gas and using CCHP 7
efficiency measures during 75% of its operations, the average estimated benefit 8
(or cost reduction) from avoided health costs and emission was $55.30/MWh. 9
Subtracting this estimated benefit from Lazard’s average LCOE of $145.50, the 10
net cost of using fuel cells was $90.20/MWh, which is over 126% less than the 11
$204.50/MWh average LCOE assigned to gas peaker plants in the Lazard 12
Report.30 13
14
VI. OTHER ENVIRONMENTAL BENEFITS OF THE ACADEMY'S 15
DISTRIBUTED ALTERNATIVE PROJECT 16
17
Q: Are there other economic and environmental benefits of using fuel cells and 18
batteries as opposed to conventional gas-fired turbines? 19
A: There certainly are. Such benefits include the following: 20
a. Flexibility to Further Reduce GHG Emissions Using Renewable Feedstocks 21
(Hydrogen and Biofuels). Over its 25- to 30-year lifespan, a natural gas 22
peaking plant will operate primarily on one type of fuel: natural gas extracted 23
using fracking operations that emit methane (a greenhouse gas many 24
multiples of times more potent than CO2 on initial release), consume precious 25
water supplies and rely on a mixture of chemicals that invariably enters our 26
29 NFCRC Report, at p. 4. 30 See Table B in Attachment B, attached hereto.
29
groundwater reserves. By contrast, developing fuel cell facilities in order to 1
meet the needs that traditional gas turbines can provide, leaves the door open 2
for a transition to 100% renewable fuel in the form of hydrogen produced 3
from renewable sources and gray water or biogas generated from waste 4
treatment facilities. Combined with CCHP co-generation from generated 5
heat, fuel cell plants offer the highest electrical efficiency of any comparable 6
system, resulting in more efficient fuel use and reduced carbon signature with 7
the lowest environmental impact of any power generation system using 8
similar fuels. 9
b. Modularity Creates Ability to Provide Both Baseload and Peaking Services. 10
Capable of using natural gas, renewable biogas and (when properly modified) 11
hydrogen feedstocks, a fuel cell plant is superior to conventional gas peaking 12
facilities in that a fuel cell plant can be operated as a source of baseload 13
power, or in tandem with battery facilities that can serve as phase/voltage 14
regulators to level energy fluctuations and address peaking concerns during 15
the late afternoon/early evening hours. Such a potent combination 16
dramatically enhances the ability of distributed generation and storage to 17
balance renewable generation within microgrid systems in a manner far 18
superior to large, noisy gas turbine peaker plants that emit hazardous 19
particulates to the surrounding community. 20
c. Greater Reliability and Lower Maintenance Costs. Due to the 21
electrochemical nature of both the fuel cell and flow battery power generating 22
process which involves fewer moving parts, a hybrid fuel cell/flow battery 23
facility is more durable, reliable and can be maintained and operated with less 24
oversight than traditional gas-fired facilities. 25
d. Modularity, Small Footprint and Quiet Acoustics of Fuel Cell and Battery 26
Plants Allow for Both Centralized and Distributed Deployment. Unlike gas-27
fired facilities, whose loud acoustic signature requires either development in 28
sparsely populated areas or limited operating hours, the compact design and 29
30
extremely quiet acoustics of fuel cell and battery plants allows for siting at or 1
near the point of use in densely populated areas. These non-intrusive 2
characteristics allow fuel cell and battery systems to be sited and installed in a 3
relatively short period of time, and the costs associated with long lead times 4
for siting, permitting and construction are largely avoided. Low emissions 5
and quiet operation also mean that fuel cell and flow battery systems can be 6
rapidly deployed with little to no “NIMBY” opposition from the local 7
community. 8
e. Co-Production of Hydrogen. Fuel Cell Plants using biogas or natural gas 9
feedstocks emit a syngas effluent containing a hydrogen component that can 10
be extracted and stored for re-use during off-peak generation periods (thereby 11
further increasing fuel cell efficiencies) or sold to refueling stations as a 12
secondary revenue stream. 13
14
Q: Coming back to the subject of carbon, are there social costs that have 15
traditionally not been valued but that should be imputed to facilities like 16
gas-fired peakers? 17
A: Yes. The Fact Sheet issued by the U.S. Environmental Protection Agency 18
("EPA") on the Social Cost of Carbon ("SCC") acknowledges that “[t]he SCC is 19
meant to be a comprehensive estimate of climate change damages and includes, 20
among other things, changes in net agricultural productivity, human health, and 21
property damages from increased flood risk. However, it does not currently 22
include all important damages. As noted by the IPCC Fourth Assessment 23
Report, it is 'very likely that [the SCC] underestimates' the damages [emphasis 24
added]. The models used to develop SCC estimates do not currently include all 25
of the important physical, ecological, and economic impacts of climate change 26
recognized in the climate change literature because of a lack of precise 27
information on the nature of damages and because the science incorporated into 28
31
these models naturally lags behind the most recent research. Nonetheless, the 1
SCC is a useful measure to assess the benefits of CO2 reductions."31 2
3
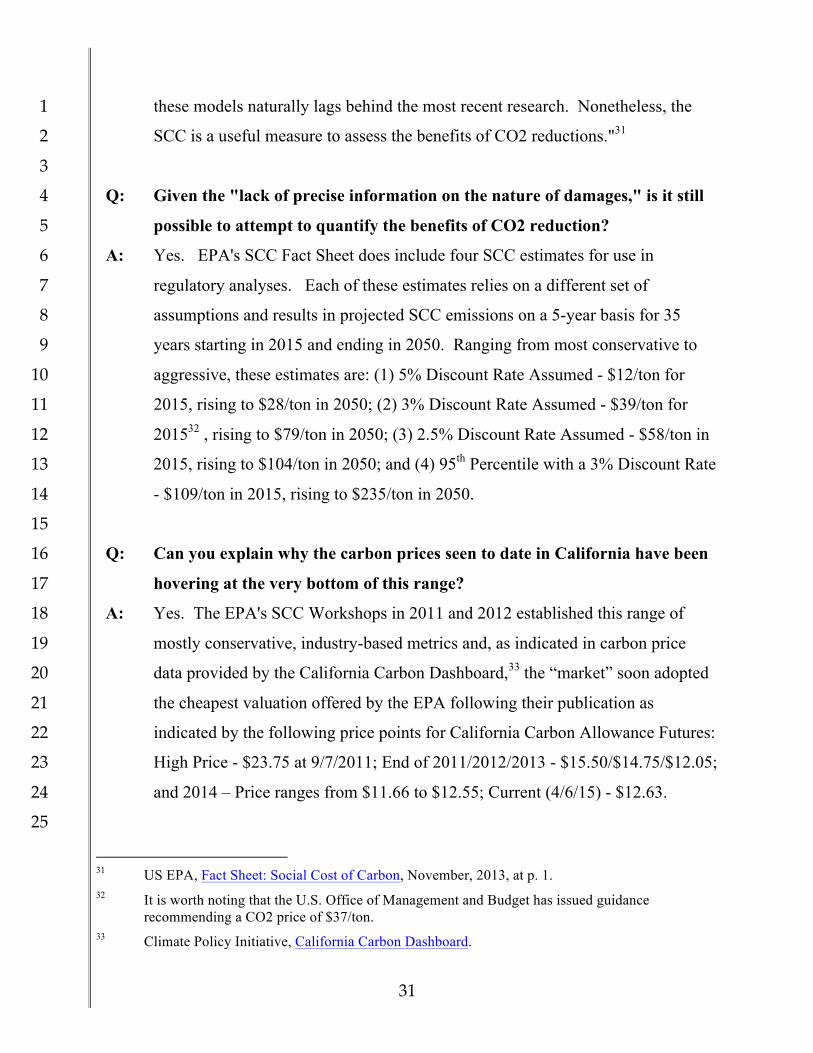
Q: Given the "lack of precise information on the nature of damages," is it still 4
possible to attempt to quantify the benefits of CO2 reduction? 5
A: Yes. EPA's SCC Fact Sheet does include four SCC estimates for use in 6
regulatory analyses. Each of these estimates relies on a different set of 7
assumptions and results in projected SCC emissions on a 5-year basis for 35 8
years starting in 2015 and ending in 2050. Ranging from most conservative to 9
aggressive, these estimates are: (1) 5% Discount Rate Assumed - $12/ton for 10
2015, rising to $28/ton in 2050; (2) 3% Discount Rate Assumed - $39/ton for 11
201532 , rising to $79/ton in 2050; (3) 2.5% Discount Rate Assumed - $58/ton in 12
2015, rising to $104/ton in 2050; and (4) 95th Percentile with a 3% Discount Rate 13
- $109/ton in 2015, rising to $235/ton in 2050. 14
15
Q: Can you explain why the carbon prices seen to date in California have been 16
hovering at the very bottom of this range? 17
A: Yes. The EPA's SCC Workshops in 2011 and 2012 established this range of 18
mostly conservative, industry-based metrics and, as indicated in carbon price 19
data provided by the California Carbon Dashboard,33 the “market” soon adopted 20
the cheapest valuation offered by the EPA following their publication as 21
indicated by the following price points for California Carbon Allowance Futures: 22
High Price - $23.75 at 9/7/2011; End of 2011/2012/2013 - $15.50/$14.75/$12.05; 23
and 2014 – Price ranges from $11.66 to $12.55; Current (4/6/15) - $12.63. 24
25
31 US EPA, Fact Sheet: Social Cost of Carbon, November, 2013, at p. 1. 32 It is worth noting that the U.S. Office of Management and Budget has issued guidance
recommending a CO2 price of $37/ton. 33 Climate Policy Initiative, California Carbon Dashboard.
32
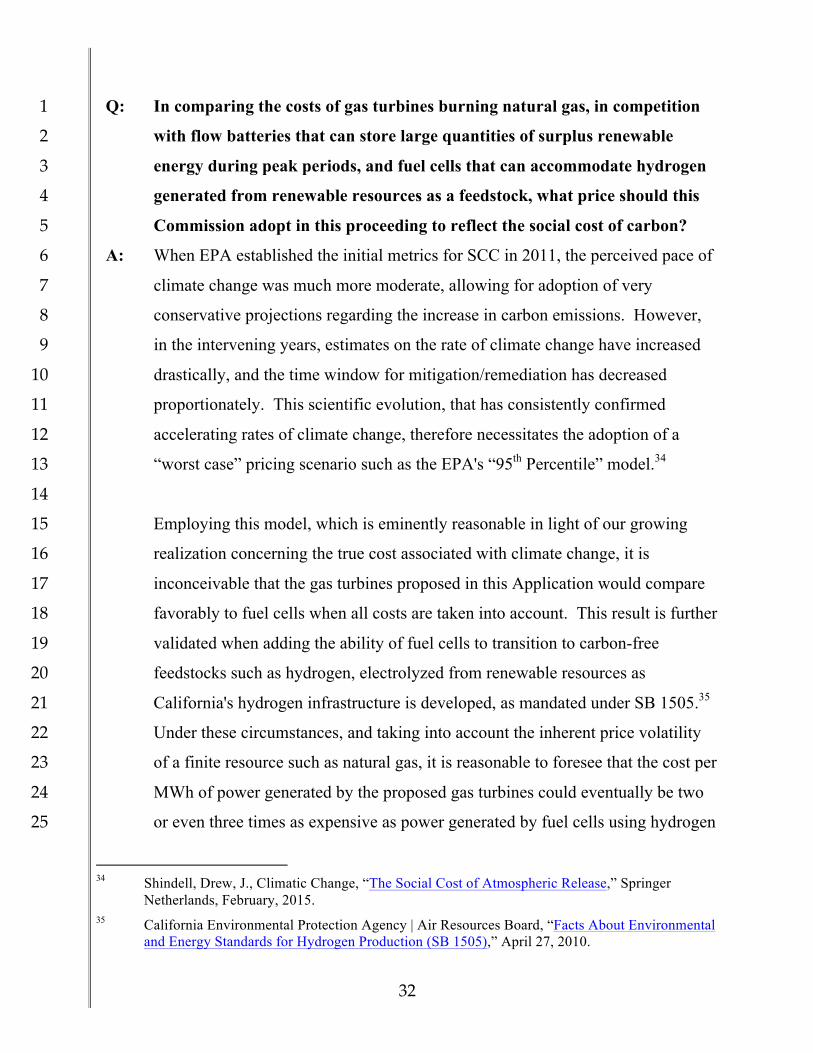
Q: In comparing the costs of gas turbines burning natural gas, in competition 1
with flow batteries that can store large quantities of surplus renewable 2
energy during peak periods, and fuel cells that can accommodate hydrogen 3
generated from renewable resources as a feedstock, what price should this 4
Commission adopt in this proceeding to reflect the social cost of carbon? 5
A: When EPA established the initial metrics for SCC in 2011, the perceived pace of 6
climate change was much more moderate, allowing for adoption of very 7
conservative projections regarding the increase in carbon emissions. However, 8
in the intervening years, estimates on the rate of climate change have increased 9
drastically, and the time window for mitigation/remediation has decreased 10
proportionately. This scientific evolution, that has consistently confirmed 11
accelerating rates of climate change, therefore necessitates the adoption of a 12
“worst case” pricing scenario such as the EPA's “95th Percentile” model.34 13
14
Employing this model, which is eminently reasonable in light of our growing 15
realization concerning the true cost associated with climate change, it is 16
inconceivable that the gas turbines proposed in this Application would compare 17
favorably to fuel cells when all costs are taken into account. This result is further 18
validated when adding the ability of fuel cells to transition to carbon-free 19
feedstocks such as hydrogen, electrolyzed from renewable resources as 20
California's hydrogen infrastructure is developed, as mandated under SB 1505.35 21
Under these circumstances, and taking into account the inherent price volatility 22
of a finite resource such as natural gas, it is reasonable to foresee that the cost per 23
MWh of power generated by the proposed gas turbines could eventually be two 24
or even three times as expensive as power generated by fuel cells using hydrogen 25
34 Shindell, Drew, J., Climatic Change, “The Social Cost of Atmospheric Release,” Springer
Netherlands, February, 2015. 35 California Environmental Protection Agency | Air Resources Board, “Facts About Environmental
and Energy Standards for Hydrogen Production (SB 1505),” April 27, 2010.
33
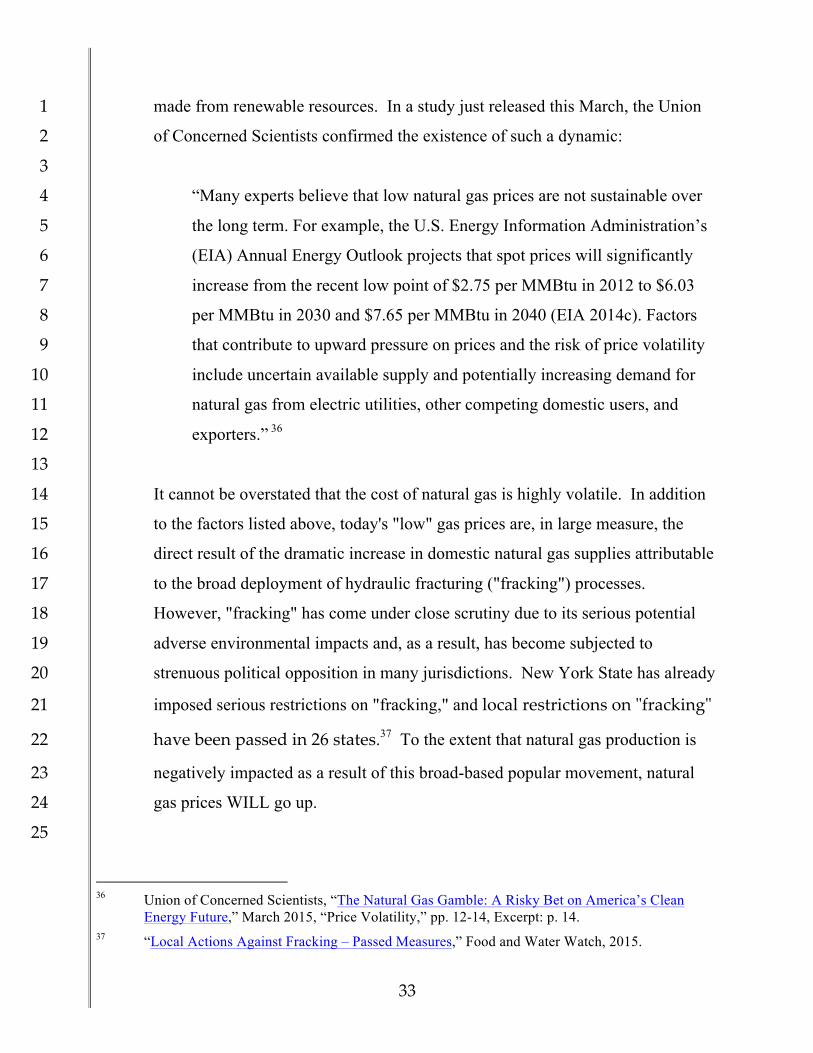
made from renewable resources. In a study just released this March, the Union 1
of Concerned Scientists confirmed the existence of such a dynamic: 2
3
“Many experts believe that low natural gas prices are not sustainable over 4
the long term. For example, the U.S. Energy Information Administration’s 5
(EIA) Annual Energy Outlook projects that spot prices will significantly 6
increase from the recent low point of $2.75 per MMBtu in 2012 to $6.03 7
per MMBtu in 2030 and $7.65 per MMBtu in 2040 (EIA 2014c). Factors 8
that contribute to upward pressure on prices and the risk of price volatility 9
include uncertain available supply and potentially increasing demand for 10
natural gas from electric utilities, other competing domestic users, and 11
exporters.” 36 12
13
It cannot be overstated that the cost of natural gas is highly volatile. In addition 14
to the factors listed above, today's "low" gas prices are, in large measure, the 15
direct result of the dramatic increase in domestic natural gas supplies attributable 16
to the broad deployment of hydraulic fracturing ("fracking") processes. 17
However, "fracking" has come under close scrutiny due to its serious potential 18
adverse environmental impacts and, as a result, has become subjected to 19
strenuous political opposition in many jurisdictions. New York State has already 20
imposed serious restrictions on "fracking," and local restrictions on "ʺfracking"ʺ 21
have been passed in 26 states.37 To the extent that natural gas production is 22
negatively impacted as a result of this broad-based popular movement, natural 23
gas prices WILL go up. 24
25
36 Union of Concerned Scientists, “The Natural Gas Gamble: A Risky Bet on America’s Clean
Energy Future,” March 2015, “Price Volatility,” pp. 12-14, Excerpt: p. 14. 37 “Local Actions Against Fracking – Passed Measures,” Food and Water Watch, 2015.
34
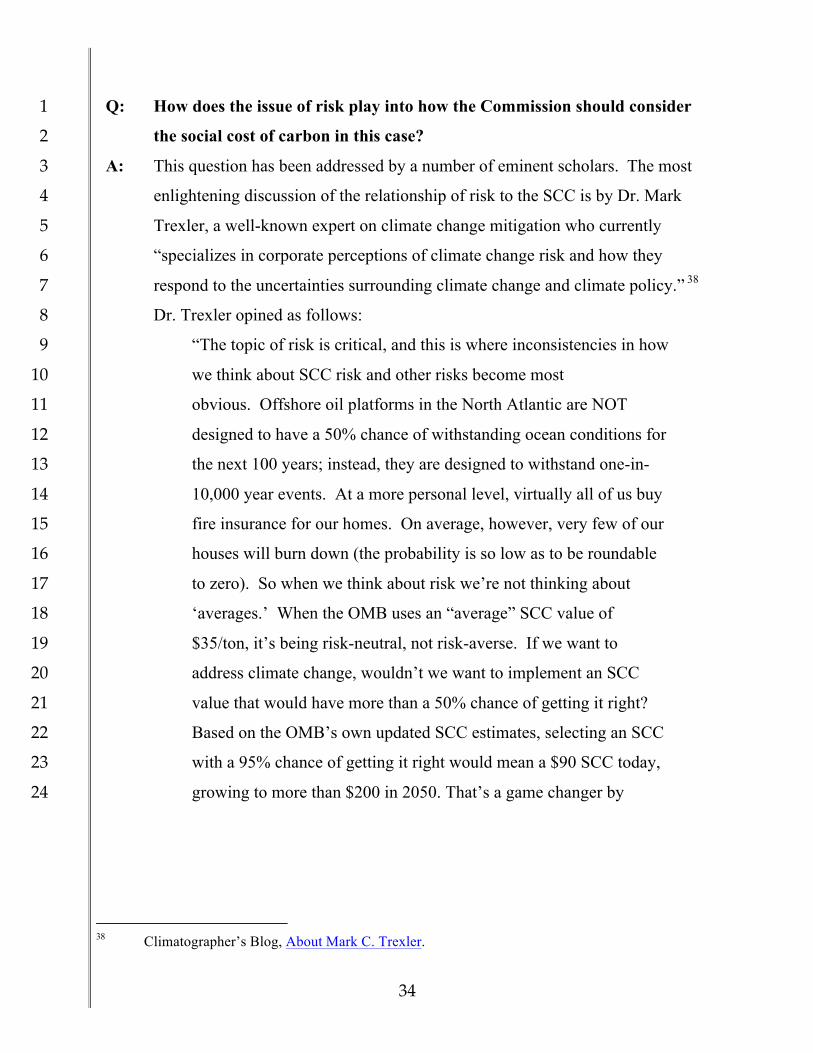
Q: How does the issue of risk play into how the Commission should consider 1
the social cost of carbon in this case? 2
A: This question has been addressed by a number of eminent scholars. The most 3
enlightening discussion of the relationship of risk to the SCC is by Dr. Mark 4
Trexler, a well-known expert on climate change mitigation who currently 5
“specializes in corporate perceptions of climate change risk and how they 6
respond to the uncertainties surrounding climate change and climate policy.” 38 7
Dr. Trexler opined as follows: 8
“The topic of risk is critical, and this is where inconsistencies in how 9
we think about SCC risk and other risks become most 10
obvious. Offshore oil platforms in the North Atlantic are NOT 11
designed to have a 50% chance of withstanding ocean conditions for 12
the next 100 years; instead, they are designed to withstand one-in-13
10,000 year events. At a more personal level, virtually all of us buy 14
fire insurance for our homes. On average, however, very few of our 15
houses will burn down (the probability is so low as to be roundable 16
to zero). So when we think about risk we’re not thinking about 17
‘averages.’ When the OMB uses an “average” SCC value of 18
$35/ton, it’s being risk-neutral, not risk-averse. If we want to 19
address climate change, wouldn’t we want to implement an SCC 20
value that would have more than a 50% chance of getting it right? 21
Based on the OMB’s own updated SCC estimates, selecting an SCC 22
with a 95% chance of getting it right would mean a $90 SCC today, 23
growing to more than $200 in 2050. That’s a game changer by 24
38 Climatographer’s Blog, About Mark C. Trexler.
35
anyone’s measure, and many observers would argue even that figure 1
is too low due to inadequately quantified climate risks.”39 2
3
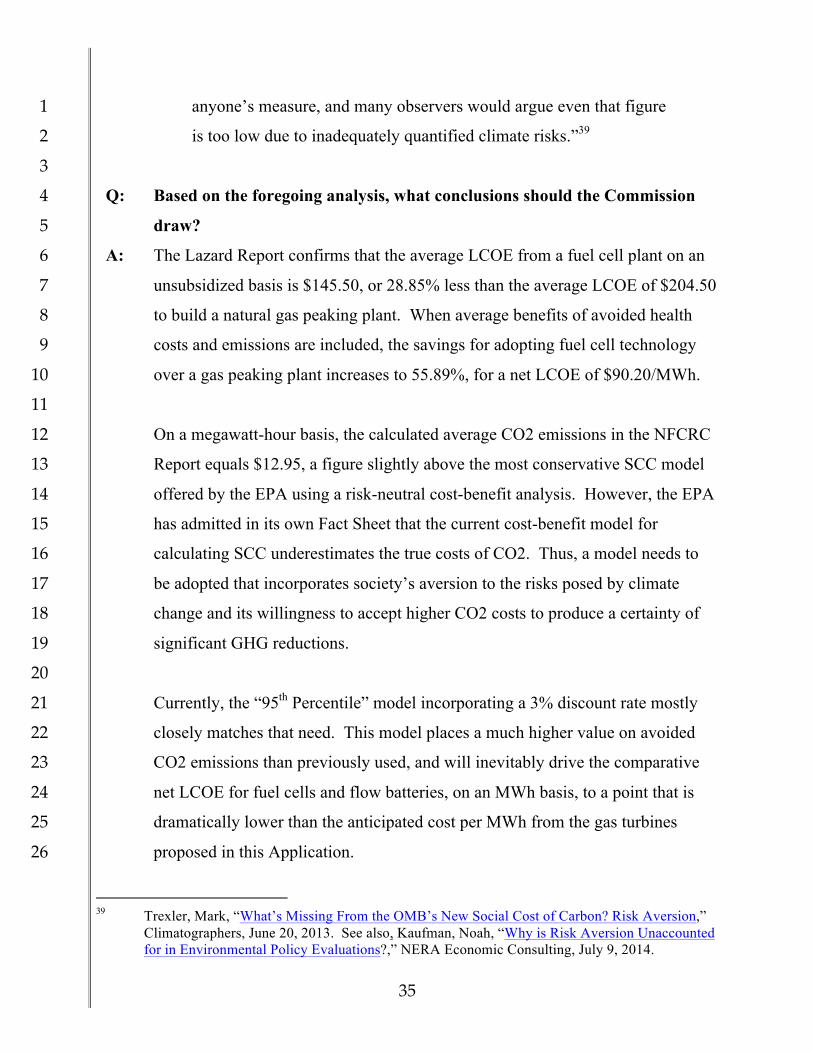
Q: Based on the foregoing analysis, what conclusions should the Commission 4
draw? 5
A: The Lazard Report confirms that the average LCOE from a fuel cell plant on an 6
unsubsidized basis is $145.50, or 28.85% less than the average LCOE of $204.50 7
to build a natural gas peaking plant. When average benefits of avoided health 8
costs and emissions are included, the savings for adopting fuel cell technology 9
over a gas peaking plant increases to 55.89%, for a net LCOE of $90.20/MWh. 10
11
On a megawatt-hour basis, the calculated average CO2 emissions in the NFCRC 12
Report equals $12.95, a figure slightly above the most conservative SCC model 13
offered by the EPA using a risk-neutral cost-benefit analysis. However, the EPA 14
has admitted in its own Fact Sheet that the current cost-benefit model for 15
calculating SCC underestimates the true costs of CO2. Thus, a model needs to 16
be adopted that incorporates society’s aversion to the risks posed by climate 17
change and its willingness to accept higher CO2 costs to produce a certainty of 18
significant GHG reductions. 19
20
Currently, the “95th Percentile” model incorporating a 3% discount rate mostly 21
closely matches that need. This model places a much higher value on avoided 22
CO2 emissions than previously used, and will inevitably drive the comparative 23
net LCOE for fuel cells and flow batteries, on an MWh basis, to a point that is 24
dramatically lower than the anticipated cost per MWh from the gas turbines 25
proposed in this Application. 26
39 Trexler, Mark, “What’s Missing From the OMB’s New Social Cost of Carbon? Risk Aversion,”
Climatographers, June 20, 2013. See also, Kaufman, Noah, “Why is Risk Aversion Unaccounted for in Environmental Policy Evaluations?,” NERA Economic Consulting, July 9, 2014.
36
1
Q: Are there additional steps that the Commission should take to explore the 2
viability of promising clean energy technologies such as fuel cells? 3
A: Yes. I believe that there is ample time available for the Commission to conduct 4
an comprehensive comparative study of fuel cells and flow batteries as flexible, 5
adaptable technologies that can operate at a level of performance equivalent or 6
superior to natural gas peaker plants, while also retaining the ability to fully 7
integrate with a new, distributed carbon-free energy system based primarily on 8
renewable energy. 9
10
Although the World Business Academy does not expect the Commission to 11
conduct a holistic study of the relative "big picture" economics of fuel cells and 12
batteries versus traditional gas-fired resources in the context of this proceeding, 13
the Academy does urge the Commission to conduct or commission such a study 14
in the near future, either as part of the Commission's Long-Term Procurement 15
Planning process or as part of a larger inter-agency effort to address California's 16
clean energy goals. With such a study in hand, the Commission will be in a 17
much stronger position to direct its jurisdictional utilities to put an end to the 18
ongoing, environmentally harmful practice of proposing the construction of new 19
fossil-fired plants to meet system needs for local capacity and instead look for 20
combinations of preferred resources to facilitate the integration of ever-21
increasing amounts of variable renewable generation. 22
23
Furthermore, substituting fuel cells and batteries for conventional gas turbines 24
will ultimately create a distinct pathway for the development of a renewable 25
hydrogen economy, and creates additional demand for “green” hydrogen in 26
tandem with the emerging market for fuel cell electric cars ("FCEVs") currently 27
under development in California. As a secondary FCEV market develops in 28
California, the sale of renewable hydrogen to refueling stations (as mandated by 29
37
SB 1505 to equal one-third of all hydrogen produced for that purpose40) will 1
increase demand and build economies of scale that will lower the cost of 2
hydrogen. As the price of hydrogen becomes more affordable, fuel cell plants can 3
incrementally transition to 100% carbon-free operation. 4
5
If the Commission allows the proposed peaker facilities to move forward without 6
serious consideration of alternative technologies that are environmentally 7
superior in all respects and that will ultimately be a better deal for ratepayers, it 8
will have sentenced Ellwood and Oxnard citizens to at least 20 years of living 9
next to large, noisy, highly visible centralized plants that have no prospects for 10
significantly reducing carbon and particulate emissions during its useful lifespan. 11
12
The Commission therefore needs to recognize that by choosing fuel cell 13
technology and various Preferred Resources to meet the identified LCR need, it 14
will dramatically enhance the ability of the citizens living within the Moorpark 15
Sub-Area to locate distributed power generated by quiet fuel cell and battery 16
plants, housed in unobtrusive structures arranged in a wide variety of 17
configurations that maximize energy reliability and resilience while also yielding 18
these facilities virtually invisible to the surrounding community. 19
20
Moreover, such a choice will significantly expand the flexibility of SCE to meet 21
its local reliability needs in a much more flexible manner than would be the case 22
if it is forced to rely for 20+ years of traditional gas peakers. Rather, by 23
strategically distributing some or all of the power infrastructure, which a switch 24
to fuel cells and batteries to meet the identified LCR need will facilitate, SCE 25
and its PPTA partner will greatly enhance the resilience and reliability of the 26
40 California Environmental Protection Agency | Air Resources Board, “Facts About Environmental
and Energy Standards for Hydrogen Production (SB 1505),” April 27, 2010.

38
local power grid while taking up the historic mantle of leading the state to the 1
renewable energy economy of the future. 2
3
Q: Does this conclude your prepared testimony? 4
A: Yes, it does.5
ATTACHMENT A
CURRICULUM VITAE OF ROBERT PERRY DIRECTOR OF ENERGY RESEARCH OF THE
WORLD BUSINESS ACADEMY
Robert Perry Professional Expertise: Mr. Perry currently serves as the Director of Energy Research for the World Business Academy, a non-profit business think tank, action incubator and network of business and thought leaders, whose mission is to inspire business to assume responsibility for the whole of society and assist those in business who share our values. As Director of Energy Research, Mr. Perry is the primary source for research and analytical support services in connection with the Academy’s Safe Energy Project, whose objectives are to (1) rid the state of California of nuclear power plants, (2) stand up for ratepayers’ interests in proceedings before the California Public Utilities Commission and (3) to introduce and champion a plan for the conversion to 100% renewable energy in California called The Clean Energy “Moonshot” Project, to create a replicable renewable energy model for the world. In his capacity as Director of Energy Research, Mr. Perry performs a wide range of general, technical and financial research and analysis concerning issues underlying all aspects of the Safe Energy Project, including but not limited to current and emerging energy generation, transmission and distribution, microgrid, and storage systems as they relate to the development of an integrated system of distributed energy capable of operating entirely on renewable energy, either directly or indirectly through a storage medium such as hydrogen. Prior to his tenure at the World Business Academy, Mr. Perry served as the Executive Assistant to the CEO of Ameristar Casinos, a publicly-held company operating a chain of regional casinos. As Executive Assistant, Mr. Perry performed a wide range of analytical functions, including but not limited to preparation of annual regulatory filings with state gaming authorities, distribution of a daily report summarizing industry media and financial analysis, review and analysis of internal financial reports and periodic securities filings, and weekly audit control analysis reports. Prior to serving at Ameristar, Mr. Perry worked for 20 years with a variety of law firms as a corporate, securities and real estate legal assistant. During that time, Mr. Perry performed due diligence research and drafted primary and ancillary documents relating to wide range of business transactions (mergers and acquisitions, real estate portfolio development and management, venture capital financings and initial/secondary private and public offerings). A subset of these skills also included the preparation and review of budgetary reports, projections, market analyses and investment materials, including all relevant compliance documentation required on state and federal levels.
Education:
Paralegal Certification in Corporate, Securities and Real Estate Specialties, University of San Diego, 1983
Bachelor of Arts Degree in Liberal Studies, with emphases in History, Music and Political Science, University of California, Santa Barbara, 1983

ATTACHMENT B
TABLES
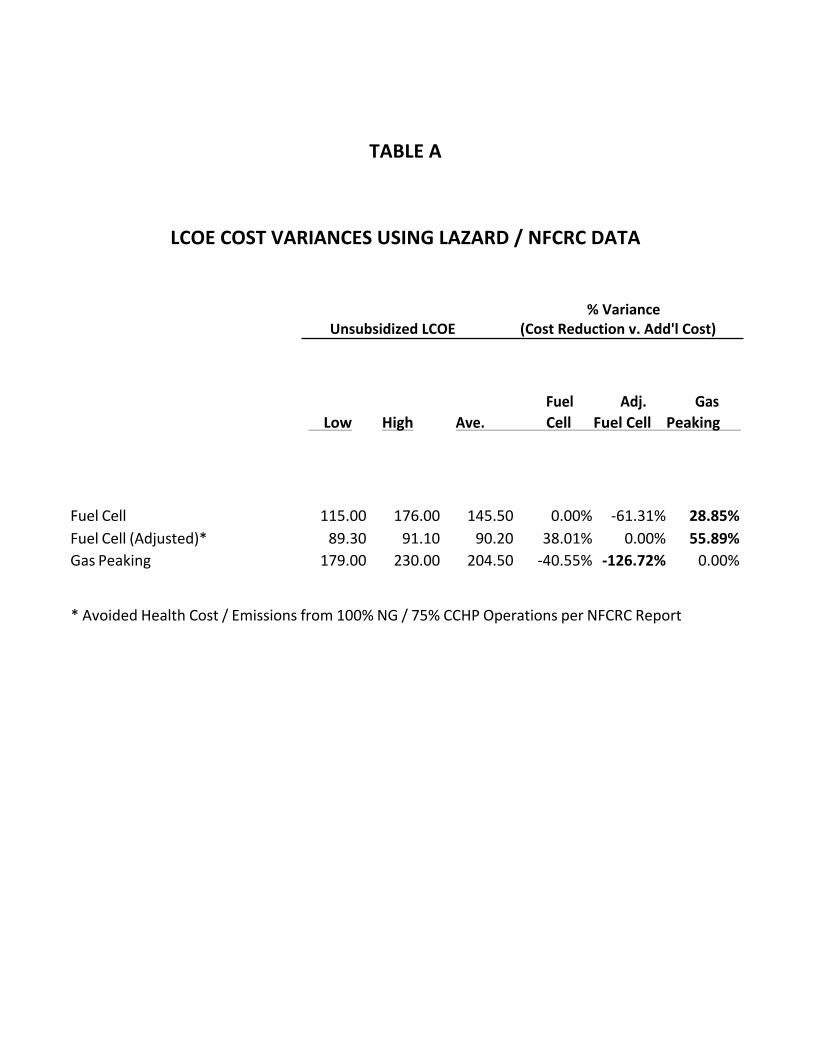
TABLE A
LCOE COST VARIANCES USING LAZARD / NFCRC DATA
% Variance Unsubsidized LCOE (Cost Reduction v. Add'l Cost)
Fuel Adj. Gas Low High Ave. Cell Fuel Cell Peaking
Fuel Cell 115.00 176.00 145.50 0.00% -‐61.31% 28.85% Fuel Cell (Adjusted)* 89.30 91.10 90.20 38.01% 0.00% 55.89% Gas Peaking 179.00 230.00 204.50 -‐40.55% -‐126.72% 0.00%
* Avoided Health Cost / Emissions from 100% NG / 75% CCHP Operations per NFCRC Report
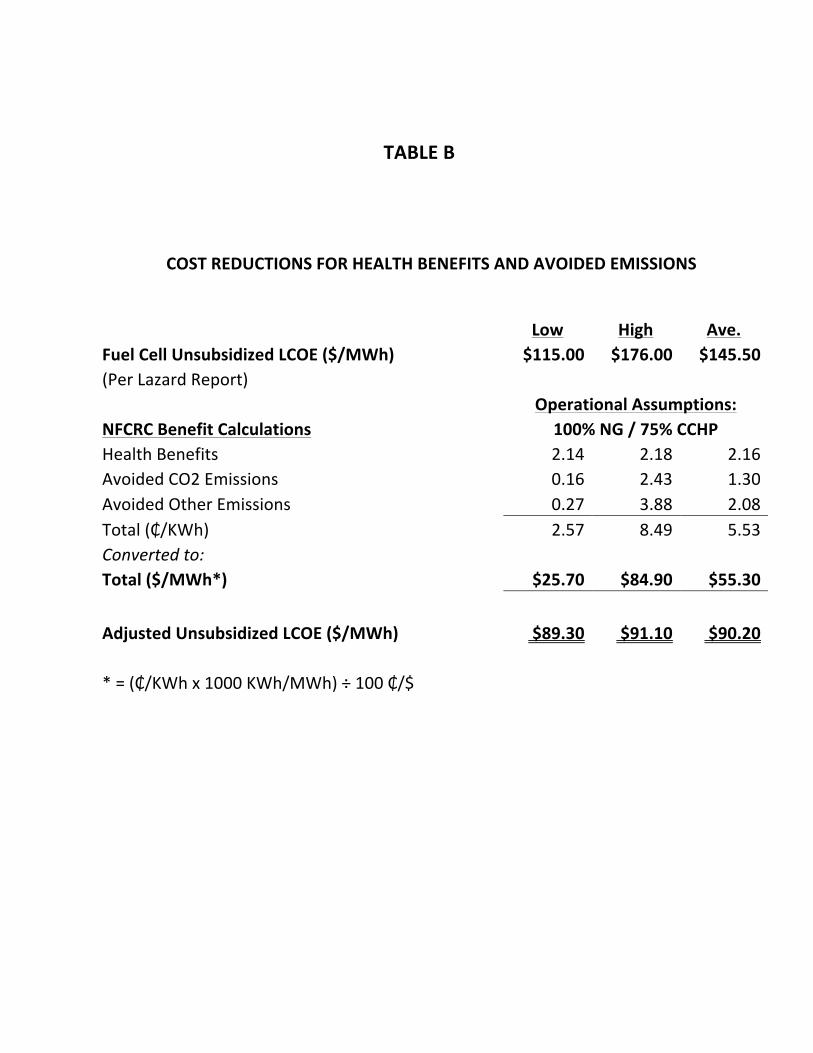
TABLE B
COST REDUCTIONS FOR HEALTH BENEFITS AND AVOIDED EMISSIONS
Low High Ave.
Fuel Cell Unsubsidized LCOE ($/MWh) $115.00 $176.00 $145.50 (Per Lazard Report)
Operational Assumptions: NFCRC Benefit Calculations 100% NG / 75% CCHP Health Benefits 2.14 2.18 2.16 Avoided CO2 Emissions 0.16 2.43 1.30 Avoided Other Emissions 0.27 3.88 2.08 Total (₵/KWh) 2.57 8.49 5.53 Converted to:
Total ($/MWh*) $25.70 $84.90 $55.30
Adjusted Unsubsidized LCOE ($/MWh) $89.30 $91.10 $90.20
* = (₵/KWh x 1000 KWh/MWh) ÷ 100 ₵/$
ATTACHMENT C
AERIAL PHOTOS AND ESTIMATES
REGARDING SOLAR PV CAPACITY
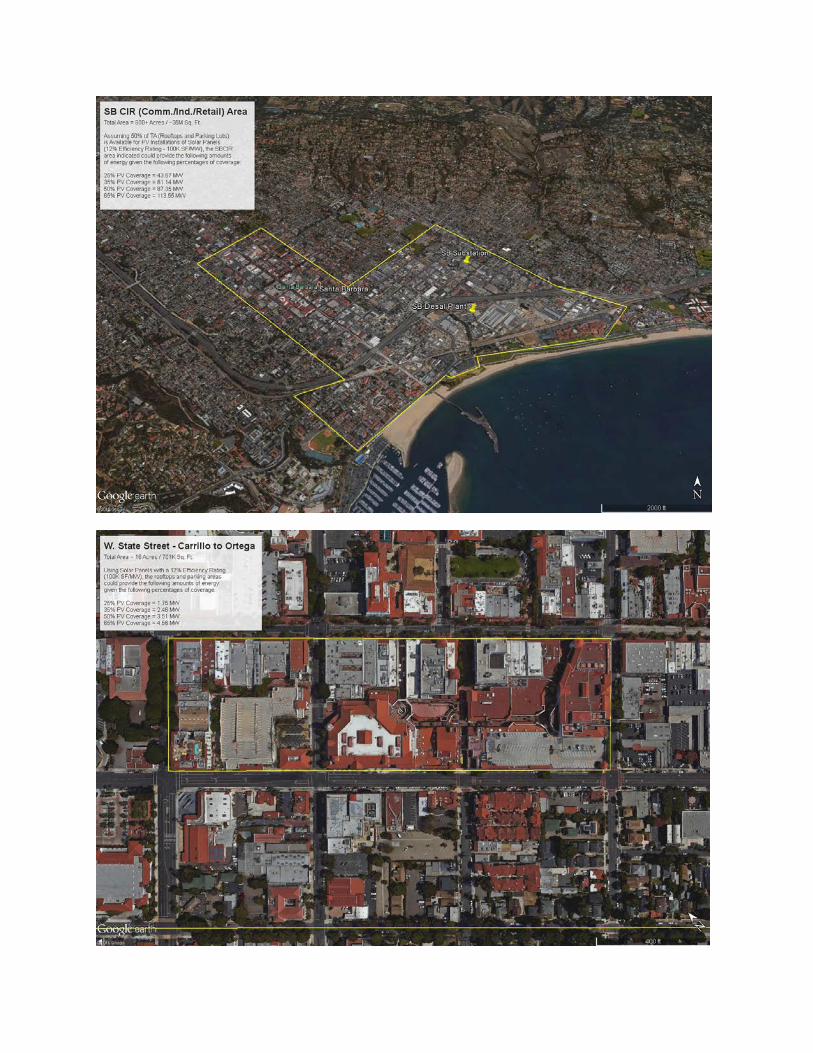
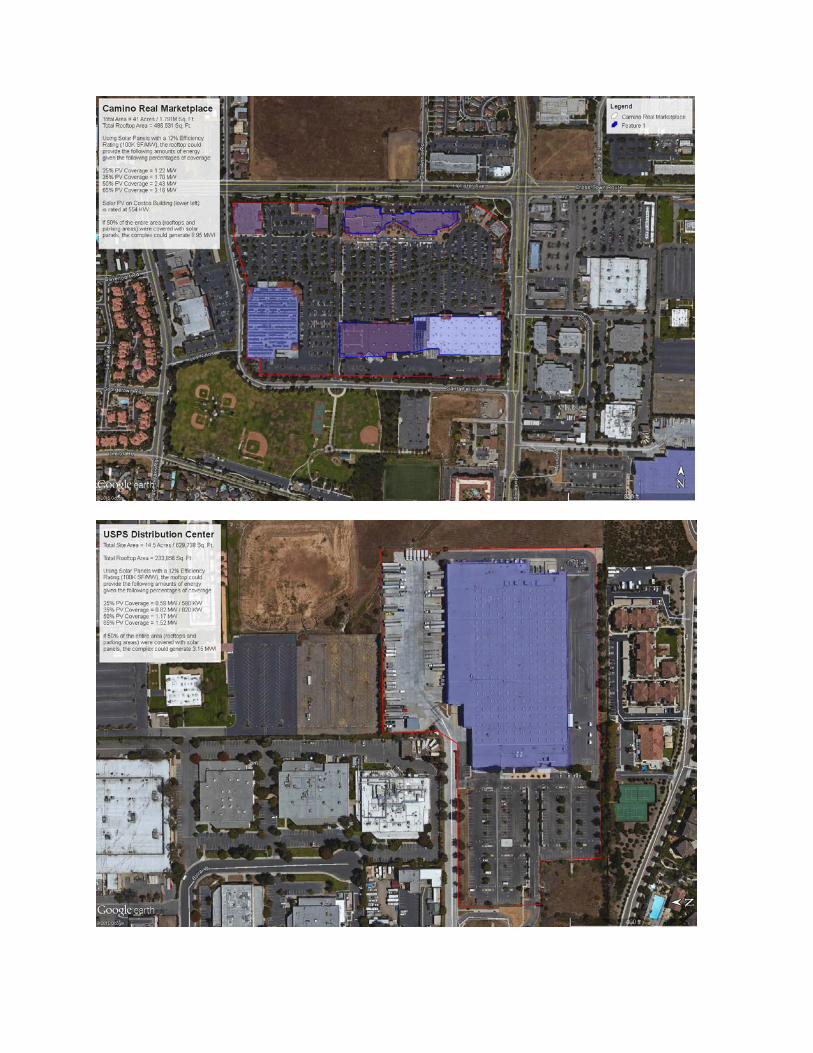
ATTACHMENT D
AERIAL PHOTOS AND ESTIMATES
REGARDING POTENTIAL COMMUNITY SOLAR PROJECTS