Embed Size (px)
Citation preview
BEFORE THE PUBLIC UTILITIES COMMISSION OF THE STATE OF CALIFORNIA
Order Instituting Rulemaking Regarding Policies, Procedures and Rules for the Low Income Energy Efficiency Programs of California’s Energy Utilities.
R. 07-01-042 (Filed January 25, 2007)
MONTHLY REPORT OF SOUTHERN CALIFORNIA GAS COMPANY (U 904 G) ON LOW INCOME ASSISTANCE PROGRAMS FOR DECEMBER 2007
Kim F. Hassan Attorney for Southern California Gas Company 101 Ash Street, HQ12B San Diego, CA 92101-3017 Telephone: (619) 699-5006 Facsimile: (619) 699-5027 E-Mail: [email protected]
January 22, 2008
1
BEFORE THE PUBLIC UTILITIES COMMISSION OF THE STATE OF CALIFORNIA
Order Instituting Rulemaking Regarding Policies, Procedures and Rules for the Low Income Energy Efficiency Programs of California’s Energy Utilities.
R. 07-01-042 (Filed January 25, 2007)
MONTHLY REPORT OF SOUTHERN CALIFORNIA GAS COMPANY (U 904 G) ON LOW INCOME ASSISTANCE PROGRAMS FOR DECEMBER 2007
I. INTRODUCTION
In Ordering Paragraphs (OP) 14 through 17 of Decision (D.) 01-05-033 the California
Public Utilities Commission (Commission) directs Southern California Gas Company
(SoCalGas) and the other Investor Owned Utilities (IOUs)1 to provide monthly status reports
on the costs and impacts of their Rapid Deployment (RD) efforts on their California
Alternate Rates for Energy (CARE) and Low Income Energy Efficiency (LIEE) programs.
In Application (A.) 06-06-033 SoCalGas proposed changes to the monthly Rapid
Deployment reports in an effort to streamline the reports while maintaining their value.
SoCalGas, along with the other utilities, then worked closely with the Energy Division to
further develop and update the tables used to report low income program activity on a
monthly basis. In D.06-12-038, the utilities’ proposed changes for the monthly program
reporting were approved. The reports will henceforth be referred to as the “Monthly Reports
on Low Income Assistance Programs.”
1 The other IOUs include San Diego Gas & Electric Company, Southern California Edison Company, and Pacific Gas and Electric Company.
2
This twelfth monthly report on SoCalGas’ 2007 Low Income Assistance Programs
includes actual LIEE and CARE results and expenditures through December.
II. LOW-INCOME ENERGY EFFICIENCY (LIEE)
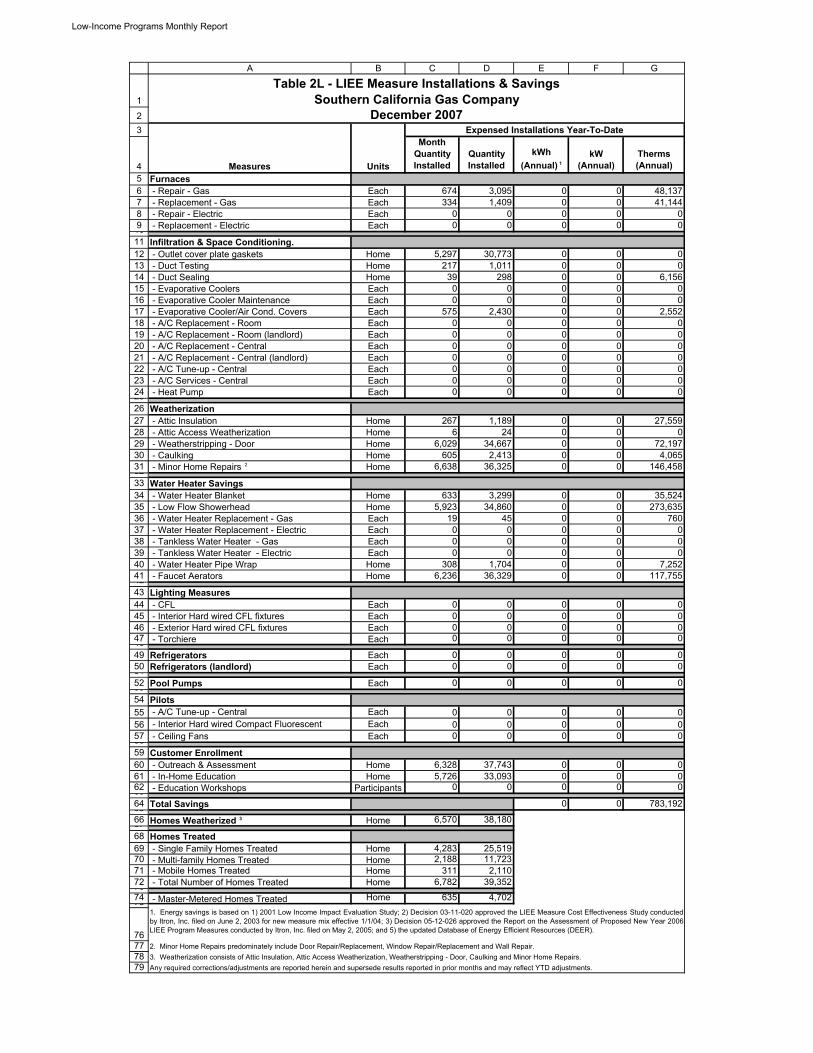
December Results – LIEE Installations
SoCalGas processed and expensed the installation of weatherization measures in
6,570 homes for the month of December. Year-to-date, 38,180 homes have been
weatherized and invoiced. SoCalGas currently has over 5,000 weatherization jobs installed
and in the process of invoicing for calendar year 2007.
The total number of appliances serviced during December was 1,027, which included
674 furnace repairs, 334 furnace replacements, and 19 water heater replacements. Year-to-
date, 4,549 appliances have been serviced which is comprised of 3,095 furnace repairs, 1,409
furnace replacements, and 45 water heater replacements.
LIEE measure and appliance installations processed and expensed during the month
can be found in SoCalGas’ Table 2L, LIEE Measure Installations & Savings.
LIEE Leveraging and Outreach
During December, SoCalGas leveraged LIEE outreach with other SoCalGas outreach
efforts at the community events discussed in the CARE Outreach & Leveraging section
below. The following summarizes additional outreach events and activities conducted for
SoCalGas’ Low Income Assistance programs during December:
• On December 9, SoCalGas conducted a 30-minute interview on energy efficiency,
winter heating tips and natural gas safety with Vivian Porter, director of community
services and public affairs for CBS Radio in Los Angeles. Ms. Porter is also the host
of a public affairs program called Community Lights, that airs at 6 a.m. Sundays on
3
KRTH-FM and at 11 p.m. Sundays on KTWV-FM. The purpose of the interview
was to inform customers of the programs currently available to SoCalGas customers.
• For December, SoCalGas continued distributing low-income program informational
brochures to energy technicians who provide these brochures during scheduled
service calls. In addition, upon the customer’s request, additional program
information, including CARE applications and low-income program informational
brochures, are also mailed to the customer. Due to increased awareness of the low-
income programs, SoCalGas continues to receive and respond to requests for CARE
applications and/or low-income program informational brochures.
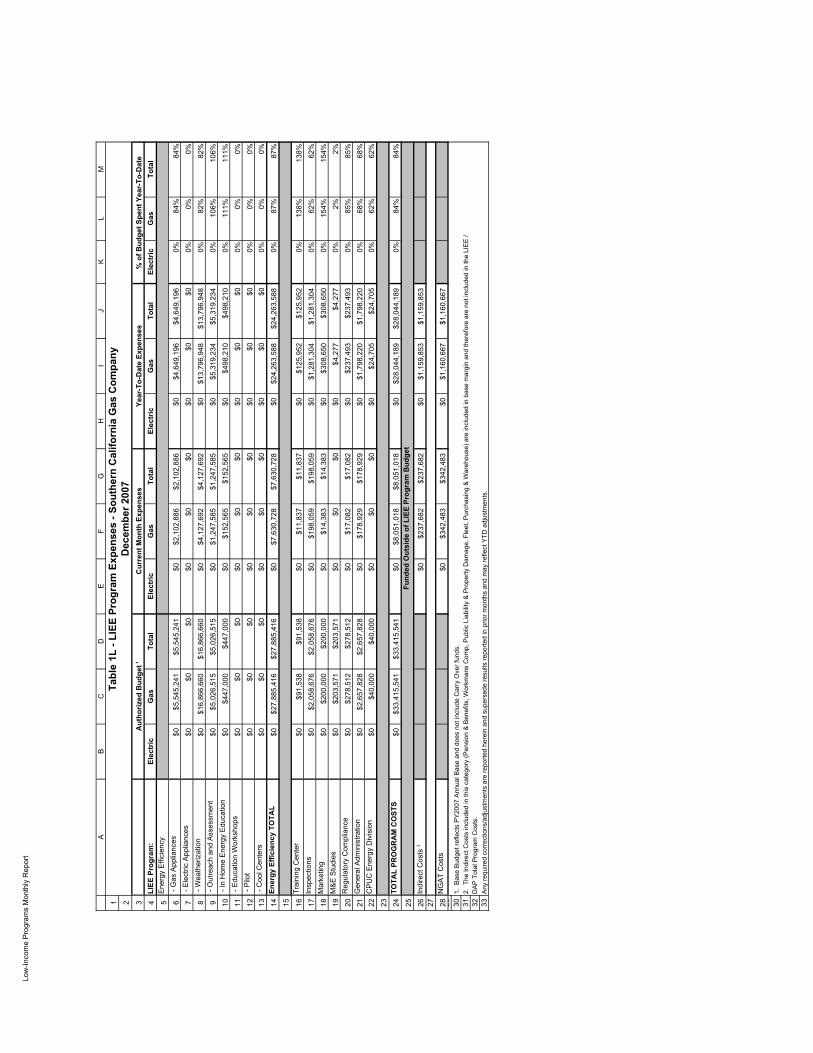
LIEE Authorized Funding Versus Actual Expenditures
SoCalGas’ LIEE Program expenditures totaled $7.6 million for services processed
and paid during the month of December, and $24.3 million year-to-date. An additional
$420,000 was spent on administration, for a year-to-date administration cost of $3.8 million.
Total costs year-to-date are 84% of 2007 budget (See Table 1L).
III. CALIFORNIA ALTERNATE RATES FOR ENERGY
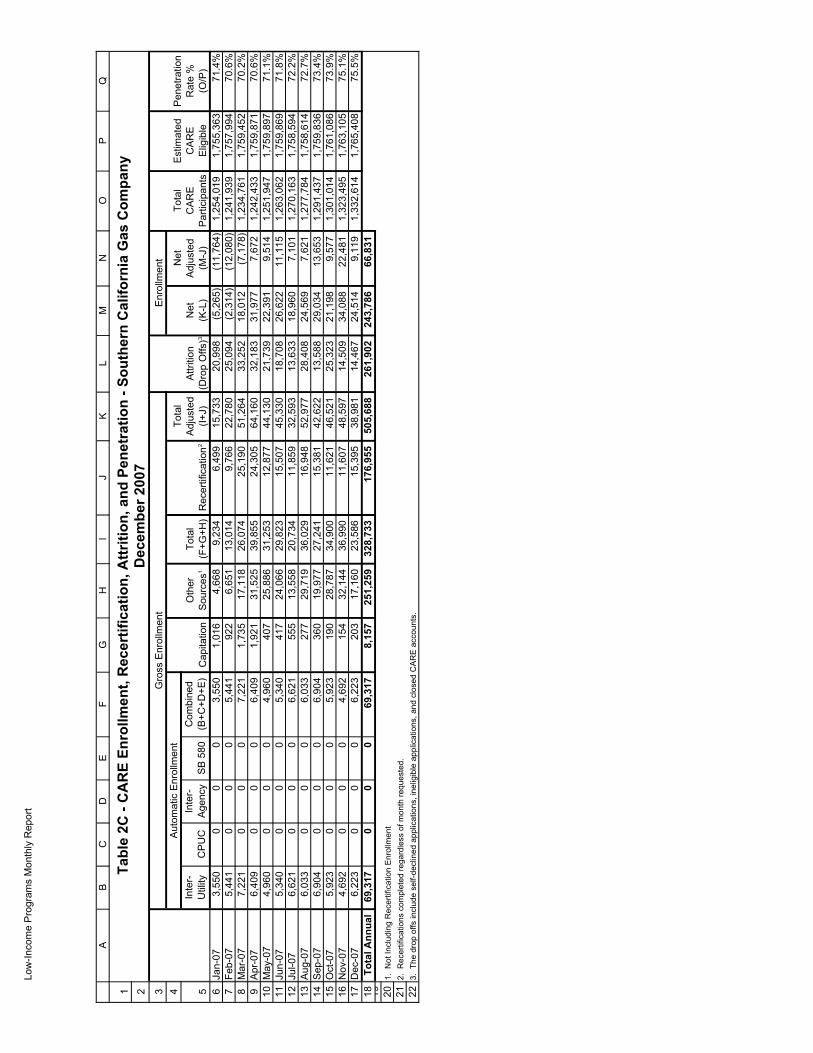
December CARE Enrollment Results
As of December 2007, 1,332,614 residential customers were enrolled in the CARE
program, which is a net increase of 9,119 customers from November 2007. During the
month of December, 23,586 new CARE applications were approved, which included 203
from CARE capitation contractors and 6,223 through SoCalGas’ interutility agreements (See
Table 2C). SoCalGas’ estimated penetration rate for the CARE program at the end of
4
December was 75.5%. This represents a 5% increase in SoCalGas’ CARE participation rate
since year-end 2006.
CARE Outreach and Leveraging
In an effort to continue reaching out to our customer base, below are activities and
events that occurred during December in addition to the activities reported in the LIEE
Leveraging and Outreach section above. Most of the events promote all of the assistance
programs available to SoCalGas customers, which include CARE and LIEE:
• For the month of December, SoCalGas continued a direct mail campaign targeting
eligible SoCalGas customers who have either moved or been dropped from the
program for non recertification. The purpose of the direct mail was to inform these
customers about the benefits of the CARE program and encourage them to re-apply.
Approximately 38,000 direct mail applications were sent out.
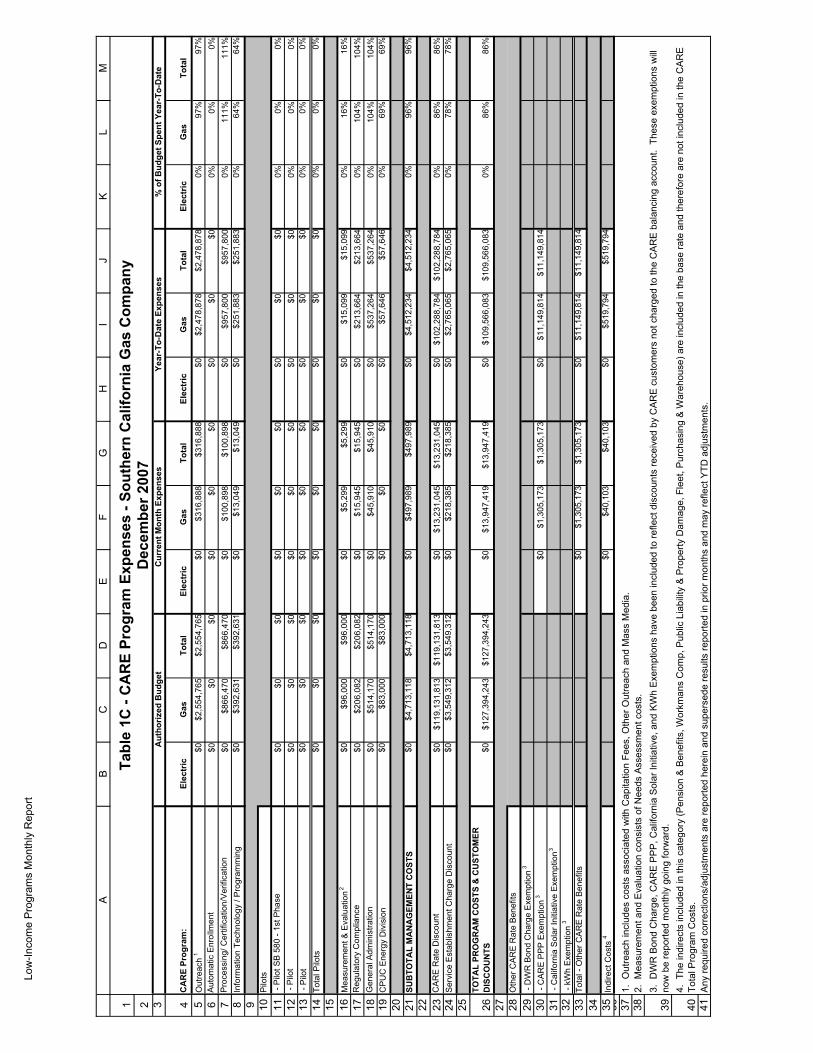
CARE AUTHORIZED FUNDING VERSUS ACTUAL EXPENDITURES
During December, CARE administrative expenses, including outreach, totaled
$498,000. Year-to-date SoCalGas has spent approximately $4.5 million on administration;
this is 96% of the authorized 2007 CARE administrative budget. CARE rate and Service
Establishment Charge discounts through December are $105.1 million; which is 86% of the
projected 2007 CARE discount costs.
The comparison of actual expenses to the budgeted figures for December is provided
in Table 1C.
5
CONCLUSION
SoCalGas continues to implement its outreach efforts with the goal of providing LIEE
services to as many qualified customers as possible and increasing CARE participation
during PY2007.
Respectfully submitted,
/s/ Kim F. Hassan Kim F. Hassan Attorney for: Southern California Gas Company 101 Ash Street, HQ12B San Diego, CA 92101-3017 Phone: (619) 699-5006 Fax: (619) 699-5027 E-Mail: [email protected]
January 22, 2008
Low
-Inco
me
Pro
gram
s M
onth
ly R
epor
t
1 2 3 4 5 6 7 8 9 10 11 12 13 14 15 16 17 18 19 20 21 22 23 24 25 26 27 28 29 30 31 32 33
AB
CD
EF
GH
IJ
KL
M
LIEE
Pro
gram
:El
ectr
icG
as
Tota
lEl
ectr
icG
as
Tota
lEl
ectr
icG
as
Tota
lEl
ectr
icG
as
Tota
lE
nerg
y E
ffici
ency
- G
as A
pplia
nces
$0$5
,545
,241
$5,5
45,2
41$0
$2,1
02,8
86$2
,102
,886
$0$4
,649
,196
$4,6
49,1
960%
84%
84%
- E
lect
ric A
pplia
nces
$0$0
$0$0
$0$0
$0$0
$00%
0%0%
- W
eath
eriz
atio
n$0
$16,
866,
660
$16,
866,
660
$0$4
,127
,692
$4,1
27,6
92$0
$13,
796,
948
$13,
796,
948
0%82
%82
% -
Out
reac
h an
d A
sses
smen
t$0
$5,0
26,5
15$5
,026
,515
$0$1
,247
,585
$1,2
47,5
85$0
$5,3
19,2
34$5
,319
,234
0%10
6%10
6% -
In H
ome
Ene
rgy
Edu
catio
n$0
$447
,000
$447
,000
$0$1
52,5
65$1
52,5
65$0
$498
,210
$498
,210
0%11
1%11
1% -
Edu
catio
n W
orks
hops
$0$0
$0$0
$0$0
$0$0
$00%
0%0%
- P
ilot
$0$0
$0$0
$0$0
$0$0
$00%
0%0%
- C
ool C
ente
rs$0
$0$0
$0$0
$0$0
$0$0
0%0%
0%En
ergy
Effi
cien
cy T
OTA
L$0
$27,
885,
416
$27,
885,
416
$0$7
,630
,728
$7,6
30,7
28$0
$24,
263,
588
$24,
263,
588
0%87
%87
%
Trai
ning
Cen
ter
$0$9
1,53
8$9
1,53
8$0
$11,
837
$11,
837
$0$1
25,9
52$1
25,9
520%
138%
138%
Insp
ectio
ns$0
$2,0
58,6
76$2
,058
,676
$0$1
98,0
59$1
98,0
59$0
$1,2
81,3
04$1
,281
,304
0%62
%62
%M
arke
ting
$0$2
00,0
00$2
00,0
00$0
$14,
383
$14,
383
$0$3
08,6
50$3
08,6
500%
154%
154%
M&
E S
tudi
es$0
$203
,571
$203
,571
$0$0
$0$0
$4,2
77$4
,277
0%2%
2%R
egul
ator
y C
ompl
ianc
e$0
$278
,512
$278
,512
$0$1
7,08
2$1
7,08
2$0
$237
,493
$237
,493
0%85
%85
%G
ener
al A
dmin
istra
tion
$0$2
,657
,828
$2,6
57,8
28$0
$178
,929
$178
,929
$0$1
,798
,220
$1,7
98,2
200%
68%
68%
CP
UC
Ene
rgy
Div
isio
n$0
$40,
000
$40,
000
$0$0
$0$0
$24,
705
$24,
705
0%62
%62
%
TOTA
L PR
OG
RA
M C
OST
S$0
$33,
415,
541
$33,
415,
541
$0$8
,051
,018
$8,0
51,0
18$0
$28,
044,
189
$28,
044,
189
0%84
%84
%
Indi
rect
Cos
ts 2
$0$2
37,6
82$2
37,6
82$0
$1,1
59,8
53$1
,159
,853
NG
AT
Cos
ts$0
$342
,483
$342
,483
$0$1
,160
,667
$1,1
60,6
67
1. B
ase
Bud
get r
efle
cts
PY
2007
Ann
ual B
ase
and
does
not
incl
ude
Car
ry O
ver f
unds
.
DA
P T
otal
Pro
gram
Cos
ts.
Dec
embe
r 200
7Ye
ar-T
o-D
ate
Expe
nses
Aut
horiz
ed B
udge
t 1
Fund
ed O
utsi
de o
f LIE
E Pr
ogra
m B
udge
t
Cur
rent
Mon
th E
xpen
ses
Any
requ
ired
corr
ectio
ns/a
djus
tmen
ts a
re re
porte
d he
rein
and
sup
erse
de re
sults
repo
rted
in p
rior m
onth
s an
d m
ay re
flect
YTD
adj
ustm
ents
.
Tabl
e 1L
- LI
EE P
rogr
am E
xpen
ses
- Sou
ther
n C
alifo
rnia
Gas
Com
pany
% o
f Bud
get S
pent
Yea
r-To
-Dat
e
2. T
he In
dire
ct C
osts
incl
uded
in th
is c
ateg
ory
(Pen
sion
& B
enef
its, W
orkm
ans
Com
p, P
ublic
Lia
bilit
y &
Pro
perty
Dam
age,
Fle
et, P
urch
asin
g &
War
ehou
se) a
re in
clud
ed in
bas
e m
argi
n an
d th
eref
ore
are
not i
nclu
ded
in th
e LI
EE
/
Low-Income Programs Monthly Report
1
23
45678910
1112131415161718192021222324252627282930313233343536373839404142434445464748495051525354555657585960616263646566676869707172737475
76777879
A B C D E F G
Month Quantity Installed
Quantity Installed
kWh (Annual) 1
kW (Annual)
Therms (Annual)
Furnaces - Repair - Gas Each 674 3,095 0 0 48,137 - Replacement - Gas Each 334 1,409 0 0 41,144 - Repair - Electric Each 0 0 0 0 0 - Replacement - Electric Each 0 0 0 0 0
Infiltration & Space Conditioning. - Outlet cover plate gaskets Home 5,297 30,773 0 0 0 - Duct Testing Home 217 1,011 0 0 0 - Duct Sealing Home 39 298 0 0 6,156 - Evaporative Coolers Each 0 0 0 0 0 - Evaporative Cooler Maintenance Each 0 0 0 0 0 - Evaporative Cooler/Air Cond. Covers Each 575 2,430 0 0 2,552 - A/C Replacement - Room Each 0 0 0 0 0 - A/C Replacement - Room (landlord) Each 0 0 0 0 0 - A/C Replacement - Central Each 0 0 0 0 0 - A/C Replacement - Central (landlord) Each 0 0 0 0 0 - A/C Tune-up - Central Each 0 0 0 0 0 - A/C Services - Central Each 0 0 0 0 0 - Heat Pump Each 0 0 0 0 0
Weatherization - Attic Insulation Home 267 1,189 0 0 27,559 - Attic Access Weatherization Home 6 24 0 0 0 - Weatherstripping - Door Home 6,029 34,667 0 0 72,197 - Caulking Home 605 2,413 0 0 4,065 - Minor Home Repairs 2 Home 6,638 36,325 0 0 146,458
Water Heater Savings - Water Heater Blanket Home 633 3,299 0 0 35,524 - Low Flow Showerhead Home 5,923 34,860 0 0 273,635 - Water Heater Replacement - Gas Each 19 45 0 0 760 - Water Heater Replacement - Electric Each 0 0 0 0 0 - Tankless Water Heater - Gas Each 0 0 0 0 0 - Tankless Water Heater - Electric Each 0 0 0 0 0 - Water Heater Pipe Wrap Home 308 1,704 0 0 7,252 - Faucet Aerators Home 6,236 36,329 0 0 117,755
Lighting Measures - CFL Each 0 0 0 0 0 - Interior Hard wired CFL fixtures Each 0 0 0 0 0 - Exterior Hard wired CFL fixtures Each 0 0 0 0 0 - Torchiere Each 0 0 0 0 0
Refrigerators Each 0 0 0 0 0Refrigerators (landlord) Each 0 0 0 0 0
Pool Pumps Each 0 0 0 0 0
Pilots - A/C Tune-up - Central Each 0 0 0 0 0 - Interior Hard wired Compact Fluorescent Each 0 0 0 0 0 - Ceiling Fans Each 0 0 0 0 0
Customer Enrollment - Outreach & Assessment Home 6,328 37,743 0 0 0 - In-Home Education Home 5,726 33,093 0 0 0 - Education Workshops Participants 0 0 0 0 0
Total Savings 0 0 783,192
Homes Weatherized 3 Home 6,570 38,180
Homes Treated
- Single Family Homes Treated Home 4,283 25,519 - Multi-family Homes Treated Home 2,188 11,723 - Mobile Homes Treated Home 311 2,110 - Total Number of Homes Treated Home 6,782 39,352
- Master-Metered Homes Treated Home 635 4,702
Table 2L - LIEE Measure Installations & SavingsSouthern California Gas Company
December 2007
3. Weatherization consists of Attic Insulation, Attic Access Weatherization, Weatherstripping - Door, Caulking and Minor Home Repairs.
Expensed Installations Year-To-Date
2. Minor Home Repairs predominately include Door Repair/Replacement, Window Repair/Replacement and Wall Repair.
Any required corrections/adjustments are reported herein and supersede results reported in prior months and may reflect YTD adjustments.
1. Energy savings is based on 1) 2001 Low Income Impact Evaluation Study; 2) Decision 03-11-020 approved the LIEE Measure Cost Effectiveness Study conductedby Itron, Inc. filed on June 2, 2003 for new measure mix effective 1/1/04; 3) Decision 05-12-026 approved the Report on the Assessment of Proposed New Year 2006LIEE Program Measures conducted by Itron, Inc. filed on May 2, 2005; and 5) the updated Database of Energy Efficient Resources (DEER).
Measures Units
Low-Income Programs Monthly Report
12
345678910111213
A B
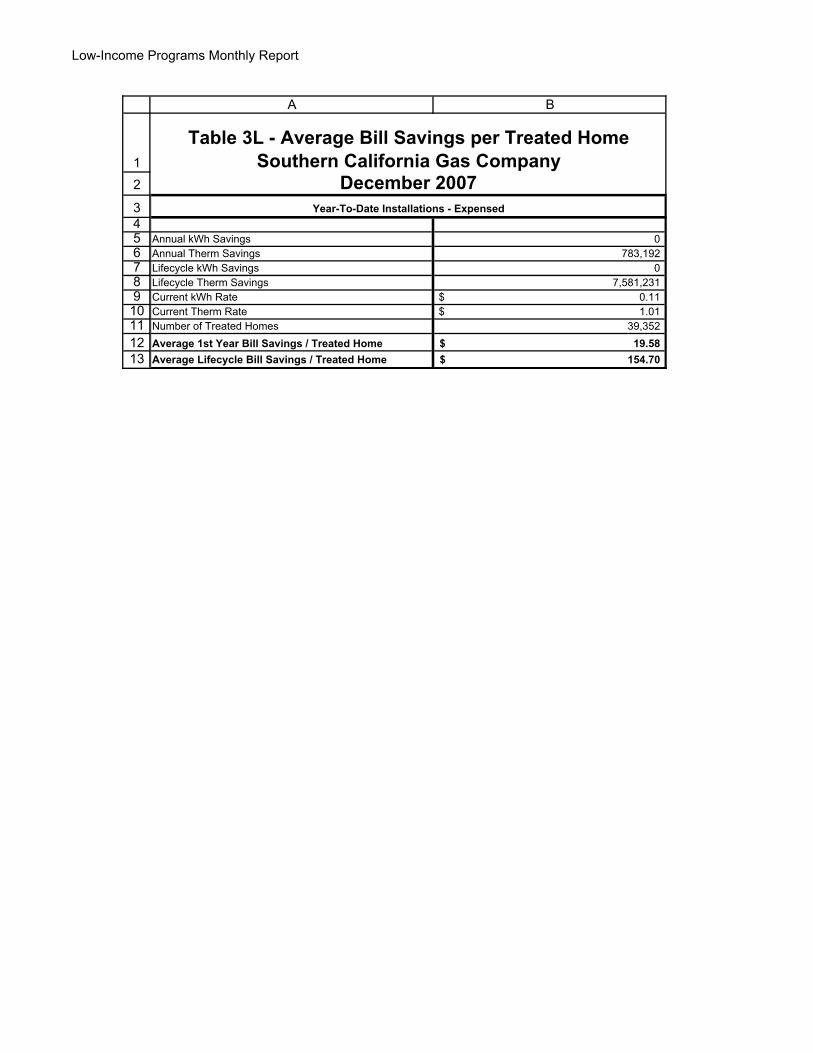
Annual kWh Savings 0Annual Therm Savings 783,192Lifecycle kWh Savings 0Lifecycle Therm Savings 7,581,231Current kWh Rate 0.11$ Current Therm Rate 1.01$ Number of Treated Homes 39,352Average 1st Year Bill Savings / Treated Home 19.58$ Average Lifecycle Bill Savings / Treated Home 154.70$
Table 3L - Average Bill Savings per Treated HomeSouthern California Gas Company
Year-To-Date Installations - Expensed
December 2007
Low-Income Programs Monthly Report
123
45678910111213141516171819
20
A B C D E F G
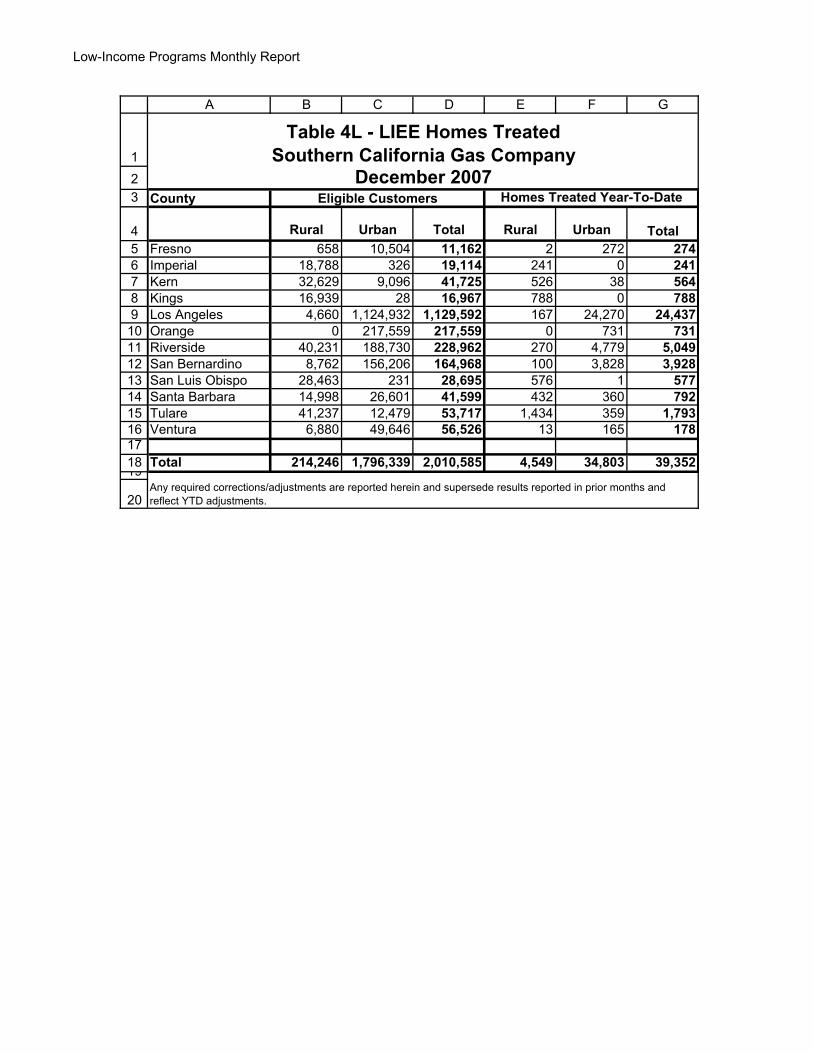
County Eligible Customers Homes Treated Year-To-Date
Rural Urban Total Rural Urban TotalFresno 658 10,504 11,162 2 272 274Imperial 18,788 326 19,114 241 0 241Kern 32,629 9,096 41,725 526 38 564Kings 16,939 28 16,967 788 0 788Los Angeles 4,660 1,124,932 1,129,592 167 24,270 24,437Orange 0 217,559 217,559 0 731 731Riverside 40,231 188,730 228,962 270 4,779 5,049San Bernardino 8,762 156,206 164,968 100 3,828 3,928San Luis Obispo 28,463 231 28,695 576 1 577Santa Barbara 14,998 26,601 41,599 432 360 792Tulare 41,237 12,479 53,717 1,434 359 1,793Ventura 6,880 49,646 56,526 13 165 178
Total 214,246 1,796,339 2,010,585 4,549 34,803 39,352
Table 4L - LIEE Homes TreatedSouthern California Gas Company
December 2007
Any required corrections/adjustments are reported herein and supersede results reported in prior months and reflect YTD adjustments.
Low
-Inco
me
Pro
gram
s M
onth
ly R
epor
t
1 2 3 4 5 6 7 8 9 10 11 12 13 14 15 16 17
AB
CD
EF
GH
IJ
KL
MN
OP
Q
Jan-
070
00
00
00
00
00
00
00
0Fe
b-07
00
00
00
00
00
00
00
00
Mar
-07
00
00
962
2,50
50
00
00
096
22,
505
00
Apr
-07
00
00
973
41,6
120
00
00
097
341
,612
00
May
-07
00
00
8,02
315
5,71
80
00
00
08,
023
155,
718
00
Jun-
070
00
010
,668
211,
403
00
00
00
10,6
6821
1,40
30
0Ju
l-07
00
00
15,4
1729
7,10
40
00
00
015
,417
297,
104
00
Aug
-07
00
00
20,3
3138
9,22
70
00
00
020
,331
389,
227
00
Sep
-07
00
00
24,7
6047
8,46
30
00
00
024
,760
478,
463
00
Oct
-07
00
00
27,5
4353
3,72
70
00
00
027
,543
533,
727
00
Nov
-07
00
00
32,6
5763
7,28
80
00
00
032
,657
637,
288
00
Dec
-07
00
00
39,3
5278
3,19
20
00
00
039
,352
783,
192
00
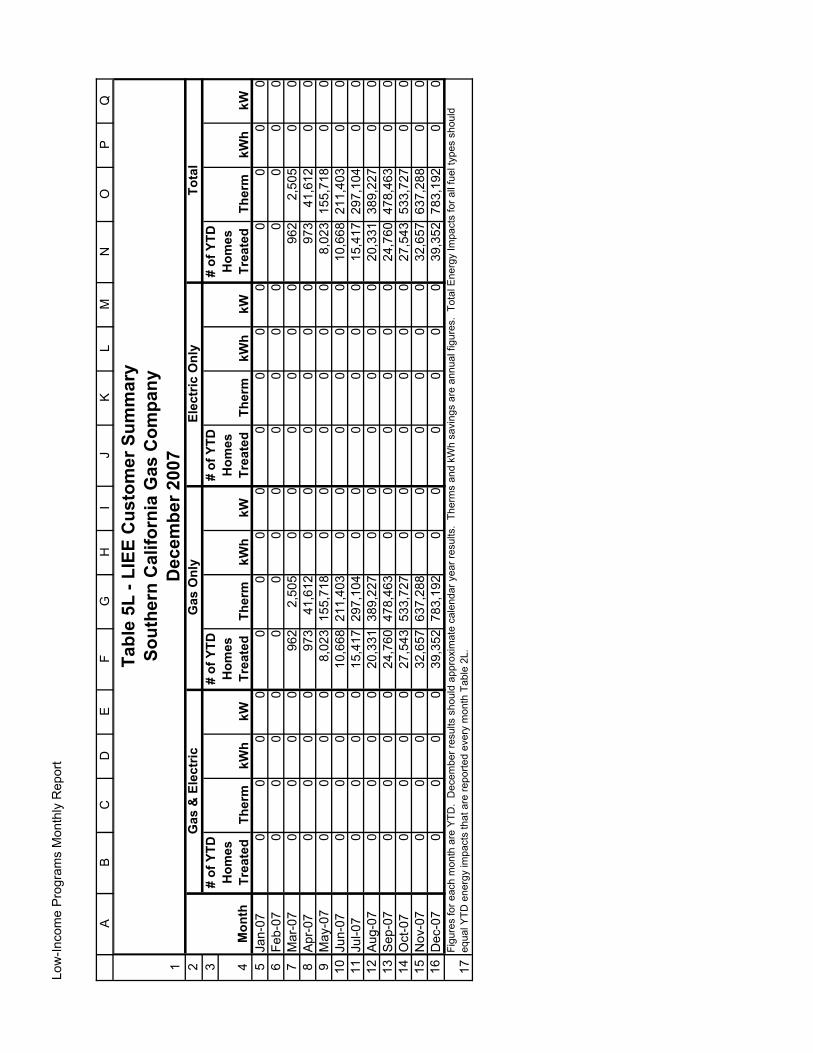
Tabl
e 5L
- LI
EE C
usto
mer
Sum
mar
ySo
uthe
rn C
alifo
rnia
Gas
Com
pany
Dec
embe
r 200
7
Mon
th
Gas
& E
lect
ricG
as O
nly
Elec
tric
Onl
yTo
tal
# of
YTD
Hom
esTr
eate
d
Figu
res
for e
ach
mon
th a
re Y
TD.
Dec
embe
r res
ults
sho
uld
appr
oxim
ate
cale
ndar
yea
r res
ults
. Th
erm
s an
d kW
h sa
ving
s ar
e an
nual
figu
res.
Tot
al E
nerg
y Im
pact
s fo
r all
fuel
type
s sh
ould
eq
ual Y
TD e
nerg
y im
pact
s th
at a
re re
porte
d ev
ery
mon
th T
able
2L.
# of
YTD
Hom
esTr
eate
dTh
erm
kWh
k W
# of
YTD
Hom
esTr
eate
dTh
erm
Ther
mkW
hk W
kWh
kW
# of
YTD
Hom
esTr
eate
dTh
erm
kWh
k W
Low
-Inco
me
Pro
gram
s M
onth
ly R
epor
t
1 2 3 4 5 6 7 8 9 10 11 12 13 14 15 16 17 18 19 20 21 22 23 24 25 26 27 28 29 30 31 32 33 34 35 36 37 38 39 40 41
AB
CD
EF
GH
IJ
KL
M
CA
RE
Prog
ram
:El
ectr
icG
asTo
tal
Elec
tric
Gas
To
tal
Elec
tric
Gas
Tota
lEl
ectr
icG
asTo
tal
Out
reac
h 1
$0$2
,554
,765
$2,5
54,7
65$0
$316
,888
$3
16,8
88
$0$2
,478
,878
$2,4
78,8
780%
97%
97%
Aut
omat
ic E
nrol
lmen
t$0
$0$0
$0$0
$0$0
$0$0
0%0%
0%P
roce
ssin
g/ C
ertif
icat
ion/
Ver
ifica
tion
$0$8
66,4
70$8
66,4
70$0
$100
,898
$100
,898
$0$9
57,8
00$9
57,8
000%
111%
111%
Info
rmat
ion
Tech
nolo
gy /
Pro
gram
min
g$0
$392
,631
$392
,631
$0$1
3,04
9$1
3,04
9$0
$251
,883
$251
,883
0%64
%64
%
Pilo
ts -
Pilo
t SB
580
- 1s
t Pha
se$0
$0$0
$0$0
$0$0
$0$0
0%0%
0% -
Pilo
t $0
$0$0
$0$0
$0$0
$0$0
0%0%
0% -
Pilo
t $0
$0$0
$0$0
$0$0
$0$0
0%0%
0%To
tal P
ilots
$0$0
$0$0
$0$0
$0$0
$00%
0%0%
Mea
sure
men
t & E
valu
atio
n 2$0
$96,
000
$96,
000
$0$5
,299
$5,2
99$0
$15,
099
$15,
099
0%16
%16
%R
egul
ator
y C
ompl
ianc
e$0
$206
,082
$206
,082
$0$1
5,94
5$1
5,94
5$0
$213
,664
$213
,664
0%10
4%10
4%G
ener
al A
dmin
istra
tion
$0$5
14,1
70$5
14,1
70$0
$45,
910
$45,
910
$0$5
37,2
64$5
37,2
640%
104%
104%
CP
UC
Ene
rgy
Div
isio
n$0
$83,
000
$83,
000
$0$0
$0$0
$57,
646
$57,
646
0%69
%69
%
SUB
TOTA
L M
AN
AG
EMEN
T C
OST
S$0
$4,7
13,1
18$4
,713
,118
$0$4
97,9
89$4
97,9
89$0
$4,5
12,2
34$4
,512
,234
0%96
%96
%
CA
RE
Rat
e D
isco
unt
$0$1
19,1
31,8
13$1
19,1
31,8
13$0
$13,
231,
045
$13,
231,
045
$0$1
02,2
88,7
84$1
02,2
88,7
840%
86%
86%
Ser
vice
Est
ablis
hmen
t Cha
rge
Dis
coun
t $0
$3,5
49,3
12$3
,549
,312
$0$2
18,3
85$2
18,3
85$0
$2,7
65,0
65$2
,765
,065
0%78
%78
%
TOTA
L PR
OG
RA
M C
OST
S &
CU
STO
MER
D
ISC
OU
NTS
$0$1
27,3
94,2
43$1
27,3
94,2
43$0
$13,
947,
419
$13,
947,
419
$0$1
09,5
66,0
83$1
09,5
66,0
830%
86%
86%
Oth
er C
AR
E R
ate
Ben
efits
- D
WR
Bon
d C
harg
e E
xem
ptio
n 3
-
CA
RE
PP
P E
xem
ptio
n 3
$0$1
,305
,173
$1,3
05,1
73$0
$11,
149,
814
$11,
149,
814
- C
alifo
rnia
Sol
ar In
itiat
ive
Exe
mpt
ion 3
- kW
h E
xem
ptio
n 3
Tota
l - O
ther
CA
RE
Rat
e B
enef
its$0
$1,3
05,1
73$1
,305
,173
$0$1
1,14
9,81
4$1
1,14
9,81
4
Indi
rect
Cos
ts 4
$0$4
0,10
3$4
0,10
3$0
$519
,794
$519
,794
1. O
utre
ach
incl
udes
cos
ts a
ssoc
iate
d w
ith C
apita
tion
Fees
, Oth
er O
utre
ach
and
Mas
s M
edia
.2.
Mea
sure
men
t and
Eva
luat
ion
cons
ists
of N
eeds
Ass
essm
ent c
osts
.
Any
requ
ired
corr
ectio
ns/a
djus
tmen
ts a
re re
porte
d he
rein
and
sup
erse
de re
sults
repo
rted
in p
rior m
onth
s an
d m
ay re
flect
YTD
adj
ustm
ents
.
4. T
he in
dire
cts
incl
uded
in th
is c
ateg
ory
(Pen
sion
& B
enef
its, W
orkm
ans
Com
p, P
ublic
Lia
bilit
y &
Pro
perty
Dam
age,
Fle
et, P
urch
asin
g &
War
ehou
se) a
re in
clud
ed in
the
base
rate
and
ther
efor
e ar
e no
t inc
lude
d in
the
CA
RE
To
tal P
rogr
am C
osts
.
Tabl
e 1C
- C
AR
E Pr
ogra
m E
xpen
ses
- Sou
ther
n C
alifo
rnia
Gas
Com
pany
% o
f Bud
get S
pent
Yea
r-To
-Dat
eYe
ar-T
o-D
ate
Expe
nses
Aut
horiz
ed B
udge
tD
ecem
ber 2
007
Cur
rent
Mon
th E
xpen
ses
3. D
WR
Bon
d C
harg
e, C
AR
E P
PP
, Cal
iforn
ia S
olar
Initi
ativ
e, a
nd K
Wh
Exe
mpt
ions
hav
e be
en in
clud
ed to
refle
ct d
isco
unts
rece
ived
by
CA
RE
cus
tom
ers
not c
harg
ed to
the
CA
RE
bal
anci
ng a
ccou
nt.
Thes
e ex
empt
ions
will
no
w b
e re
porte
d m
onth
ly g
oing
forw
ard.
Low
-Inco
me
Pro
gram
s M
onth
ly R
epor
t
1 2 3 4 5 6 7 8 9 10 11 12 13 14 15 16 17 18 19 20 21 22
AB
CD
EF
GH
IJ
KL
MN
OP
Q
Inte
r-U
tility
CP
UC
Inte
r-A
genc
yS
B 5
80C
ombi
ned
(B+C
+D+E
)Ja
n-07
3,55
00
00
3,55
01,
016
4,66
89,
234
6,49
915
,733
20,9
98(5
,265
)(1
1,76
4)1,
254,
019
1,75
5,36
371
.4%
Feb-
075,
441
00
05,
441
922
6,65
113
,014
9,76
622
,780
25,0
94(2
,314
)(1
2,08
0)1,
241,
939
1,75
7,99
470
.6%
Mar
-07
7,22
10
00
7,22
11,
735
17,1
1826
,074
25,1
9051
,264
33,2
5218
,012
(7,1
78)
1,23
4,76
11,
759,
452
70.2
%A
pr-0
76,
409
00
06,
409
1,92
131
,525
39,8
5524
,305
64,1
6032
,183
31,9
777,
672
1,24
2,43
31,
759,
871
70.6
%M
ay-0
74,
960
00
04,
960
407
25,8
8631
,253
12,8
7744
,130
21,7
3922
,391
9,51
41,
251,
947
1,75
9,89
771
.1%
Jun-
075,
340
00
05,
340
417
24,0
6629
,823
15,5
0745
,330
18,7
0826
,622
11,1
151,
263,
062
1,75
9,86
971
.8%
Jul-0
76,
621
00
06,
621
555
13,5
5820
,734
11,8
5932
,593
13,6
3318
,960
7,10
11,
270,
163
1,75
8,59
472
.2%
Aug
-07
6,03
30
00
6,03
327
729
,719
36,0
2916
,948
52,9
7728
,408
24,5
697,
621
1,27
7,78
41,
758,
614
72.7
%S
ep-0
76,
904
00
06,
904
360
19,9
7727
,241
15,3
8142
,622
13,5
8829
,034
13,6
531,
291,
437
1,75
9,83
673
.4%
Oct
-07
5,92
30
00
5,92
319
028
,787
34,9
0011
,621
46,5
2125
,323
21,1
989,
577
1,30
1,01
41,
761,
086
73.9
%N
ov-0
74,
692
00
04,
692
154
32,1
4436
,990
11,6
0748
,597
14,5
0934
,088
22,4
811,
323,
495
1,76
3,10
575
.1%
Dec
-07
6,22
30
00
6,22
320
317
,160
23,5
8615
,395
38,9
8114
,467
24,5
149,
119
1,33
2,61
41,
765,
408
75.5
%To
tal A
nnua
l69
,317
00
069
,317
8,15
725
1,25
932
8,73
317
6,95
550
5,68
826
1,90
224
3,78
666
,831
2. R
ecer
tific
atio
ns c
ompl
eted
rega
rdle
ss o
f mon
th re
ques
ted.
3. T
he d
rop
offs
incl
ude
self-
decl
ined
app
licat
ions
, ine
ligib
le a
pplic
atio
ns, a
nd c
lose
d C
AR
E a
ccou
nts.
1. N
ot In
clud
ing
Rec
ertif
icat
ion
Enr
ollm
ent
Enr
ollm
ent
Net
(K-L
)
Net
Adj
uste
d(M
-J)
Tota
l C
AR
E
Par
ticip
ants
Est
imat
edC
AR
EE
ligib
le
Pen
etra
tion
Rat
e %
(O/P
)To
tal
(F+G
+H)
Rec
ertif
icat
ion2
Tabl
e 2C
- C
AR
E En
rollm
ent,
Rec
ertif
icat
ion,
Attr
ition
, and
Pen
etra
tion
- Sou
ther
n C
alifo
rnia
Gas
Com
pany
Aut
omat
ic E
nrol
lmen
tO
ther
S
ourc
es1
Cap
itatio
nA
ttriti
on(D
rop
Offs
)3
Gro
ss E
nrol
lmen
t
Tota
l A
djus
ted
(I+
J)
Dec
embe
r 200
7
Low
-Inco
me
Pro
gram
s M
onth
ly R
epor
t
1 2 3 4 5 6 7 8 9 10 11 12 13 14 15 16 17 18 19
AB
CD
EF
GH
I
Tota
l CA
RE
Popu
latio
n
Part
icip
ants
R
eque
sted
to
Ver
ify
% o
f Po
pula
tion
Tota
l
Part
icip
ants
D
ropp
ed (D
ue to
no
resp
onse
)
Part
icip
ants
D
ropp
ed
(Ver
ified
as
Inel
igib
le)
Tota
l D
ropp
ed
% D
ropp
ed
thro
ugh
Ran
dom
Ve
rific
atio
n
% o
f Tot
al
Popu
latio
n D
ropp
ed
Jan-
071,
254,
019
6,19
10.
49%
4,40
712
14,
528
73%
0.36
%Fe
b-07
1,24
1,93
91,
587
0.13
%3,
865
181
4,04
625
5%0.
33%
Mar
-07
1,23
4,76
12,
061
0.17
%4,
006
944,
100
199%
0.33
%A
pr-0
71,
242,
433
448
0.04
%3,
664
773,
741
835%
0.30
%M
ay-0
71,
251,
947
1,25
90.
10%
1,58
927
1,61
612
8%0.
13%
Jun-
071,
263,
062
2,61
70.
21%
473
5052
320
%0.
04%
Jul-0
71,
270,
163
2,50
80.
20%
4038
783%
0.01
%A
ug-0
71,
277,
784
1,99
50.
16%
130
4917
99%
0.01
%S
ep-0
71,
291,
437
1,36
80.
11%
1,09
769
1,16
685
%0.
09%
Oct
-07
1,30
1,01
42,
323
0.18
%96
489
1,05
345
%0.
08%
Nov
-07
1,32
3,49
51,
634
0.12
%1,
211
571,
268
78%
0.10
%D
ec-0
71,
332,
614
1,81
50.
14%
879
8596
453
%0.
07%
Tota
l Ann
ual
1,33
2,61
425
,806
1.94
%22
,325
937
23,2
6290
%1.
75%
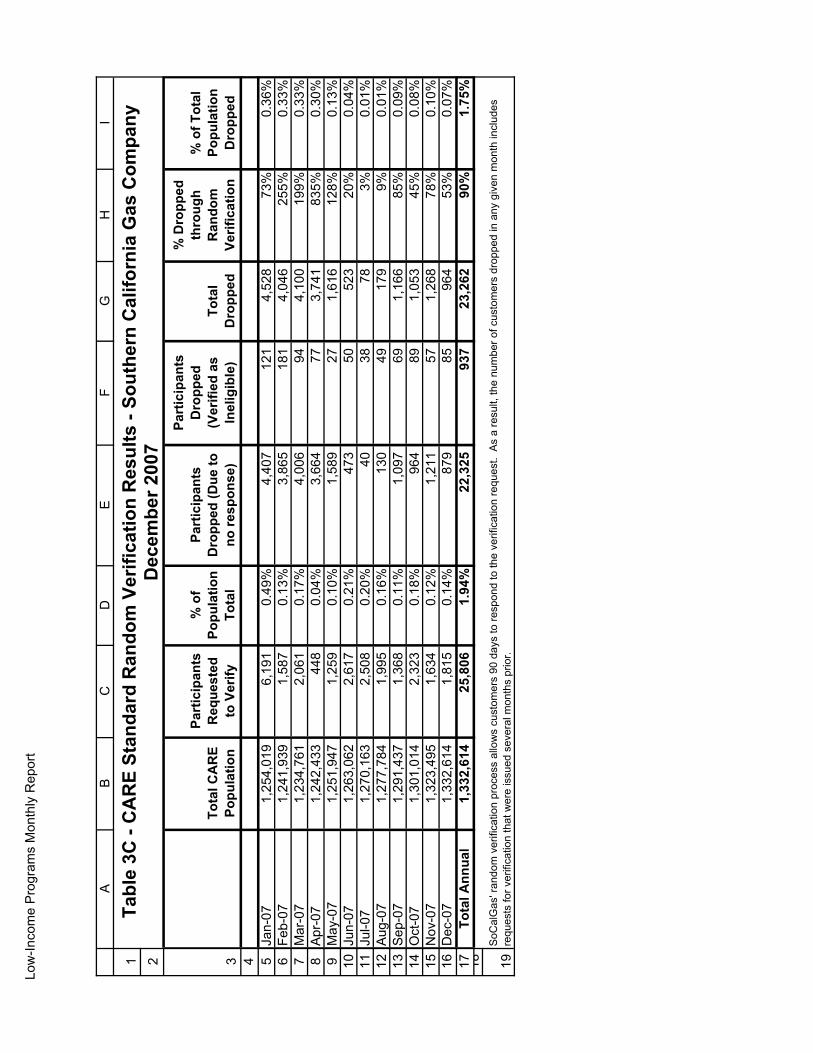
Tabl
e 3C
- C
AR
E St
anda
rd R
ando
m V
erifi
catio
n R
esul
ts -
Sout
hern
Cal
iforn
ia G
as C
ompa
nyD
ecem
ber 2
007
SoC
alG
as' r
ando
m v
erifi
catio
n pr
oces
s al
low
s cu
stom
ers
90 d
ays
to re
spon
d to
the
verif
icat
ion
requ
est.
As
a re
sult,
the
num
ber o
f cus
tom
ers
drop
ped
in a
ny g
iven
mon
th in
clud
es
requ
ests
for v
erifi
catio
n th
at w
ere
issu
ed s
ever
al m
onth
s pr
ior.
Low
-Inco
me
Pro
gram
s M
onth
ly R
epor
t
1 2 3 4 5 6 7 8 9 10 11 12 13 14 15 16 17 18
AB
CD
EF
GH
IJ
KL
Urb
anR
ural
Tota
lC
urre
nt M
onth
YTD
Urb
anR
ural
Tota
lU
rban
Rur
alTo
tal
Fres
no
10,1
2664
310
,769
972,
147
9,25
154
99,
800
91%
85%
91%
Impe
rial
323
17,1
7017
,493
100
2,62
921
911
,574
11,7
9368
%67
%67
%K
ern
8,39
531
,628
40,0
2370
38,
091
8,43
423
,013
31,4
4710
0%73
%79
%K
ings
3016
,587
16,6
1736
73,
072
1510
,953
10,9
6851
%66
%66
%Lo
s A
ngel
es96
1,52
14,
627
966,
148
13,9
0718
4,36
475
8,45
55,
110
763,
565
79%
110%
79%
Ora
nge
178,
897
017
8,89
71,
461
29,5
6912
1,88
00
121,
880
68%
0%68
%R
iver
side
176,
903
39,2
0921
6,11
22,
521
39,0
1112
5,83
619
,643
145,
479
71%
50%
67%
San
Ber
nard
ino
144,
227
7,46
315
1,68
92,
006
30,9
3211
4,72
74,
730
119,
457
80%
63%
79%
San
Lui
s O
bisp
o22
326
,361
26,5
8553
53,
692
2413
,340
13,3
6411
%51
%50
%S
anta
Bar
bara
22,5
5414
,092
36,6
4559
75,
509
12,2
4211
,003
23,2
4554
%78
%63
%Tu
lare
12,2
4940
,227
52,4
7676
211
,315
13,4
8032
,382
45,8
6211
0%80
%87
%V
entu
ra45
,430
6,52
451
,954
529
8,40
330
,849
4,90
535
,754
68%
75%
69%
Tota
l1,
560,
876
204,
532
1,76
5,40
823
,586
328,
733
1,19
5,41
213
7,20
21,
332,
614
77%
67%
75%
Gro
ss E
nrol
lmen
ts
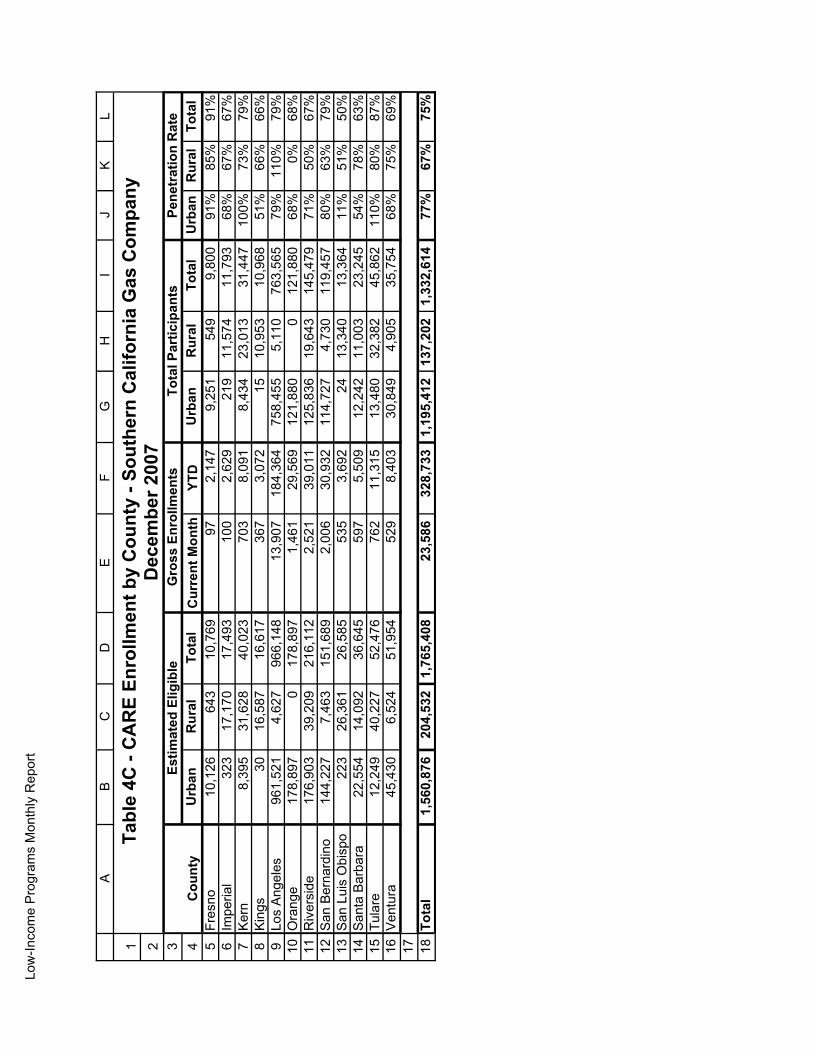
Tabl
e 4C
- C
AR
E En
rollm
ent b
y C
ount
y - S
outh
ern
Cal
iforn
ia G
as C
ompa
ny
Cou
nty
Estim
ated
Elig
ible
Tota
l Par
ticip
ants
Pene
trat
ion
Rat
eD
ecem
ber 2
007
Low-Income Programs Monthly Report
1
2
3456789
1011121314151617181920212223242526272829303132333435363738394041
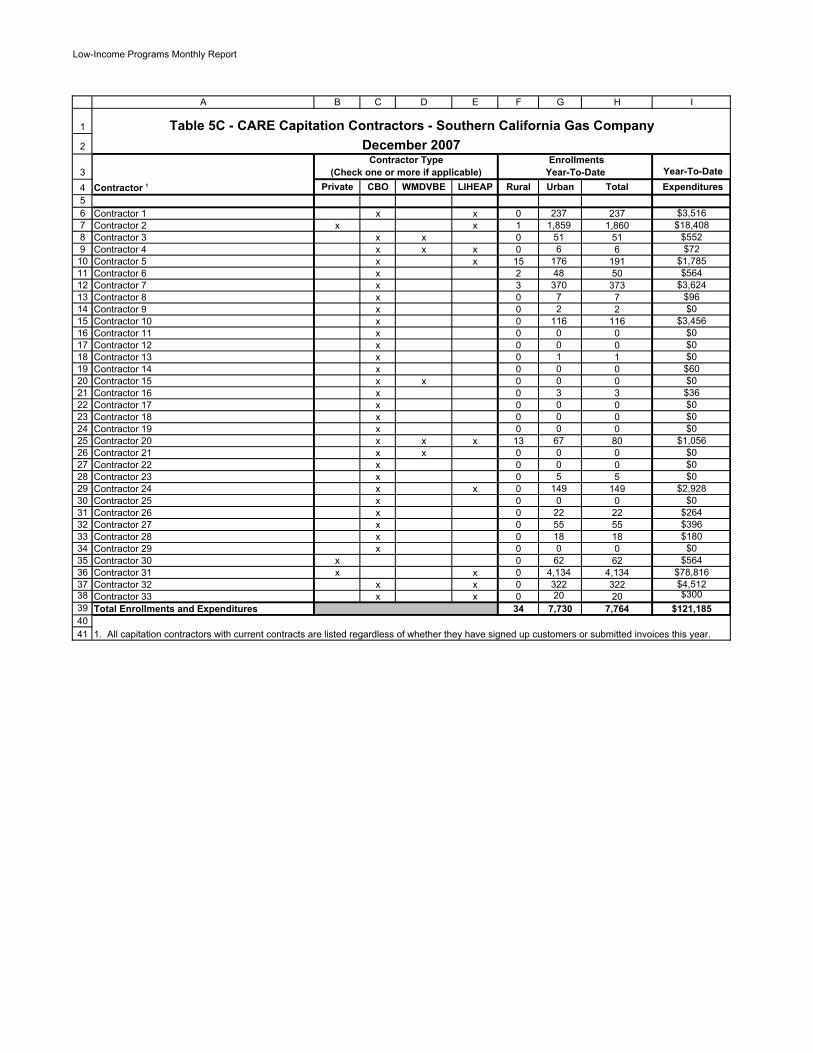
A B C D E F G H I
Year-To-Date Private CBO WMDVBE LIHEAP Rural Urban Total Expenditures
Contractor 1 x x 0 237 237 $3,516 Contractor 2 x x 1 1,859 1,860 $18,408 Contractor 3 x x 0 51 51 $552 Contractor 4 x x x 0 6 6 $72 Contractor 5 x x 15 176 191 $1,785 Contractor 6 x 2 48 50 $564 Contractor 7 x 3 370 373 $3,624 Contractor 8 x 0 7 7 $96 Contractor 9 x 0 2 2 $0 Contractor 10 x 0 116 116 $3,456 Contractor 11 x 0 0 0 $0 Contractor 12 x 0 0 0 $0 Contractor 13 x 0 1 1 $0 Contractor 14 x 0 0 0 $60 Contractor 15 x x 0 0 0 $0 Contractor 16 x 0 3 3 $36 Contractor 17 x 0 0 0 $0 Contractor 18 x 0 0 0 $0 Contractor 19 x 0 0 0 $0 Contractor 20 x x x 13 67 80 $1,056 Contractor 21 x x 0 0 0 $0 Contractor 22 x 0 0 0 $0 Contractor 23 x 0 5 5 $0 Contractor 24 x x 0 149 149 $2,928 Contractor 25 x 0 0 0 $0 Contractor 26 x 0 22 22 $264 Contractor 27 x 0 55 55 $396 Contractor 28 x 0 18 18 $180 Contractor 29 x 0 0 0 $0 Contractor 30 x 0 62 62 $564 Contractor 31 x x 0 4,134 4,134 $78,816 Contractor 32 x x 0 322 322 $4,512 Contractor 33 x x 0 20 20 $300 Total Enrollments and Expenditures 34 7,730 7,764 $121,185
Table 5C - CARE Capitation Contractors - Southern California Gas Company
Contractor 1
December 2007
1. All capitation contractors with current contracts are listed regardless of whether they have signed up customers or submitted invoices this year.
Contractor Type (Check one or more if applicable)
Enrollments Year-To-Date
Low-Income Programs Monthly Report
1234567891011121314
A B C D E
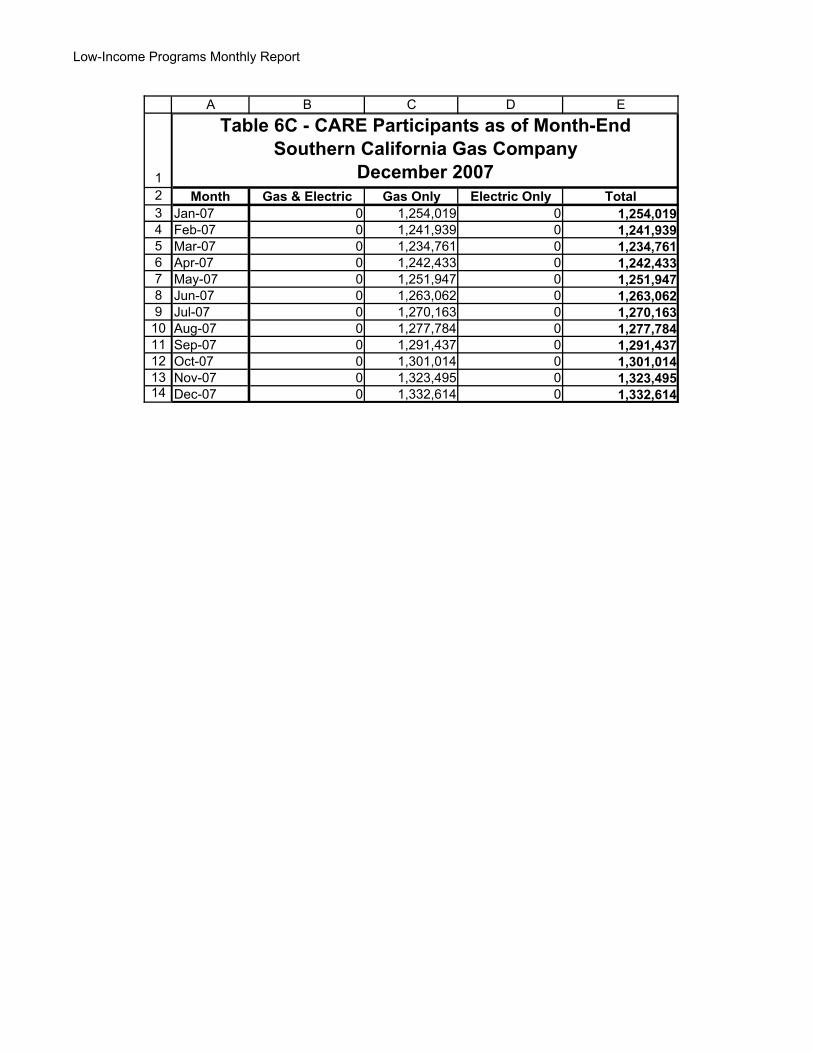
Month Gas & Electric Gas Only Electric Only TotalJan-07 0 1,254,019 0 1,254,019Feb-07 0 1,241,939 0 1,241,939Mar-07 0 1,234,761 0 1,234,761Apr-07 0 1,242,433 0 1,242,433May-07 0 1,251,947 0 1,251,947Jun-07 0 1,263,062 0 1,263,062Jul-07 0 1,270,163 0 1,270,163Aug-07 0 1,277,784 0 1,277,784Sep-07 0 1,291,437 0 1,291,437Oct-07 0 1,301,014 0 1,301,014Nov-07 0 1,323,495 0 1,323,495Dec-07 0 1,332,614 0 1,332,614
Table 6C - CARE Participants as of Month-EndSouthern California Gas Company
December 2007
CERTIFICATE OF SERVICE
I hereby certify that I have this day served a copy of the foregoing MONTHLY
REPORT OF SOUTHERN CALIFORNIA GAS COMPANY (U 904 G) ON LOW
INCOME ASSISTANCE PROGRAMS FOR DECEMBER 2007 on parties in R.07-01-
042 by electronic mail, and by Federal Express to Commissioner Dian M. Grueneich and
Administrative Law Judge Kim Malcolm.
Dated at San Diego, California, this 22nd day of January 2008.
/s/ Jenny Tjokro Jenny Tjokro