Embed Size (px)
Citation preview
International Journal of Prognostics and Health Management, ISSN 2153-2648, 2015 003
Envelope Analysis on Vibration Signals for Stator Winding Fault
Early Detection in 3-Phase Induction Motors
Chao Jin1, Agusmian P. Ompusunggu2, Zongchang Liu1, Hossein D. Ardakani1, Fredrik Petré2, and Jay Lee1
1NSF I/UCRC Center for Intelligent Maintenance Systems (IMS), University of Cincinnati, Cincinnati, OH, 45221, USA
2Flanders’ Mechatronics Technology Centre (FMTC), A Division of Flanders' Make vzw, Heverlee (Leuven), 3001, Belgium
ABSTRACT
This paper brings up a novel method for detecting induction
motor stator winding faults at an early stage. The contribution
of the work comes from the delicate handling of motor
vibration by applying envelope analysis, which makes it
possible to capture electrical short-circuit signature in
mechanical signals, even if the magnitude of the fault is fairly
incipient. Conventional induction motor condition-based
maintenance methods usually involve current and voltage
measurements, which could be expensive to collect, and
vibration-based analysis is often only capable of detecting the
fault when it is already quite significant. In contrast, the
solution presented in this study provides a refreshing
perspective by applying time-synchronous averaging to
remove the discrete frequency component, and amplitude
demodulation to further enhance the signal with the help of
kurtogram. Experimental results on a three-phase induction
motor show that the method is also able to distinguish
different fault severity levels.
1. INTRODUCTION
In various industrial applications, such as high-speed trains,
electric vehicles, industrial robots, and machine tools, three-
phase induction motors are always the driving force and one
of the key machines of the whole system. Even with
scheduled maintenance practices, unexpected failures of
induction motors could still occur in these systems which
would lead to excessive downtime and large losses in terms
of maintenance cost and lost revenue. Condition-based
maintenance (CBM) and predictive maintenance (PdM) have
been proven to be maintenance strategies that are able to
reduce unscheduled downtime and maintenance cost
(Jardine, Lin and Banjevic, 2006). In CBM, maintenance
activities are not scheduled for machines merely according to
history of maintenance records or predefined maintenance
rules on the basis of experience and/or expert knowledge, but
also based on the present health status of the machines from
sensory data, so that the waste owing to redundant
maintenance and failures will be avoided. Such maintenance
strategies require the integration of the following
technologies: (a) on-line condition monitoring, (b) fault
detection and diagnostics, and (c) prognostics.
Before designing any CBM or PdM strategies, common
failure modes and effects analysis need to be conducted in
order to identify the critical components and related issues.
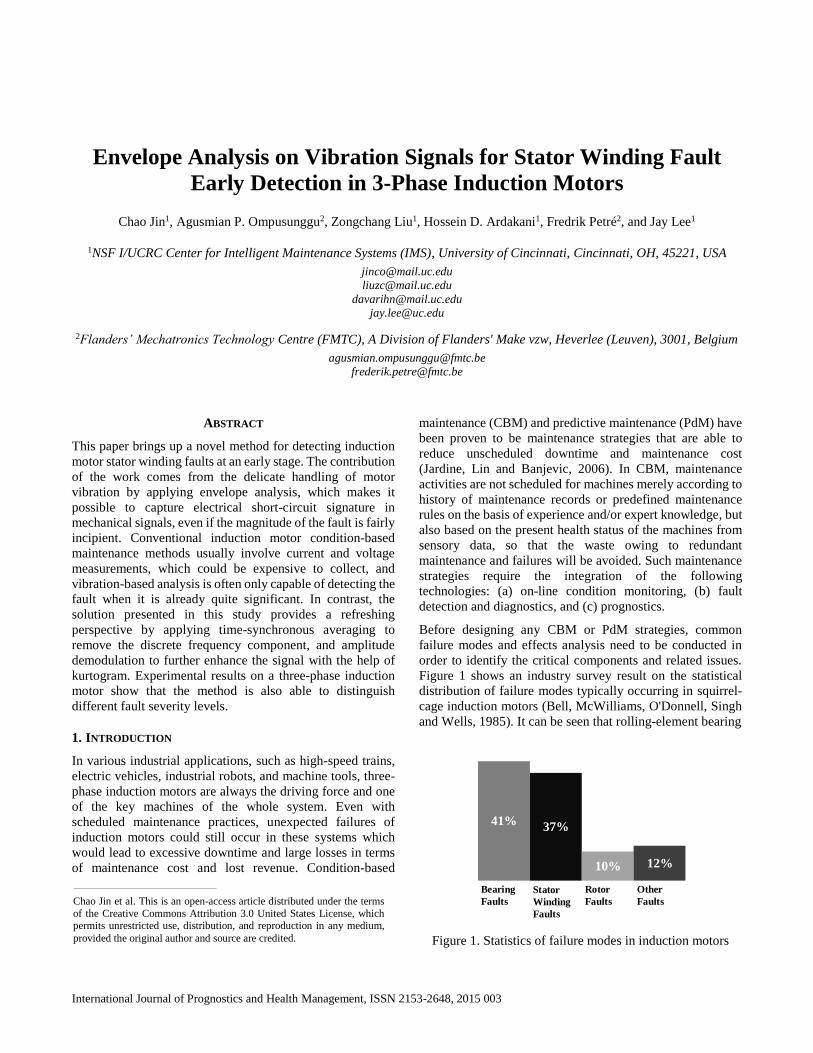
Figure 1 shows an industry survey result on the statistical
distribution of failure modes typically occurring in squirrel-
cage induction motors (Bell, McWilliams, O'Donnell, Singh
and Wells, 1985). It can be seen that rolling-element bearing
Figure 1. Statistics of failure modes in induction motors
41%37%
10% 12%
Bearing
Faults
Stator
Winding
Faults
Rotor
Faults
Other
FaultsChao Jin et al. This is an open-access article distributed under the terms
of the Creative Commons Attribution 3.0 United States License, which permits unrestricted use, distribution, and reproduction in any medium,
provided the original author and source are credited.
INTERNATIONAL JOURNAL OF PROGNOSTICS AND HEALTH MANAGEMENT
2
and stator winding failures due to insulation degradation
contributes to almost 80% of the causes for unexpected
breakdown in induction motors (Jover Rodríguez & Arkkio,
2008). For rotary machinery in general, condition
monitoring, diagnostics and prognostics for rolling-element
bearings have been well studied during the past four decades
due to its wide applications in almost all the rotary machinery
(Lin & Qu, 2000; Randall & Antoni, 2011; Siegel, Al-Atat,
Shauche, Liao, Snyder and Lee, 2012; Siegel, Ly and Lee,
2012).
For induction motor bearings in particular, vibration-based
and motor current signature analysis based monitoring
methods for rolling-element bearings in induction motors
have been widely published in literature (Kliman & Stein,
1992; Nandi, Toliyat and Li, 2005). However, the condition
monitoring for winding insulation faults, especially
vibration-based diagnostic and prognostic methods remain
limited.
Winding faults due to stator coil degradation can be classified
into four categories (Ukil, Chen and Andenna, 2011), namely
(a) inter-turn short of the same phase, (b) short between coils
of same phase, (c) short between two phases, and (d) short
between phase to earth. Among them, inter-turn faults are
considered to be the most challenging type of winding faults
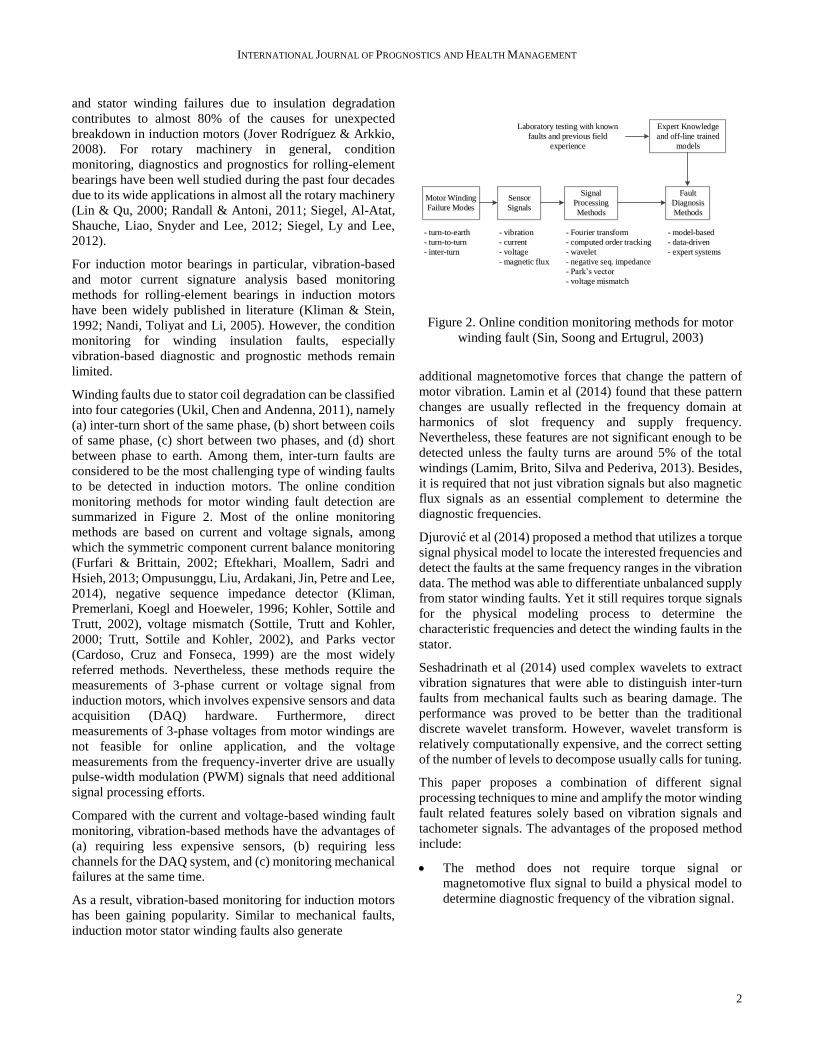
to be detected in induction motors. The online condition
monitoring methods for motor winding fault detection are
summarized in Figure 2. Most of the online monitoring
methods are based on current and voltage signals, among
which the symmetric component current balance monitoring
(Furfari & Brittain, 2002; Eftekhari, Moallem, Sadri and
Hsieh, 2013; Ompusunggu, Liu, Ardakani, Jin, Petre and Lee,
2014), negative sequence impedance detector (Kliman,
Premerlani, Koegl and Hoeweler, 1996; Kohler, Sottile and
Trutt, 2002), voltage mismatch (Sottile, Trutt and Kohler,
2000; Trutt, Sottile and Kohler, 2002), and Parks vector
(Cardoso, Cruz and Fonseca, 1999) are the most widely
referred methods. Nevertheless, these methods require the
measurements of 3-phase current or voltage signal from
induction motors, which involves expensive sensors and data
acquisition (DAQ) hardware. Furthermore, direct
measurements of 3-phase voltages from motor windings are
not feasible for online application, and the voltage
measurements from the frequency-inverter drive are usually
pulse-width modulation (PWM) signals that need additional
signal processing efforts.
Compared with the current and voltage-based winding fault
monitoring, vibration-based methods have the advantages of
(a) requiring less expensive sensors, (b) requiring less
channels for the DAQ system, and (c) monitoring mechanical
failures at the same time.
As a result, vibration-based monitoring for induction motors
has been gaining popularity. Similar to mechanical faults,
induction motor stator winding faults also generate
Expert Knowledge
and off-line trained
models
Laboratory testing with known
faults and previous field
experience
Motor Winding
Failure Modes
Sensor
Signals
Signal
Processing
Methods
Fault
Diagnosis
Methods
- turn-to-earth
- turn-to-turn
- inter-turn
- vibration
- current
- voltage
- magnetic flux
- Fourier transform
- computed order tracking
- wavelet
- negative seq. impedance
- Park’s vector
- voltage mismatch
- model-based
- data-driven
- expert systems
Figure 2. Online condition monitoring methods for motor
winding fault (Sin, Soong and Ertugrul, 2003)
additional magnetomotive forces that change the pattern of
motor vibration. Lamin et al (2014) found that these pattern
changes are usually reflected in the frequency domain at
harmonics of slot frequency and supply frequency.
Nevertheless, these features are not significant enough to be
detected unless the faulty turns are around 5% of the total
windings (Lamim, Brito, Silva and Pederiva, 2013). Besides,
it is required that not just vibration signals but also magnetic
flux signals as an essential complement to determine the
diagnostic frequencies.
Djurović et al (2014) proposed a method that utilizes a torque
signal physical model to locate the interested frequencies and
detect the faults at the same frequency ranges in the vibration
data. The method was able to differentiate unbalanced supply
from stator winding faults. Yet it still requires torque signals
for the physical modeling process to determine the
characteristic frequencies and detect the winding faults in the
stator.
Seshadrinath et al (2014) used complex wavelets to extract
vibration signatures that were able to distinguish inter-turn
faults from mechanical faults such as bearing damage. The
performance was proved to be better than the traditional
discrete wavelet transform. However, wavelet transform is
relatively computationally expensive, and the correct setting
of the number of levels to decompose usually calls for tuning.
This paper proposes a combination of different signal
processing techniques to mine and amplify the motor winding
fault related features solely based on vibration signals and
tachometer signals. The advantages of the proposed method
include:
The method does not require torque signal or
magnetomotive flux signal to build a physical model to
determine diagnostic frequency of the vibration signal.
INTERNATIONAL JOURNAL OF PROGNOSTICS AND HEALTH MANAGEMENT
3
The fault detection process can be much more automated
and can be applied by users with minimum domain
knowledge.
As a data-driven method, there is also less parameters to
tune and less computationally complex compared to
other peer methods.
The focus of this research was neither to differentiate winding
faults from mechanical faults, nor tell the difference between
unbalanced stator winding from unbalanced supply, but to
explore the possibility of detecting stator inter-turn faults at a
very early stage, and try to find an automatic way to
determine the frequency ranges that contain diagnostic
information. Time synchronous averaging, spectral kurtosis
filtering, and envelope analysis have been implemented in the
signal processing process. As will be discussed in the results
section, the first order of envelope spectrum shows
monotonically increasing trend as the level of winding
insulation degradation increases.
The remaining part of the paper is organized as follows:
Section 2 discusses about the methodology development and
theoretical background of the signal processing techniques
applied to the motor vibration signals; Section 3 briefly
introduces the experimental setup and the test procedure for
data generation; Section 4 demonstrates the effectiveness of
the proposed vibration signal processing methods and the
selected features through the experimental data analysis; and
Section 5 summarizes the important findings obtained in this
study.
2. METHODOLOGY DEVELOPMENT
2.1. Method Overview
Vibration-based signal processing has long been favored for
the diagnostics and prognostics of mechanical faults in rotary
machinery, such as rolling-element bearings and gearboxes
(Al-Atat, Siegel and Lee, 2011; Randall & Antoni, 2011).
Depending on the physics of faults, some mechanical faults
such as unbalance and gear eccentricity manifest periodic
vibration signature. Other type of faults assume that the
concerned fault would lead to transients and impulses in
vibration signals, which do not occur in the nominal state.
Inspired by the rolling-element bearing fault diagnosis
(Randall & Antoni, 2011), this paper addresses the issue of
detecting induction motor stator inter-turn faults when they
are still preliminary. Detection of the impulses hidden in the
smearing and noise calls for appropriate signal processing
techniques to diminish the effect of deterministic vibration
patterns generated by mechanical structure, and emphasize
the faulty characteristics buried in the remaining random part
(Randall & Antoni, 2011). It is assumed that stator winding
fault will cause disturbance in the magnetic field which might
be taken as random variation in regular frequency analyses of
the raw signal. The induction motor vibration signal is then
assumed to be cyclostationary and the winding fault
diagnostic information can be detected using envelop
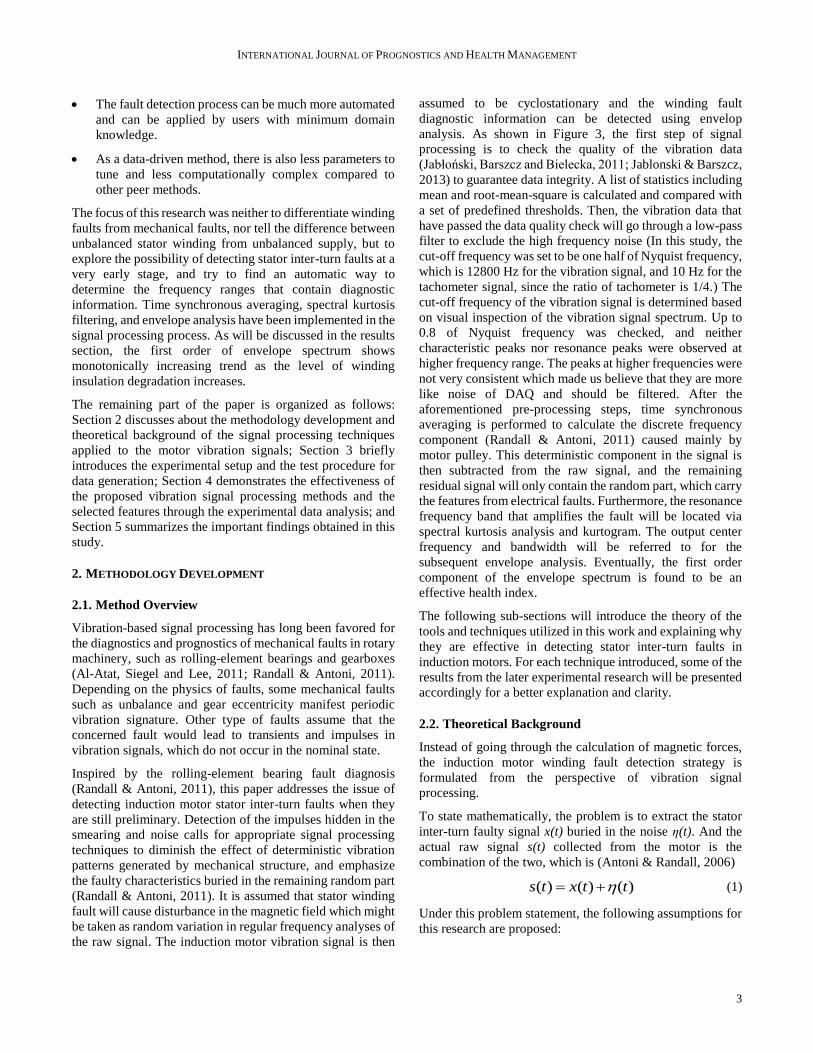
analysis. As shown in Figure 3, the first step of signal
processing is to check the quality of the vibration data
(Jabłoński, Barszcz and Bielecka, 2011; Jablonski & Barszcz,
2013) to guarantee data integrity. A list of statistics including
mean and root-mean-square is calculated and compared with
a set of predefined thresholds. Then, the vibration data that
have passed the data quality check will go through a low-pass
filter to exclude the high frequency noise (In this study, the
cut-off frequency was set to be one half of Nyquist frequency,
which is 12800 Hz for the vibration signal, and 10 Hz for the
tachometer signal, since the ratio of tachometer is 1/4.) The
cut-off frequency of the vibration signal is determined based
on visual inspection of the vibration signal spectrum. Up to
0.8 of Nyquist frequency was checked, and neither
characteristic peaks nor resonance peaks were observed at
higher frequency range. The peaks at higher frequencies were
not very consistent which made us believe that they are more
like noise of DAQ and should be filtered. After the
aforementioned pre-processing steps, time synchronous
averaging is performed to calculate the discrete frequency
component (Randall & Antoni, 2011) caused mainly by
motor pulley. This deterministic component in the signal is
then subtracted from the raw signal, and the remaining
residual signal will only contain the random part, which carry
the features from electrical faults. Furthermore, the resonance
frequency band that amplifies the fault will be located via
spectral kurtosis analysis and kurtogram. The output center
frequency and bandwidth will be referred to for the
subsequent envelope analysis. Eventually, the first order
component of the envelope spectrum is found to be an
effective health index.
The following sub-sections will introduce the theory of the
tools and techniques utilized in this work and explaining why
they are effective in detecting stator inter-turn faults in
induction motors. For each technique introduced, some of the
results from the later experimental research will be presented
accordingly for a better explanation and clarity.
2.2. Theoretical Background
Instead of going through the calculation of magnetic forces,
the induction motor winding fault detection strategy is
formulated from the perspective of vibration signal
processing.
To state mathematically, the problem is to extract the stator
inter-turn faulty signal x(t) buried in the noise η(t). And the
actual raw signal s(t) collected from the motor is the
combination of the two, which is (Antoni & Randall, 2006)
( )( ) ( )s t x t t (1)
Under this problem statement, the following assumptions for
this research are proposed:
INTERNATIONAL JOURNAL OF PROGNOSTICS AND HEALTH MANAGEMENT
4
Vibration Signal Tachometer Signal
Data Quality Test Low-pass Filter
Low-pass Filter
Time Synchronous
Averaging
Band-pass Filter
Kurtogram
Fast Fourier
Transform
Envelope Spectrum
Signal
Pre-processing
Residual
Signal Est.
Bandwidth
Squared Envelope
Signal Est.
Signal
Enhancement
Amplitude
Demodulation
Figure 3. Flowchart of inter-turn fault detection for three-
phase induction motors using vibration signal.
1. The inter-turn faulty signal x(t) has transients and
contains impulses, which do not occur, or follow a
different pattern in the healthy conditions;
2. The noise η(t) refers to not only the stationary
measurement noise, but also the discrete frequency
component, namely the vibration influence from the
mechanical elements such as shaft and geared
pulley.
2.2.1. Time synchronous averaging
Time synchronous averaging (TSA) is an essential tool for
rotating machines that extracts periodic waveforms from
noisy data. TSA is performed with respect to a certain shaft
according to the tachometer signal as angular position
reference. Vibration signals that went through TSA process
will have an integer number of orders of the fundamental
harmonic (shaft frequency) retained, and other non-
synchronous vibration components weakened. If the
synchronous-averaged signal is subtracted from the original
signal, the residual signal with the harmonics of the shaft
frequency removed will be obtained. Both the synchronous-
averaged signal and residual signal contain diagnostic
information of different failure mode (Al-Atat et al., 2011).
While there are many different techniques for TSA, zero
crossing-based technique is the most widely used method.
Zero crossing-based TSA resamples the vibration signal to
angular domain where the samples recorded in one shaft
rotation are interpolated into a fixed number of data points
for each revolution. The number of points per revolution N is
derived from Eq. (2):
2(log m )ax( )2
ceiling nN (2)
where n is the number of points between two subsequent zero
crossing indices of the tachometer signal (Bechhoefer &
Kingsley, 2009), and “ceiling” represents the process of
rounding toward positive infinity.
However, it should be noted that resampling from time
domain to angular domain will cause problems for the
following signal processing steps since the kernel functions
of kurtogram, filtering, and envelope analysis have a constant
frequency (Δt) instead of constant angle (Δθ). Hence the
synchronous-averaged signal should be interpolated back to
its original time-based sampling mechanism before
calculating the residual signal.
The procedure of obtaining the residual signal from TSA is
summarized as follows:
(1) Find zero-crossing indices in the tachometer signal
and calculate the zero crossing time (ZCT) with
interpolation.
(2) For each ZCT, calculate the time between ZTCk and
ZCTk+1, namely, dZCTk, where k is the crossing
point index.
(3) Calculate the resampled time interval: dZCT/N,
where N is given by Eq. (2). Interpolate the signal to
the newly resampled time and accumulate the
resampled data.
(4) Save the original time stamps for each revolution.
(5) Repeat step (2) through (4) for all the revolutions,
and then divide the accumulated N point vector by
number of revolutions.
(6) Interpolate the N point vector (TSA signal) back to
the original time stamps for each revolution, and
combine the interpolated TSA signal to get the same
length of vector as the original data.
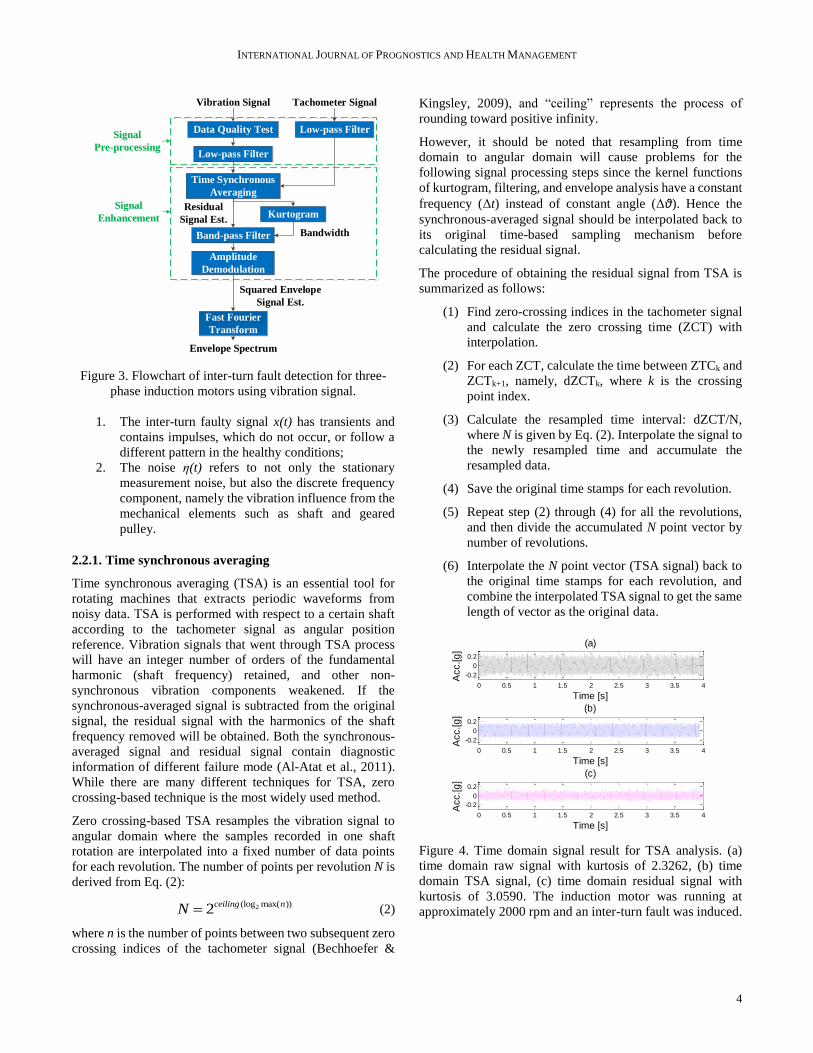
Figure 4. Time domain signal result for TSA analysis. (a)
time domain raw signal with kurtosis of 2.3262, (b) time
domain TSA signal, (c) time domain residual signal with
kurtosis of 3.0590. The induction motor was running at
approximately 2000 rpm and an inter-turn fault was induced.
0 0.5 1 1.5 2 2.5 3 3.5 4
-0.2
0
0.2
(a)
Time [s]
Acc.[g
]
0 0.5 1 1.5 2 2.5 3 3.5 4
-0.2
0
0.2
(b)
Time [s]
Acc.[g
]
0 0.5 1 1.5 2 2.5 3 3.5 4
-0.2
0
0.2
(c)
Time [s]
Acc.[g
]
INTERNATIONAL JOURNAL OF PROGNOSTICS AND HEALTH MANAGEMENT
5
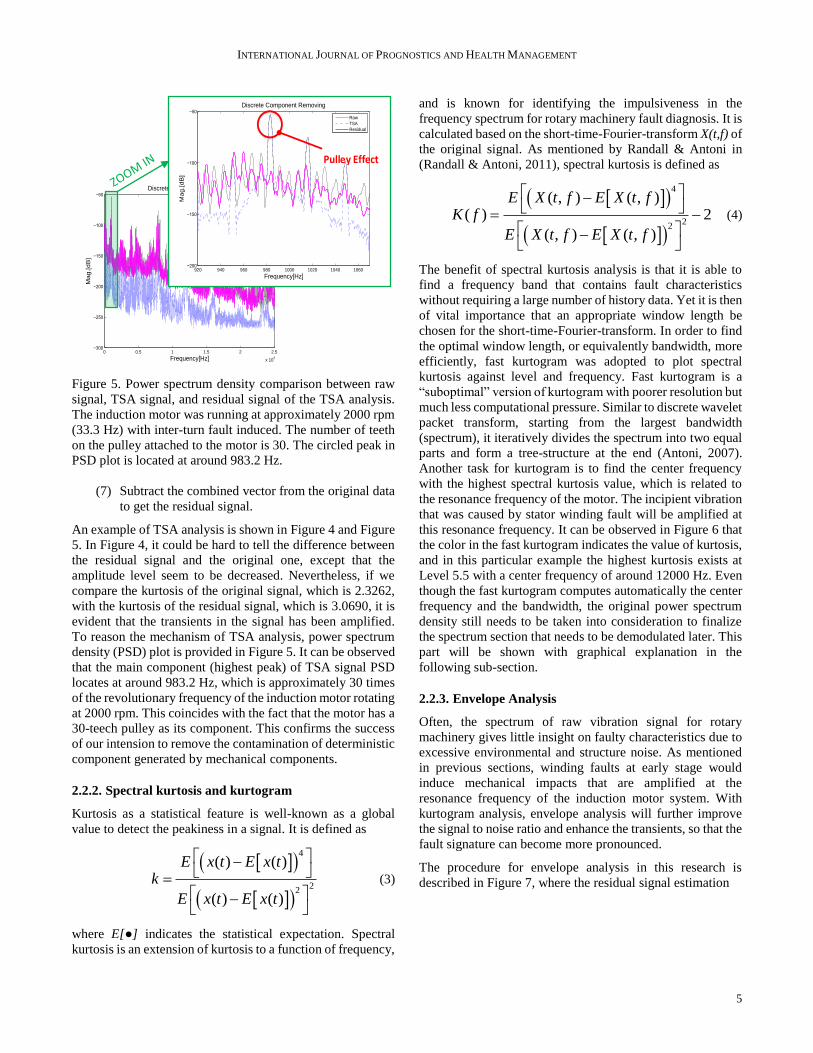
Figure 5. Power spectrum density comparison between raw
signal, TSA signal, and residual signal of the TSA analysis.
The induction motor was running at approximately 2000 rpm
(33.3 Hz) with inter-turn fault induced. The number of teeth
on the pulley attached to the motor is 30. The circled peak in
PSD plot is located at around 983.2 Hz.
(7) Subtract the combined vector from the original data
to get the residual signal.
An example of TSA analysis is shown in Figure 4 and Figure
5. In Figure 4, it could be hard to tell the difference between
the residual signal and the original one, except that the
amplitude level seem to be decreased. Nevertheless, if we
compare the kurtosis of the original signal, which is 2.3262,
with the kurtosis of the residual signal, which is 3.0690, it is
evident that the transients in the signal has been amplified.
To reason the mechanism of TSA analysis, power spectrum
density (PSD) plot is provided in Figure 5. It can be observed
that the main component (highest peak) of TSA signal PSD
locates at around 983.2 Hz, which is approximately 30 times
of the revolutionary frequency of the induction motor rotating
at 2000 rpm. This coincides with the fact that the motor has a
30-teech pulley as its component. This confirms the success
of our intension to remove the contamination of deterministic
component generated by mechanical components.
2.2.2. Spectral kurtosis and kurtogram
Kurtosis as a statistical feature is well-known as a global
value to detect the peakiness in a signal. It is defined as
4
22
( ) ( )
( ) ( )
E x t E x tk
E x t E x t
(3)
where E[●] indicates the statistical expectation. Spectral
kurtosis is an extension of kurtosis to a function of frequency,
and is known for identifying the impulsiveness in the
frequency spectrum for rotary machinery fault diagnosis. It is
calculated based on the short-time-Fourier-transform X(t,f) of
the original signal. As mentioned by Randall & Antoni in
(Randall & Antoni, 2011), spectral kurtosis is defined as
4
22
( , ) ( , )( ) 2
( , ) ( , )
E X t f E X t fK f
E X t f E X t f
(4)
The benefit of spectral kurtosis analysis is that it is able to
find a frequency band that contains fault characteristics
without requiring a large number of history data. Yet it is then
of vital importance that an appropriate window length be
chosen for the short-time-Fourier-transform. In order to find
the optimal window length, or equivalently bandwidth, more
efficiently, fast kurtogram was adopted to plot spectral
kurtosis against level and frequency. Fast kurtogram is a
“suboptimal” version of kurtogram with poorer resolution but
much less computational pressure. Similar to discrete wavelet
packet transform, starting from the largest bandwidth
(spectrum), it iteratively divides the spectrum into two equal
parts and form a tree-structure at the end (Antoni, 2007).
Another task for kurtogram is to find the center frequency
with the highest spectral kurtosis value, which is related to
the resonance frequency of the motor. The incipient vibration
that was caused by stator winding fault will be amplified at
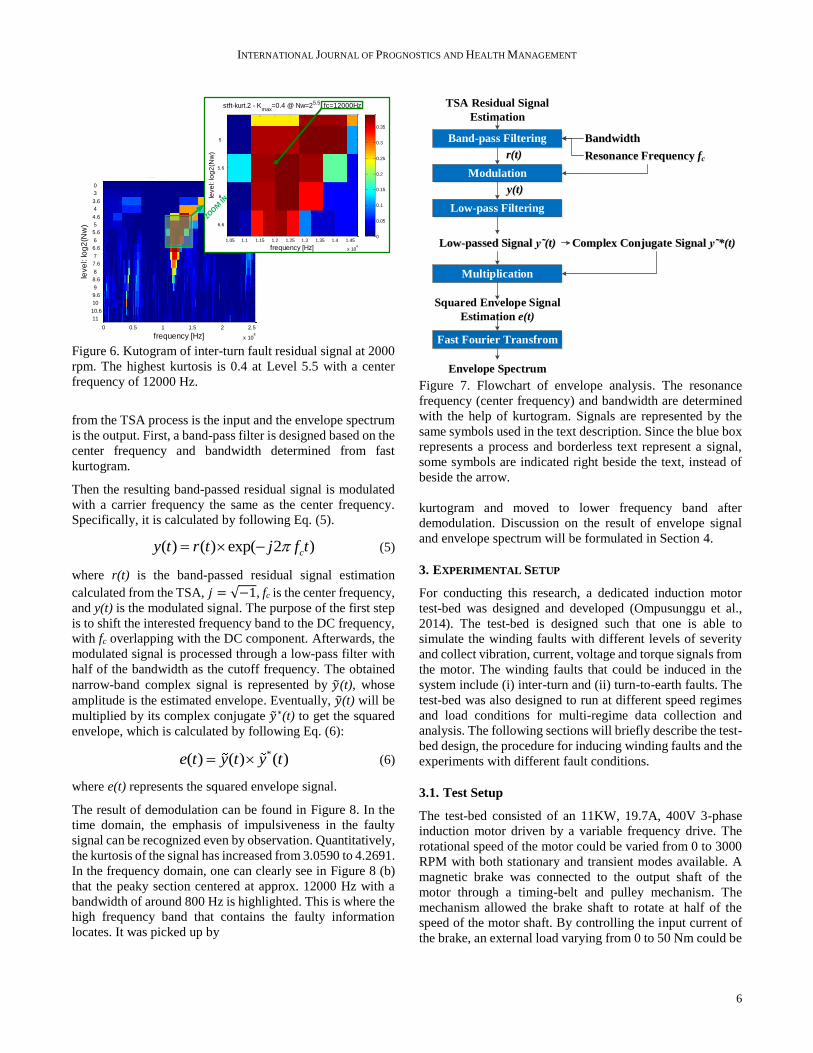
this resonance frequency. It can be observed in Figure 6 that
the color in the fast kurtogram indicates the value of kurtosis,
and in this particular example the highest kurtosis exists at
Level 5.5 with a center frequency of around 12000 Hz. Even
though the fast kurtogram computes automatically the center
frequency and the bandwidth, the original power spectrum
density still needs to be taken into consideration to finalize
the spectrum section that needs to be demodulated later. This
part will be shown with graphical explanation in the
following sub-section.
2.2.3. Envelope Analysis
Often, the spectrum of raw vibration signal for rotary
machinery gives little insight on faulty characteristics due to
excessive environmental and structure noise. As mentioned
in previous sections, winding faults at early stage would
induce mechanical impacts that are amplified at the
resonance frequency of the induction motor system. With
kurtogram analysis, envelope analysis will further improve
the signal to noise ratio and enhance the transients, so that the
fault signature can become more pronounced.
The procedure for envelope analysis in this research is
described in Figure 7, where the residual signal estimation
0 0.5 1 1.5 2 2.5
x 104
−300
−250
−200
−150
−100
−50
Frequency[Hz]
Ma
g.[
dB
]
Discrete Component Removing
Raw
TSA
Residual
920 940 960 980 1000 1020 1040 1060−200
−150
−100
−50
Frequency[Hz]
Ma
g.[
dB
]
Discrete Component Removing
Raw
TSA
Residual
Pulley Effect
INTERNATIONAL JOURNAL OF PROGNOSTICS AND HEALTH MANAGEMENT
6
frequency [Hz]
leve
l: lo
g2
(Nw
)
stft-kurt.2 - Kmax
=0.4 @ Nw=25.5
, fc=12000Hz
0 0.5 1 1.5 2 2.5
x 104
0
3
3.6
4
4.6
5
5.6
6
6.6
7
7.6
8
8.6
9
9.6
10
10.6
11 0
0.05
0.1
0.15
0.2
0.25
0.3
0.35
frequency [Hz]
leve
l: lo
g2
(Nw
)
stft-kurt.2 - Kmax
=0.4 @ Nw=25.5
, fc=12000Hz
1.05 1.1 1.15 1.2 1.25 1.3 1.35 1.4 1.45
x 104
5
5.6
6
6.6
0
0.05
0.1
0.15
0.2
0.25
0.3
0.35
ZOOM
IN
Figure 6. Kutogram of inter-turn fault residual signal at 2000
rpm. The highest kurtosis is 0.4 at Level 5.5 with a center
frequency of 12000 Hz.
from the TSA process is the input and the envelope spectrum
is the output. First, a band-pass filter is designed based on the
center frequency and bandwidth determined from fast
kurtogram.
Then the resulting band-passed residual signal is modulated
with a carrier frequency the same as the center frequency.
Specifically, it is calculated by following Eq. (5).
( ) ( ) exp( 2 )cy t r t j tf (5)
where r(t) is the band-passed residual signal estimation
calculated from the TSA, 𝑗 = √−1, fc is the center frequency,
and y(t) is the modulated signal. The purpose of the first step
is to shift the interested frequency band to the DC frequency,
with fc overlapping with the DC component. Afterwards, the
modulated signal is processed through a low-pass filter with
half of the bandwidth as the cutoff frequency. The obtained
narrow-band complex signal is represented by �̃�(t), whose
amplitude is the estimated envelope. Eventually, �̃�(t) will be
multiplied by its complex conjugate �̃�∗(t) to get the squared
envelope, which is calculated by following Eq. (6):
*( ) ( ) ( )e t y t y t (6)
where e(t) represents the squared envelope signal.
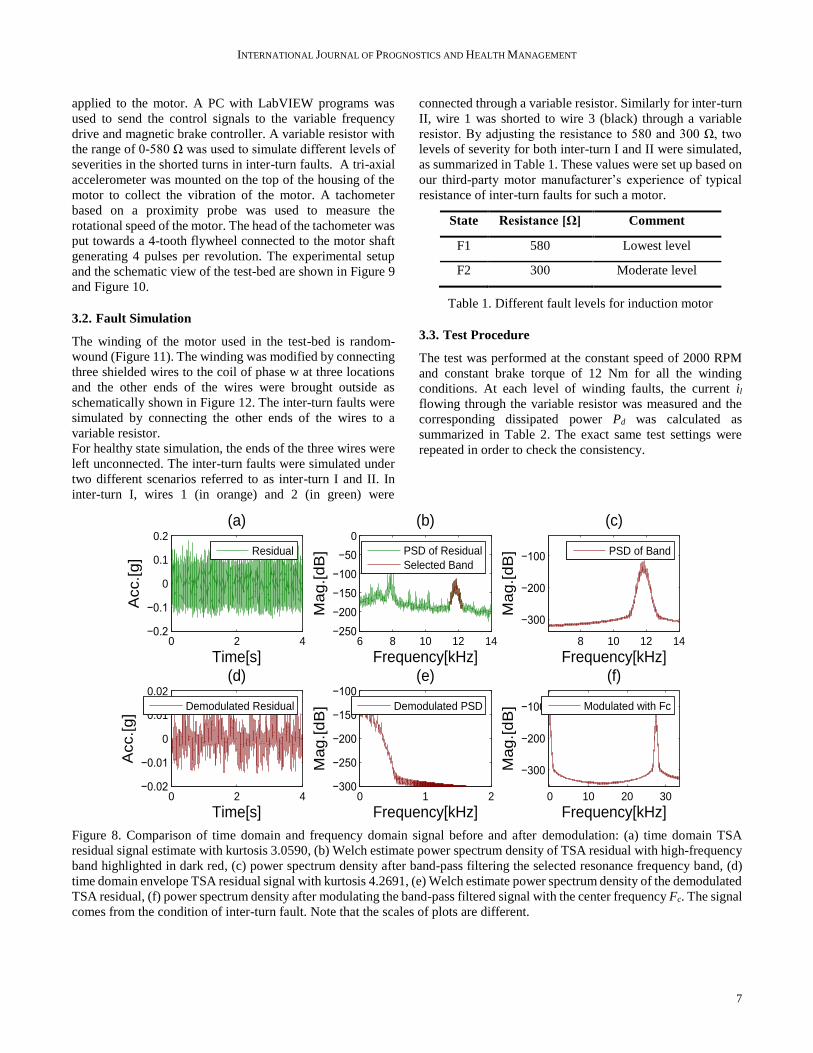
The result of demodulation can be found in Figure 8. In the
time domain, the emphasis of impulsiveness in the faulty
signal can be recognized even by observation. Quantitatively,
the kurtosis of the signal has increased from 3.0590 to 4.2691.
In the frequency domain, one can clearly see in Figure 8 (b)
that the peaky section centered at approx. 12000 Hz with a
bandwidth of around 800 Hz is highlighted. This is where the
high frequency band that contains the faulty information
locates. It was picked up by
TSA Residual Signal
Estimation
Band-pass Filtering
Squared Envelope Signal
Estimation e(t)
Multiplication
Complex Conjugate Signal y˜*(t)
Fast Fourier Transfrom
Envelope Spectrum
Modulation
Low-pass Filtering
Bandwidth
Resonance Frequency fc
Low-passed Signal y˜(t)
r(t)
y(t)
Figure 7. Flowchart of envelope analysis. The resonance
frequency (center frequency) and bandwidth are determined
with the help of kurtogram. Signals are represented by the
same symbols used in the text description. Since the blue box
represents a process and borderless text represent a signal,
some symbols are indicated right beside the text, instead of
beside the arrow.
kurtogram and moved to lower frequency band after
demodulation. Discussion on the result of envelope signal
and envelope spectrum will be formulated in Section 4.
3. EXPERIMENTAL SETUP
For conducting this research, a dedicated induction motor
test-bed was designed and developed (Ompusunggu et al.,
2014). The test-bed is designed such that one is able to
simulate the winding faults with different levels of severity
and collect vibration, current, voltage and torque signals from
the motor. The winding faults that could be induced in the
system include (i) inter-turn and (ii) turn-to-earth faults. The
test-bed was also designed to run at different speed regimes
and load conditions for multi-regime data collection and
analysis. The following sections will briefly describe the test-
bed design, the procedure for inducing winding faults and the
experiments with different fault conditions.
3.1. Test Setup
The test-bed consisted of an 11KW, 19.7A, 400V 3-phase
induction motor driven by a variable frequency drive. The
rotational speed of the motor could be varied from 0 to 3000
RPM with both stationary and transient modes available. A
magnetic brake was connected to the output shaft of the
motor through a timing-belt and pulley mechanism. The
mechanism allowed the brake shaft to rotate at half of the
speed of the motor shaft. By controlling the input current of
the brake, an external load varying from 0 to 50 Nm could be
INTERNATIONAL JOURNAL OF PROGNOSTICS AND HEALTH MANAGEMENT
7
applied to the motor. A PC with LabVIEW programs was
used to send the control signals to the variable frequency
drive and magnetic brake controller. A variable resistor with
the range of 0-580 Ω was used to simulate different levels of
severities in the shorted turns in inter-turn faults. A tri-axial
accelerometer was mounted on the top of the housing of the
motor to collect the vibration of the motor. A tachometer
based on a proximity probe was used to measure the
rotational speed of the motor. The head of the tachometer was
put towards a 4-tooth flywheel connected to the motor shaft
generating 4 pulses per revolution. The experimental setup
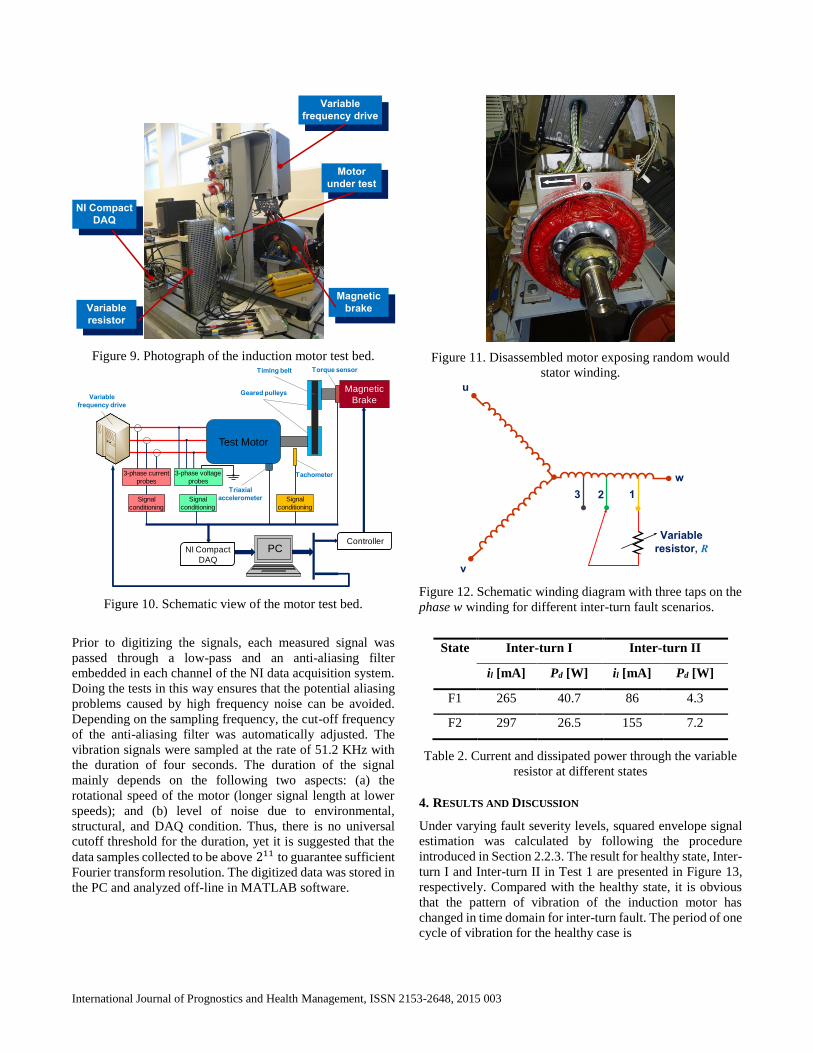
and the schematic view of the test-bed are shown in Figure 9
and Figure 10.
3.2. Fault Simulation
The winding of the motor used in the test-bed is random-
wound (Figure 11). The winding was modified by connecting
three shielded wires to the coil of phase w at three locations
and the other ends of the wires were brought outside as
schematically shown in Figure 12. The inter-turn faults were
simulated by connecting the other ends of the wires to a
variable resistor.
For healthy state simulation, the ends of the three wires were
left unconnected. The inter-turn faults were simulated under
two different scenarios referred to as inter-turn I and II. In
inter-turn I, wires 1 (in orange) and 2 (in green) were
connected through a variable resistor. Similarly for inter-turn
II, wire 1 was shorted to wire 3 (black) through a variable
resistor. By adjusting the resistance to 580 and 300 Ω, two
levels of severity for both inter-turn I and II were simulated,
as summarized in Table 1. These values were set up based on
our third-party motor manufacturer’s experience of typical
resistance of inter-turn faults for such a motor.
State Resistance [Ω] Comment
F1 580 Lowest level
F2 300 Moderate level
Table 1. Different fault levels for induction motor
3.3. Test Procedure
The test was performed at the constant speed of 2000 RPM
and constant brake torque of 12 Nm for all the winding
conditions. At each level of winding faults, the current il
flowing through the variable resistor was measured and the
corresponding dissipated power Pd was calculated as
summarized in Table 2. The exact same test settings were
repeated in order to check the consistency.
Figure 8. Comparison of time domain and frequency domain signal before and after demodulation: (a) time domain TSA
residual signal estimate with kurtosis 3.0590, (b) Welch estimate power spectrum density of TSA residual with high-frequency
band highlighted in dark red, (c) power spectrum density after band-pass filtering the selected resonance frequency band, (d)
time domain envelope TSA residual signal with kurtosis 4.2691, (e) Welch estimate power spectrum density of the demodulated
TSA residual, (f) power spectrum density after modulating the band-pass filtered signal with the center frequency Fc. The signal
comes from the condition of inter-turn fault. Note that the scales of plots are different.
0 2 4−0.2
−0.1
0
0.1
0.2
Time[s]
Acc.[
g]
(a)
0 2 4−0.02
−0.01
0
0.01
0.02
Time[s]
Acc.[
g]
(d)
6 8 10 12 14−250
−200
−150
−100
−50
0
Frequency[kHz]
Ma
g.[d
B]
(b)
8 10 12 14
−300
−200
−100
Frequency[kHz]
Ma
g.[d
B]
(c)
0 10 20 30
−300
−200
−100
Frequency[kHz]
Mag
.[d
B]
(f)
0 1 2−300
−250
−200
−150
−100
Frequency[kHz]
Mag
.[d
B]
(e)
Residual
Demodulated Residual
PSD of Residual
Selected Band
PSD of Band
Modulated with FcDemodulated PSD
International Journal of Prognostics and Health Management, ISSN 2153-2648, 2015 003
Figure 9. Photograph of the induction motor test bed.
Figure 10. Schematic view of the motor test bed.
Prior to digitizing the signals, each measured signal was
passed through a low-pass and an anti-aliasing filter
embedded in each channel of the NI data acquisition system.
Doing the tests in this way ensures that the potential aliasing
problems caused by high frequency noise can be avoided.
Depending on the sampling frequency, the cut-off frequency
of the anti-aliasing filter was automatically adjusted. The
vibration signals were sampled at the rate of 51.2 KHz with
the duration of four seconds. The duration of the signal
mainly depends on the following two aspects: (a) the
rotational speed of the motor (longer signal length at lower
speeds); and (b) level of noise due to environmental,
structural, and DAQ condition. Thus, there is no universal
cutoff threshold for the duration, yet it is suggested that the
data samples collected to be above 211 to guarantee sufficient
Fourier transform resolution. The digitized data was stored in
the PC and analyzed off-line in MATLAB software.
Figure 11. Disassembled motor exposing random would
stator winding.
Figure 12. Schematic winding diagram with three taps on the
phase w winding for different inter-turn fault scenarios.
State Inter-turn I Inter-turn II
il [mA] Pd [W] il [mA] Pd [W]
F1 265 40.7 86 4.3
F2 297 26.5 155 7.2
Table 2. Current and dissipated power through the variable
resistor at different states
4. RESULTS AND DISCUSSION
Under varying fault severity levels, squared envelope signal
estimation was calculated by following the procedure
introduced in Section 2.2.3. The result for healthy state, Inter-
turn I and Inter-turn II in Test 1 are presented in Figure 13,
respectively. Compared with the healthy state, it is obvious
that the pattern of vibration of the induction motor has
changed in time domain for inter-turn fault. The period of one
cycle of vibration for the healthy case is
NI Compact
DAQ
Motor
under test
Variable
resistor
Variable
frequency drive
Magnetic
brake
Magnetic
Brake
Test Motor
Signal
conditioning
3-phase voltage
probes
Triaxial
accelerometer
Tachometer
Geared pulleys
Timing belt
Variable
frequency drive
Signal
conditioning
3-phase current
probes
Signal
conditioning
ControllerNI Compact
DAQ
Torque sensor
PC
u
v
w
123
Variable
resistor, R
INTERNATIONAL JOURNAL OF PROGNOSTICS AND HEALTH MANAGEMENT
9
0.85 0.9 0.95 1 1.05 1.1 1.150
1
2
x 10-4
Am
plit
ud
e
(1)
0.85 0.9 0.95 1 1.05 1.1 1.150
1
2
x 10-4
Am
plit
ud
e
(2)
0.85 0.9 0.95 1 1.05 1.1 1.150
1
2
x 10-4
Time[s]
Am
plit
ud
e
(3)
0.0300 s
0.0304 s
0.0456 s
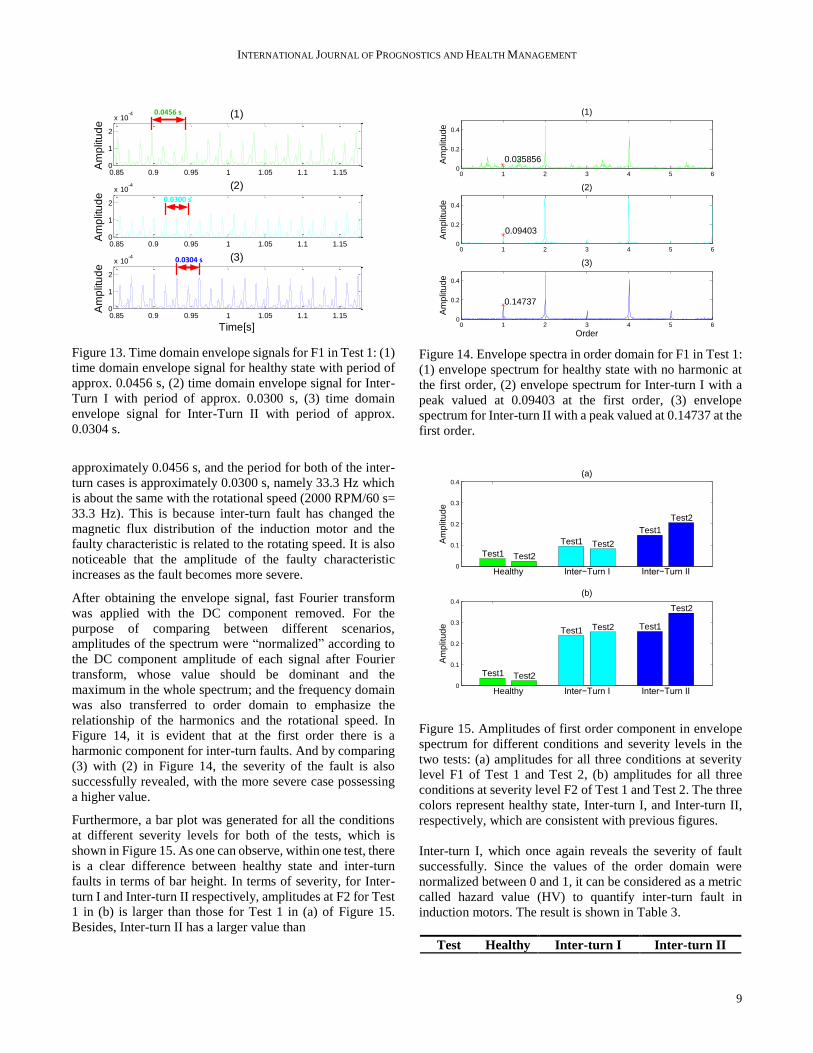
Figure 13. Time domain envelope signals for F1 in Test 1: (1)
time domain envelope signal for healthy state with period of
approx. 0.0456 s, (2) time domain envelope signal for Inter-
Turn I with period of approx. 0.0300 s, (3) time domain
envelope signal for Inter-Turn II with period of approx.
0.0304 s.
approximately 0.0456 s, and the period for both of the inter-
turn cases is approximately 0.0300 s, namely 33.3 Hz which
is about the same with the rotational speed (2000 RPM/60 s=
33.3 Hz). This is because inter-turn fault has changed the
magnetic flux distribution of the induction motor and the
faulty characteristic is related to the rotating speed. It is also
noticeable that the amplitude of the faulty characteristic
increases as the fault becomes more severe.
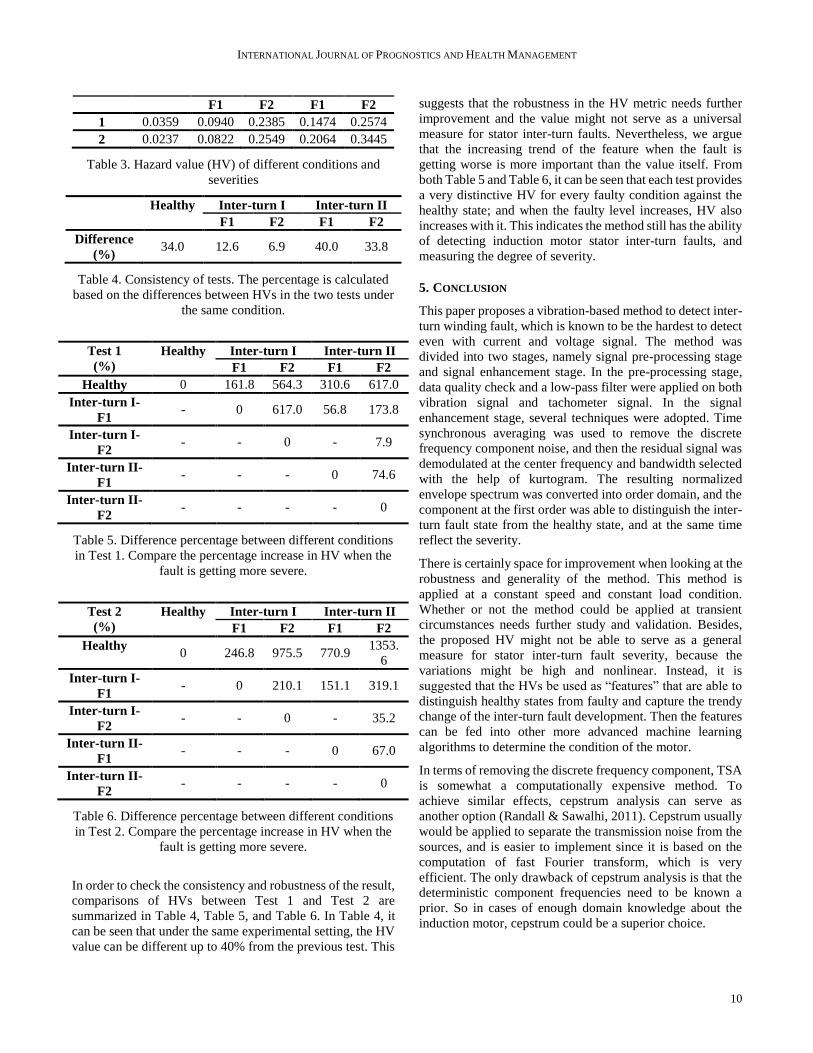
After obtaining the envelope signal, fast Fourier transform
was applied with the DC component removed. For the
purpose of comparing between different scenarios,
amplitudes of the spectrum were “normalized” according to
the DC component amplitude of each signal after Fourier
transform, whose value should be dominant and the
maximum in the whole spectrum; and the frequency domain
was also transferred to order domain to emphasize the
relationship of the harmonics and the rotational speed. In
Figure 14, it is evident that at the first order there is a
harmonic component for inter-turn faults. And by comparing
(3) with (2) in Figure 14, the severity of the fault is also
successfully revealed, with the more severe case possessing
a higher value.
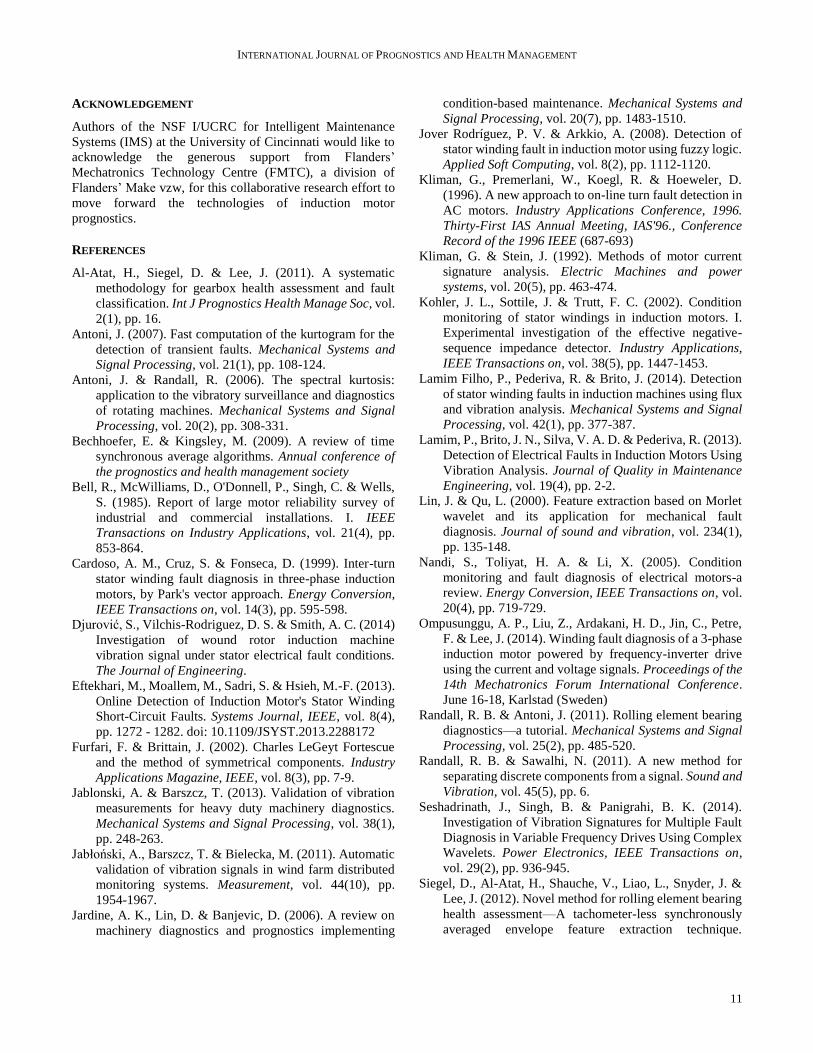
Furthermore, a bar plot was generated for all the conditions
at different severity levels for both of the tests, which is
shown in Figure 15. As one can observe, within one test, there
is a clear difference between healthy state and inter-turn
faults in terms of bar height. In terms of severity, for Inter-
turn I and Inter-turn II respectively, amplitudes at F2 for Test
1 in (b) is larger than those for Test 1 in (a) of Figure 15.
Besides, Inter-turn II has a larger value than
Figure 14. Envelope spectra in order domain for F1 in Test 1:
(1) envelope spectrum for healthy state with no harmonic at
the first order, (2) envelope spectrum for Inter-turn I with a
peak valued at 0.09403 at the first order, (3) envelope
spectrum for Inter-turn II with a peak valued at 0.14737 at the
first order.
Figure 15. Amplitudes of first order component in envelope
spectrum for different conditions and severity levels in the
two tests: (a) amplitudes for all three conditions at severity
level F1 of Test 1 and Test 2, (b) amplitudes for all three
conditions at severity level F2 of Test 1 and Test 2. The three
colors represent healthy state, Inter-turn I, and Inter-turn II,
respectively, which are consistent with previous figures.
Inter-turn I, which once again reveals the severity of fault
successfully. Since the values of the order domain were
normalized between 0 and 1, it can be considered as a metric
called hazard value (HV) to quantify inter-turn fault in
induction motors. The result is shown in Table 3.
Test Healthy Inter-turn I Inter-turn II
0 1 2 3 4 5 60
0.2
0.4
Am
plit
ude
(1)
0.035856
0 1 2 3 4 5 60
0.2
0.4
Am
plit
ud
e
(2)
0.09403
0 1 2 3 4 5 60
0.2
0.4
Order
Am
plit
ud
e
(3)
0.14737
0
0.1
0.2
0.3
0.4
Healthy Inter−Turn I Inter−Turn II
Test1
Test1
Test1
Test2
Test2
Test2
Am
plit
ud
e
(a)
0
0.1
0.2
0.3
0.4
Healthy Inter−Turn I Inter−Turn II
Test1
Test1 Test1
Test2
Test2
Test2
Am
plit
ud
e
(b)
INTERNATIONAL JOURNAL OF PROGNOSTICS AND HEALTH MANAGEMENT
10
F1 F2 F1 F2
1 0.0359 0.0940 0.2385 0.1474 0.2574
2 0.0237 0.0822 0.2549 0.2064 0.3445
Table 3. Hazard value (HV) of different conditions and
severities
Healthy Inter-turn I Inter-turn II
F1 F2 F1 F2
Difference
(%) 34.0 12.6 6.9 40.0 33.8
Table 4. Consistency of tests. The percentage is calculated
based on the differences between HVs in the two tests under
the same condition.
Test 1
(%)
Healthy Inter-turn I Inter-turn II
F1 F2 F1 F2
Healthy 0 161.8 564.3 310.6 617.0
Inter-turn I-
F1 - 0 617.0 56.8 173.8
Inter-turn I-
F2 - - 0 - 7.9
Inter-turn II-
F1 - - - 0 74.6
Inter-turn II-
F2 - - - - 0
Table 5. Difference percentage between different conditions
in Test 1. Compare the percentage increase in HV when the
fault is getting more severe.
Test 2
(%)
Healthy Inter-turn I Inter-turn II
F1 F2 F1 F2
Healthy 0 246.8 975.5 770.9
1353.
6
Inter-turn I-
F1 - 0 210.1 151.1 319.1
Inter-turn I-
F2 - - 0 - 35.2
Inter-turn II-
F1 - - - 0 67.0
Inter-turn II-
F2 - - - - 0
Table 6. Difference percentage between different conditions
in Test 2. Compare the percentage increase in HV when the
fault is getting more severe.
In order to check the consistency and robustness of the result,
comparisons of HVs between Test 1 and Test 2 are
summarized in Table 4, Table 5, and Table 6. In Table 4, it
can be seen that under the same experimental setting, the HV
value can be different up to 40% from the previous test. This
suggests that the robustness in the HV metric needs further
improvement and the value might not serve as a universal
measure for stator inter-turn faults. Nevertheless, we argue
that the increasing trend of the feature when the fault is
getting worse is more important than the value itself. From
both Table 5 and Table 6, it can be seen that each test provides
a very distinctive HV for every faulty condition against the
healthy state; and when the faulty level increases, HV also
increases with it. This indicates the method still has the ability
of detecting induction motor stator inter-turn faults, and
measuring the degree of severity.
5. CONCLUSION
This paper proposes a vibration-based method to detect inter-
turn winding fault, which is known to be the hardest to detect
even with current and voltage signal. The method was
divided into two stages, namely signal pre-processing stage
and signal enhancement stage. In the pre-processing stage,
data quality check and a low-pass filter were applied on both
vibration signal and tachometer signal. In the signal
enhancement stage, several techniques were adopted. Time
synchronous averaging was used to remove the discrete
frequency component noise, and then the residual signal was
demodulated at the center frequency and bandwidth selected
with the help of kurtogram. The resulting normalized
envelope spectrum was converted into order domain, and the
component at the first order was able to distinguish the inter-
turn fault state from the healthy state, and at the same time
reflect the severity.
There is certainly space for improvement when looking at the
robustness and generality of the method. This method is
applied at a constant speed and constant load condition.
Whether or not the method could be applied at transient
circumstances needs further study and validation. Besides,
the proposed HV might not be able to serve as a general
measure for stator inter-turn fault severity, because the
variations might be high and nonlinear. Instead, it is
suggested that the HVs be used as “features” that are able to
distinguish healthy states from faulty and capture the trendy
change of the inter-turn fault development. Then the features
can be fed into other more advanced machine learning
algorithms to determine the condition of the motor.
In terms of removing the discrete frequency component, TSA
is somewhat a computationally expensive method. To
achieve similar effects, cepstrum analysis can serve as
another option (Randall & Sawalhi, 2011). Cepstrum usually
would be applied to separate the transmission noise from the
sources, and is easier to implement since it is based on the
computation of fast Fourier transform, which is very
efficient. The only drawback of cepstrum analysis is that the
deterministic component frequencies need to be known a
prior. So in cases of enough domain knowledge about the
induction motor, cepstrum could be a superior choice.
INTERNATIONAL JOURNAL OF PROGNOSTICS AND HEALTH MANAGEMENT
11
ACKNOWLEDGEMENT
Authors of the NSF I/UCRC for Intelligent Maintenance
Systems (IMS) at the University of Cincinnati would like to
acknowledge the generous support from Flanders’
Mechatronics Technology Centre (FMTC), a division of
Flanders’ Make vzw, for this collaborative research effort to
move forward the technologies of induction motor
prognostics.
REFERENCES
Al-Atat, H., Siegel, D. & Lee, J. (2011). A systematic
methodology for gearbox health assessment and fault
classification. Int J Prognostics Health Manage Soc, vol.
2(1), pp. 16.
Antoni, J. (2007). Fast computation of the kurtogram for the
detection of transient faults. Mechanical Systems and
Signal Processing, vol. 21(1), pp. 108-124.
Antoni, J. & Randall, R. (2006). The spectral kurtosis:
application to the vibratory surveillance and diagnostics
of rotating machines. Mechanical Systems and Signal
Processing, vol. 20(2), pp. 308-331.
Bechhoefer, E. & Kingsley, M. (2009). A review of time
synchronous average algorithms. Annual conference of
the prognostics and health management society
Bell, R., McWilliams, D., O'Donnell, P., Singh, C. & Wells,
S. (1985). Report of large motor reliability survey of
industrial and commercial installations. I. IEEE
Transactions on Industry Applications, vol. 21(4), pp.
853-864.
Cardoso, A. M., Cruz, S. & Fonseca, D. (1999). Inter-turn
stator winding fault diagnosis in three-phase induction
motors, by Park's vector approach. Energy Conversion,
IEEE Transactions on, vol. 14(3), pp. 595-598.
Djurović, S., Vilchis-Rodriguez, D. S. & Smith, A. C. (2014)
Investigation of wound rotor induction machine
vibration signal under stator electrical fault conditions.
The Journal of Engineering.
Eftekhari, M., Moallem, M., Sadri, S. & Hsieh, M.-F. (2013).
Online Detection of Induction Motor's Stator Winding
Short-Circuit Faults. Systems Journal, IEEE, vol. 8(4),
pp. 1272 - 1282. doi: 10.1109/JSYST.2013.2288172
Furfari, F. & Brittain, J. (2002). Charles LeGeyt Fortescue
and the method of symmetrical components. Industry
Applications Magazine, IEEE, vol. 8(3), pp. 7-9.
Jablonski, A. & Barszcz, T. (2013). Validation of vibration
measurements for heavy duty machinery diagnostics.
Mechanical Systems and Signal Processing, vol. 38(1),
pp. 248-263.
Jabłoński, A., Barszcz, T. & Bielecka, M. (2011). Automatic
validation of vibration signals in wind farm distributed
monitoring systems. Measurement, vol. 44(10), pp.
1954-1967.
Jardine, A. K., Lin, D. & Banjevic, D. (2006). A review on
machinery diagnostics and prognostics implementing
condition-based maintenance. Mechanical Systems and
Signal Processing, vol. 20(7), pp. 1483-1510.
Jover Rodríguez, P. V. & Arkkio, A. (2008). Detection of
stator winding fault in induction motor using fuzzy logic.
Applied Soft Computing, vol. 8(2), pp. 1112-1120.
Kliman, G., Premerlani, W., Koegl, R. & Hoeweler, D.
(1996). A new approach to on-line turn fault detection in
AC motors. Industry Applications Conference, 1996.
Thirty-First IAS Annual Meeting, IAS'96., Conference
Record of the 1996 IEEE (687-693)
Kliman, G. & Stein, J. (1992). Methods of motor current
signature analysis. Electric Machines and power
systems, vol. 20(5), pp. 463-474.
Kohler, J. L., Sottile, J. & Trutt, F. C. (2002). Condition
monitoring of stator windings in induction motors. I.
Experimental investigation of the effective negative-
sequence impedance detector. Industry Applications,
IEEE Transactions on, vol. 38(5), pp. 1447-1453.
Lamim Filho, P., Pederiva, R. & Brito, J. (2014). Detection
of stator winding faults in induction machines using flux
and vibration analysis. Mechanical Systems and Signal
Processing, vol. 42(1), pp. 377-387.
Lamim, P., Brito, J. N., Silva, V. A. D. & Pederiva, R. (2013).
Detection of Electrical Faults in Induction Motors Using
Vibration Analysis. Journal of Quality in Maintenance
Engineering, vol. 19(4), pp. 2-2.
Lin, J. & Qu, L. (2000). Feature extraction based on Morlet
wavelet and its application for mechanical fault
diagnosis. Journal of sound and vibration, vol. 234(1),
pp. 135-148.
Nandi, S., Toliyat, H. A. & Li, X. (2005). Condition
monitoring and fault diagnosis of electrical motors-a
review. Energy Conversion, IEEE Transactions on, vol.
20(4), pp. 719-729.
Ompusunggu, A. P., Liu, Z., Ardakani, H. D., Jin, C., Petre,
F. & Lee, J. (2014). Winding fault diagnosis of a 3-phase
induction motor powered by frequency-inverter drive
using the current and voltage signals. Proceedings of the
14th Mechatronics Forum International Conference.
June 16-18, Karlstad (Sweden)
Randall, R. B. & Antoni, J. (2011). Rolling element bearing
diagnostics—a tutorial. Mechanical Systems and Signal
Processing, vol. 25(2), pp. 485-520.
Randall, R. B. & Sawalhi, N. (2011). A new method for
separating discrete components from a signal. Sound and
Vibration, vol. 45(5), pp. 6.
Seshadrinath, J., Singh, B. & Panigrahi, B. K. (2014).
Investigation of Vibration Signatures for Multiple Fault
Diagnosis in Variable Frequency Drives Using Complex
Wavelets. Power Electronics, IEEE Transactions on,
vol. 29(2), pp. 936-945.
Siegel, D., Al-Atat, H., Shauche, V., Liao, L., Snyder, J. &
Lee, J. (2012). Novel method for rolling element bearing
health assessment—A tachometer-less synchronously
averaged envelope feature extraction technique.
INTERNATIONAL JOURNAL OF PROGNOSTICS AND HEALTH MANAGEMENT
12
Mechanical Systems and Signal Processing, vol. 29, pp.
362-376.
Siegel, D., Ly, C. & Lee, J. (2012). Methodology and
framework for predicting helicopter rolling element
bearing failure. Reliability, IEEE Transactions on, vol.
61(4), pp. 846-857.
Sin, M. L., Soong, W. L. & Ertugrul, N. (2003). Induction
machine on-line condition monitoring and fault
diagnosis - a survey. Australasian Universities Power
Engineering Conference (1-6), Christchurch, New
Zealand
Sottile, J., Trutt, F. C. & Kohler, J. L. (2000). Experimental
investigation of on-line methods for incipient fault
detection [in induction motors]. Industry Applications
Conference (2682-2687)
Trutt, F. C., Sottile, J. & Kohler, J. L. (2002). Online
condition monitoring of induction motors. Industry
Applications, IEEE Transactions on, vol. 38(6), pp.
1627-1632.
Ukil, A., Chen, S. & Andenna, A. (2011). Detection of stator
short circuit faults in three-phase induction motors using
motor current zero crossing instants. Electric Power
Systems Research, vol. 81(4), pp. 1036-1044.