Embed Size (px)
Citation preview
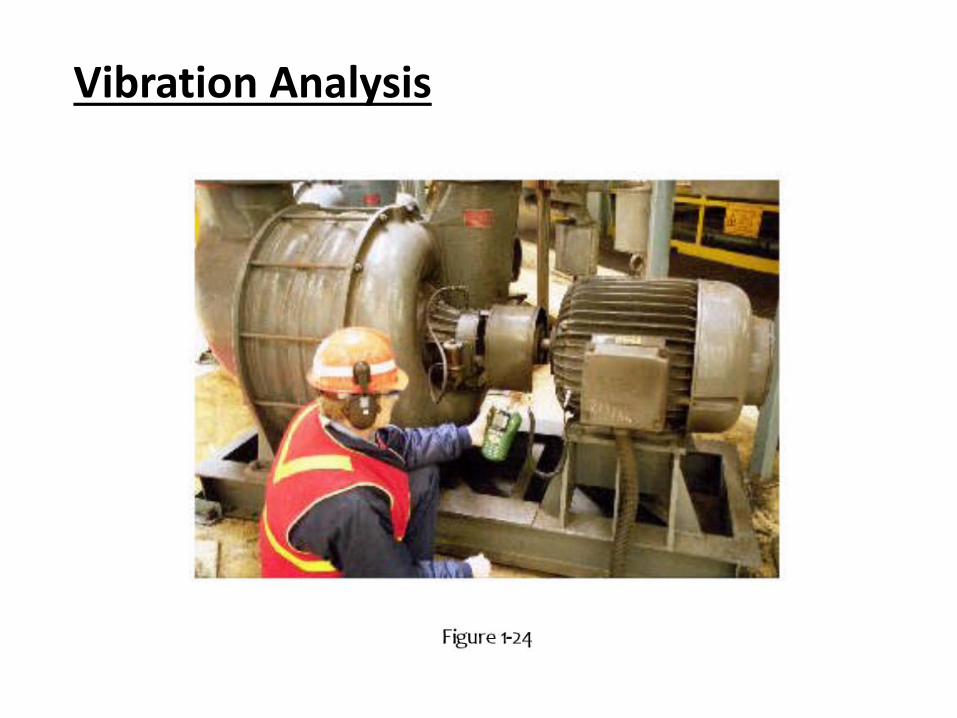
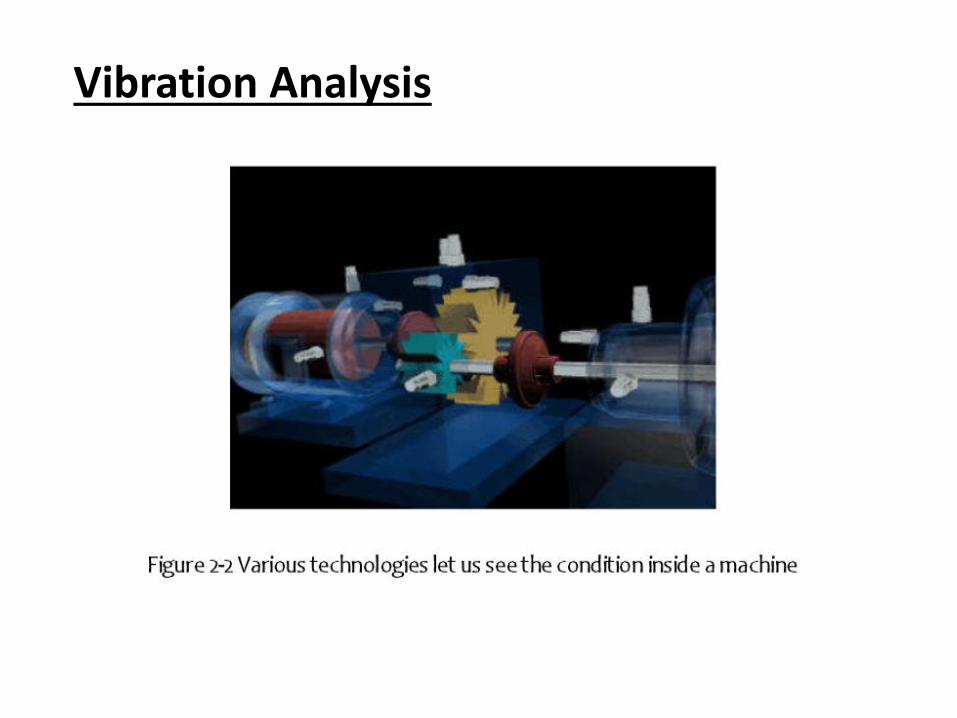
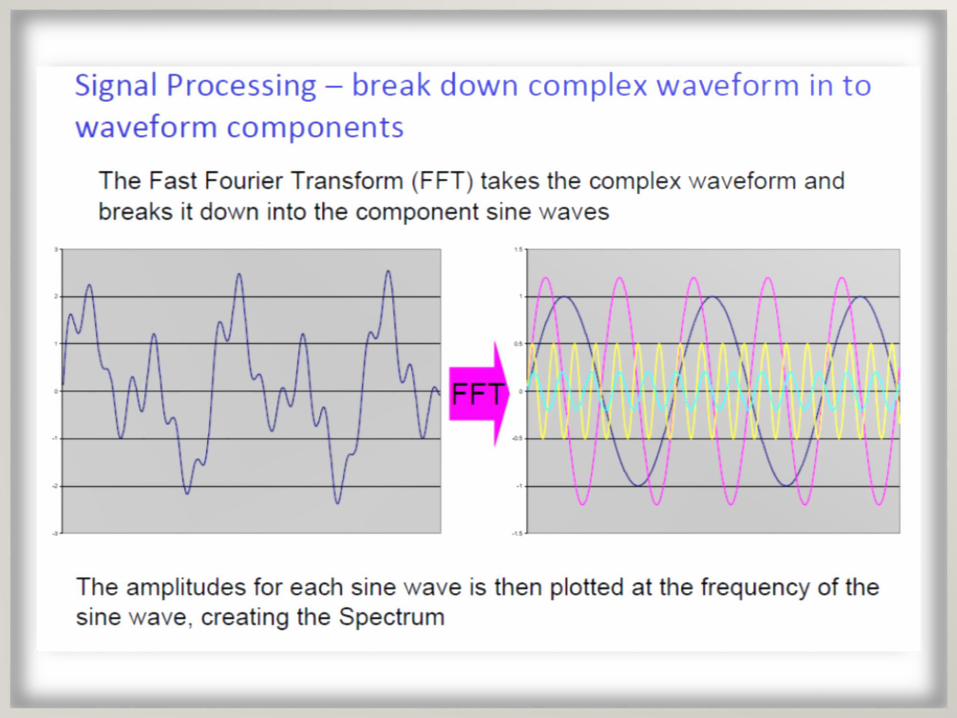
Vibration Analysis
Dr./ Ahmed NagibDecember 3, 2017
Vibration Certifications
There are two institutes that gave certification in vibration: Vibration Institute and Mobius institute. Each of them classify the vibration analyst to four categories. Category IV is the most expert person and should have 5 years of vibration as a vibration analyst.
Vibration Institute Mobius Institute
Vibration Certifications
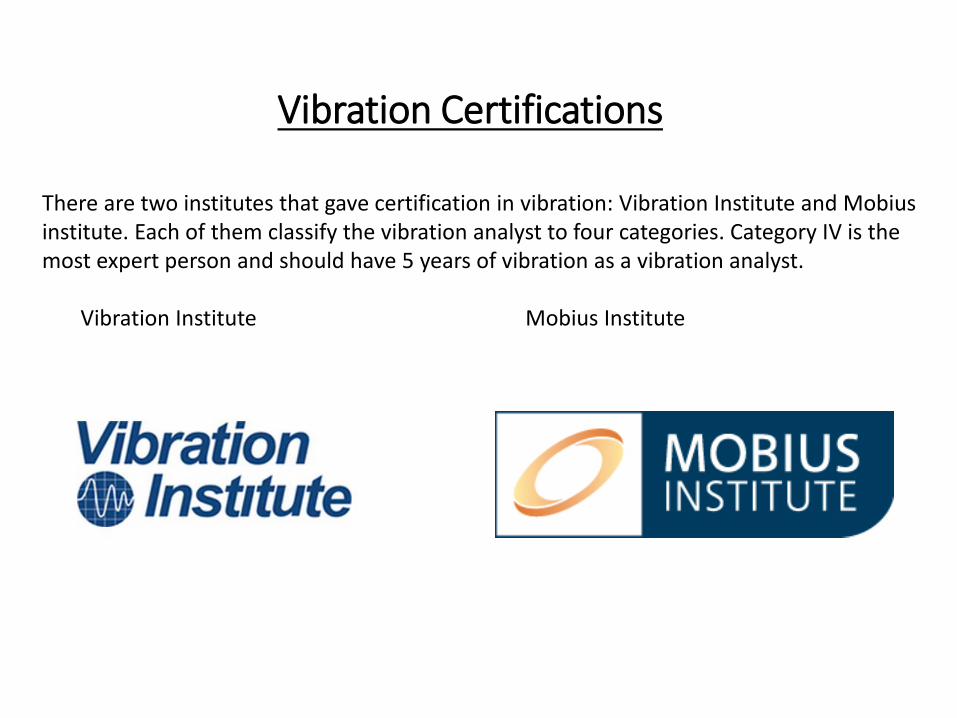
1. Vibration Institute
Vibration Analyst
Category
Recommended
Experience for
Exam Eligibility
Courses Recommended as Partial Preparation for Certification Exams* **
IMV BMV BRM MVA AVC RDM AVA
Category I ≥ 6 months 1
Category II ≥ 18 months 2
Category III ≥ 3 years 3 4
Category IV ≥ 5 years 5 6 7
Training Course Cost $1150 $1350 $1450 $1550 $1750 $1750 $1750
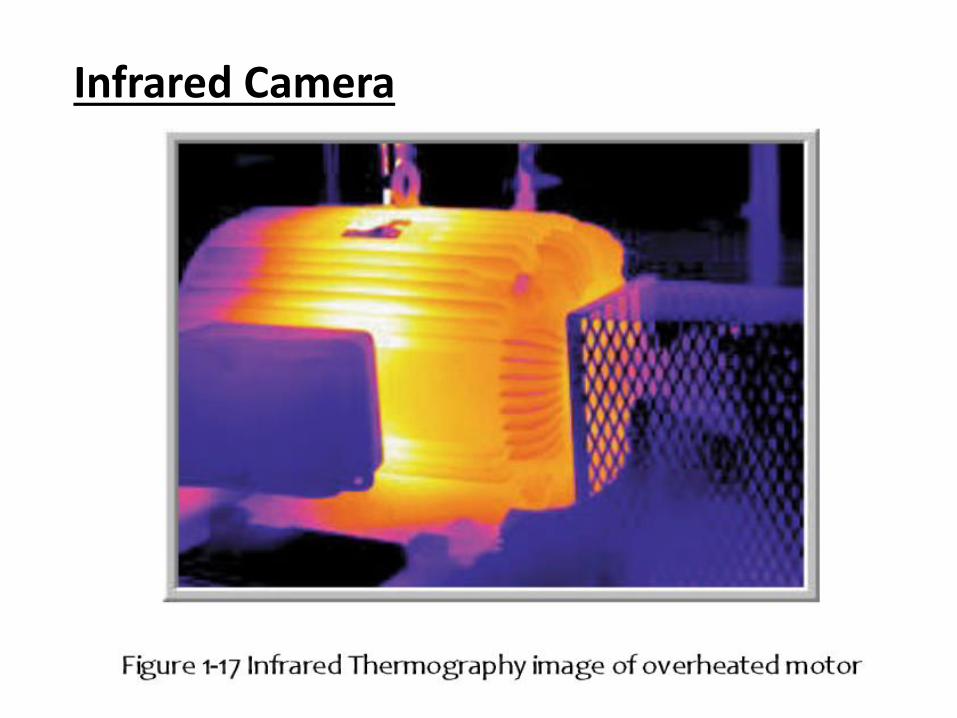
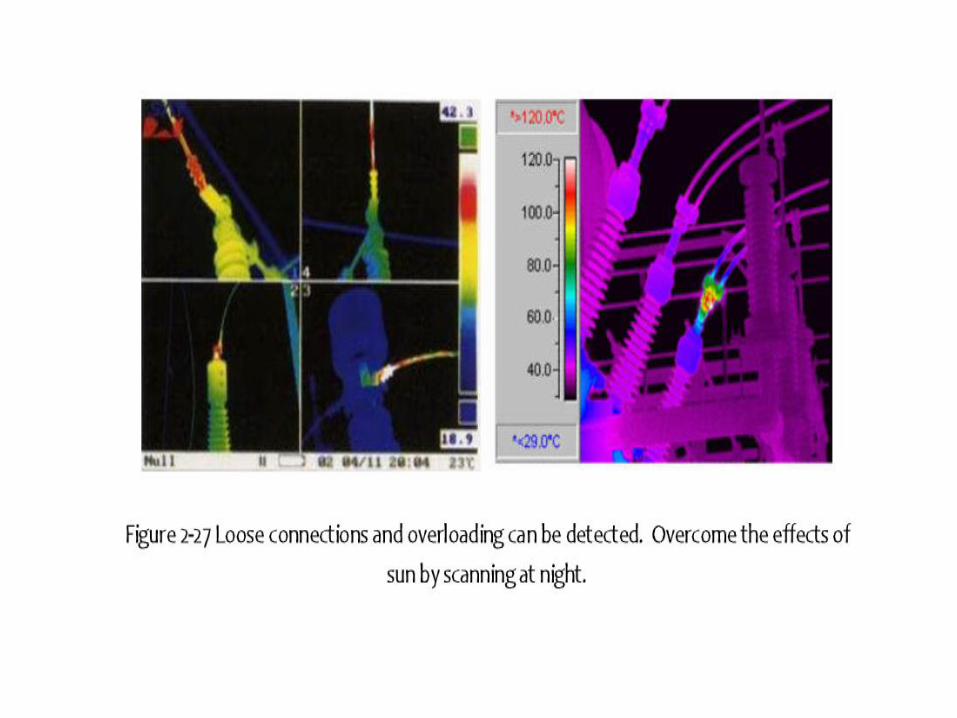
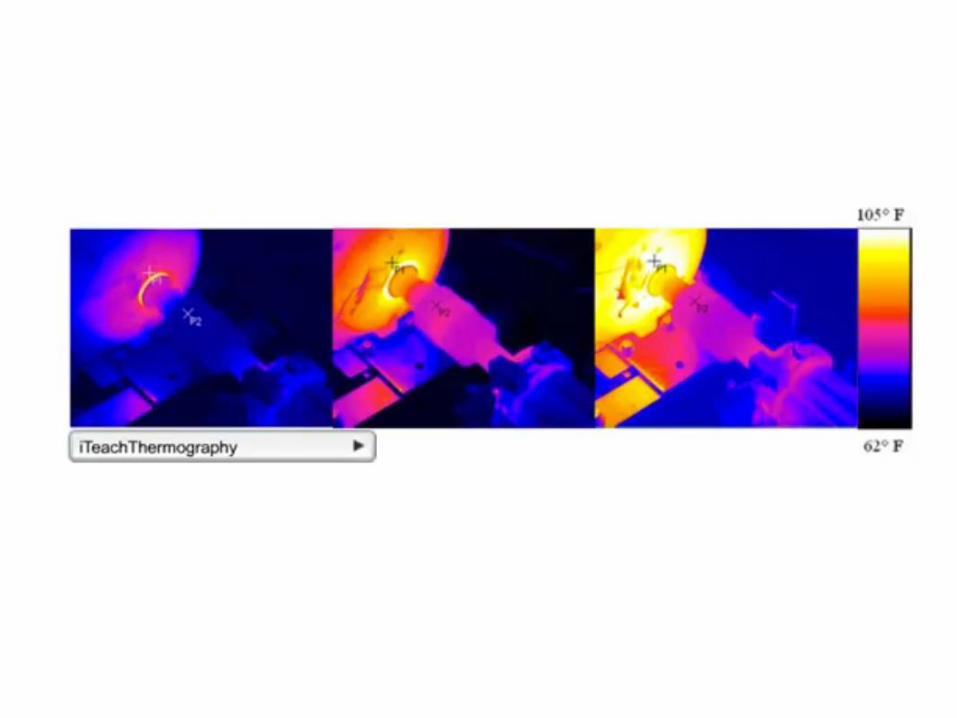
Infrared Camera
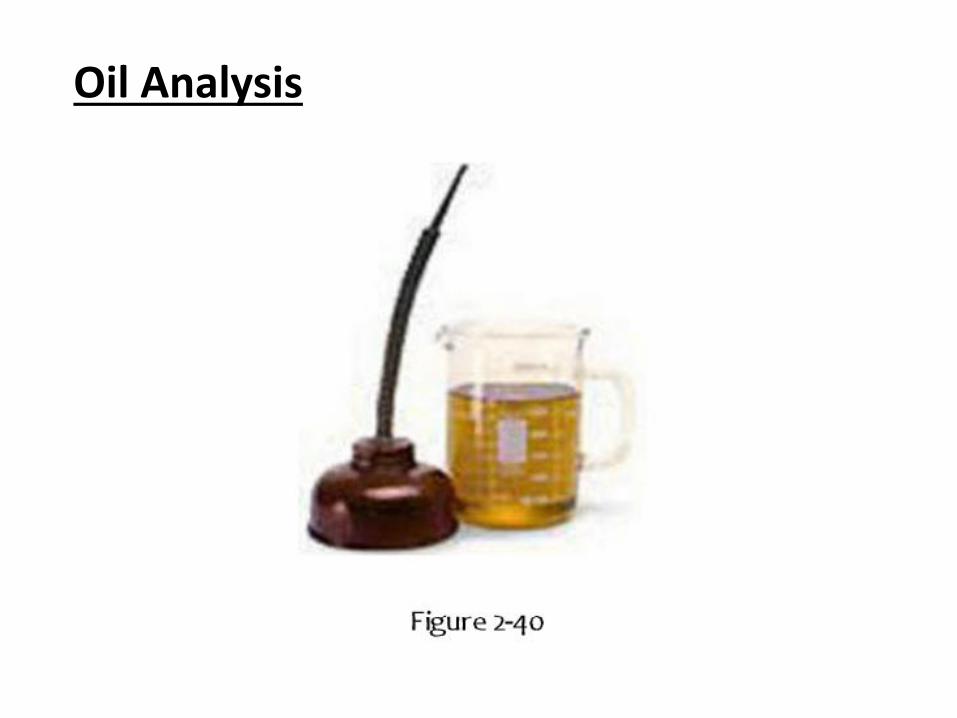
Oil Analysis
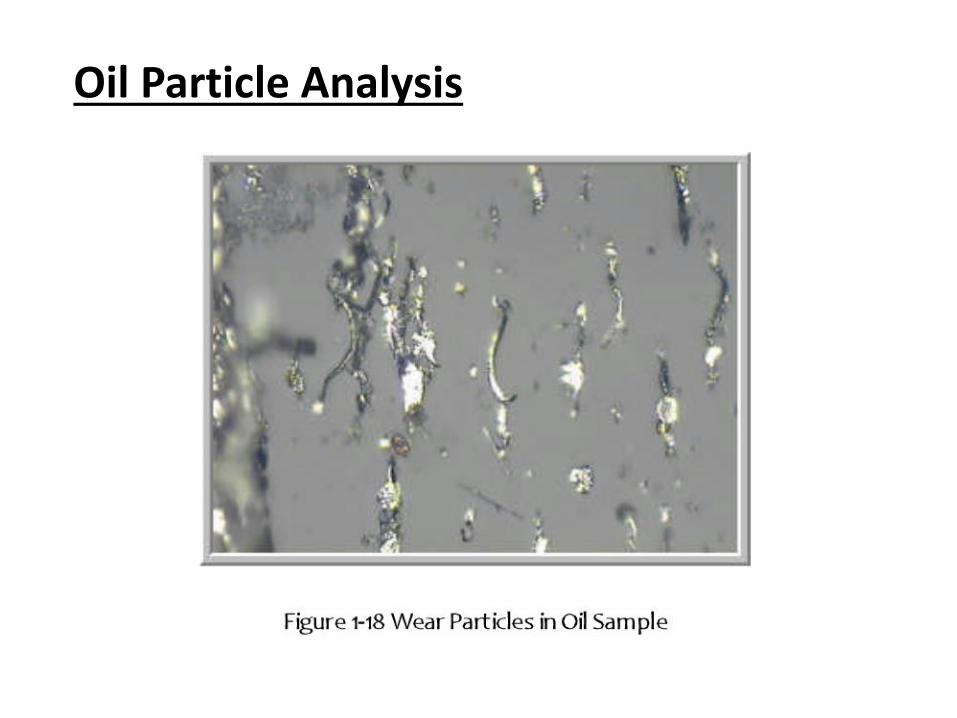
Oil Particle Analysis
Vibration Analysis
Vibration Analysis
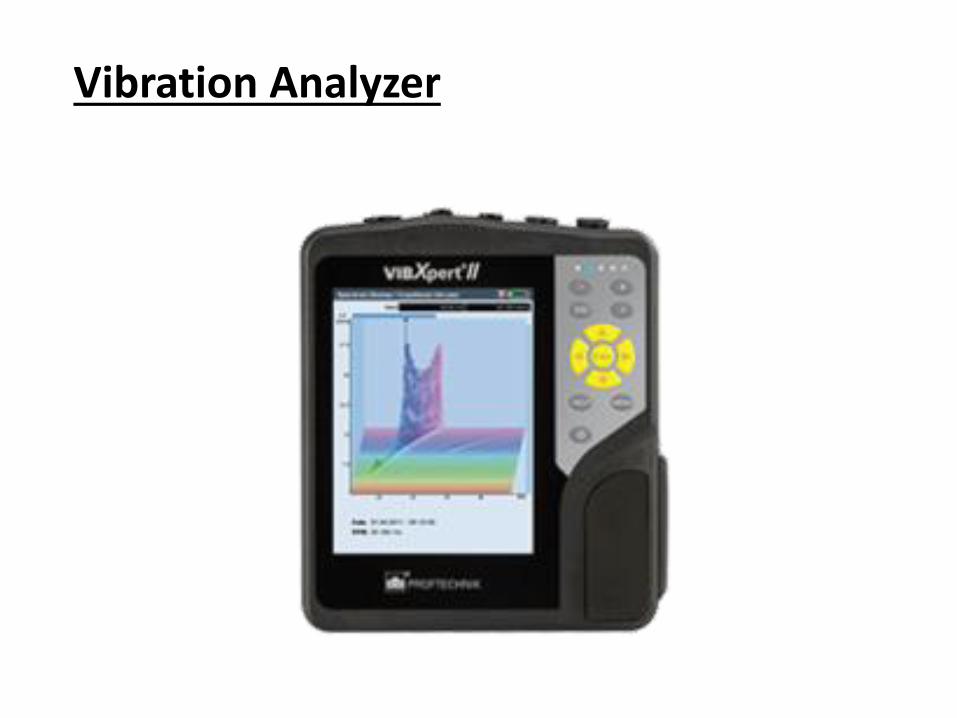
Vibration Analyzer
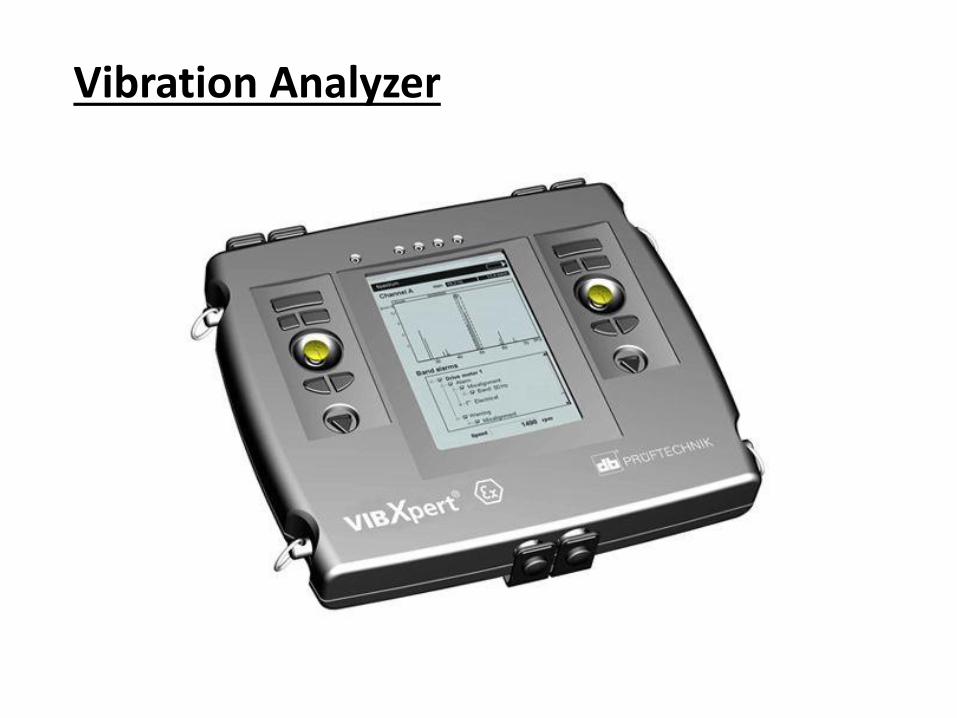
Vibration Analyzer
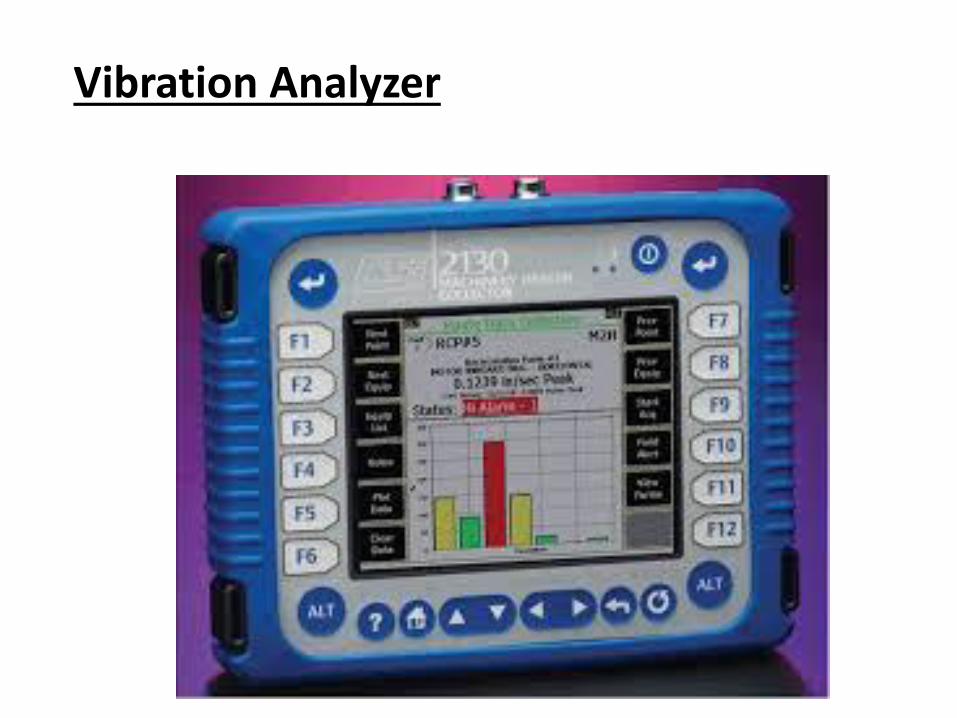
Vibration Analyzer
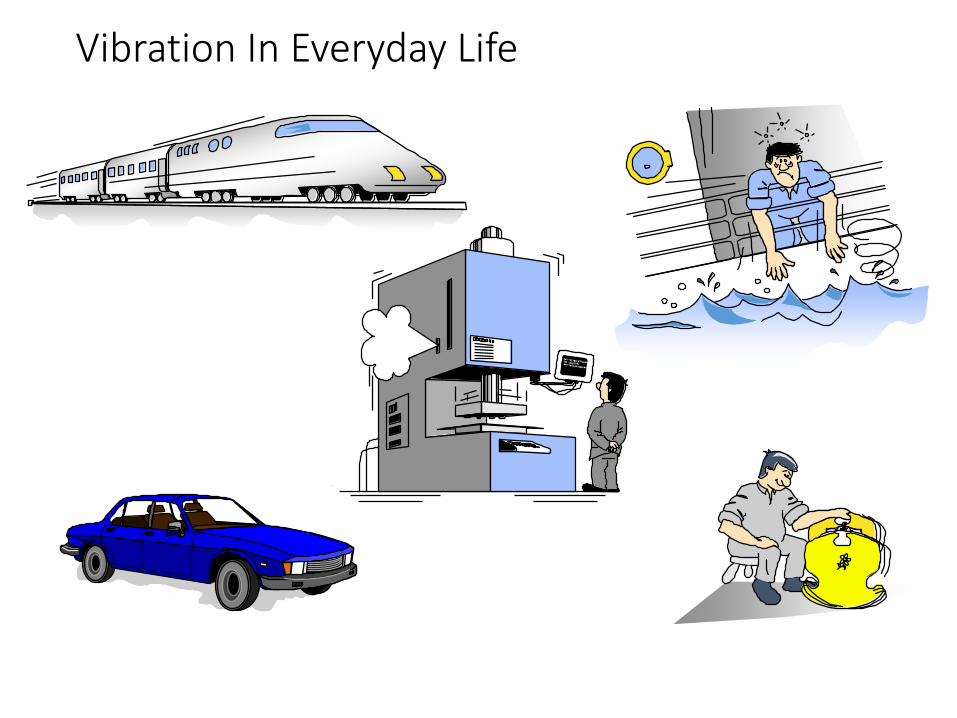
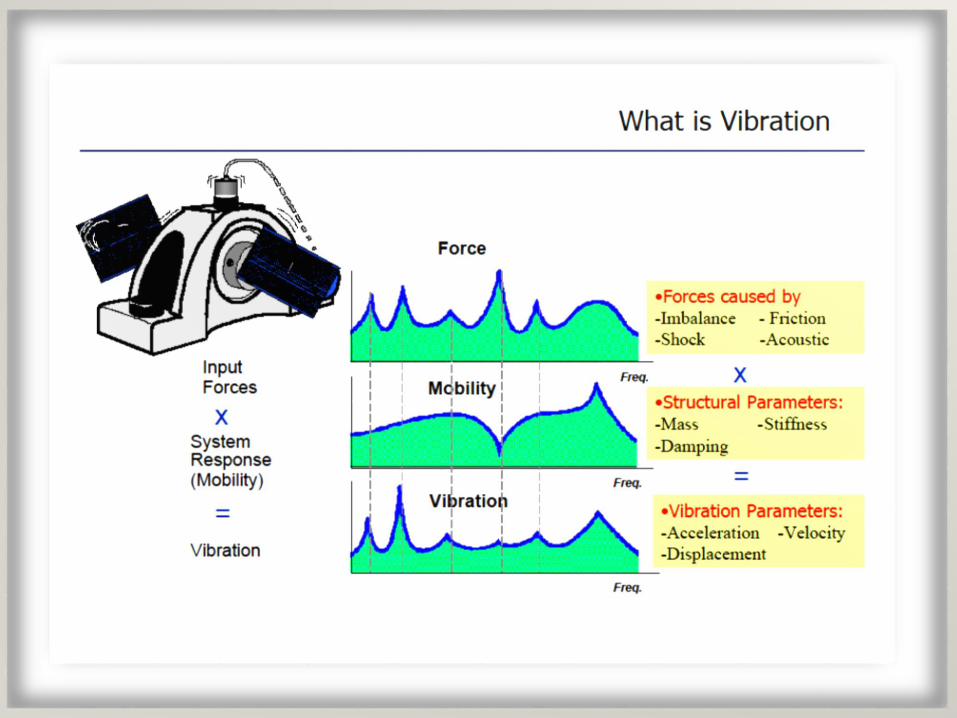
Vibration In Everyday Life
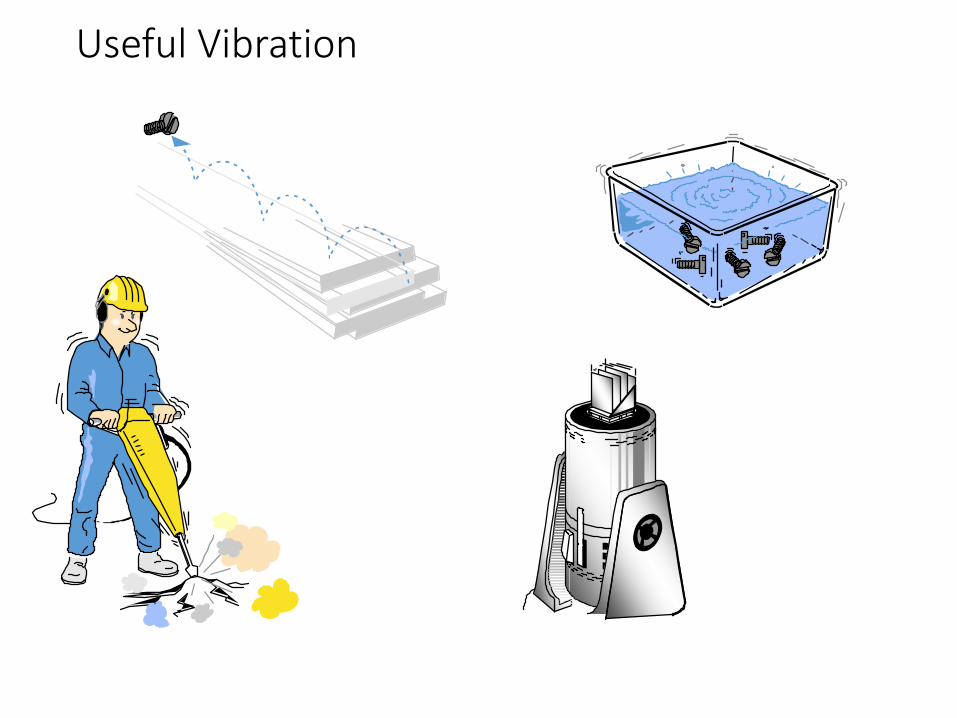
Useful Vibration
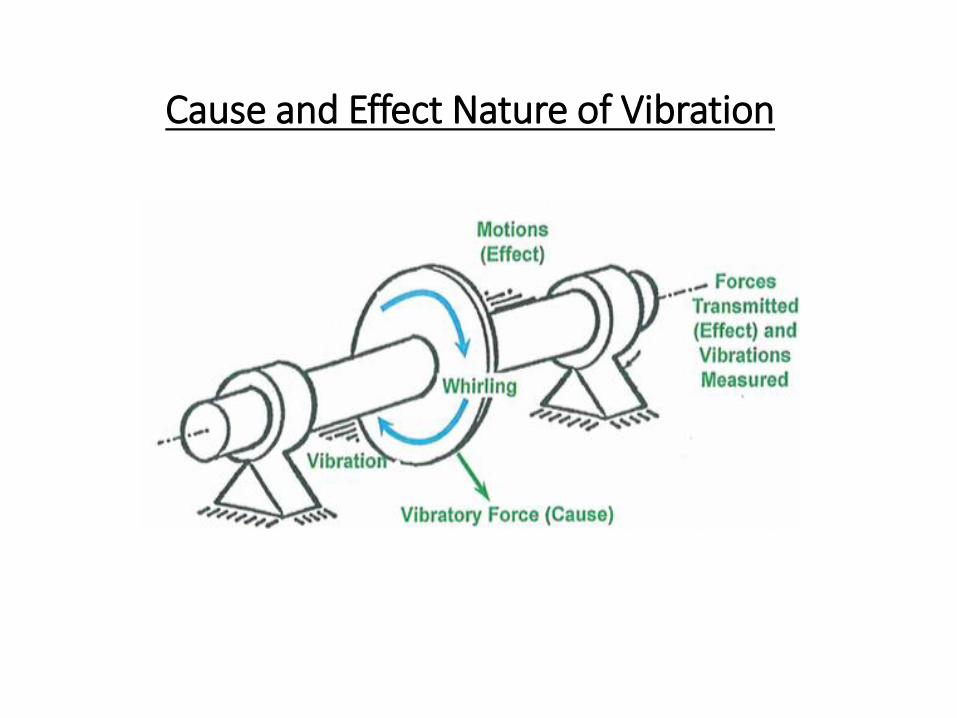
Cause and Effect Nature of Vibration
Acceptable limit of vibration
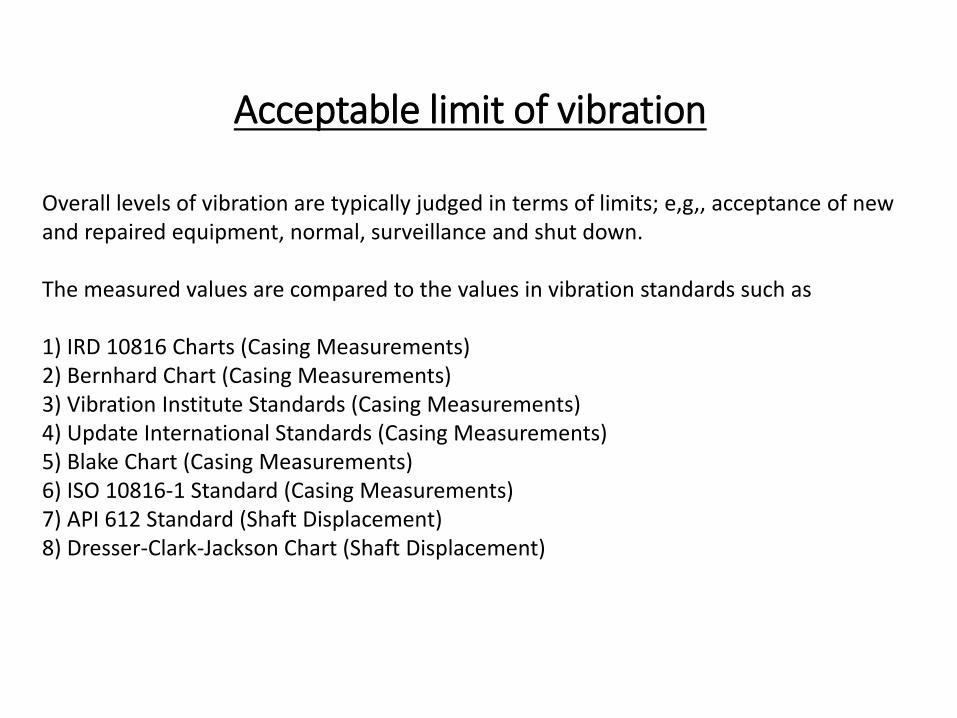
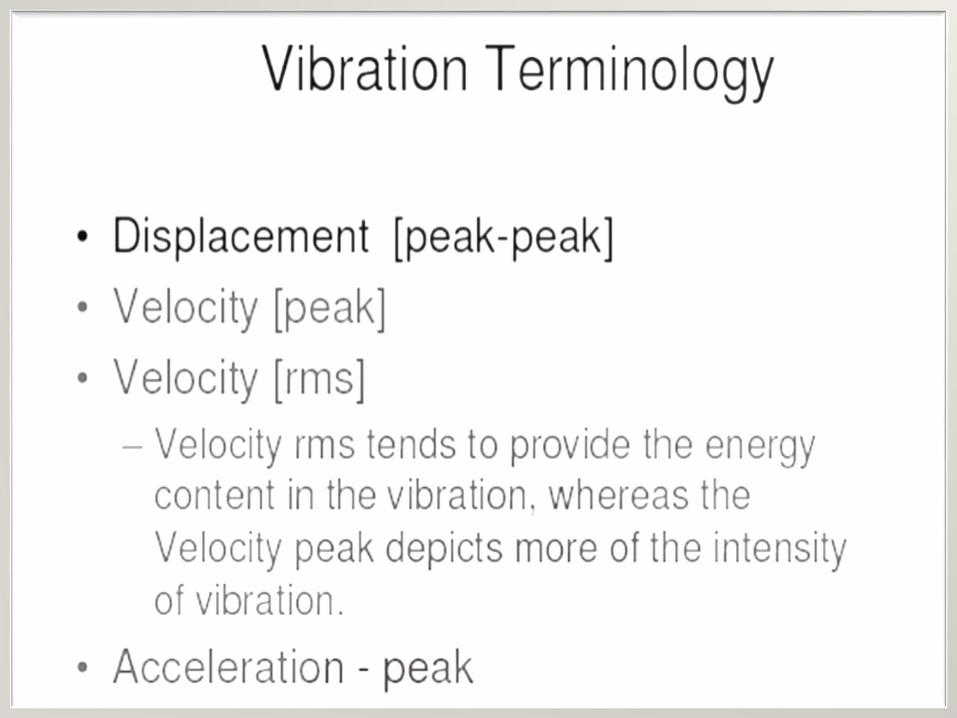
Overall levels of vibration are typically judged in terms of limits; e,g,, acceptance of new and repaired equipment, normal, surveillance and shut down.
The measured values are compared to the values in vibration standards such as
1) IRD 10816 Charts (Casing Measurements)2) Bernhard Chart (Casing Measurements)3) Vibration Institute Standards (Casing Measurements)4) Update International Standards (Casing Measurements)5) Blake Chart (Casing Measurements)6) ISO 10816-1 Standard (Casing Measurements)7) API 612 Standard (Shaft Displacement)8) Dresser-Clark-Jackson Chart (Shaft Displacement)
Acceptable limit of vibration
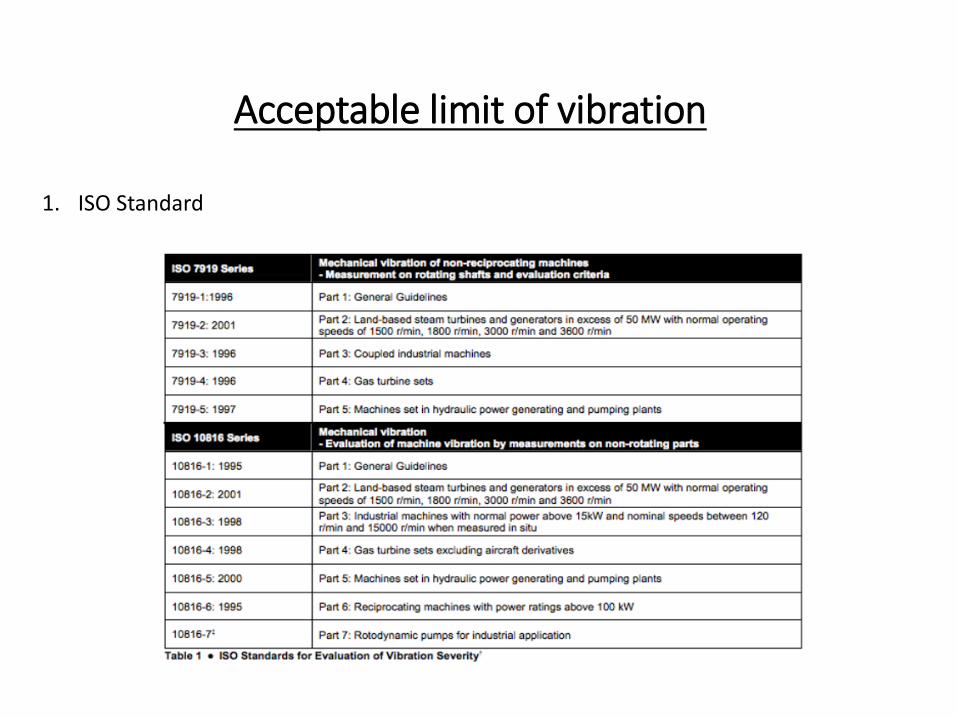
1. ISO Standard
Acceptable limit of vibration
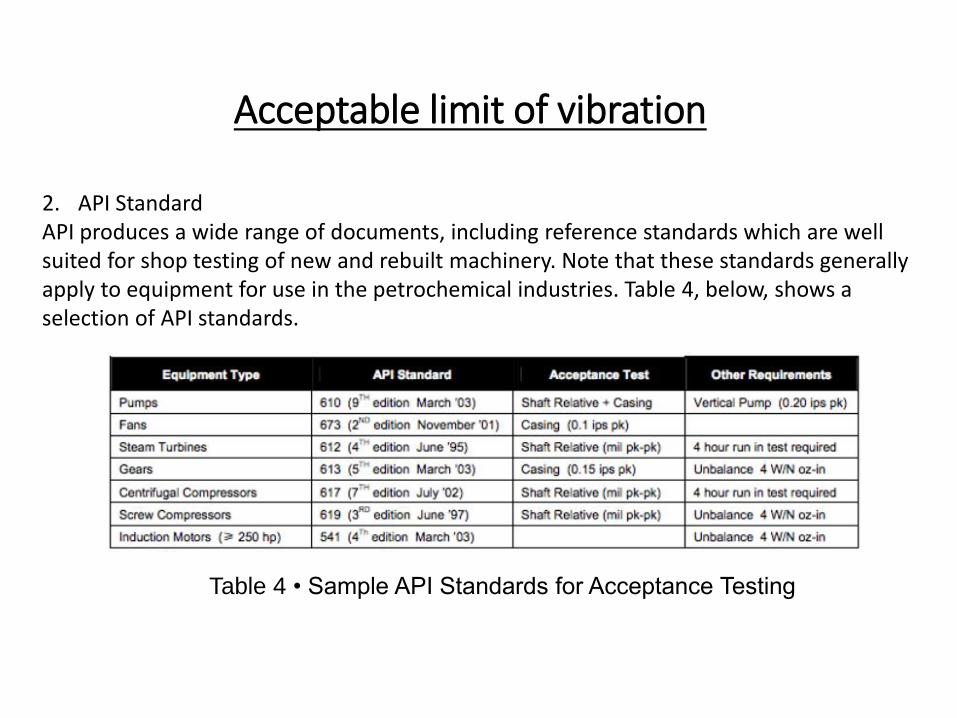
2. API StandardAPI produces a wide range of documents, including reference standards which are well suited for shop testing of new and rebuilt machinery. Note that these standards generally apply to equipment for use in the petrochemical industries. Table 4, below, shows a selection of API standards.
Table 4 • Sample API Standards for Acceptance Testing
Acceptable limit of vibration
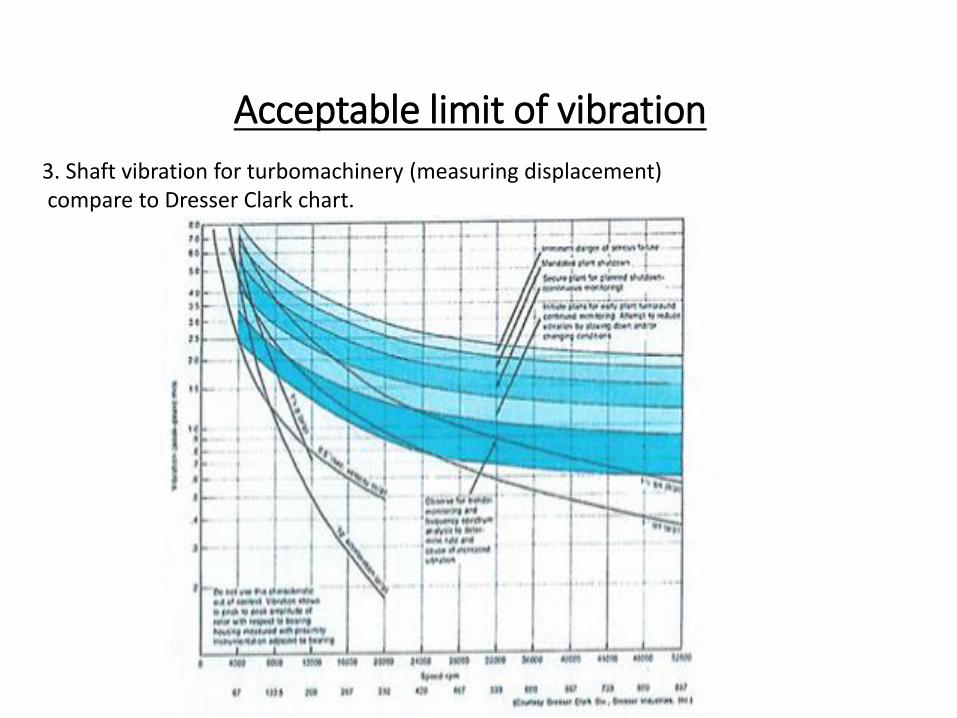
3. Shaft vibration for turbomachinery (measuring displacement)compare to Dresser Clark chart.
Acceptable limit of vibration
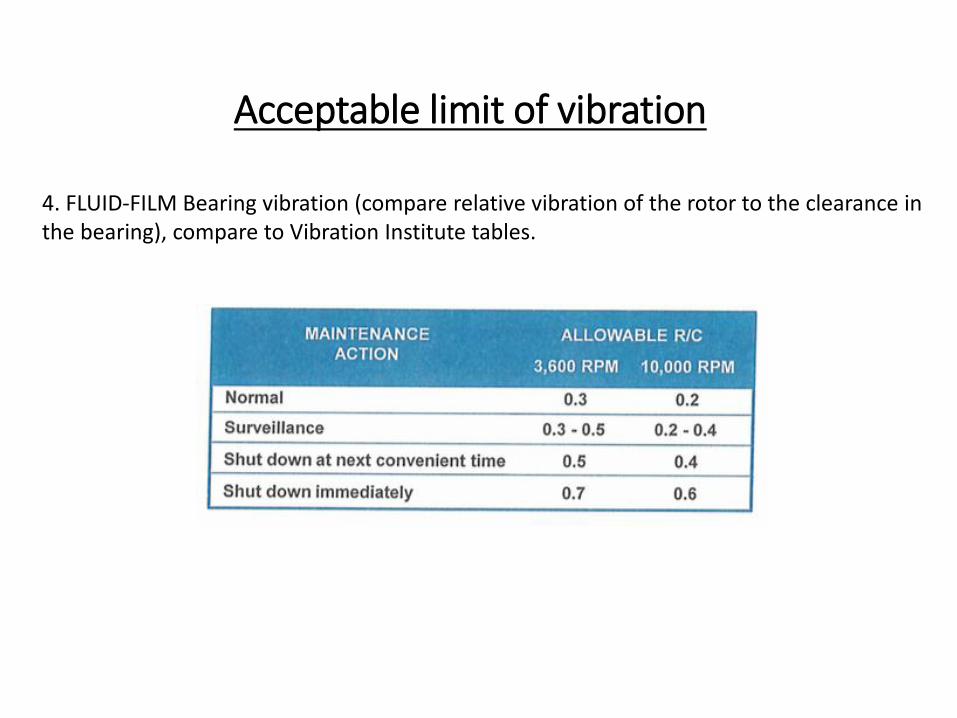
4. FLUID-FILM Bearing vibration (compare relative vibration of the rotor to the clearance in the bearing), compare to Vibration Institute tables.
Acceptable limit of vibration
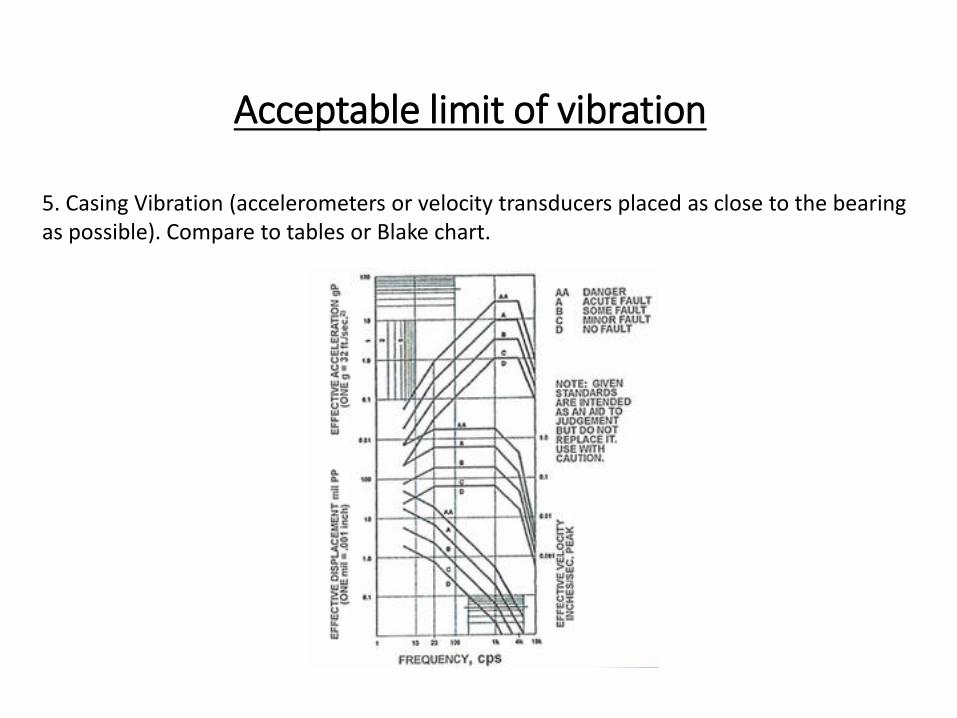
5. Casing Vibration (accelerometers or velocity transducers placed as close to the bearing as possible). Compare to tables or Blake chart.
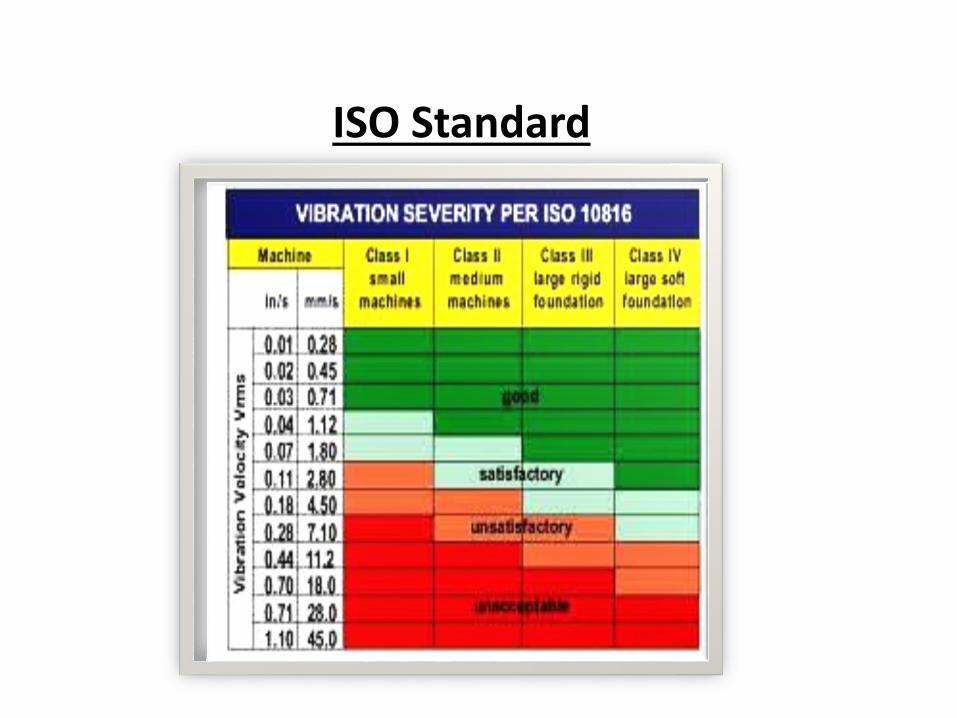
ISO Standard
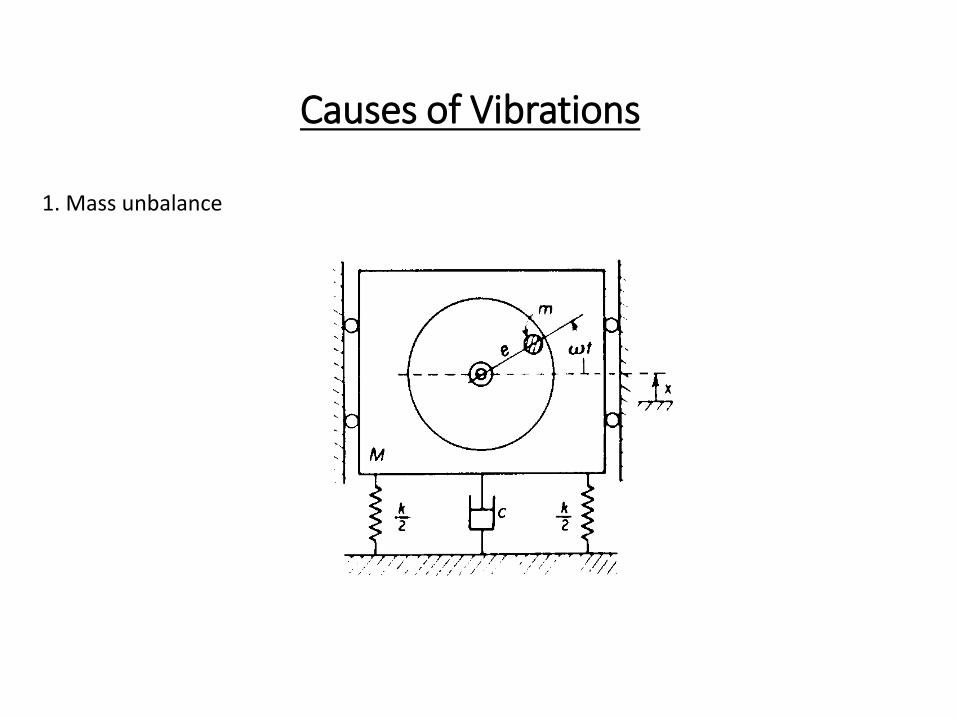
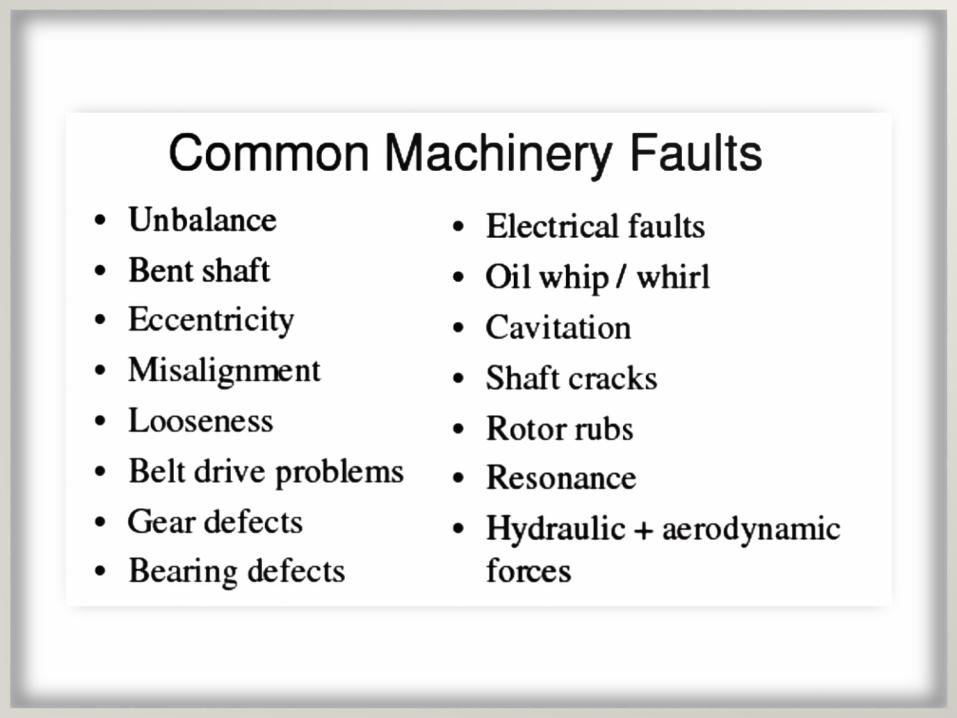
Causes of Vibrations
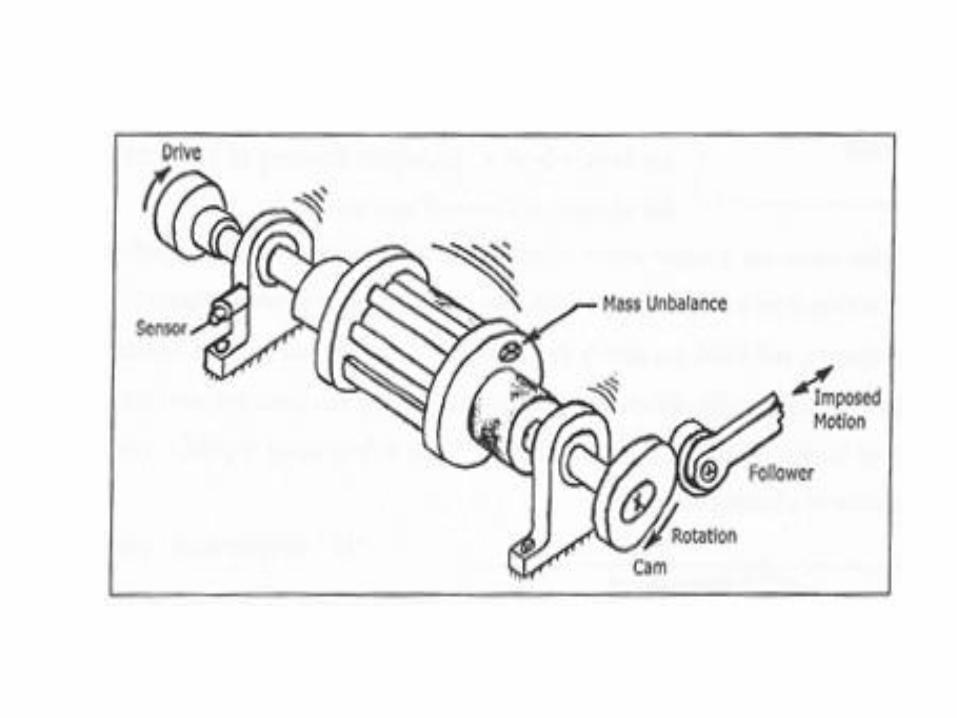
1. Mass unbalance
Causes of Vibrations
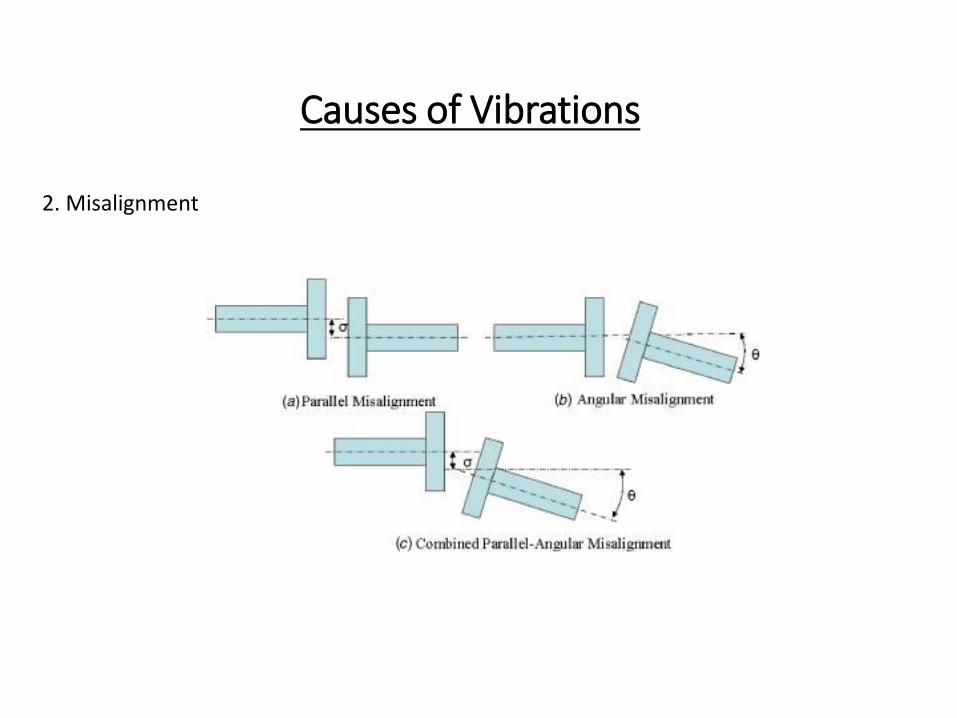
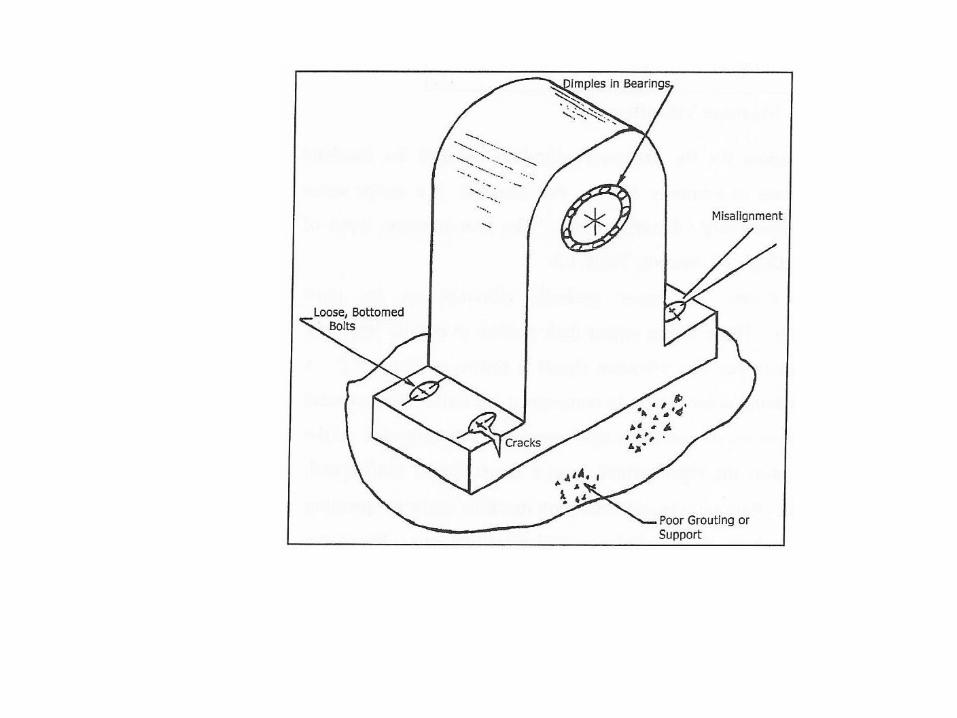
2. Misalignment
Causes of Vibrations
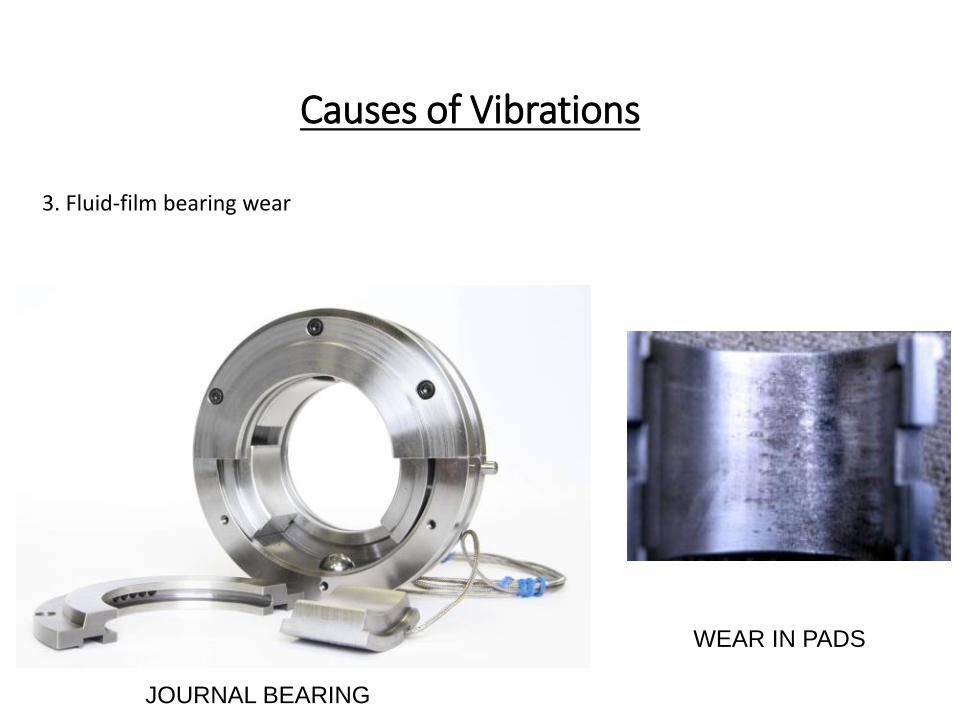
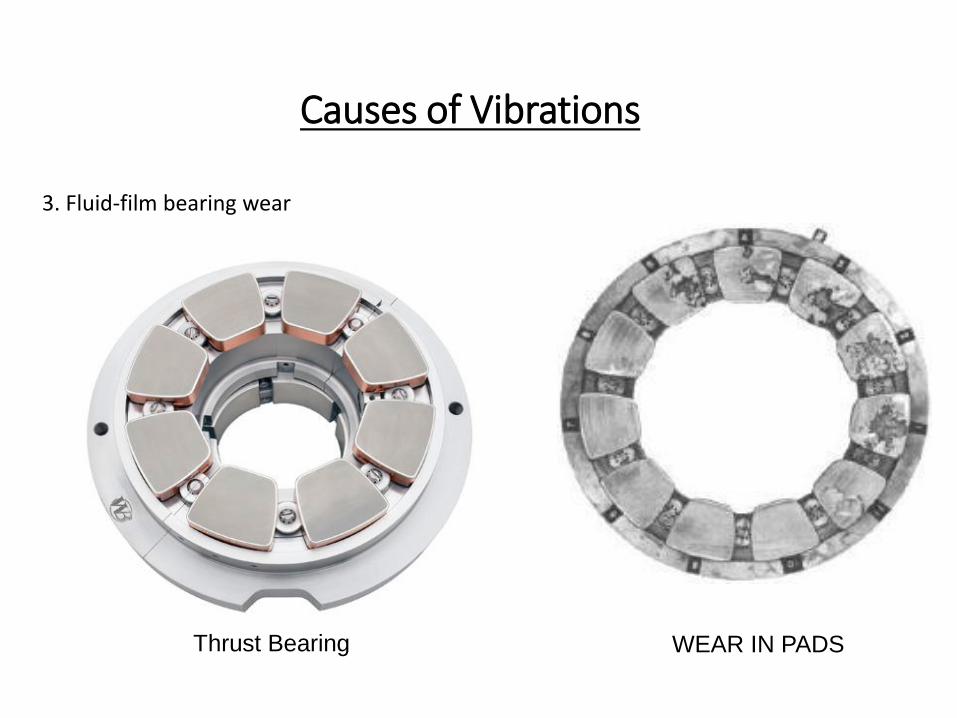
3. Fluid-film bearing wear
JOURNAL BEARING
WEAR IN PADS
Causes of Vibrations
3. Fluid-film bearing wear
Thrust Bearing WEAR IN PADS
Causes of Vibrations
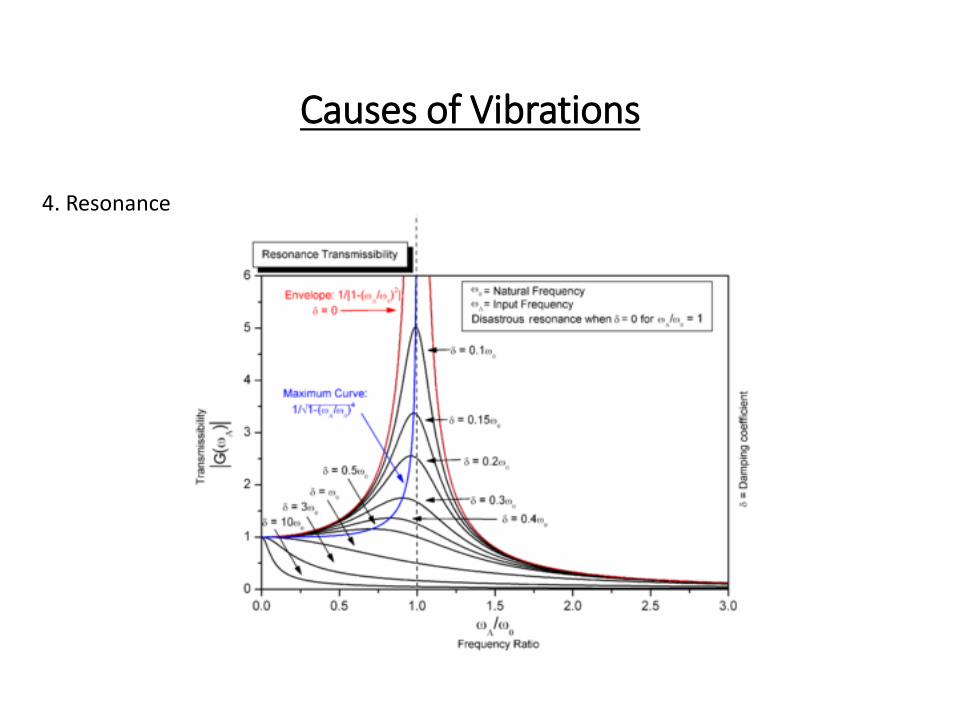
4. Resonance
Causes of Vibrations
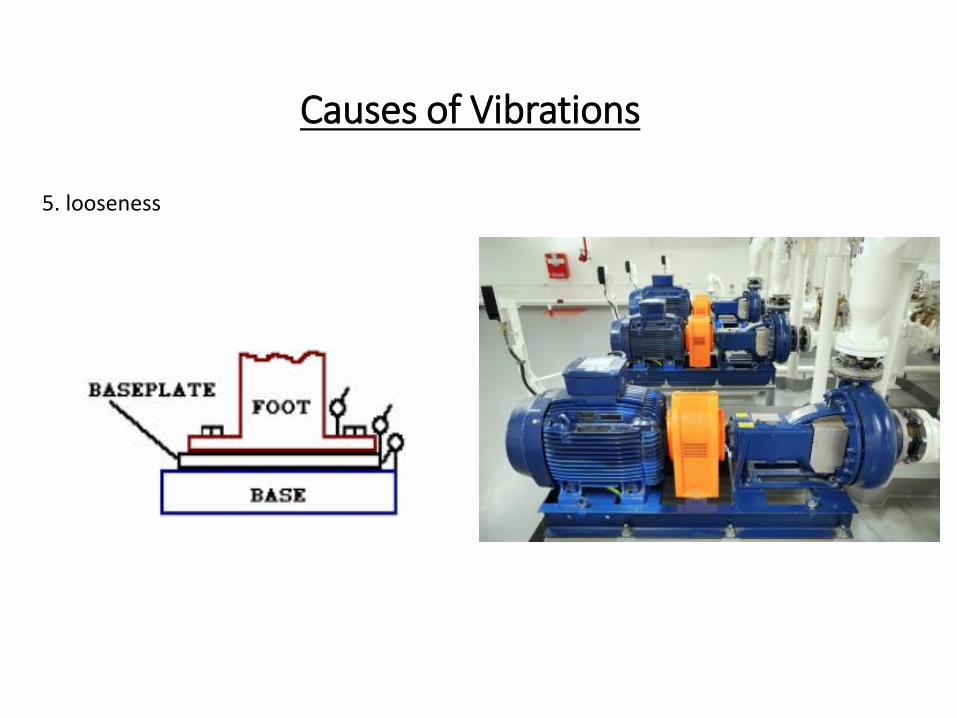
5. looseness
Causes of Vibrations
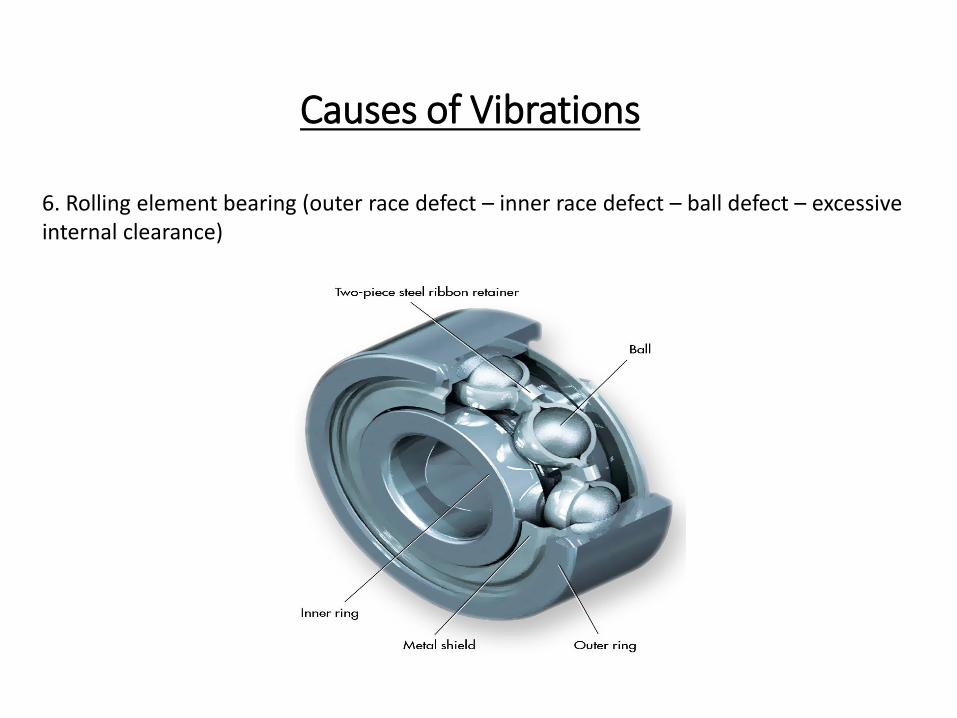
6. Rolling element bearing (outer race defect – inner race defect – ball defect – excessive internal clearance)
Causes of Vibrations
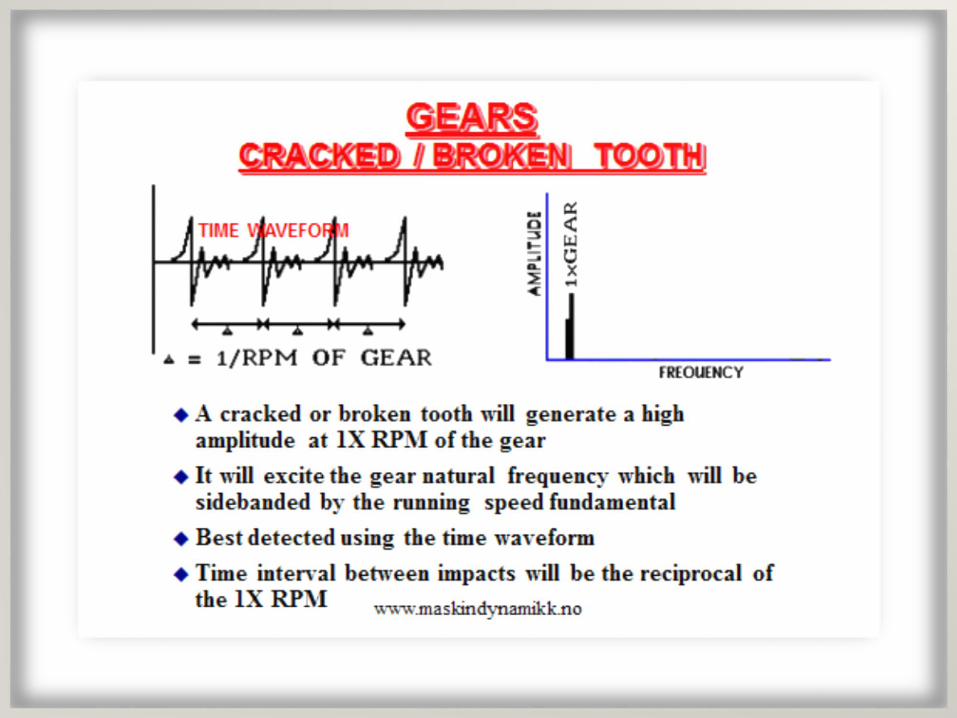
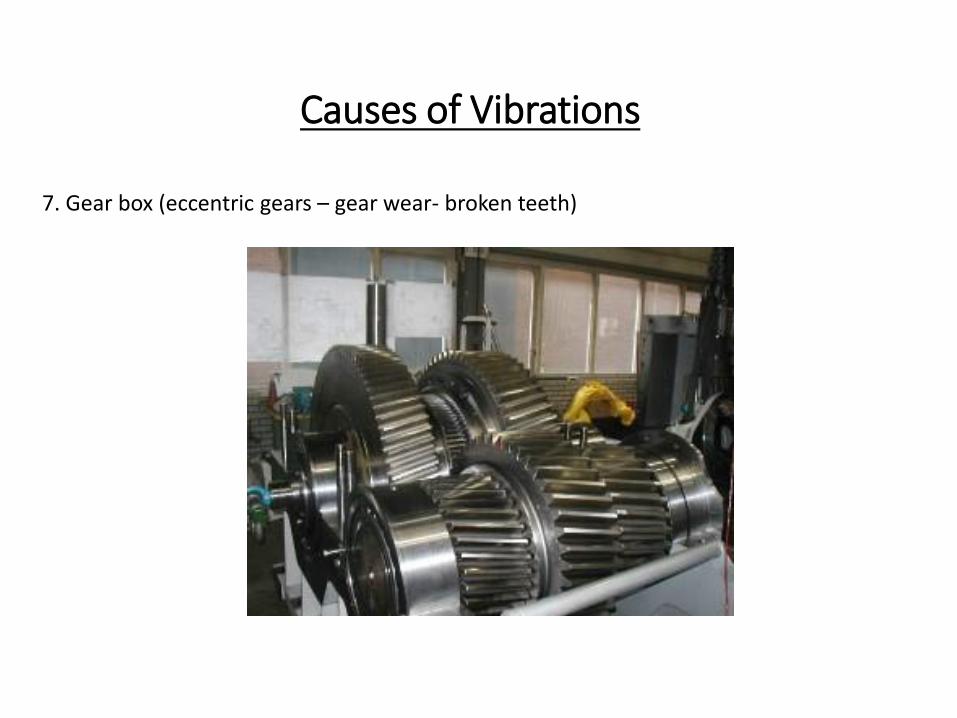
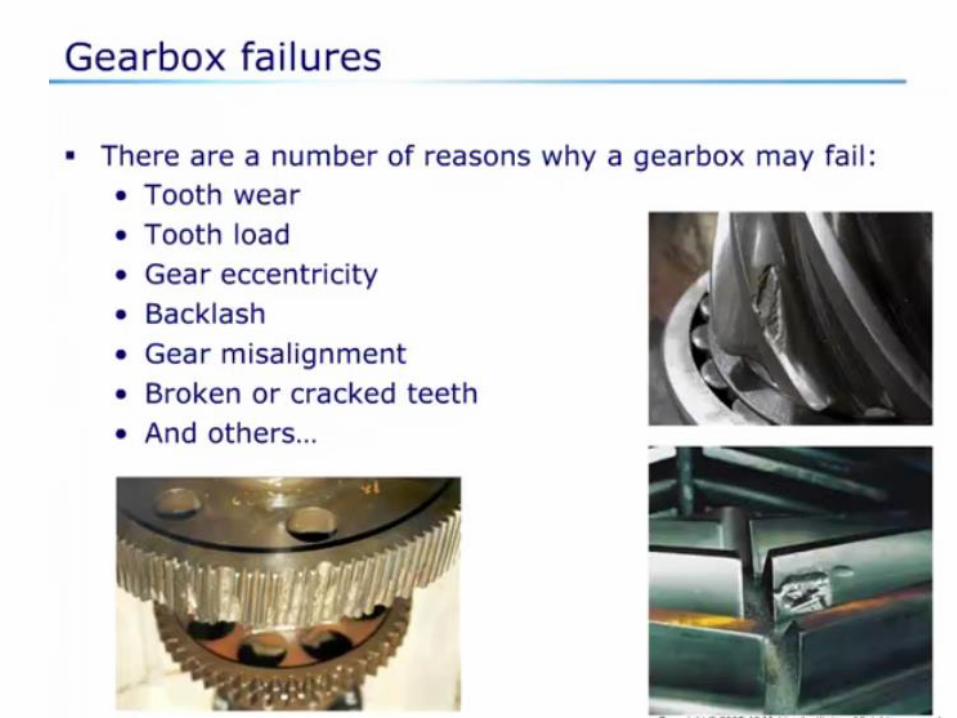
7. Gear box (eccentric gears – gear wear- broken teeth)
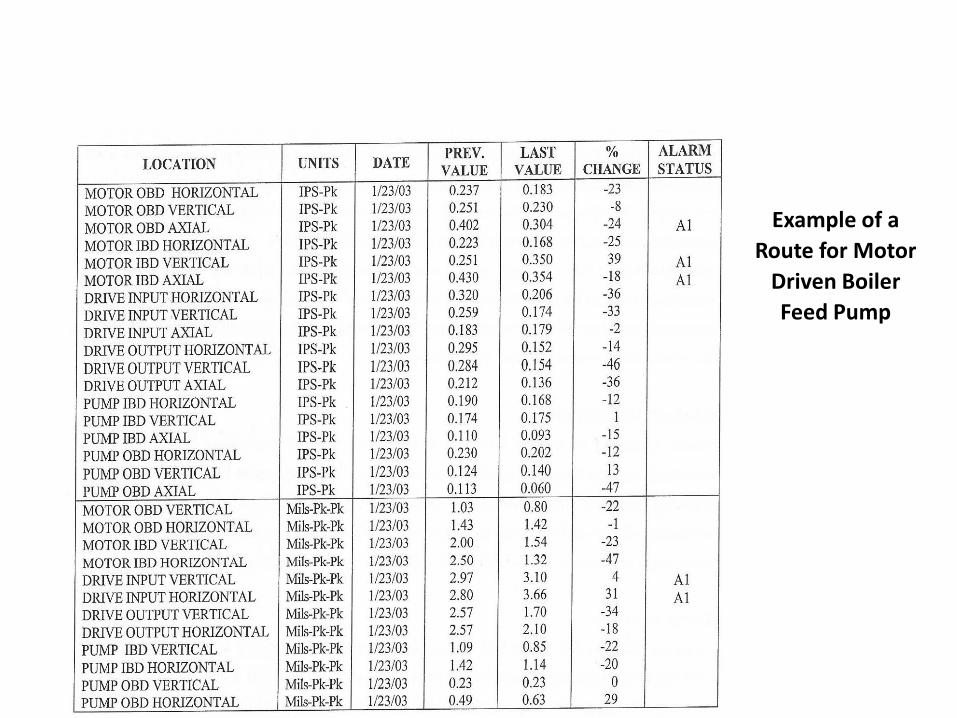
Example of a
Route for Motor
Driven Boiler
Feed Pump
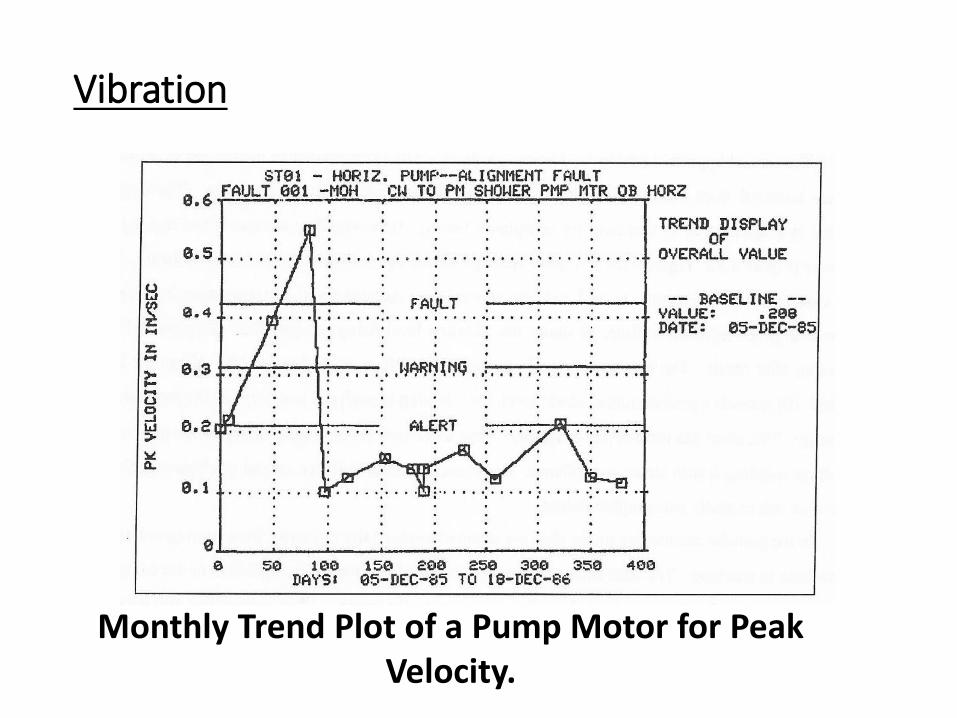
Vibration
Monthly Trend Plot of a Pump Motor for Peak Velocity.
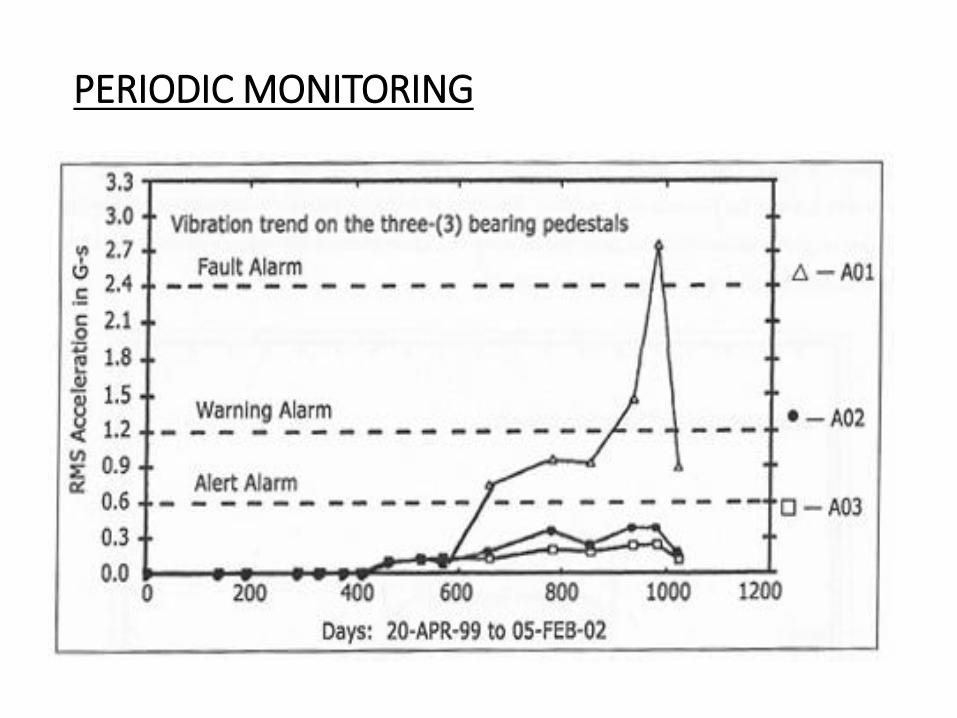
PERIODIC MONITORING
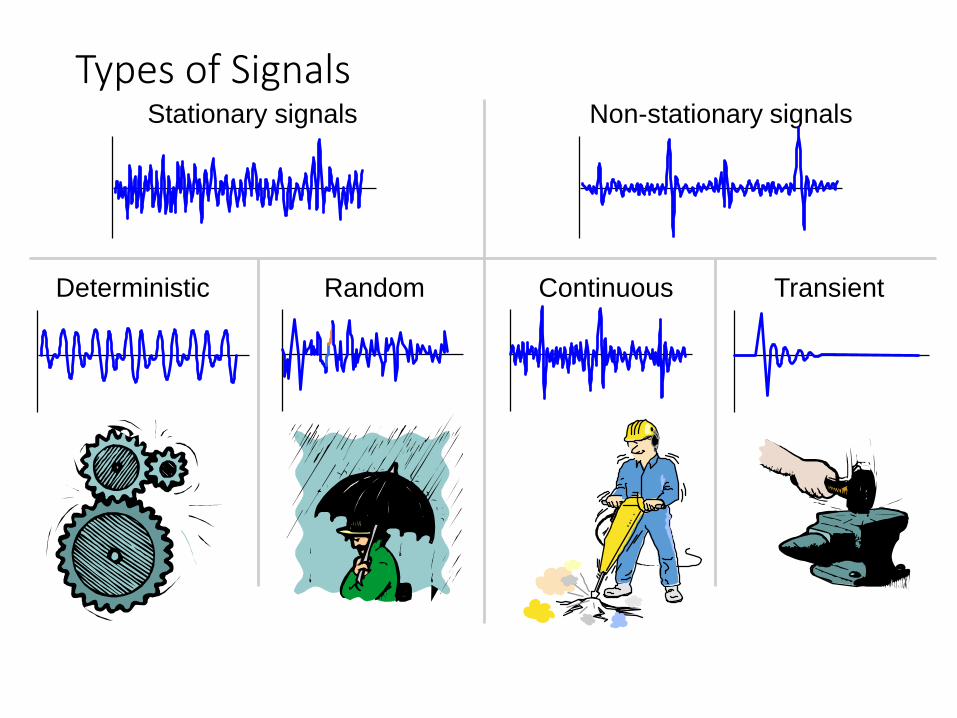
Types of Signals
Deterministic Random Continuous Transient
Non-stationary signalsStationary signals
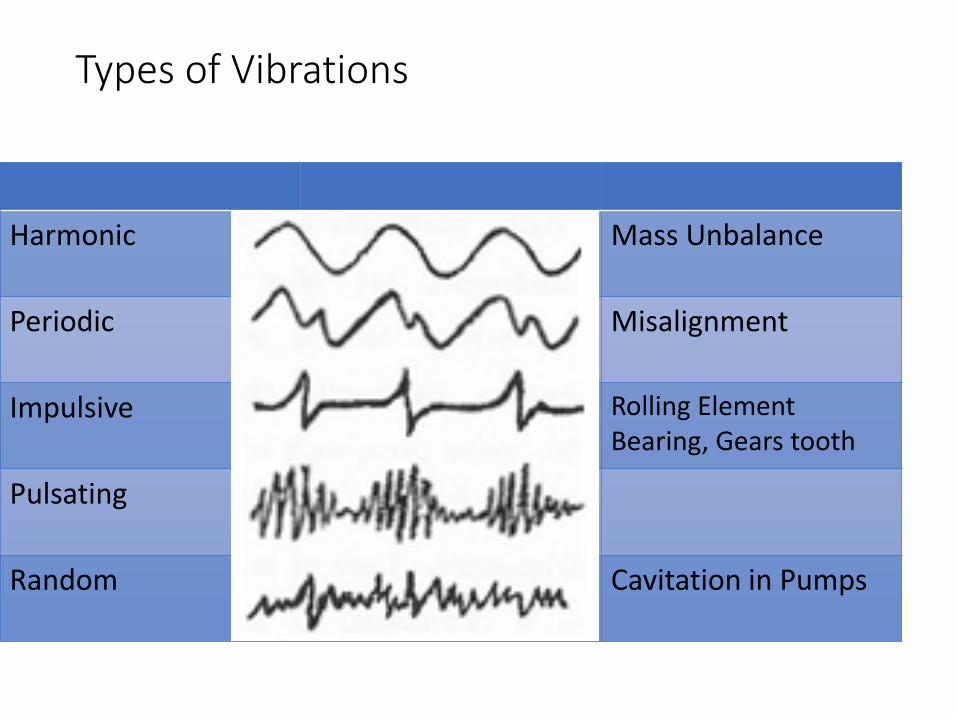
Types of Vibrations
Harmonic Mass Unbalance
Periodic Misalignment
Impulsive Rolling Element Bearing, Gears tooth
Pulsating
Random Cavitation in Pumps
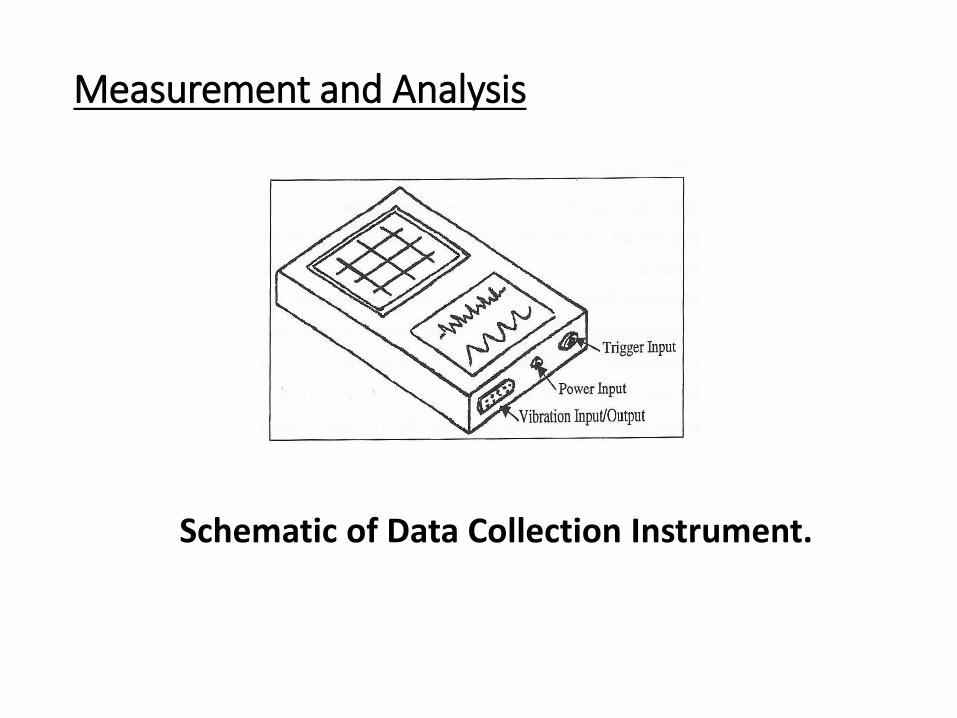
Measurement and Analysis
Schematic of Data Collection Instrument.
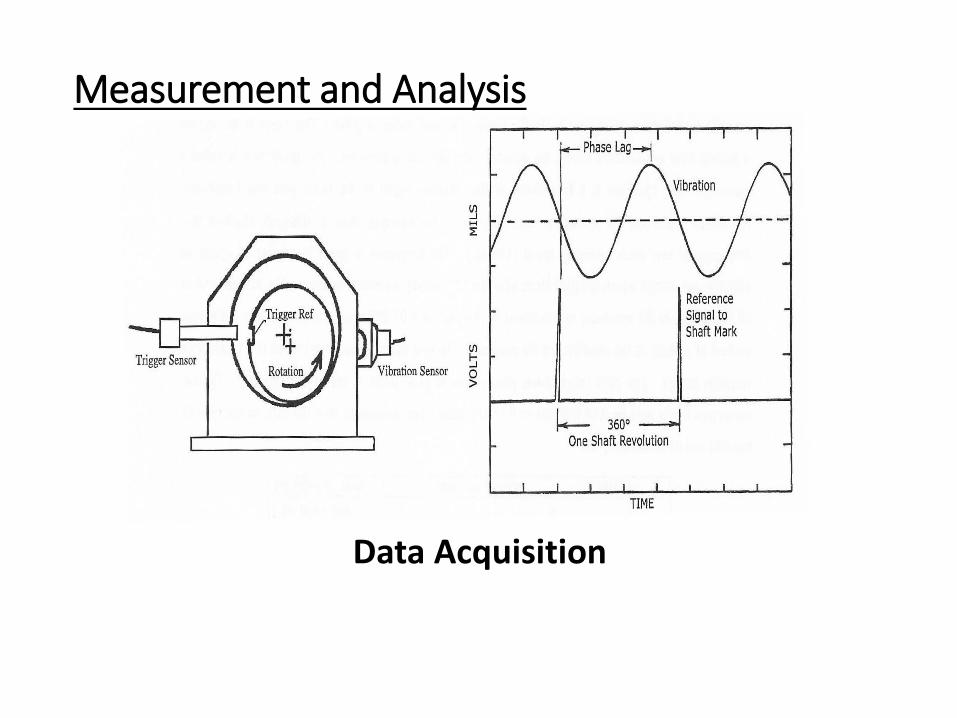
Measurement and Analysis
Data Acquisition
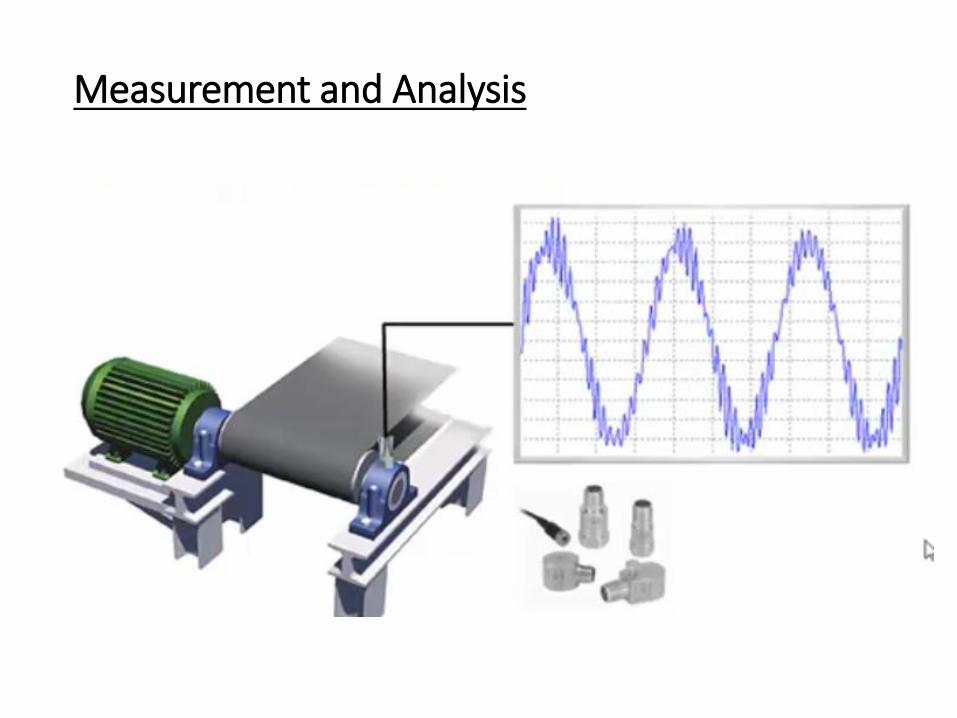
Measurement and Analysis
Measurement and Analysis
Data Acquisition with two sensors
PHYSICAL OBSERVATIONS by Human Senses
While there are several types of recorded data that form the basis for machine fault and condition analysis, among the most basic data are direct observations by the person doing the data collection based on human senses - hearing, sight, touch, smell, and taste. Human sensory capabilities, although not analytical, cannot be underestimated in the machine analysis process.
Noise
Unusual noises can indicate rubs, bearing defects, looseness, improper assembly, lack of lubrication, and any other metal to metal contact problems. A listening rod or screw driver can be used to detect a bearing defect or rubbing in a low speed machine. In pumps, a sign of flow problems is a noise that sounds like gravel in the piping. Motors and generators may emit high frequency whining noises when they are subject to excessive vibration due to casing distortion, misalignment, or coupling unbalance.
Noise
High pitched noise from new gears indicates bad construction and machinery quality or design (low contact ratio). Rubbing of guards by pulleys and belts will cause impacting and noise. Lack of lubrication in oil starved bearings or bearings with excessive clearance means that the bearing needs attention. Excessive noise is almost always an indicator of trouble. The experienced data collector will be able to enhance their analytical capability by learning to identify noise sources and associate the physical problem with them.
Sight
The use of sight is an even more powerful tool for data collectors. Smoke, fire, and catastrophic failures need and get immediate attention. However, other mundane faults may go unnoticed for months. Foundation and bearing pedestal faults are the source of many cases of excessive vibration. A flashlight and feeler gage or knife help to root out these type problems. Squishing oil between joints is a certain clue of looseness.Cracks in ducting and piping and other machine components provide clues to the presence of excessive vibration. Vibration analysis will confirm these faults
Sight
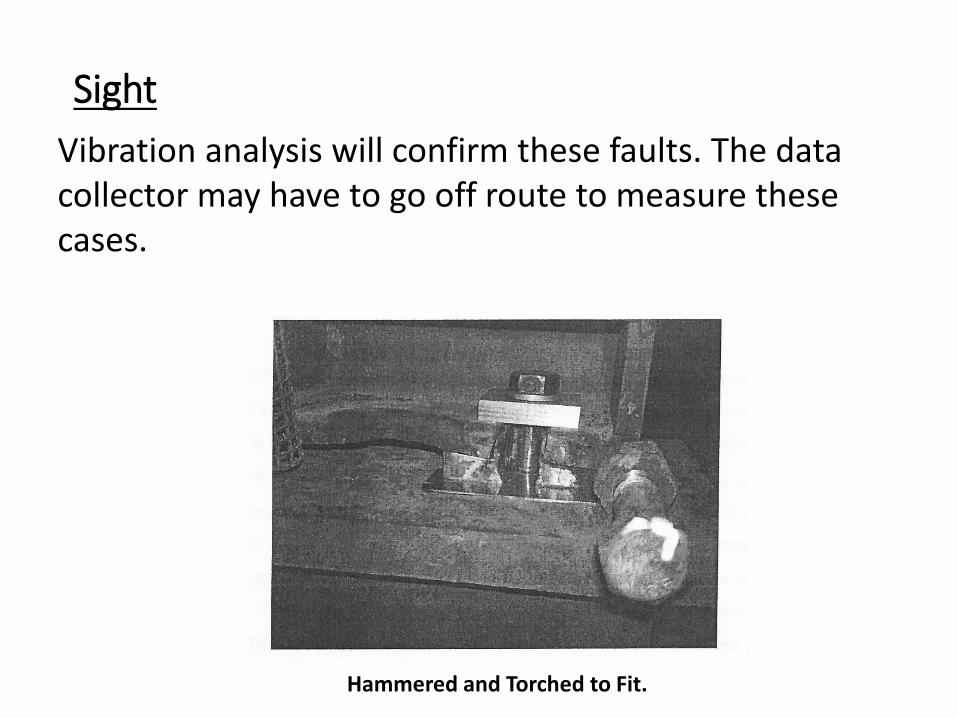
Vibration analysis will confirm these faults. The data collector may have to go off route to measure these cases.
Hammered and Torched to Fit.
Smell and Touch
The senses of smell and touch are less important but should not be neglected. Unusual, abnormal odors are easily detected by the human sense of smell. Oil smoke can be smelled long before an oil fire. Ammonia and other chemical and gas leaks are best detected by the nose. Even small quantities can be detected. Hot bearings or other machine parts that are not normally operating above ambient temperature can be identified by touch. However, the data collector needs to exercise extreme caution. A steaming or red hot machine should not be touched. The water can confirm the temperatures are above 100⁰ C. The use of taste is not recommended in this work.
PERIODIC AND CONTINUOUS DATA COLLECTION
Periodic and continuous non-intrusive data collection provide current and trended information about the condition of a machine. The procedure involves the use of sensors to acquire data, meters to quantify the measured data, and instruments to store, manipulate, and present the data. Periodically acquired data provide an intermittent record of what is happening in the machine. Whereas continuous data monitoring and collection provides continuous surveillance along with the ability to protect the machine through data based automatic shutdown.
PERIODIC AND CONTINUOUS DATA COLLECTION
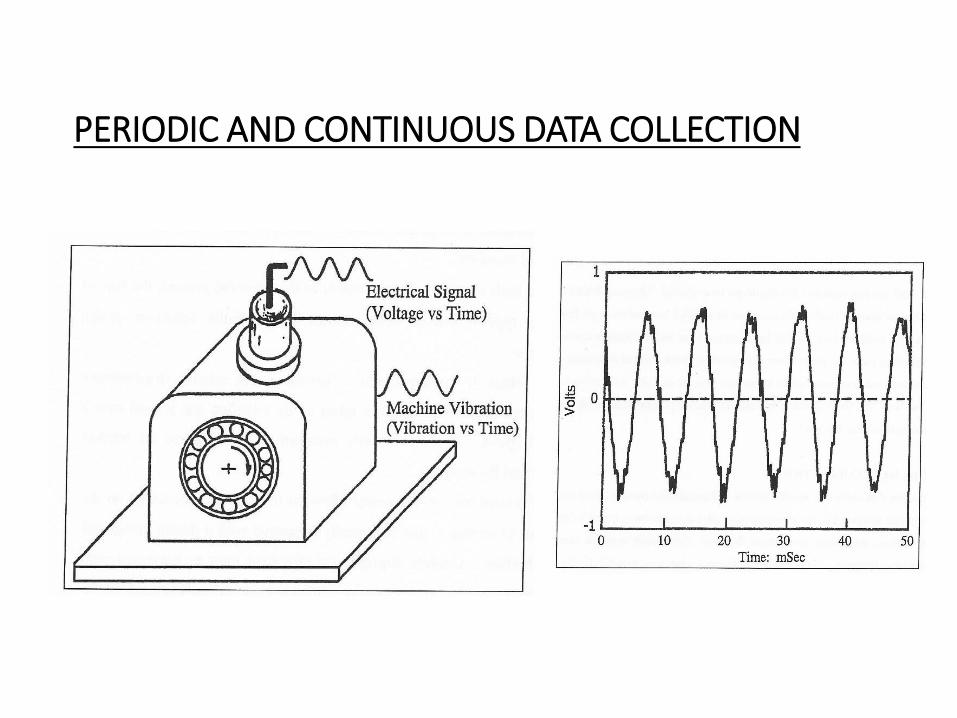
Measurement of vibration for analytical use is performed by a sensor, sometimes called a transducer or pickup, and is nonintrusive to the machine or process. The sensor transforms the vibration (mechanical motion) of the mounting location to an electrical voltage which varies with time.
PERIODIC AND CONTINUOUS DATA COLLECTION
Selecting a Measure
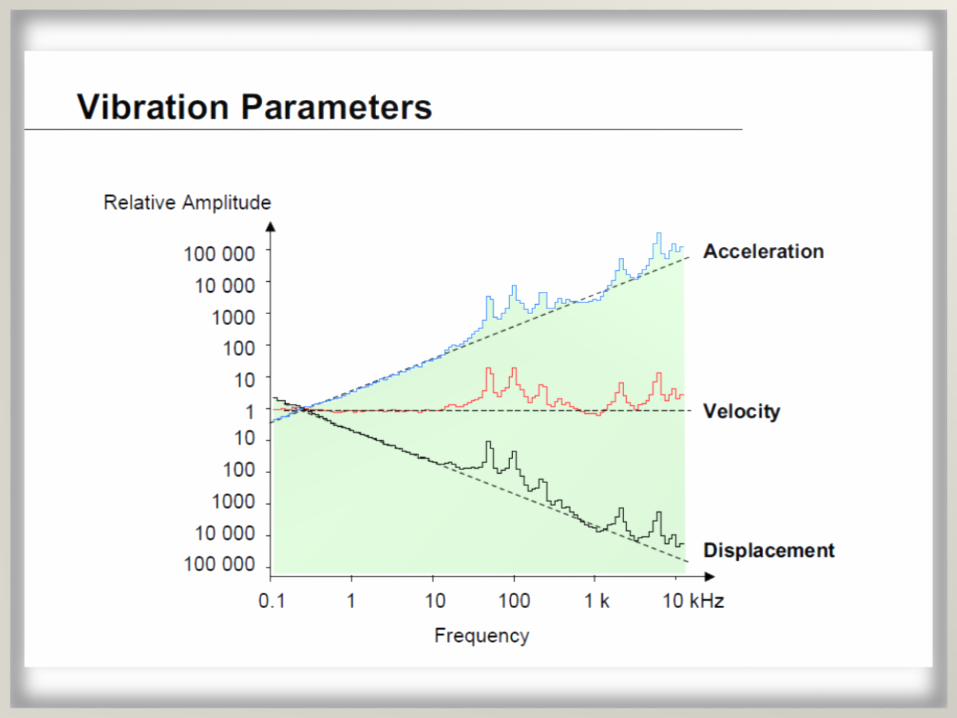
A measure is a unit or measures of vibration are standard of measurement that provides a means for physical evaluation. Examples of measures are pounds for weight and feet for height. Three basic available displacement, velocity, and acceleration. Ideally the sensor would directly provide the selected measure. Unfortunately, sensor limitations do not always allow direct measurement of vibration in the proper measure. Other predictive maintenance based measures are temperature, pressure, and viscosity.
Selecting a Measure
The measure is selected on the basis of the frequency content of the vibration present, the type of sensor, the design of the machine, the type of analysis to be conducted (e.g., faults, condition, design information), and the information sought.
Selecting a Measure
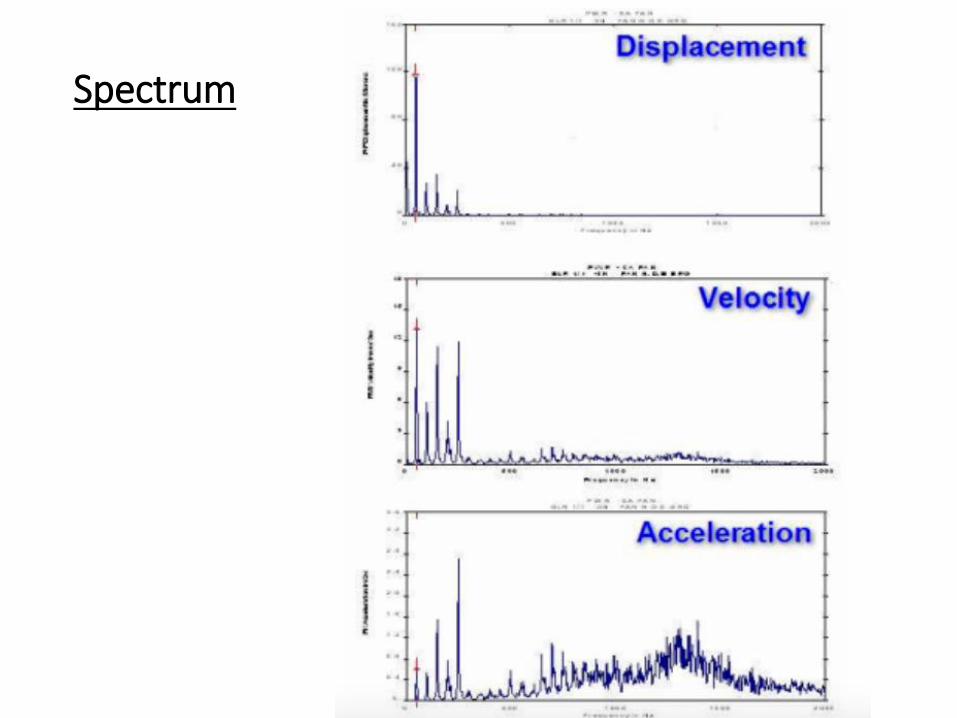
Relative shaft displacement
which is measured with a non-contacting relative displacement sensor, proximity probe, shows the extent of bearing clearance taken up by vibration and is used over a frequency range as wide as the shaft speed. This permanently mounted probe measures the relative motion between the point of mounting and the rotor.
Selecting a Measure
Absolute displacementwhich is used for low-frequency vibration (0 to 10Hz) measured on the bearing pedestal, relates to stress (shaft or structure) and is typically measured with a double integrated accelerometer. It is called seismic vibration. Absolute displacement of a shaft must be measured with either a contacting sensor or a noncontacting sensor in combination with a seismic sensor mounted on the bearing pedestal.
Selecting a Measure
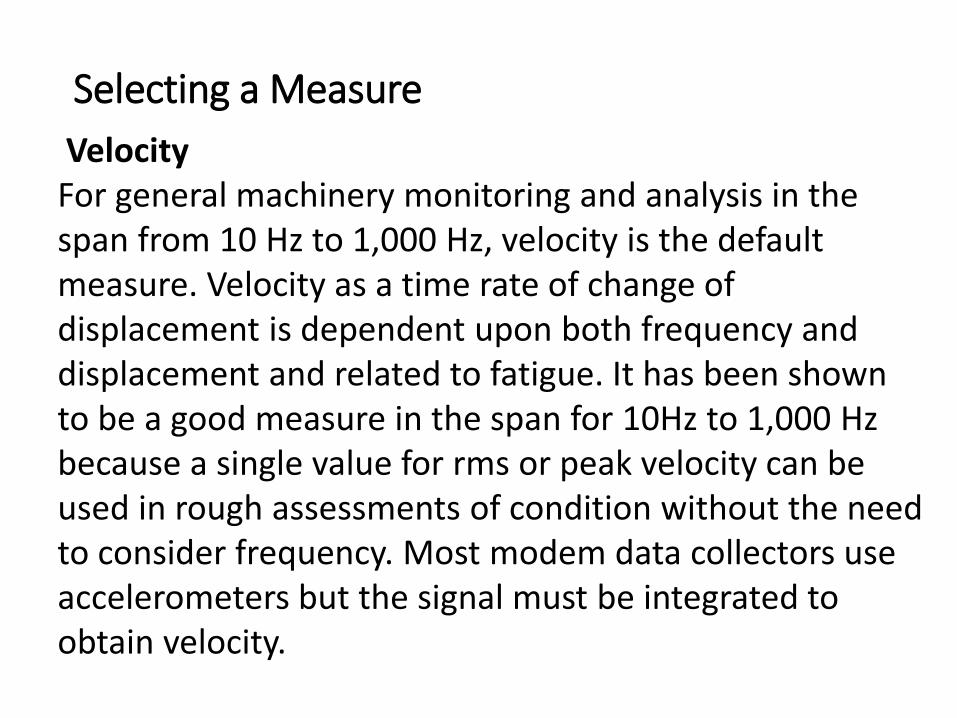
VelocityFor general machinery monitoring and analysis in the span from 10 Hz to 1,000 Hz, velocity is the default measure. Velocity as a time rate of change of displacement is dependent upon both frequency and displacement and related to fatigue. It has been shown to be a good measure in the span for 10Hz to 1,000 Hz because a single value for rms or peak velocity can be used in rough assessments of condition without the need to consider frequency. Most modem data collectors use accelerometers but the signal must be integrated to obtain velocity.
Selecting a Measure
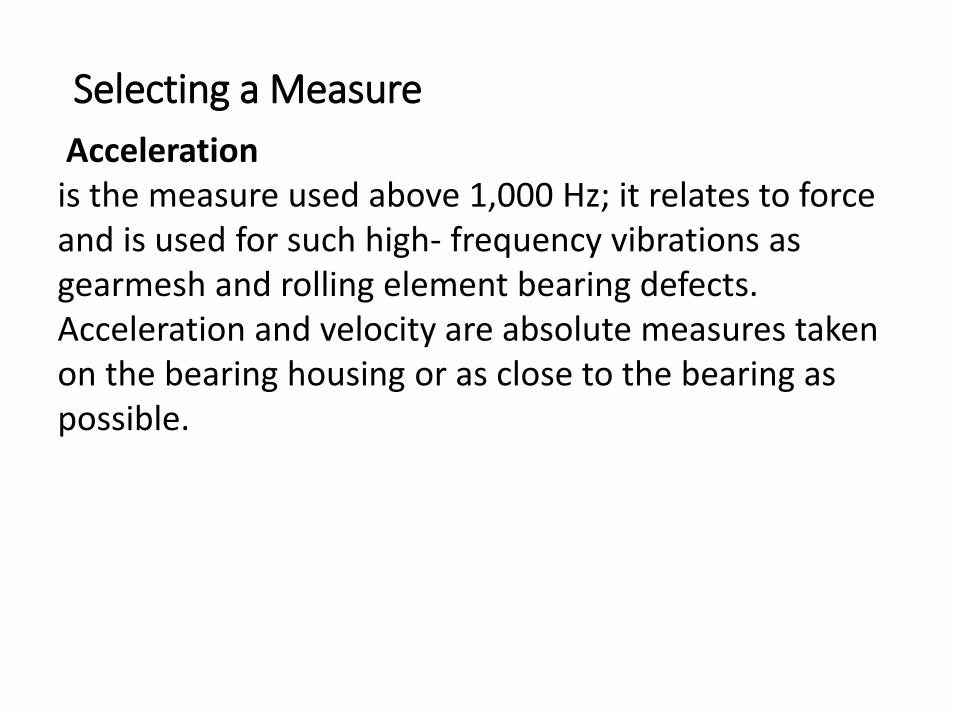
Acceleration is the measure used above 1,000 Hz; it relates to force and is used for such high- frequency vibrations as gearmesh and rolling element bearing defects. Acceleration and velocity are absolute measures taken on the bearing housing or as close to the bearing as possible.
Selecting a Measure
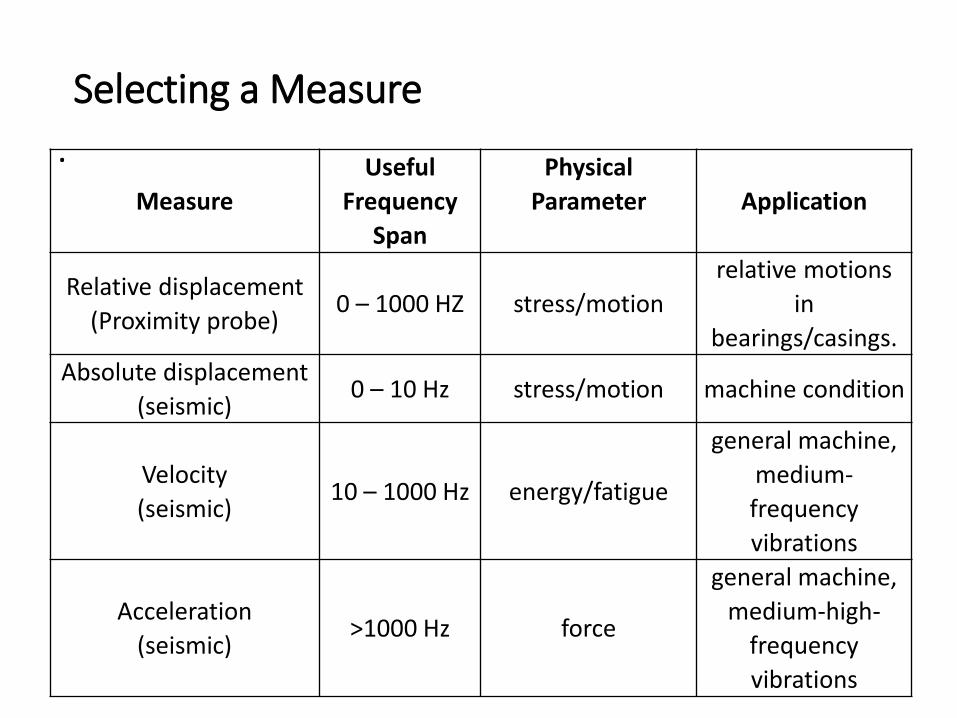
.
Measure
Useful
Frequency
Span
Physical
Parameter Application
Relative displacement
(Proximity probe)0 – 1000 HZ stress/motion
relative motions
in
bearings/casings.
Absolute displacement
(seismic)0 – 10 Hz stress/motion machine condition
Velocity
(seismic)10 – 1000 Hz energy/fatigue
general machine,
medium-
frequency
vibrations
Acceleration
(seismic)>1000 Hz force
general machine,
medium-high-
frequency
vibrations
Selecting a Measure
The rule of thumb for measure selection is that velocity is used for bearing pedestal measurement up to 1,000 RPM and acceleration is used above that machine speed. If the machine has permanent non-contacting displacement sensors, then displacement is acquired.
Selecting a Measure
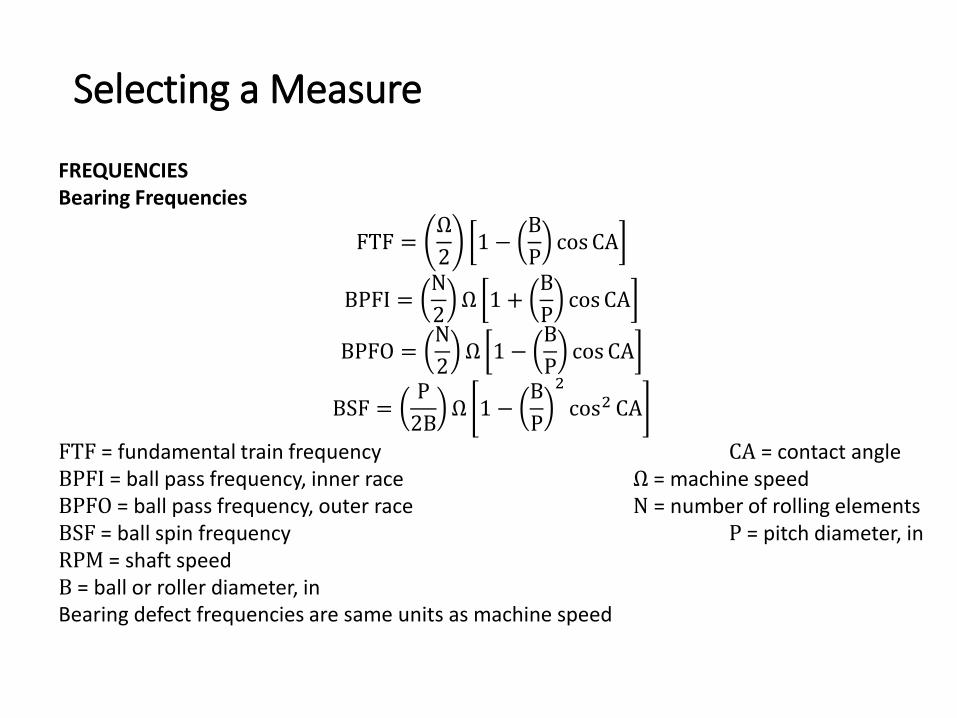
FREQUENCIES Bearing Frequencies
FTF =Ω
21 −
B
PcosCA
BPFI =N
2Ω 1 +
B
PcosCA
BPFO =N
2Ω 1 −
B
Pcos CA
BSF =P
2BΩ 1 −
B
P
2
cos2 CA
FTF = fundamental train frequency CA = contact angle BPFI = ball pass frequency, inner race Ω = machine speed BPFO = ball pass frequency, outer race N = number of rolling elements BSF = ball spin frequency P = pitch diameter, in RPM = shaft speedB = ball or roller diameter, in Bearing defect frequencies are same units as machine speed
Selecting a Measure
FREQUENCIES
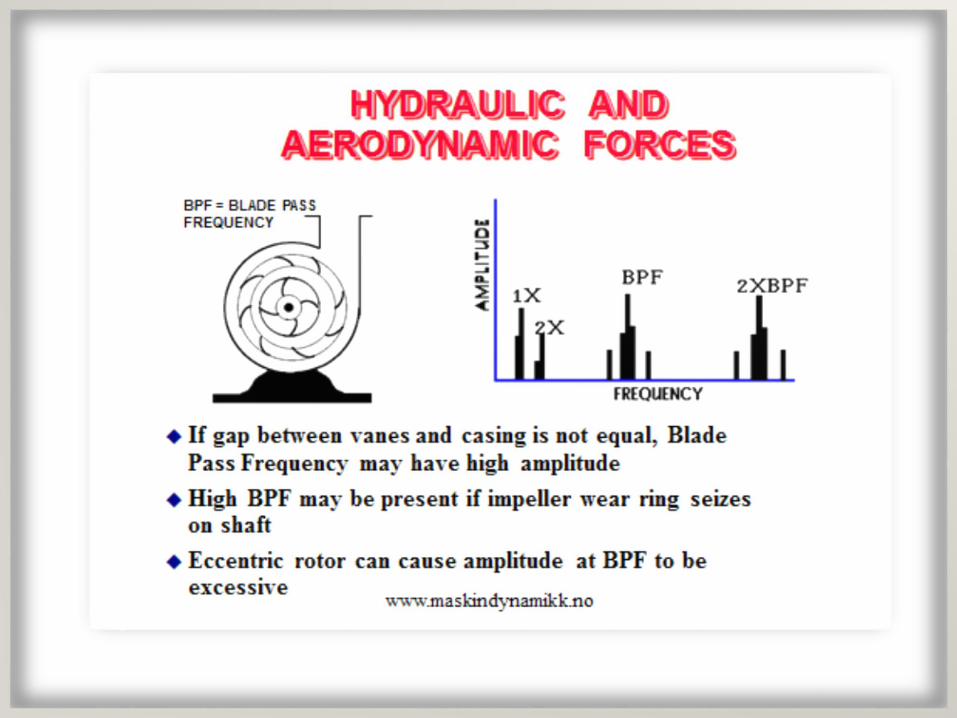
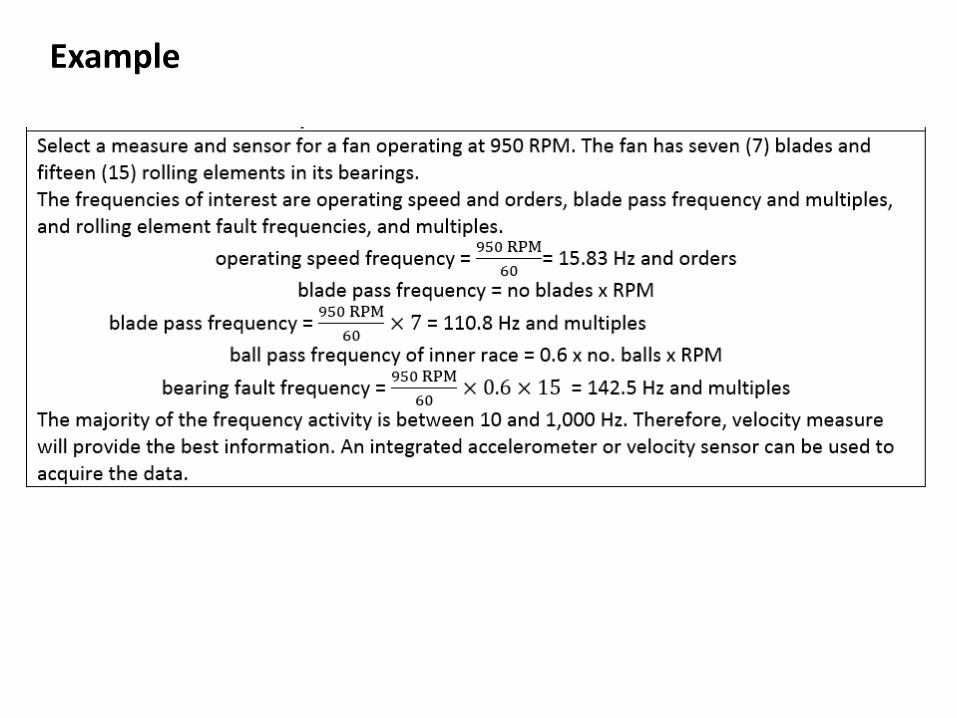
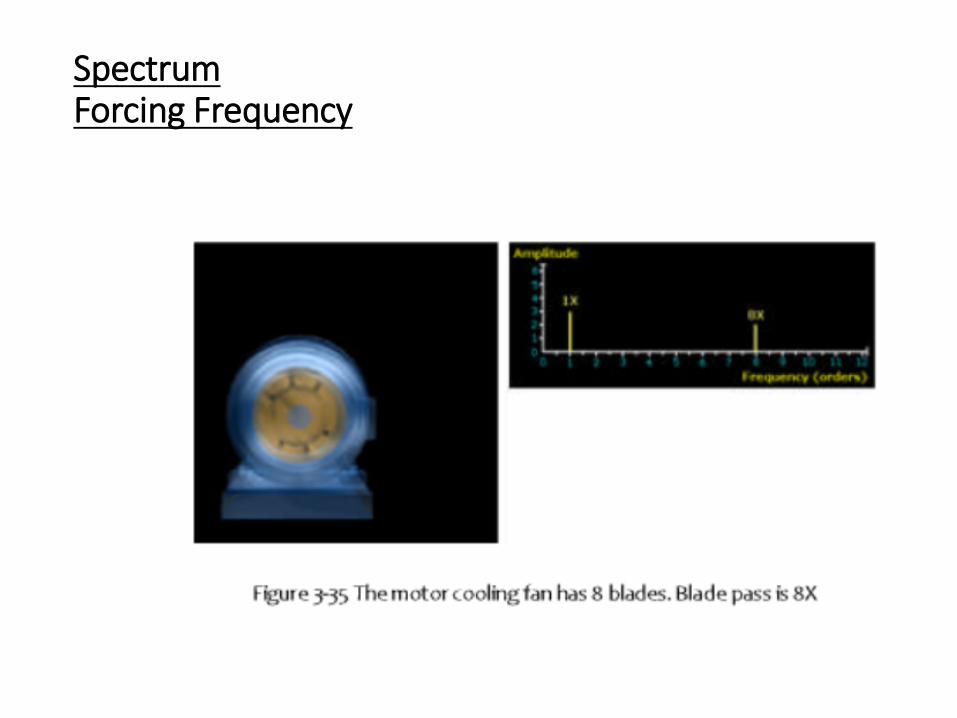
FAN
blade pass frequency = no blades x RPM
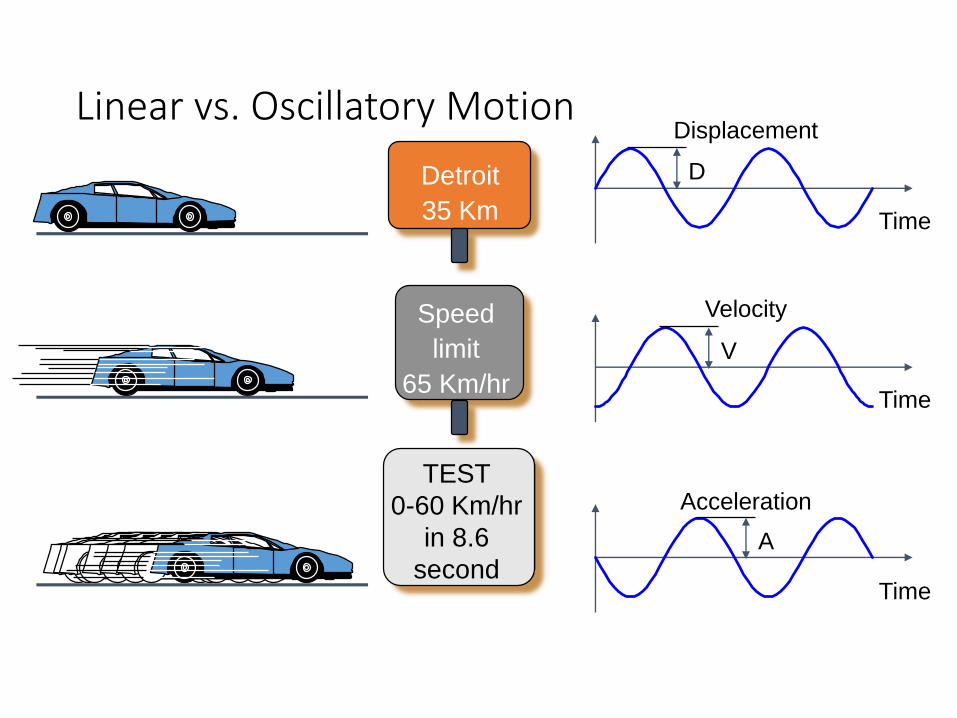
Linear vs. Oscillatory Motion
Detroit
35 Km
Speed
limit
65 Km/hr
TEST
0-60 Km/hr
in 8.6
second
D
Time
Displacement
Time
Time
Velocity
Acceleration
V
A
F = c × v
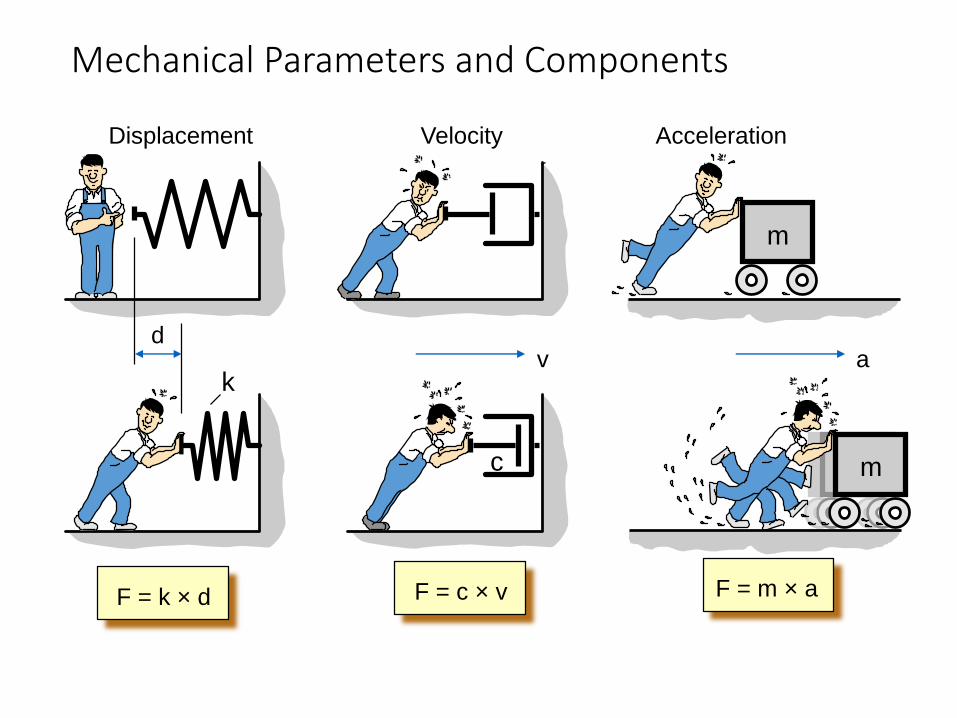
Mechanical Parameters and Components
VelocityDisplacement Acceleration
dv a
k
c
m
m
F = k × d F = m × a
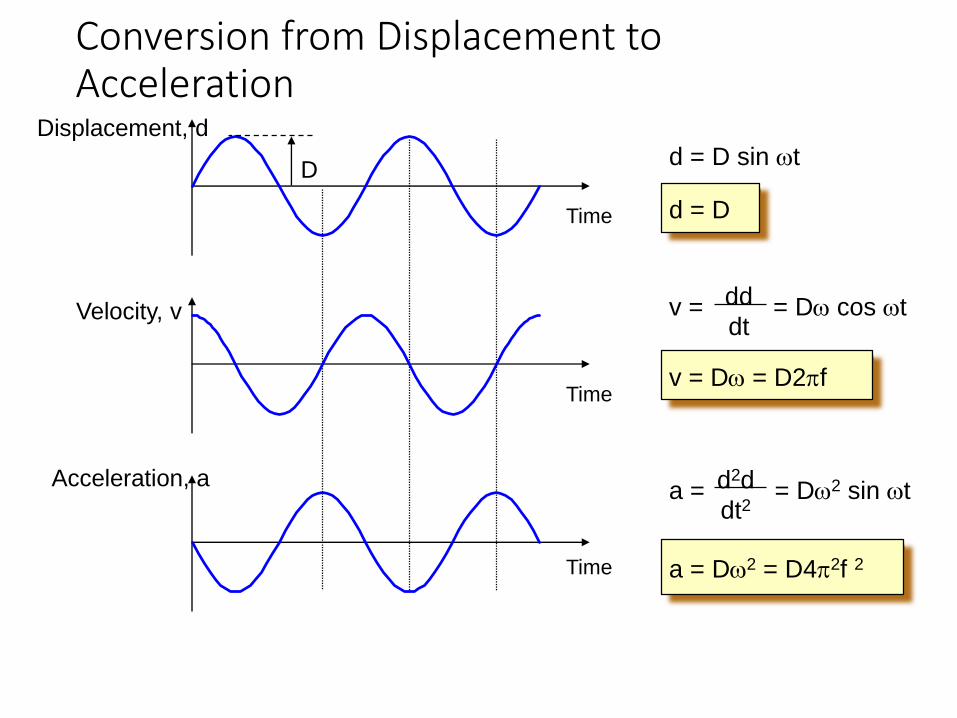
Conversion from Displacement to Acceleration
Displacement, d
Velocity, v
Acceleration, a
Time
D
Time
Time
d = D sin wt
d = D
v = = Dw cos wt dd
dt
v = Dw = D2pf
a = = Dw2 sin wt d2d
dt2
a = Dw2 = D4p2f 2
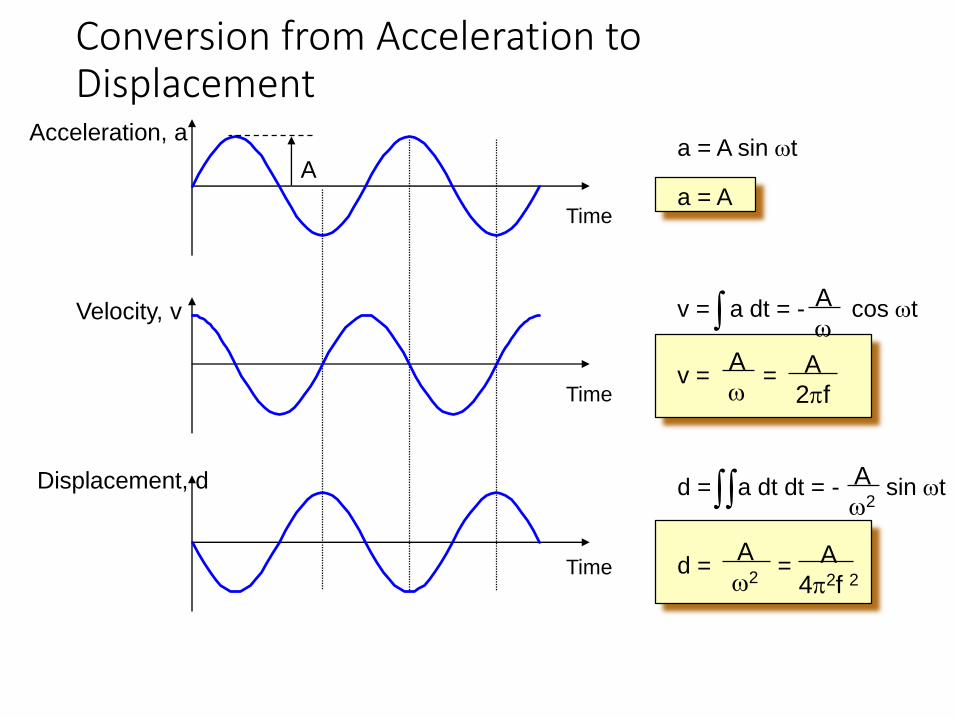
Conversion from Acceleration to Displacement
Acceleration, a
Velocity, v
Displacement, d
Time
A
Time
Time
a = A sin wt
a = A
v = a dt = - cos wtA
w
v = = A
2pf
A
w
d = a dt dt = - sin wtA
w2
d = = A
4p2f 2
A
w2

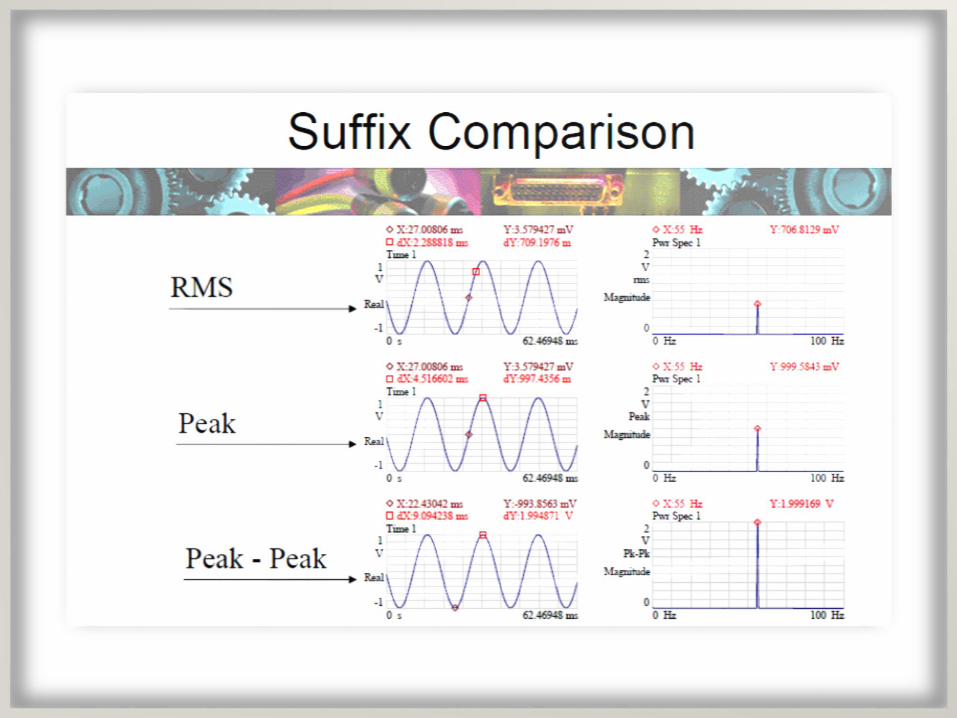
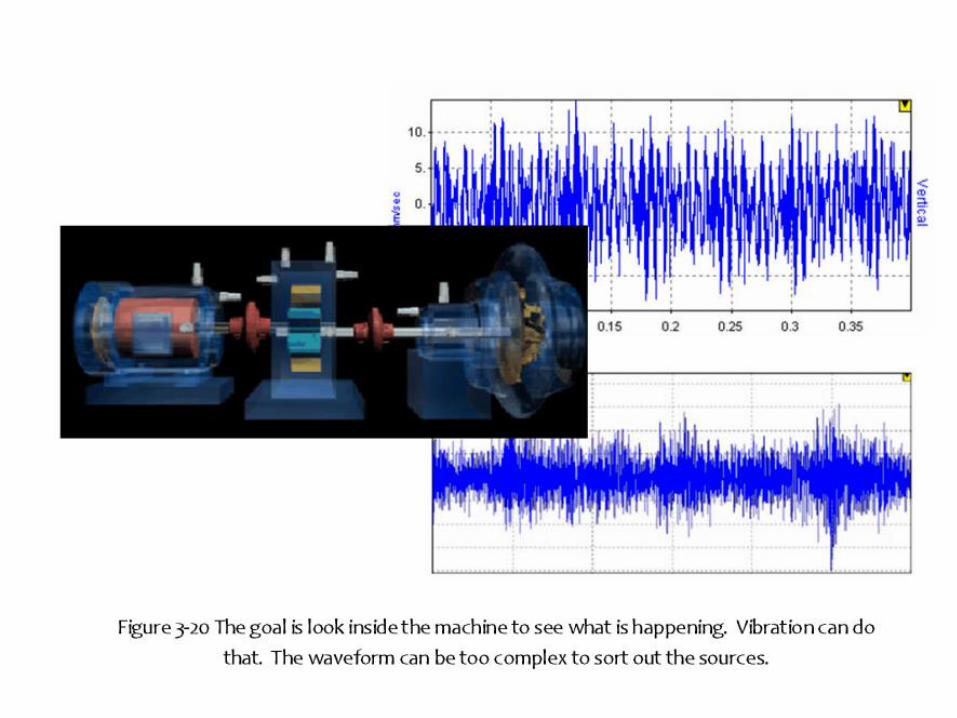
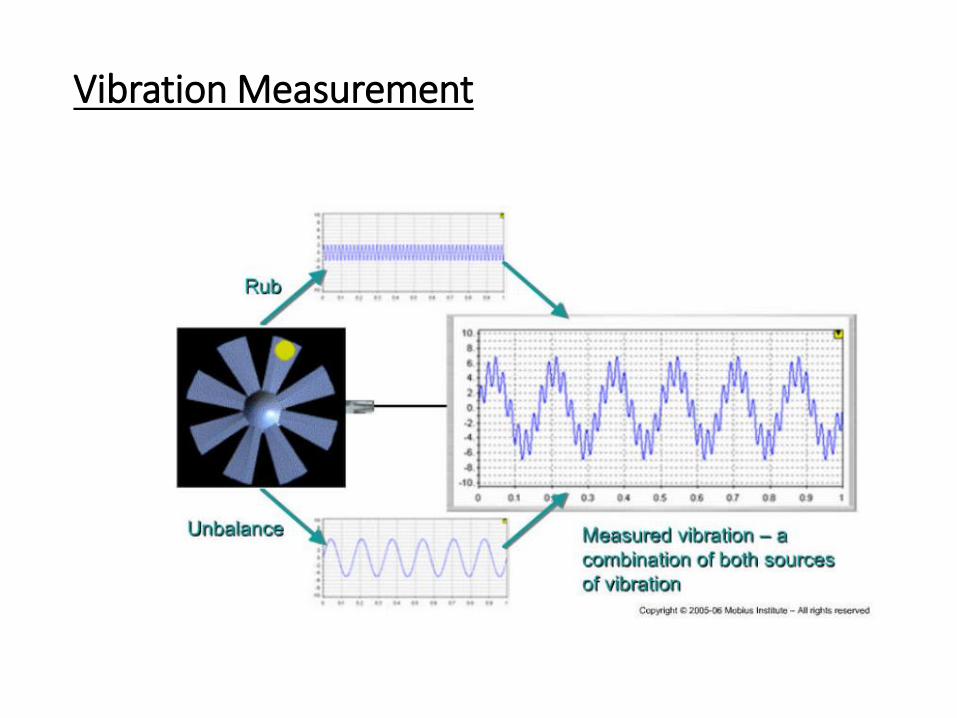
Vibration Measurement

Vibration Measurement
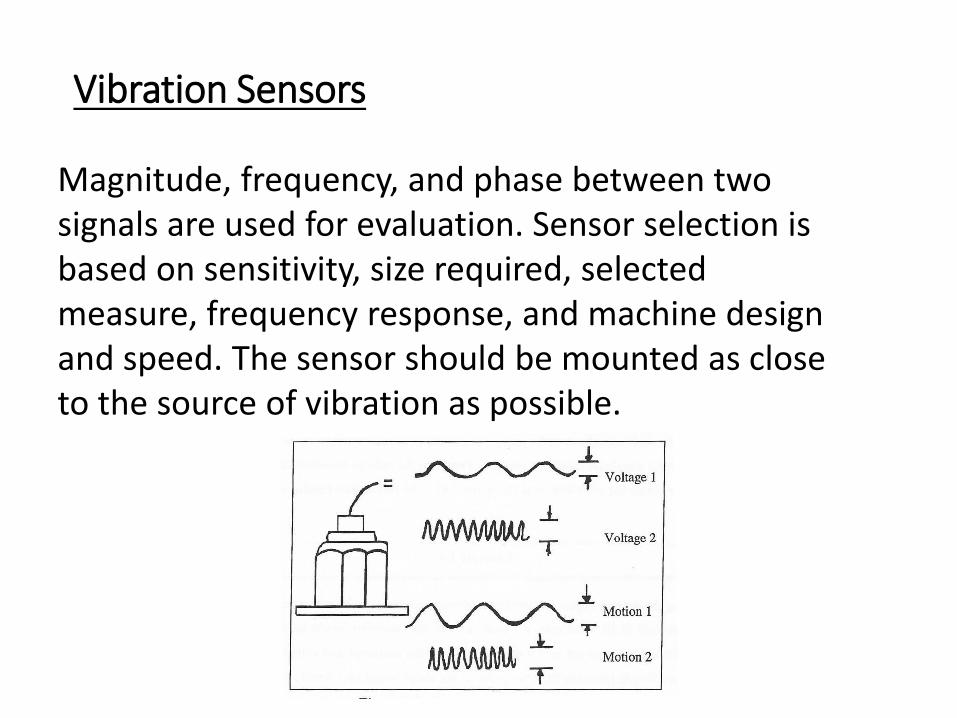
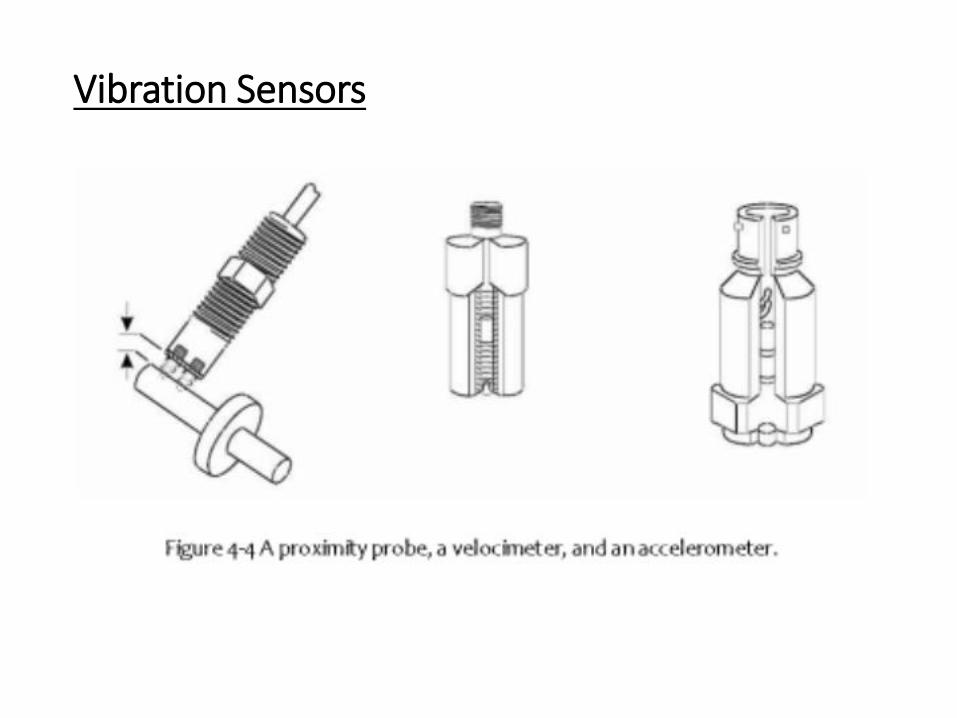
Vibration Sensors
Magnitude, frequency, and phase between two signals are used for evaluation. Sensor selection is based on sensitivity, size required, selected measure, frequency response, and machine design and speed. The sensor should be mounted as close to the source of vibration as possible.
Vibration Sensors
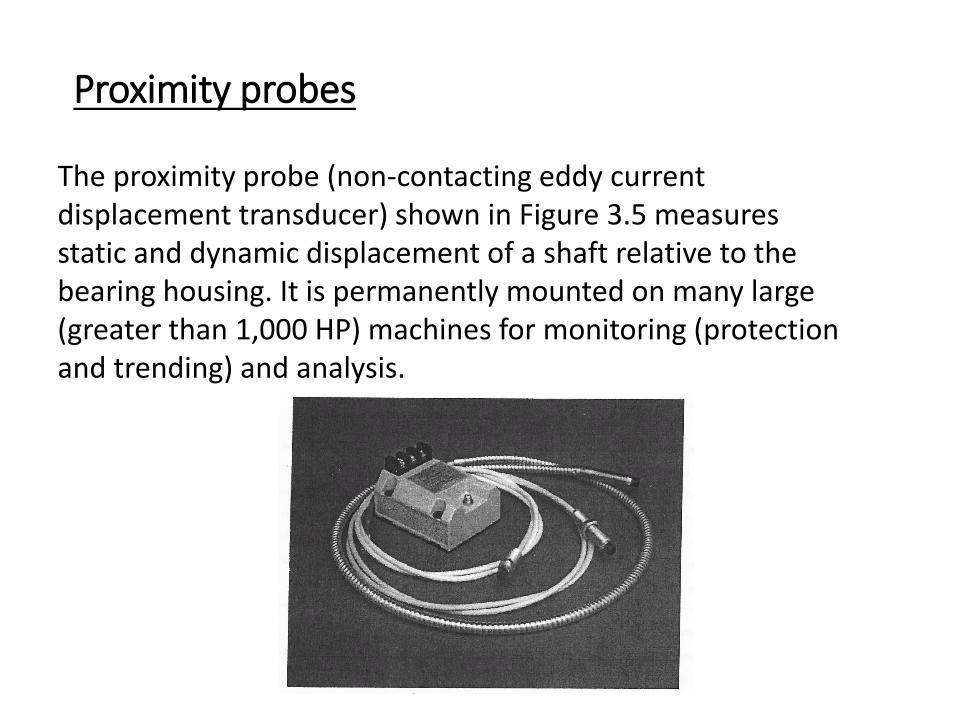
Proximity probes
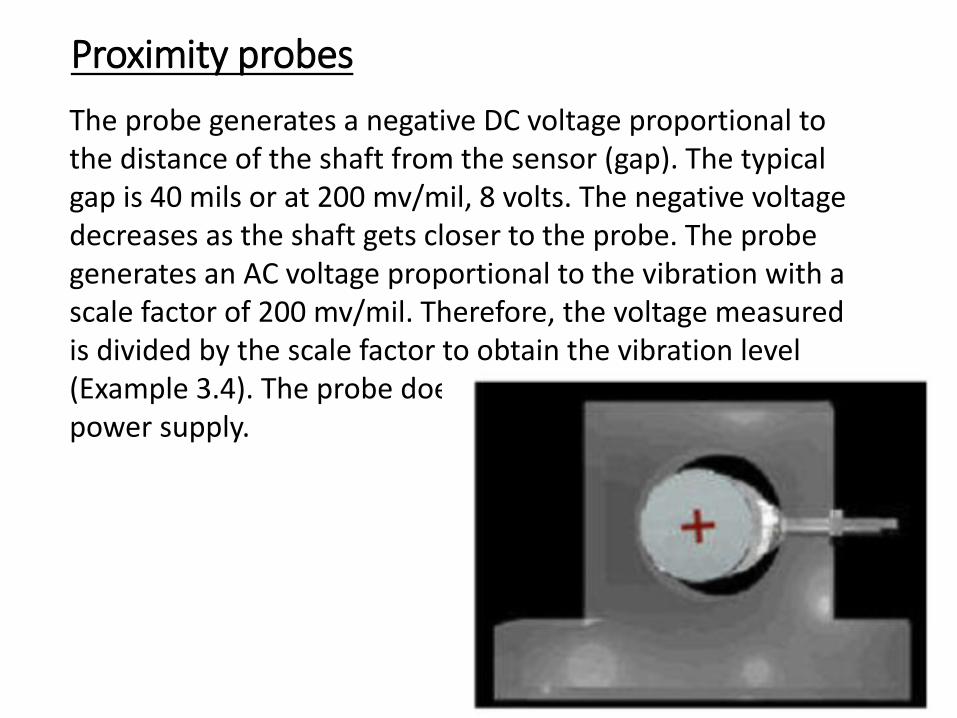
The proximity probe (non-contacting eddy current displacement transducer) shown in Figure 3.5 measures static and dynamic displacement of a shaft relative to the bearing housing. It is permanently mounted on many large (greater than 1,000 HP) machines for monitoring (protection and trending) and analysis.
Proximity probes
The probe generates a negative DC voltage proportional to the distance of the shaft from the sensor (gap). The typical gap is 40 mils or at 200 mv/mil, 8 volts. The negative voltage decreases as the shaft gets closer to the probe. The probe generates an AC voltage proportional to the vibration with a scale factor of 200 mv/mil. Therefore, the voltage measured is divided by the scale factor to obtain the vibration level (Example 3.4). The probe does require an 18 or 24 volt power supply.
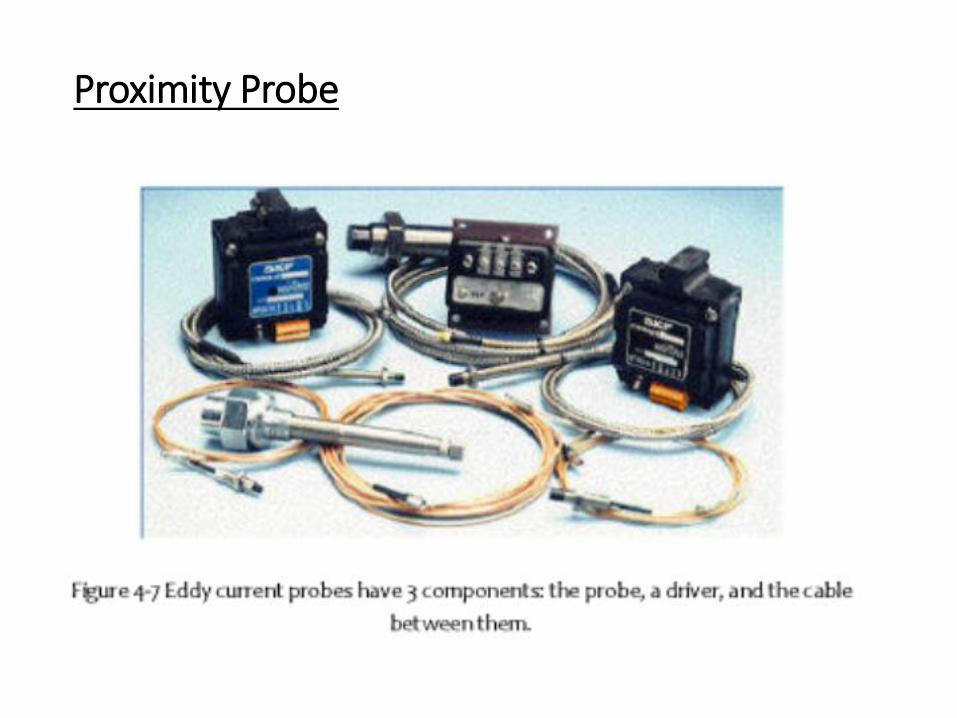
Proximity Probe
Example
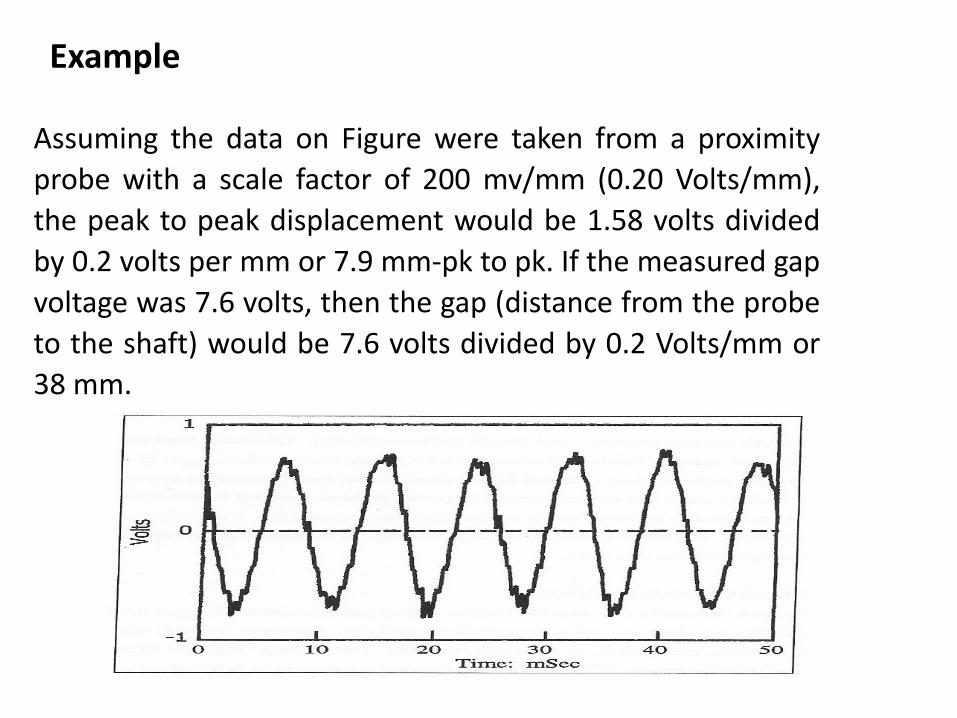
Assuming the data on Figure were taken from a proximity
probe with a scale factor of 200 mv/mm (0.20 Volts/mm),
the peak to peak displacement would be 1.58 volts divided
by 0.2 volts per mm or 7.9 mm-pk to pk. If the measured gap
voltage was 7.6 volts, then the gap (distance from the probe
to the shaft) would be 7.6 volts divided by 0.2 Volts/mm or
38 mm.
Example
Velocity transducers
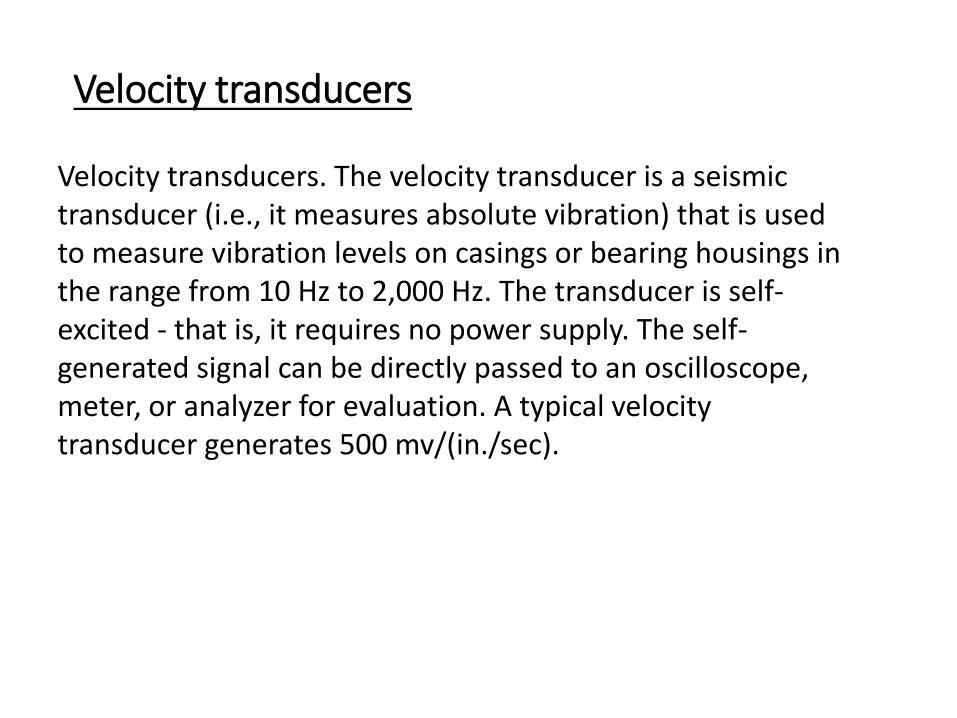
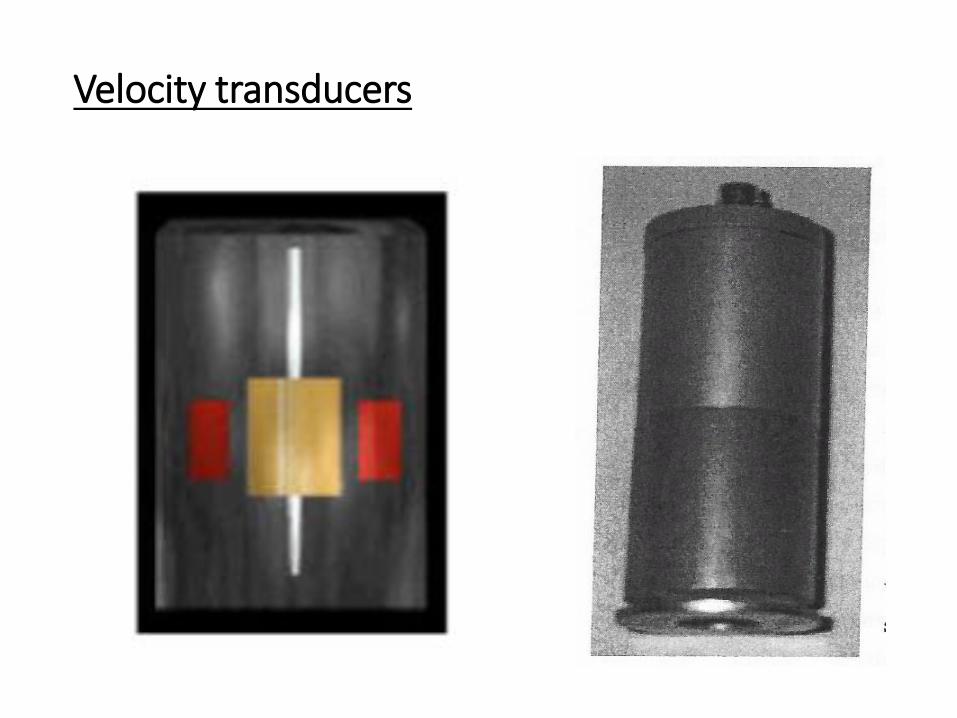
Velocity transducers. The velocity transducer is a seismic transducer (i.e., it measures absolute vibration) that is used to measure vibration levels on casings or bearing housings in the range from 10 Hz to 2,000 Hz. The transducer is self-excited - that is, it requires no power supply. The self-generated signal can be directly passed to an oscilloscope, meter, or analyzer for evaluation. A typical velocity transducer generates 500 mv/(in./sec).
Velocity transducers
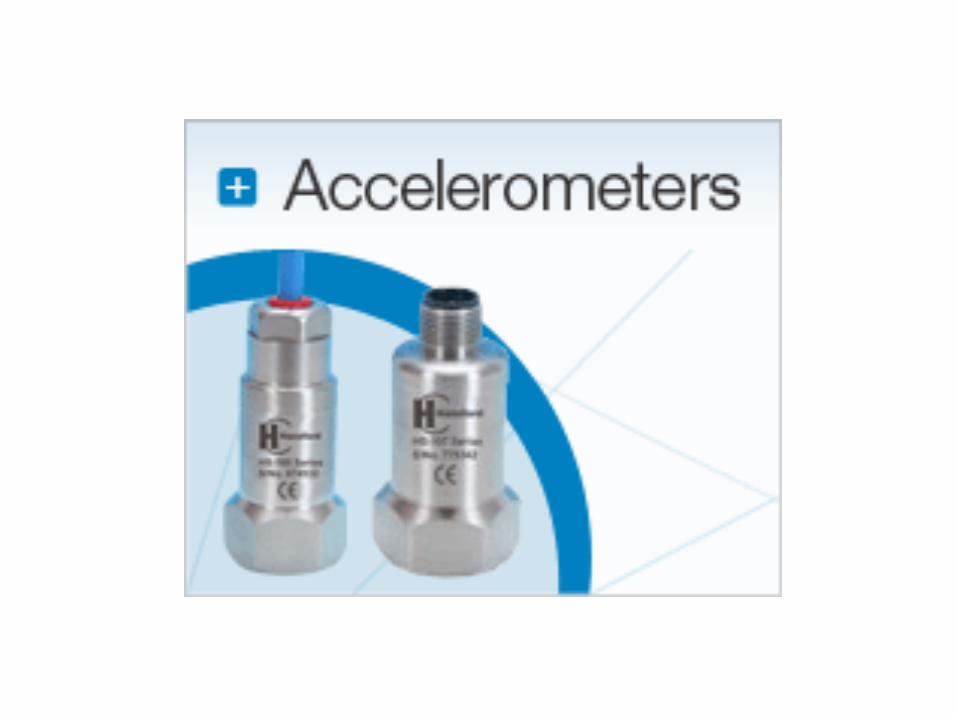
Accelerometers
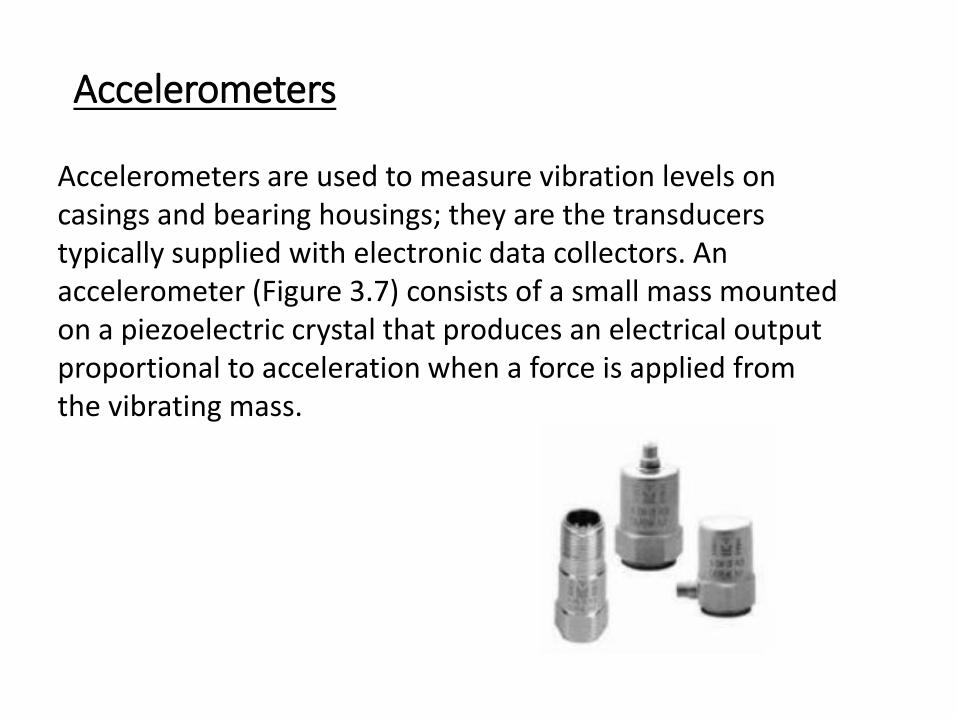
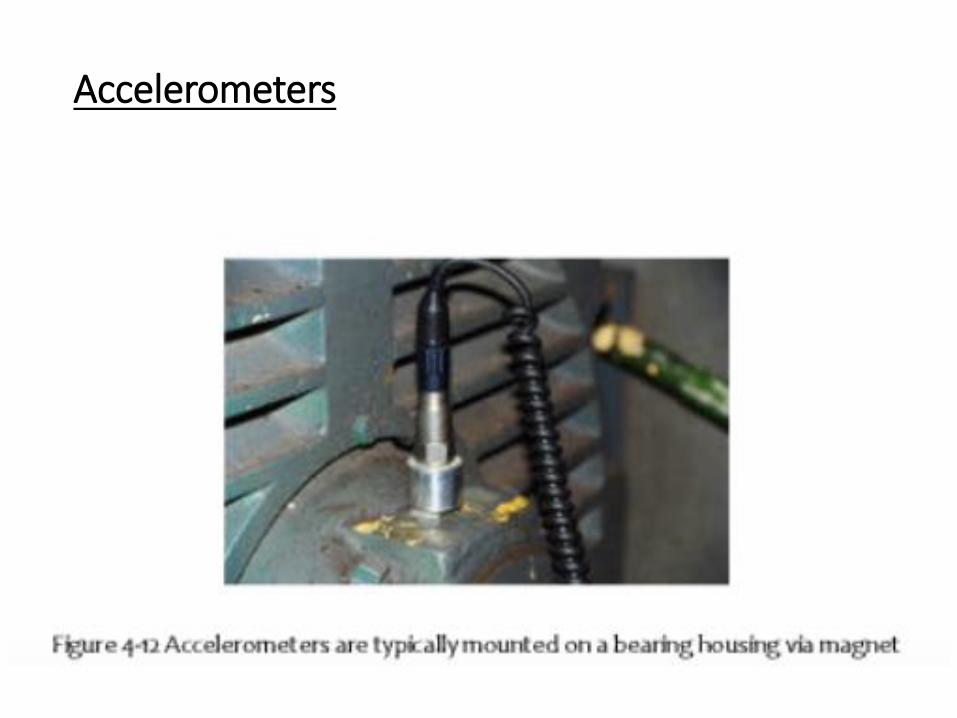
Accelerometers are used to measure vibration levels on casings and bearing housings; they are the transducers typically supplied with electronic data collectors. An accelerometer (Figure 3.7) consists of a small mass mounted on a piezoelectric crystal that produces an electrical output proportional to acceleration when a force is applied from the vibrating mass.
Accelerometers
Accelerometers
Accelerometers
The size of an accelerometer is proportional to its sensitivity. Small accelerometers (the size of a pencil eraser) have a sensitivity of 5 mv/g (1 g = 386.1 in./sec2) and a flat frequency response to 25 kHz. A 1,000 mv/g accelerometer, which is used for low-frequency measurement, may be as large as a velocity sensor; however, the limit of its usable frequency span may be to 1,000 Hz. The analyst should be aware of the properties of each accelerometer being used.
Accelerometers
Accelerometers
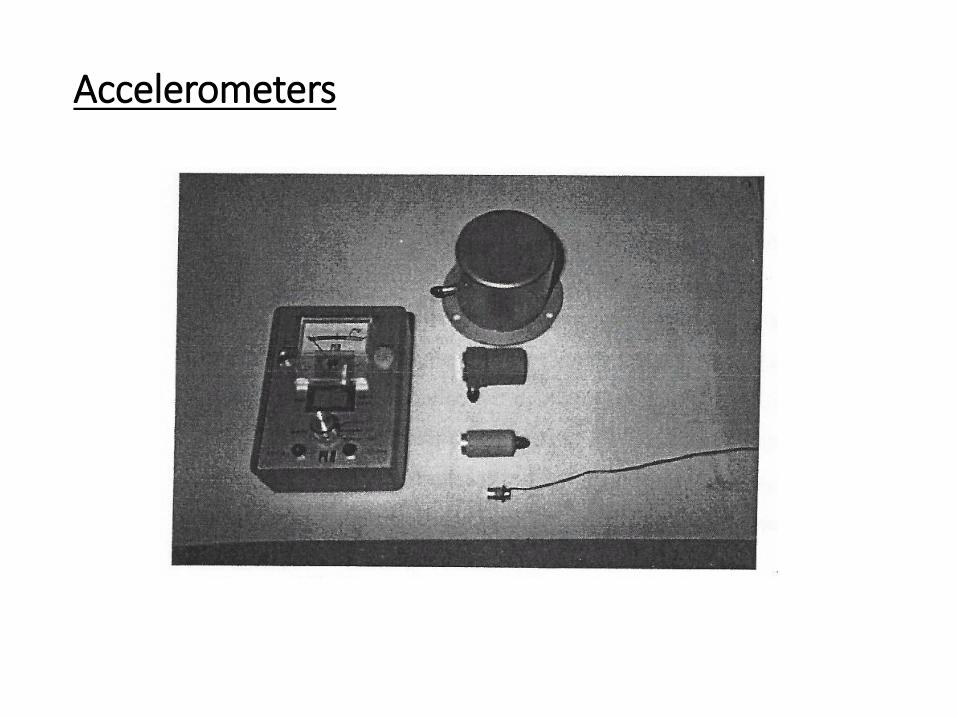
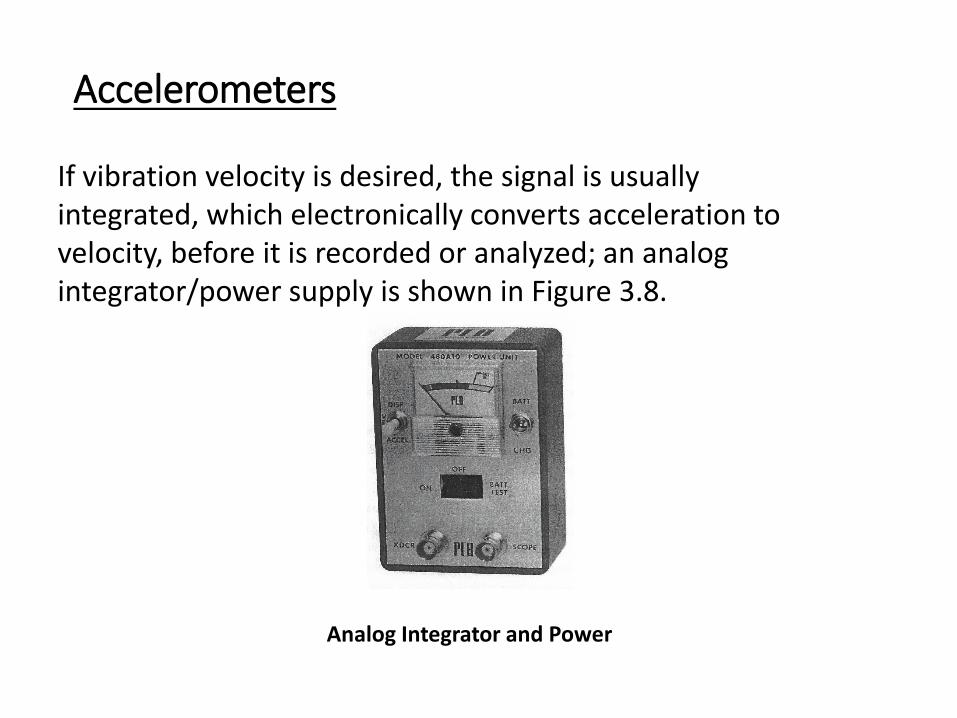
If vibration velocity is desired, the signal is usually integrated, which electronically converts acceleration to velocity, before it is recorded or analyzed; an analog integrator/power supply is shown in Figure 3.8.
Analog Integrator and Power
Accelerometers
Accelerometers are recommended for permanent seismic monitoring because of their extended life and because their cross sensitivity is low. (Cross sensitivity means that the transducer generates a signal in horizontal direction from vibration in the vertical direction.) However, cable noise, transmission distance, and temperature sensitivity of the accelerometer must be carefully evaluated. Excellent guidelines are available from vendors for accelerometer use.
Sensor Selection
Important considerations in sensor selection include frequency response, signal-to-noise ratio, size, thermal and amplitude sensitivity of the sensor, and the strength of the signal being measured. The frequency range of the sensor must be compatible with the frequencies generated by the mechanical components of the machine. Otherwise, another transducer must be selected and the signal converted to the proper measure. For example, if the velocity measure is desired at frequencies above 2,000 Hz, an accelerometer integrated to velocity should be selected to obtain the signal. If the time waveform of the velocity measure is desired, the signal must be acquired from a velocity pickup or analog integrated signal from an accelerometer, either within or external to the data collector.
Sensor Selection
The cable that transmits the signal to the data collector can cause erroneous readings. Many standard cables are specially wound cords that are more convenient than the standard coaxial construction. But, because many conductors are flexible at the core, individual strands may fail at stress points as a result of handling or packing in a carrying case. In addition, the terminals must be handled carefully.
Simple Harmonic Motion
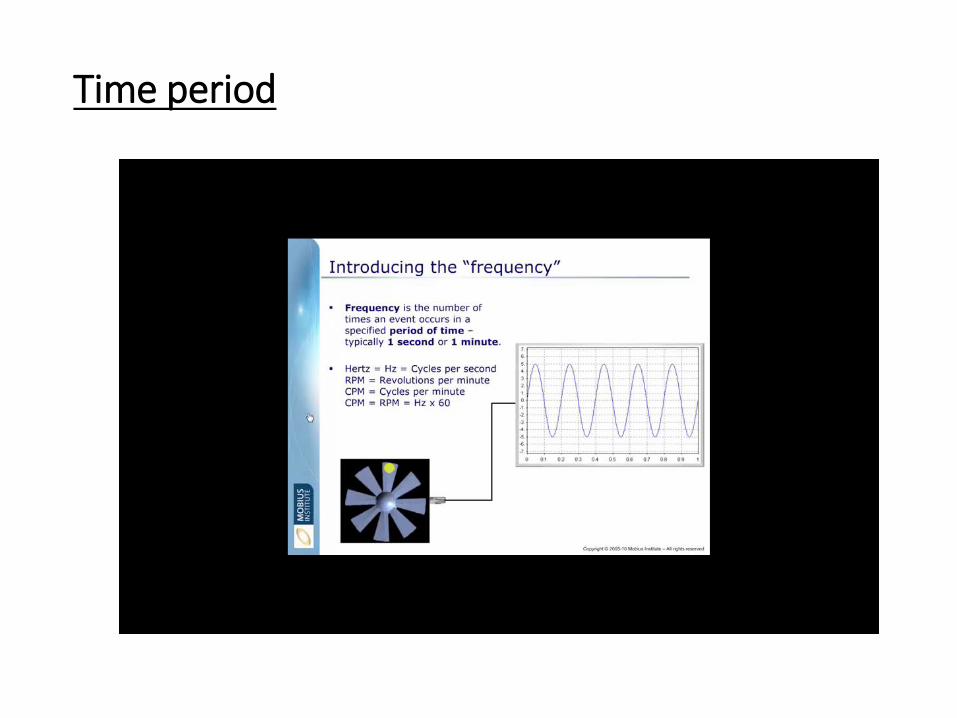
Time period
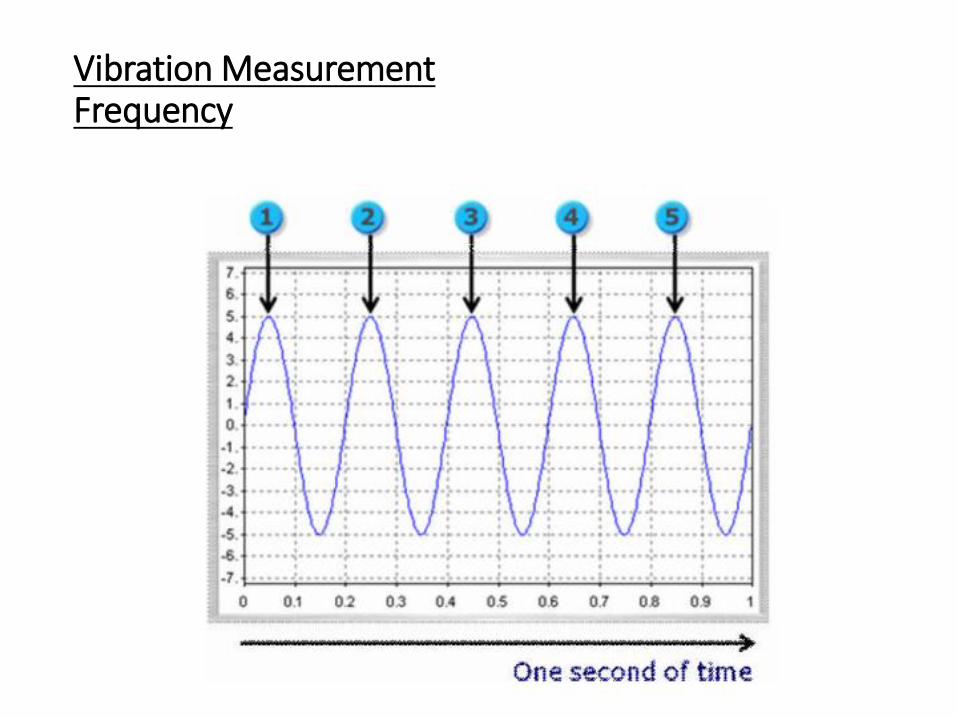
Vibration MeasurementFrequency
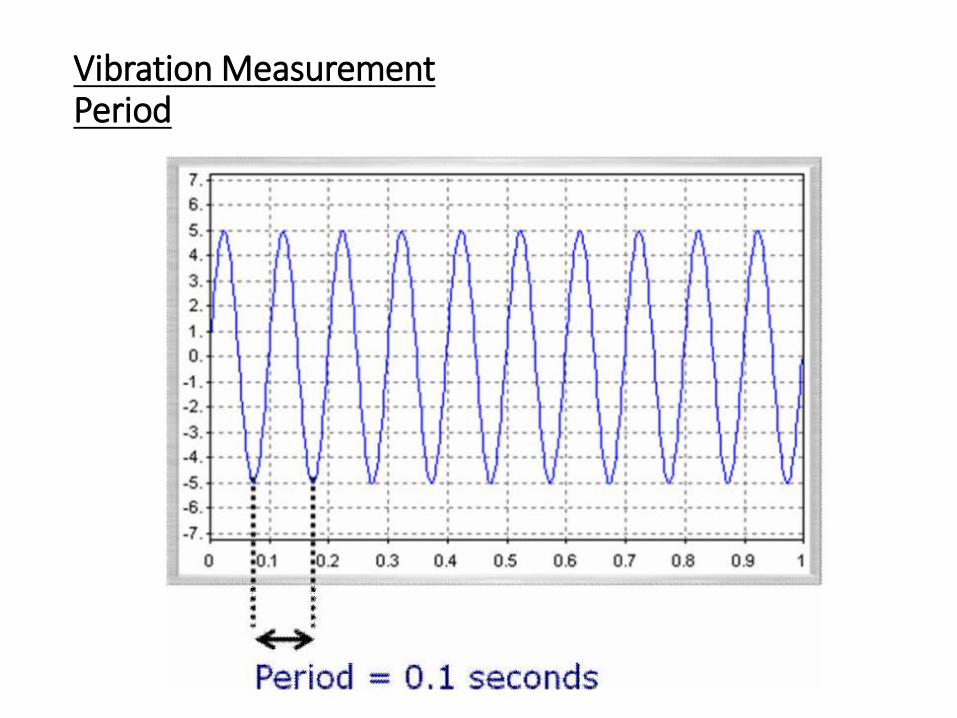
Vibration MeasurementPeriod
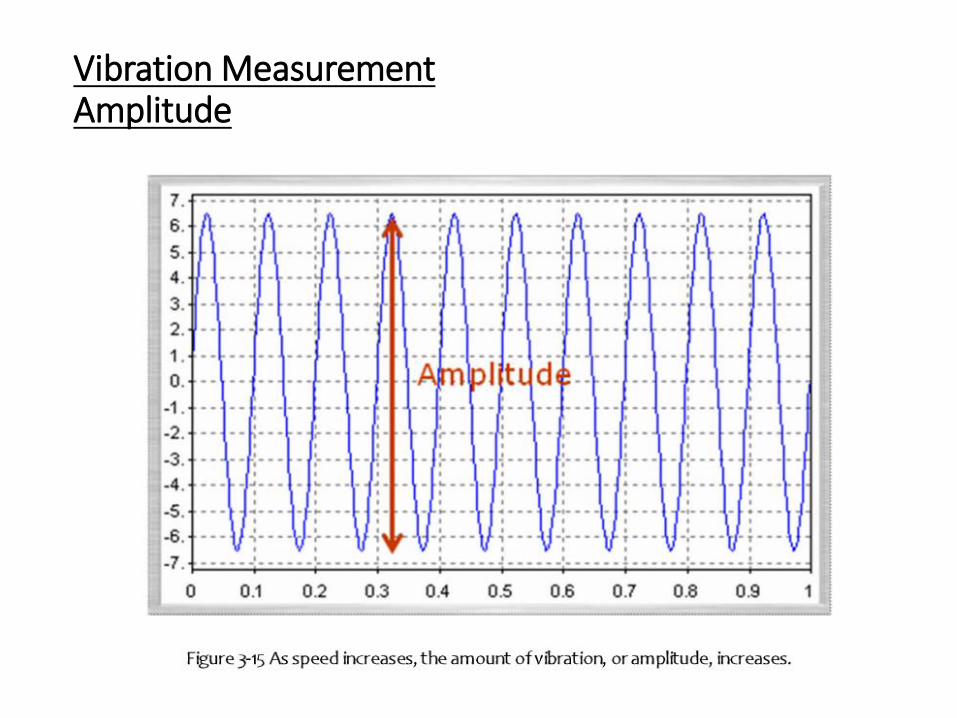
Vibration MeasurementAmplitude
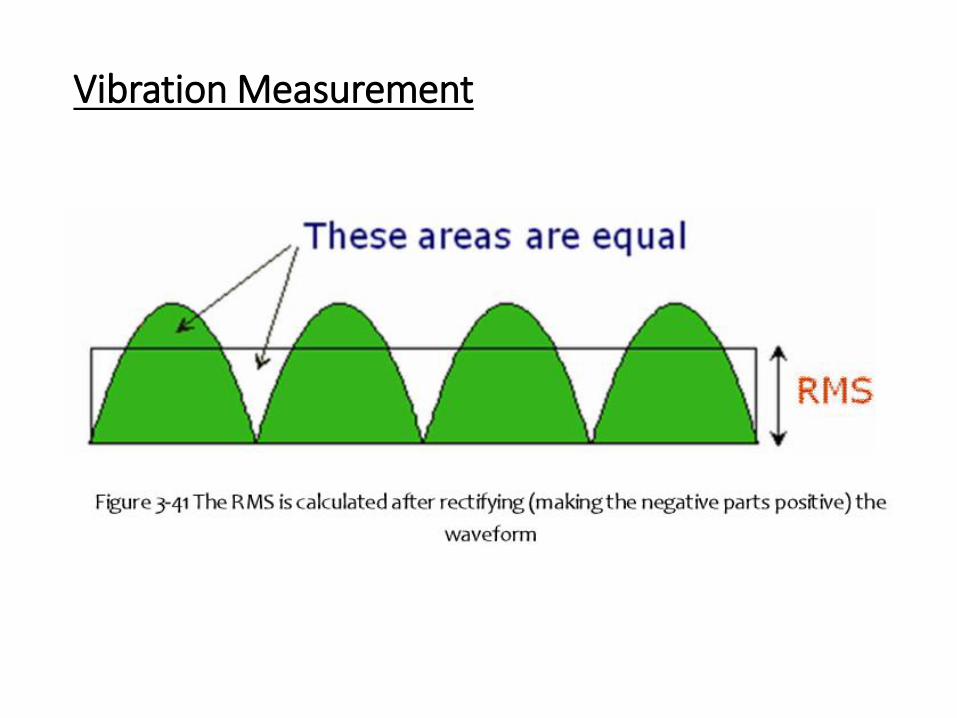
Vibration Measurement
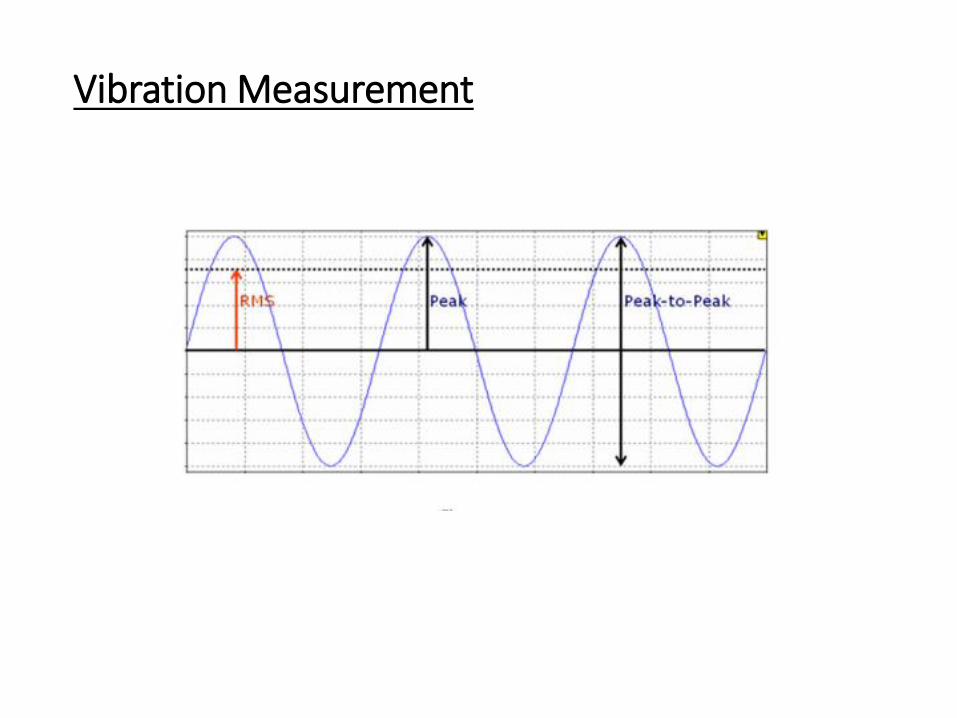
Vibration Measurement
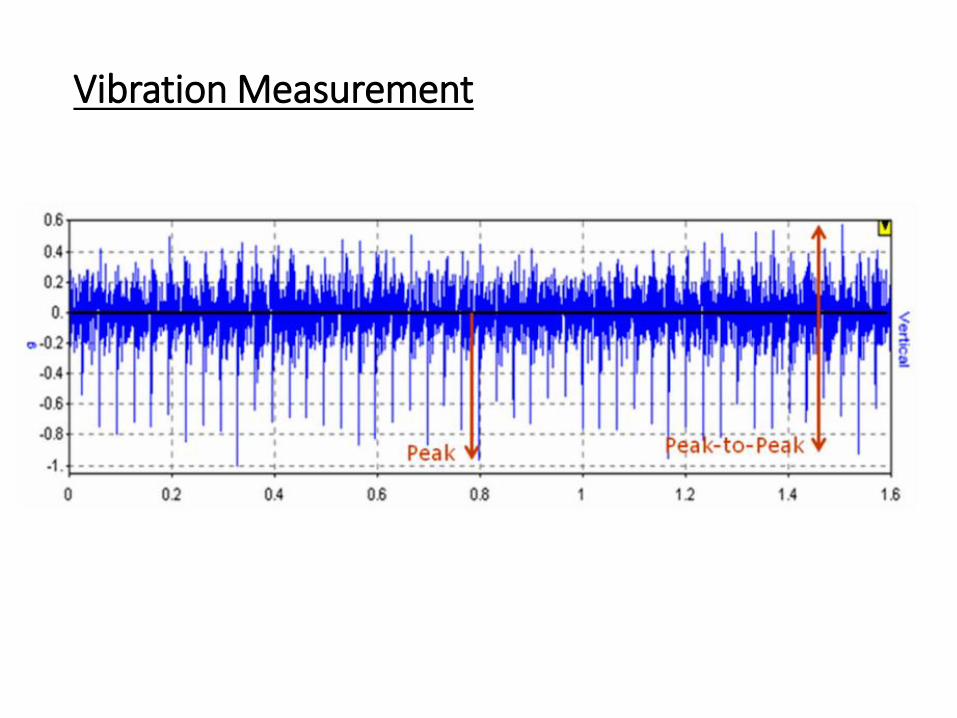
Vibration Measurement
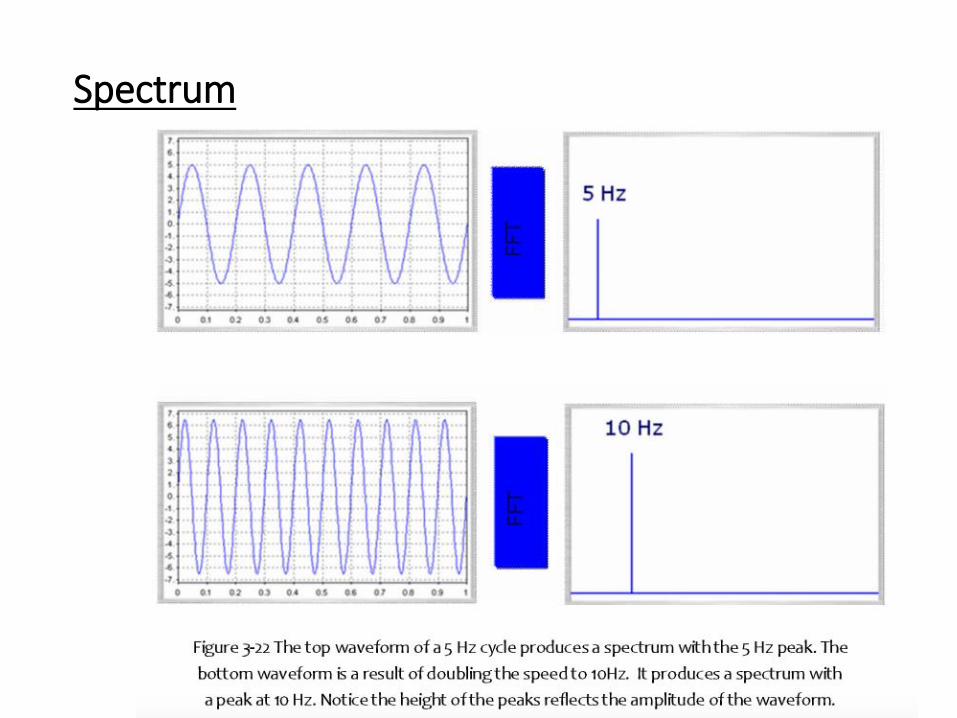
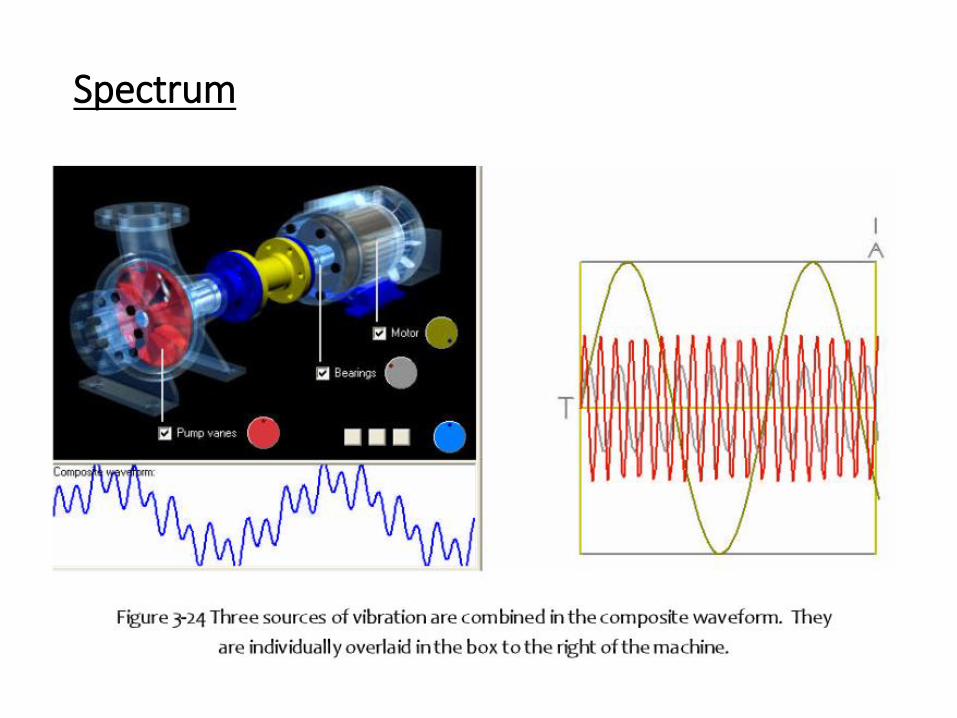
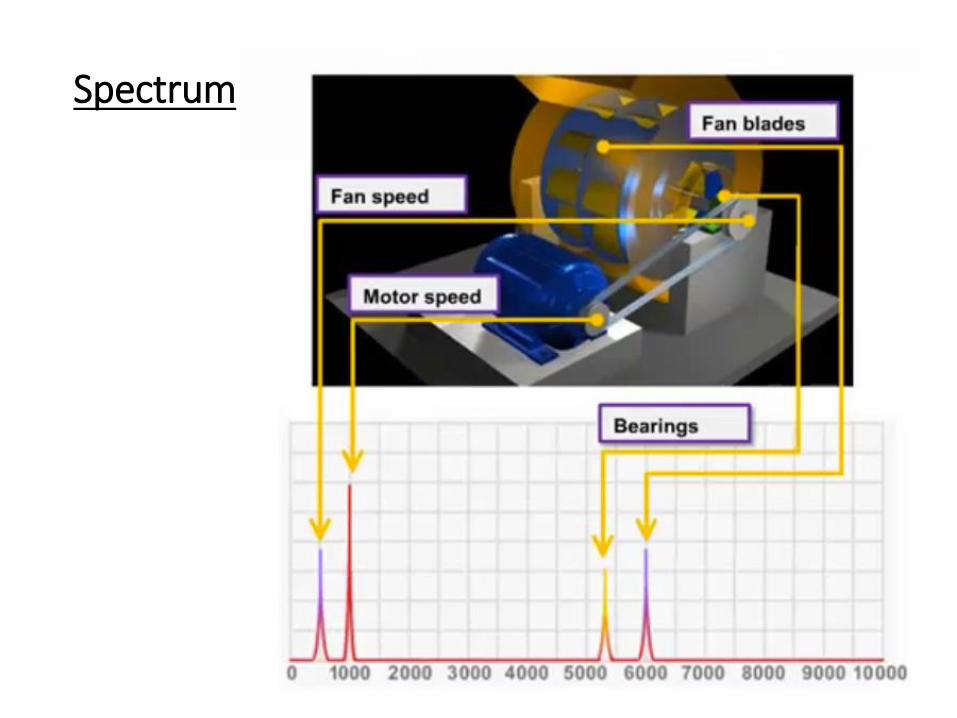
Spectrum
Vibration Measurement
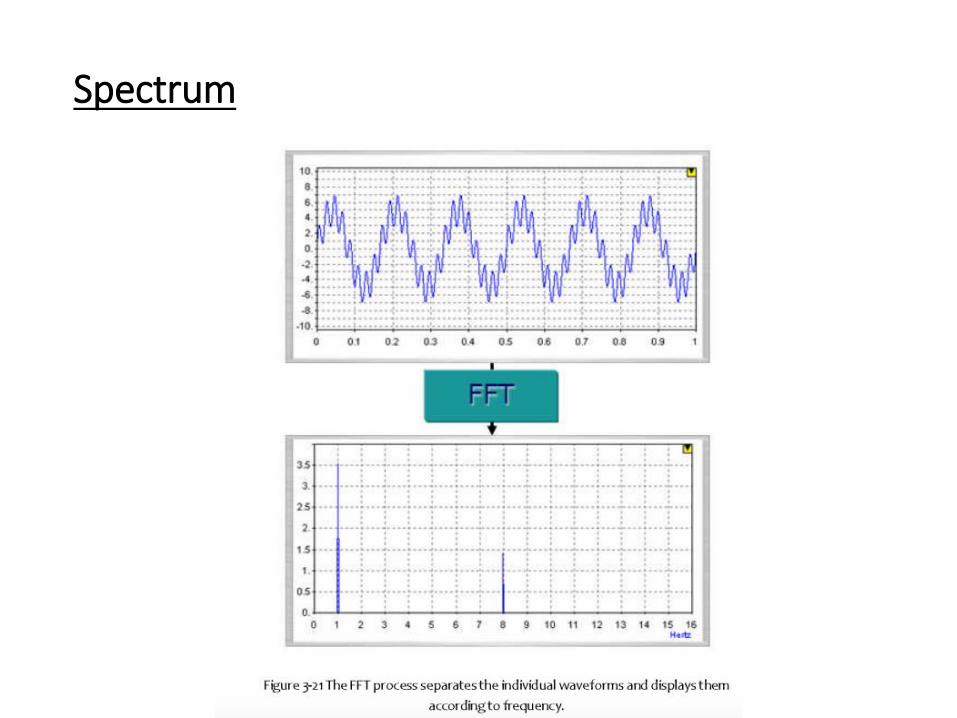
Spectrum
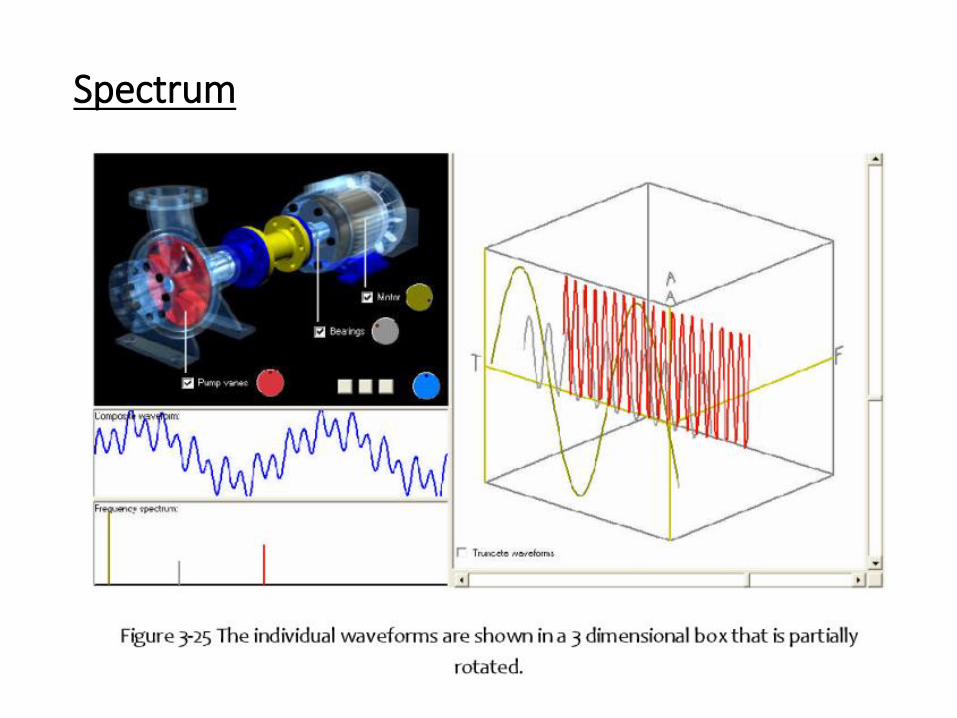
Spectrum
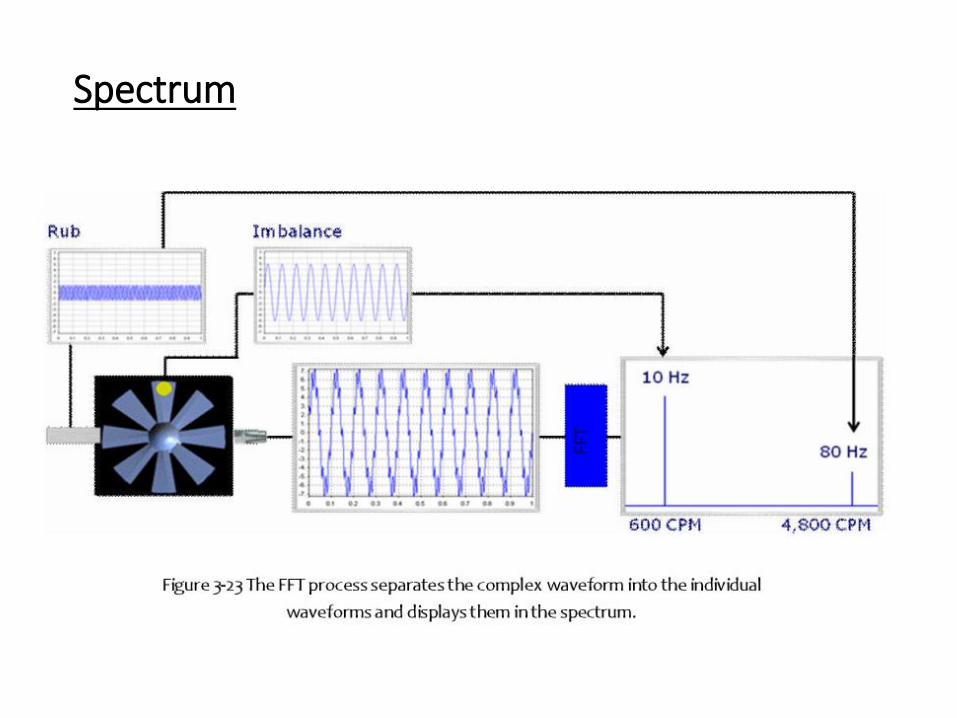
Spectrum

Spectrum
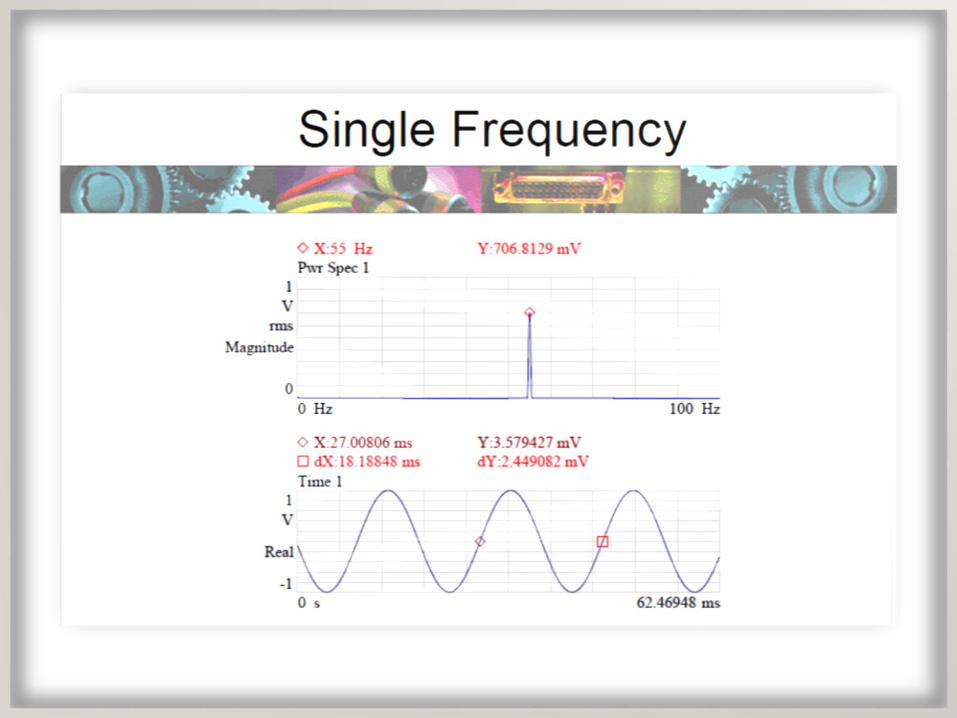
Spectrum
Spectrum
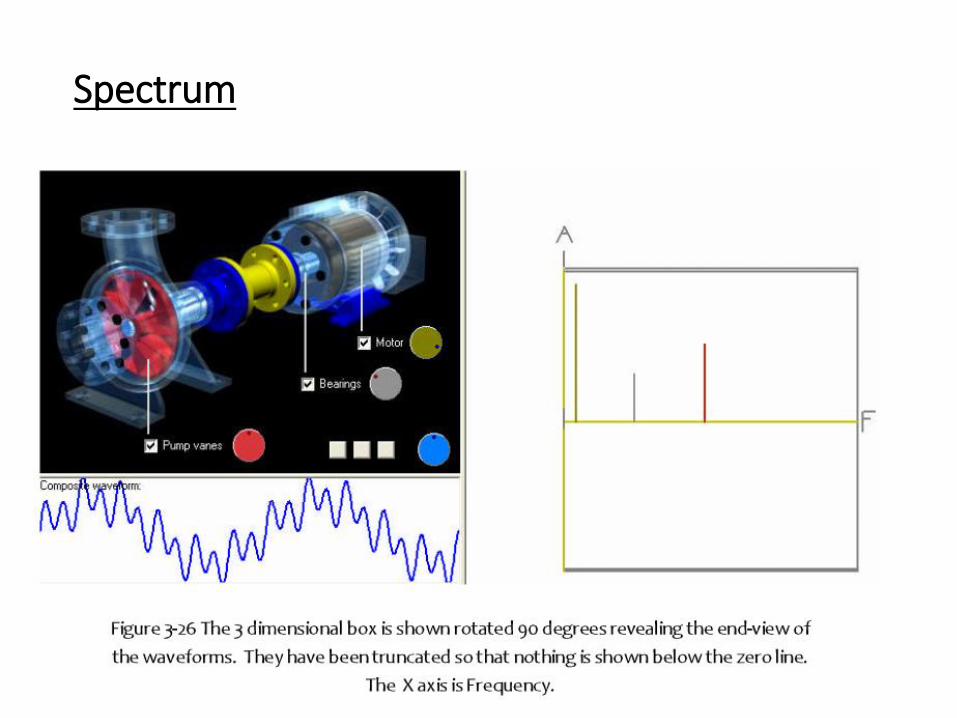
Spectrum
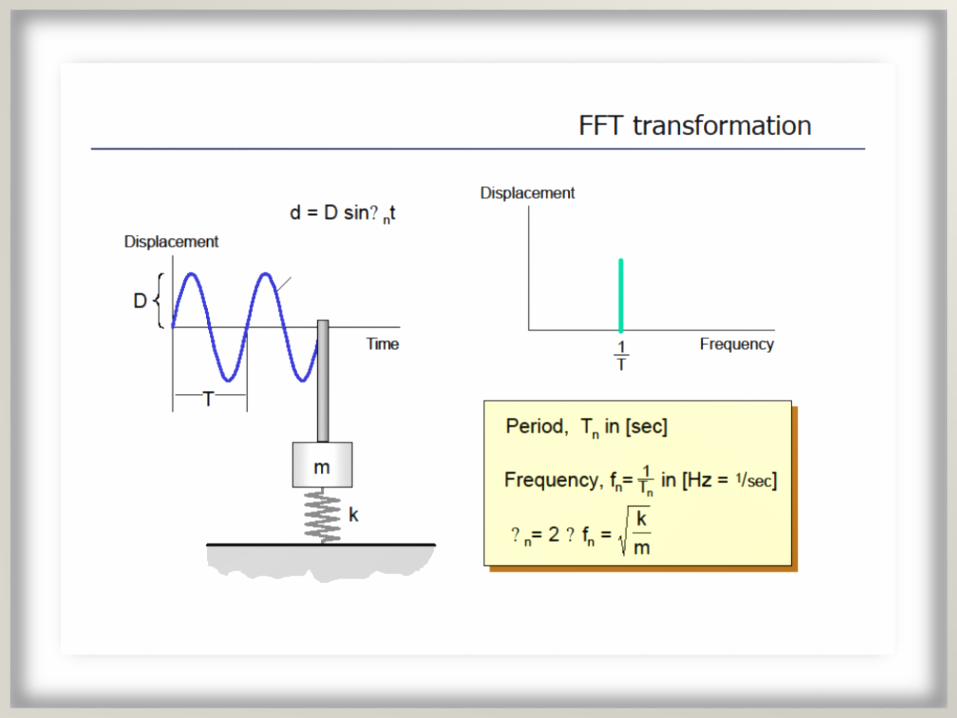
Spectrum
Spectrum
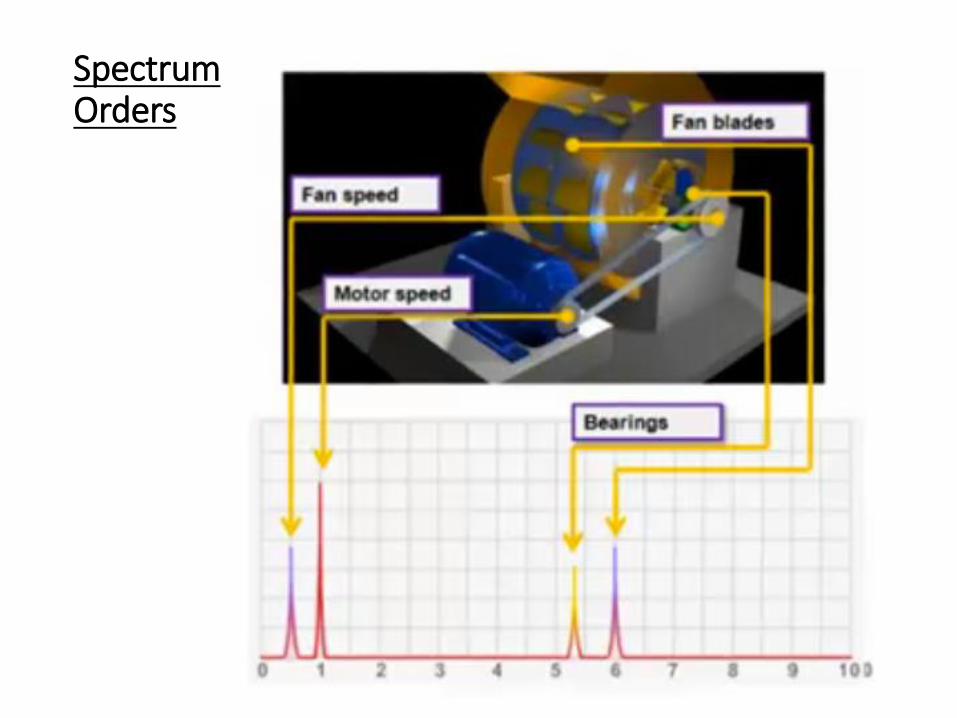
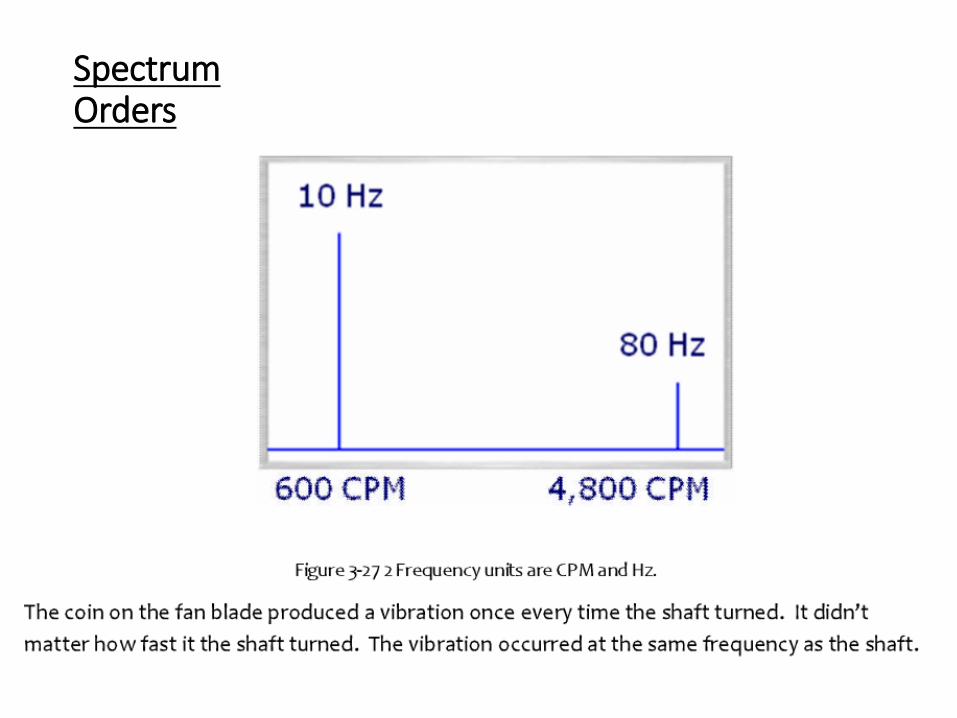
SpectrumOrders
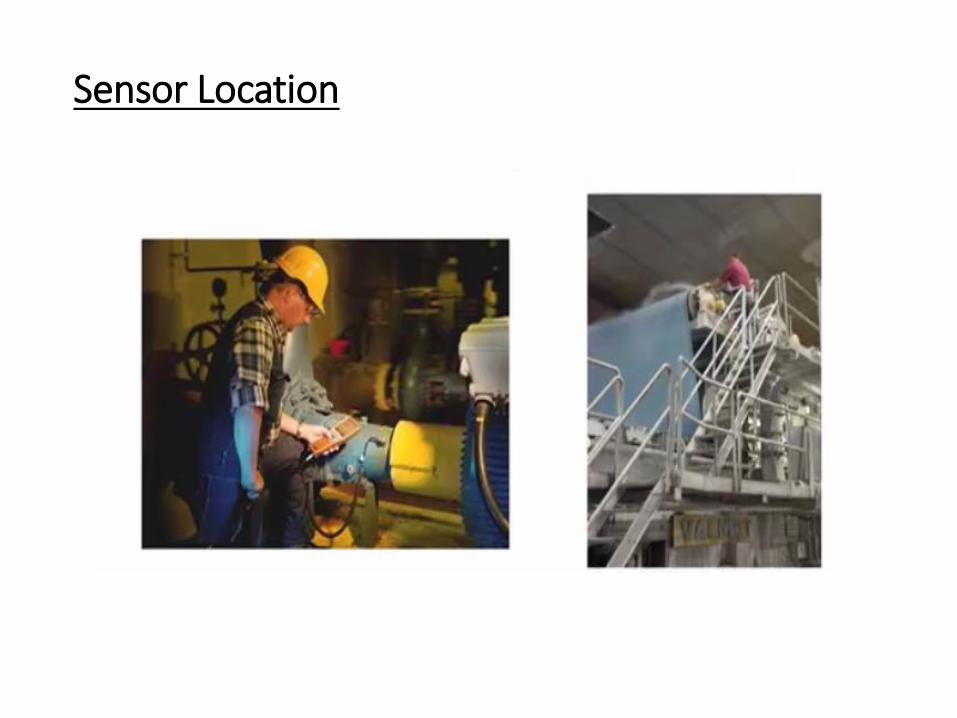
Sensor Location
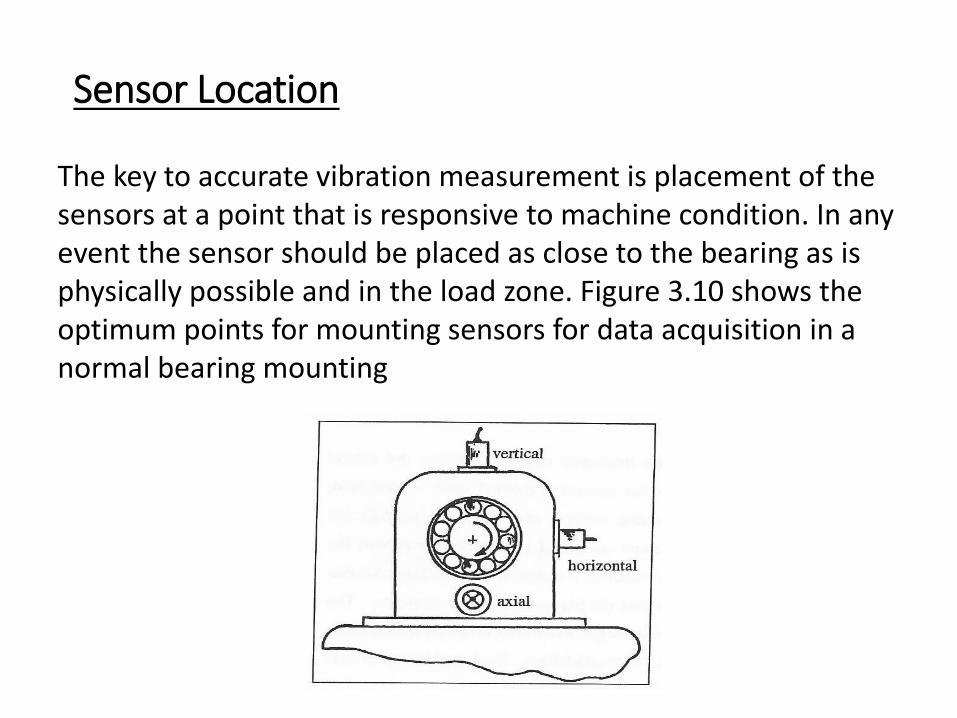
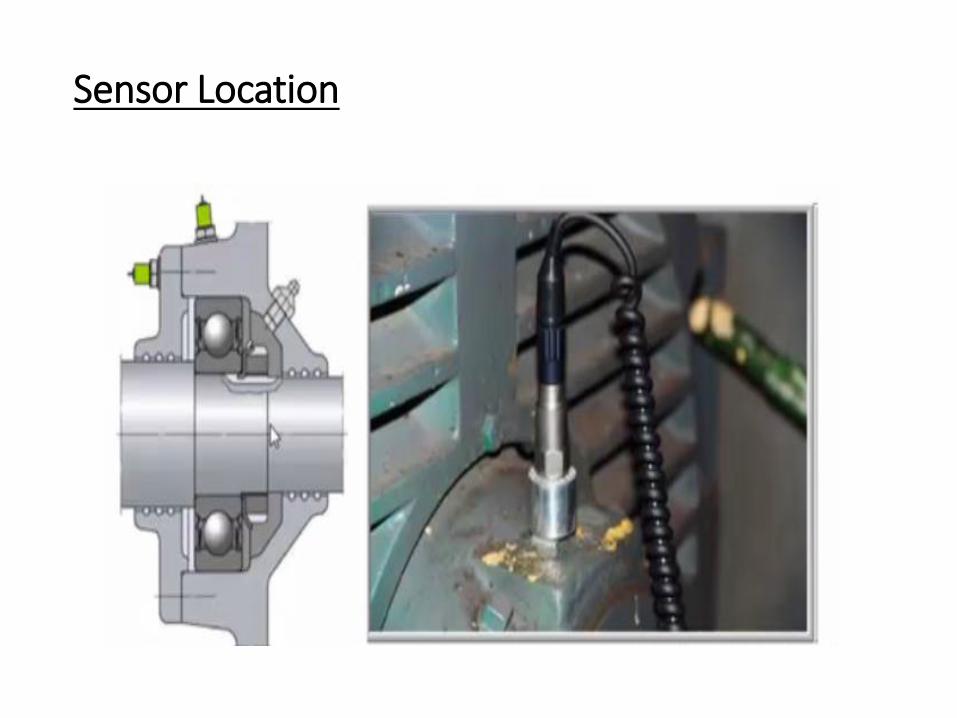
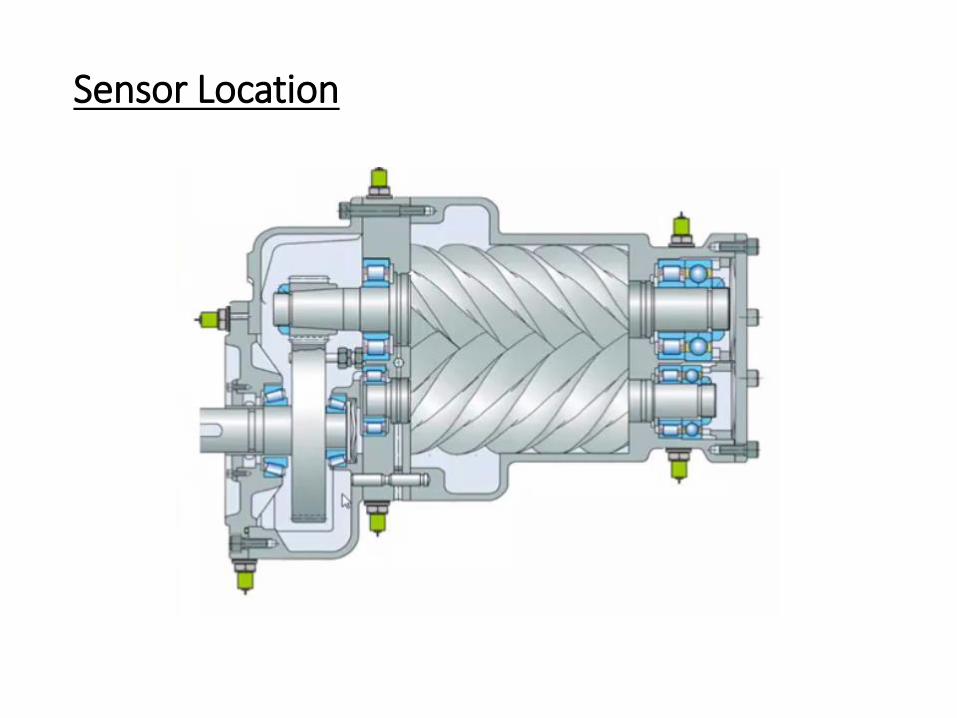
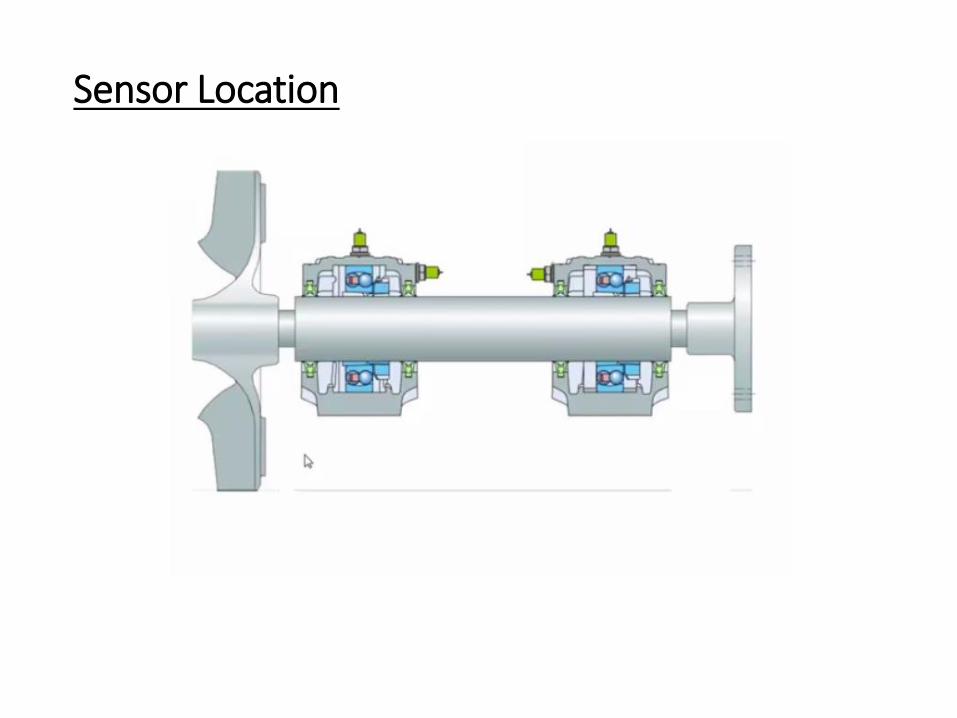
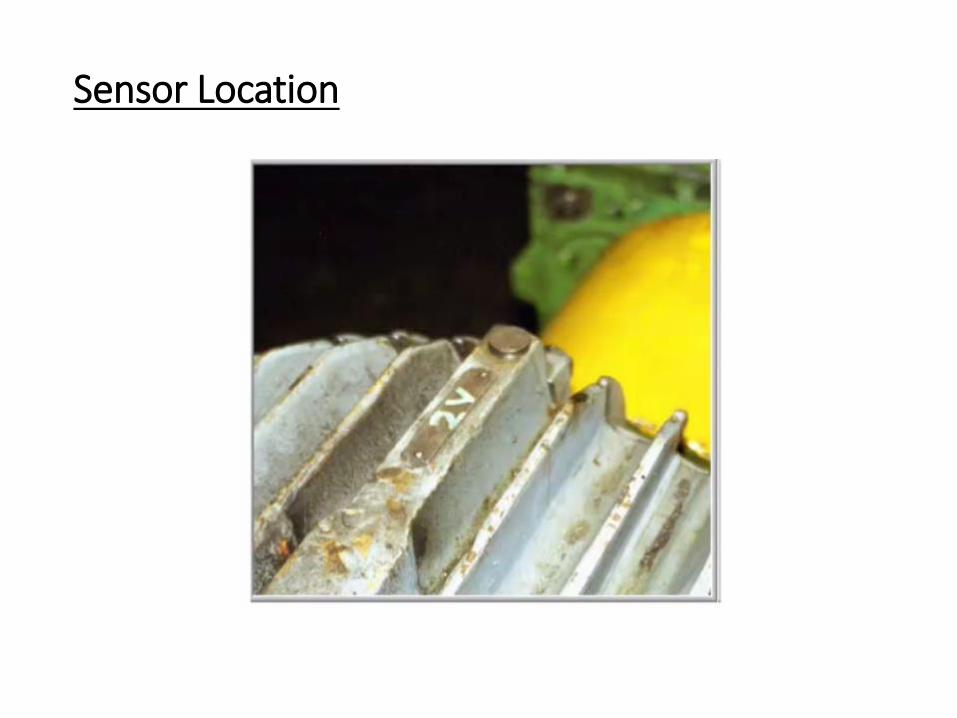
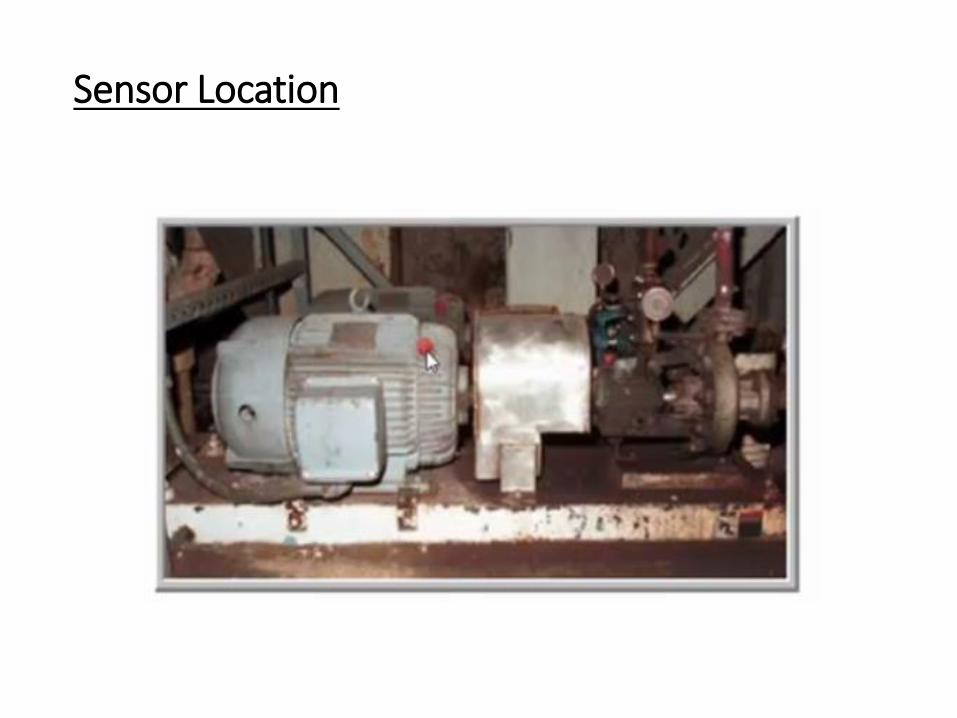
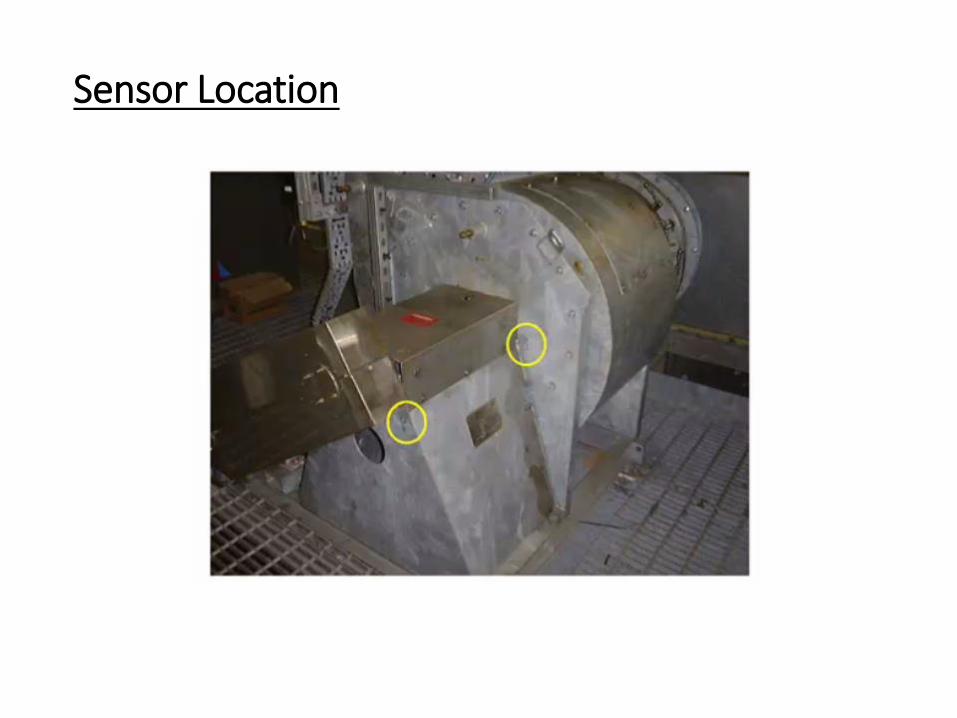
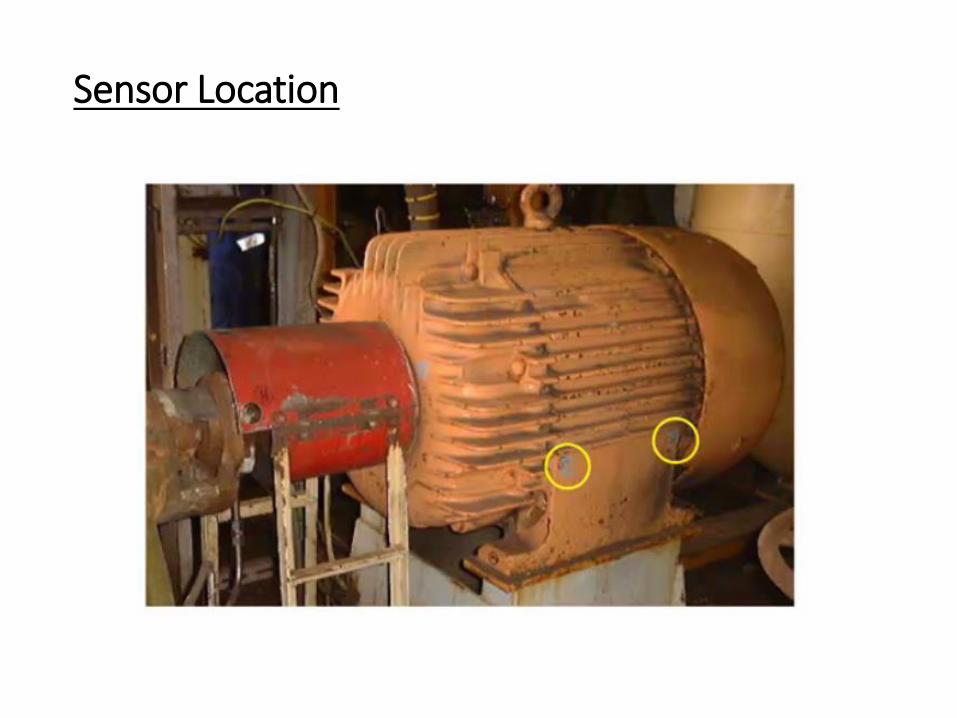
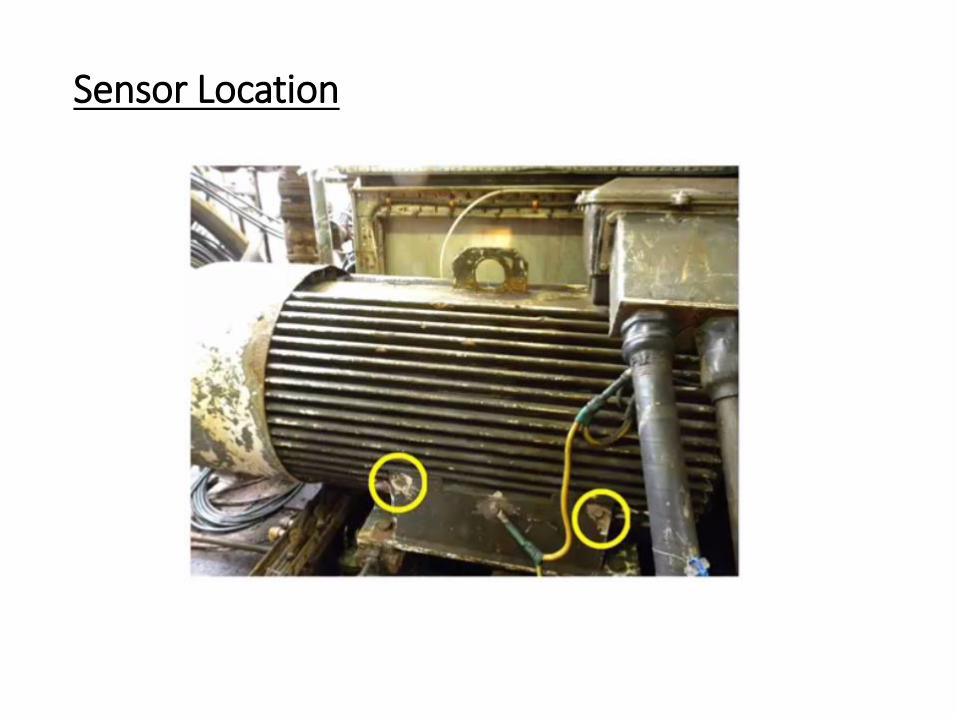
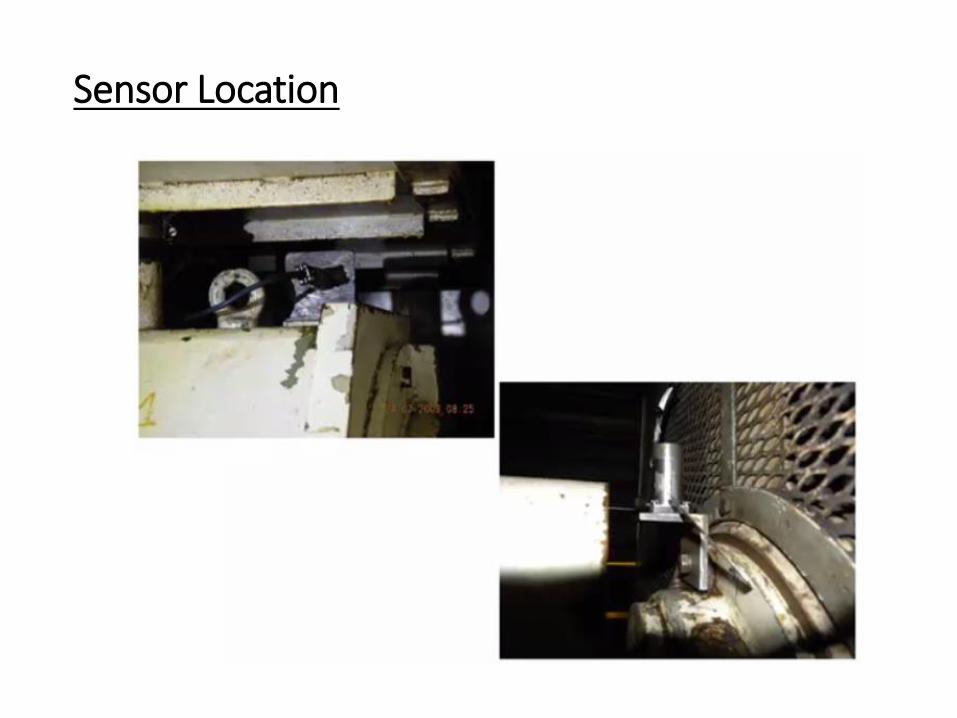
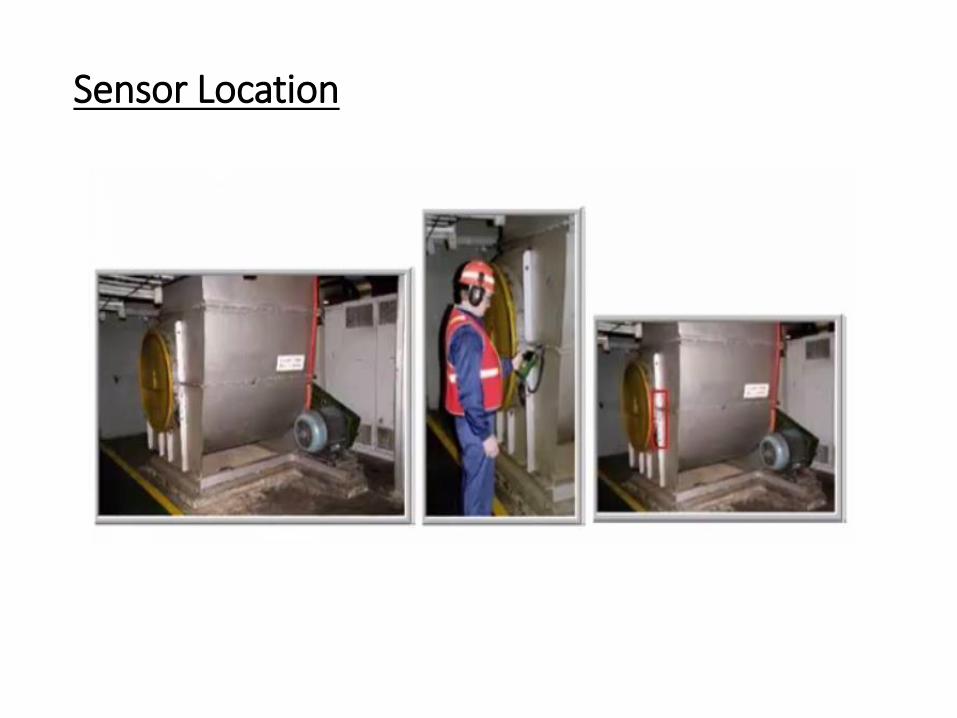
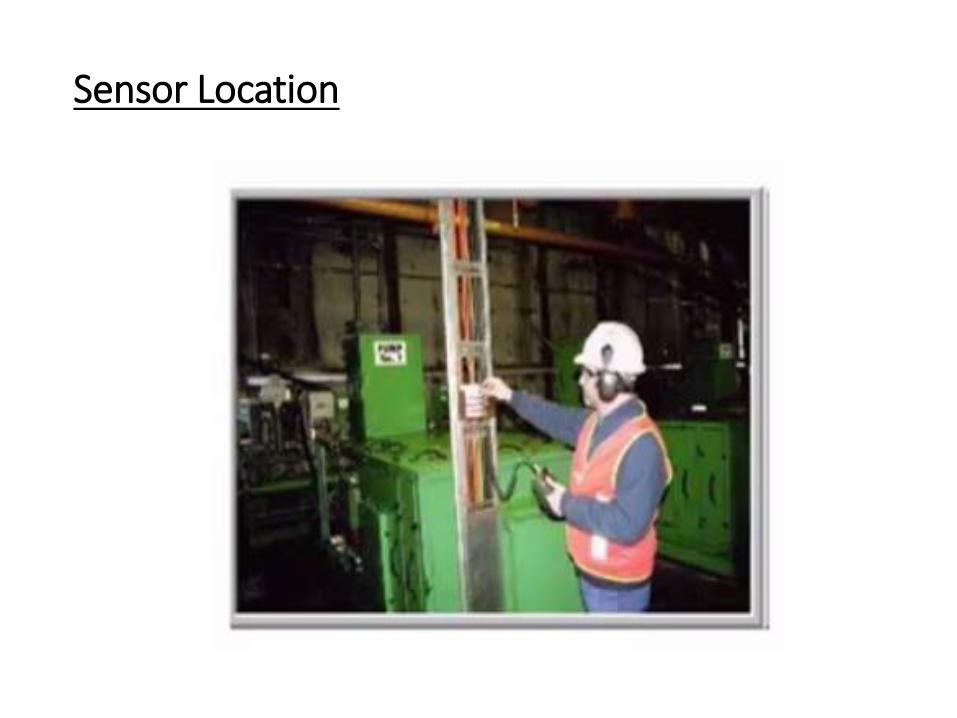
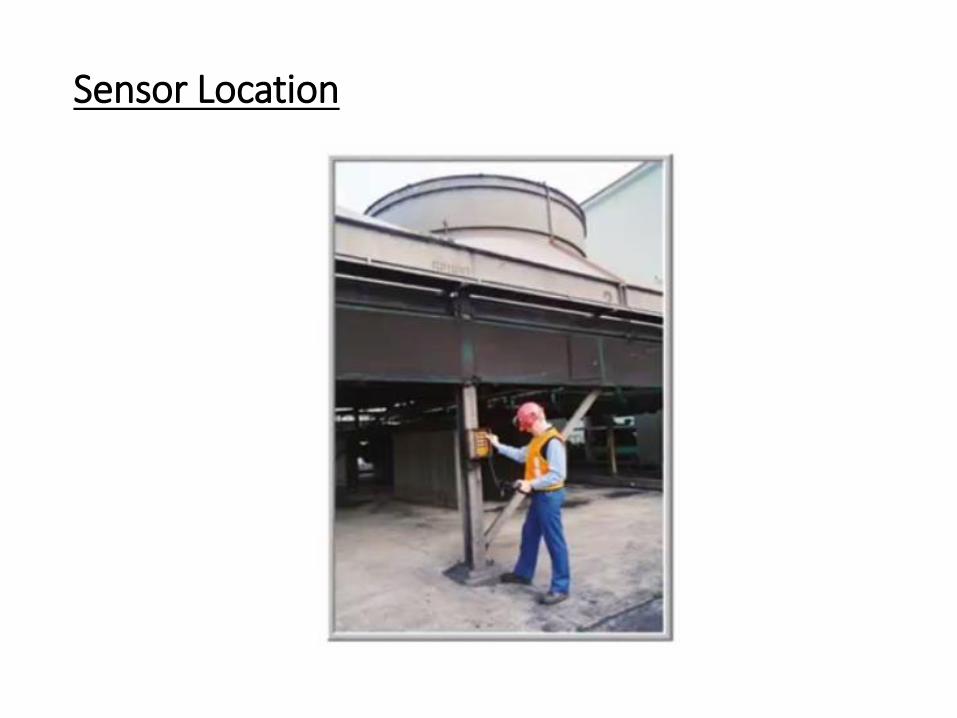
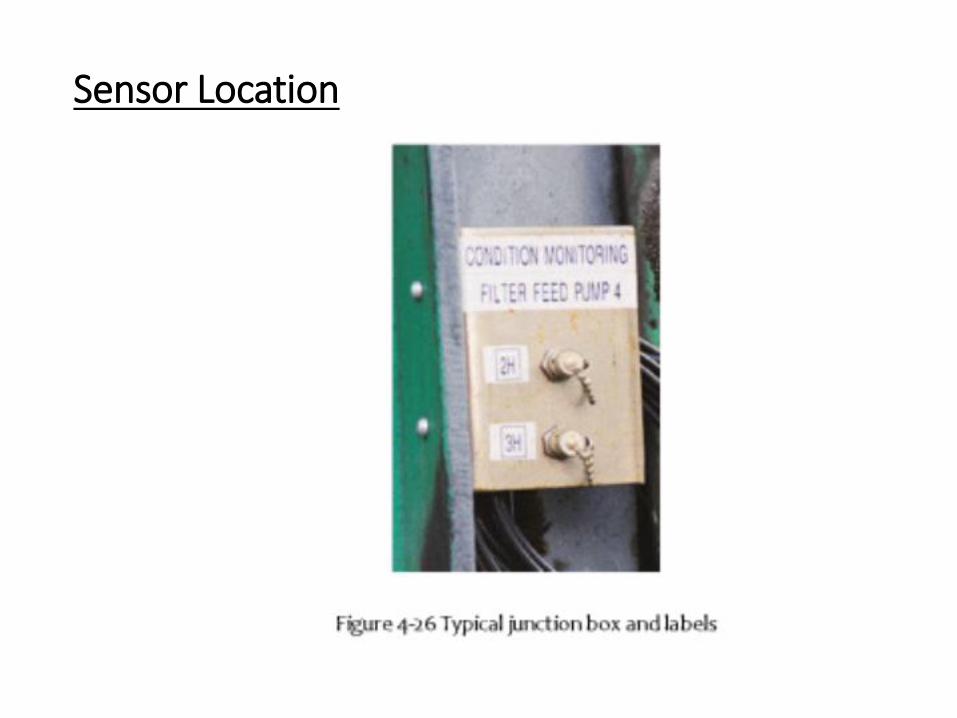
The key to accurate vibration measurement is placement of the sensors at a point that is responsive to machine condition. In any event the sensor should be placed as close to the bearing as is physically possible and in the load zone. Figure 3.10 shows the optimum points for mounting sensors for data acquisition in a normal bearing mounting
Sensor Location
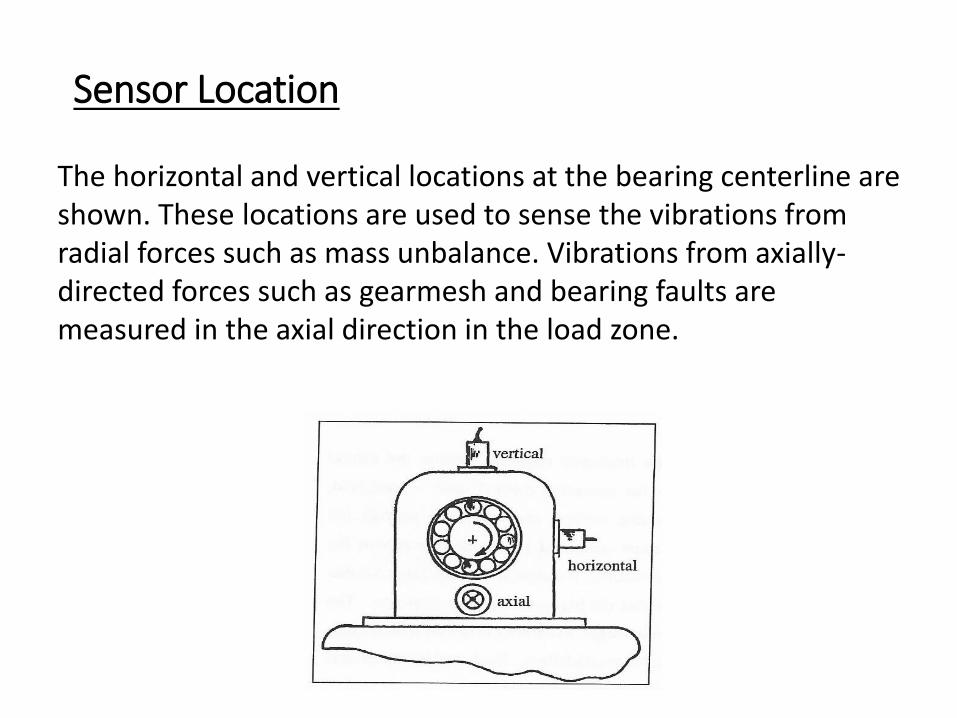
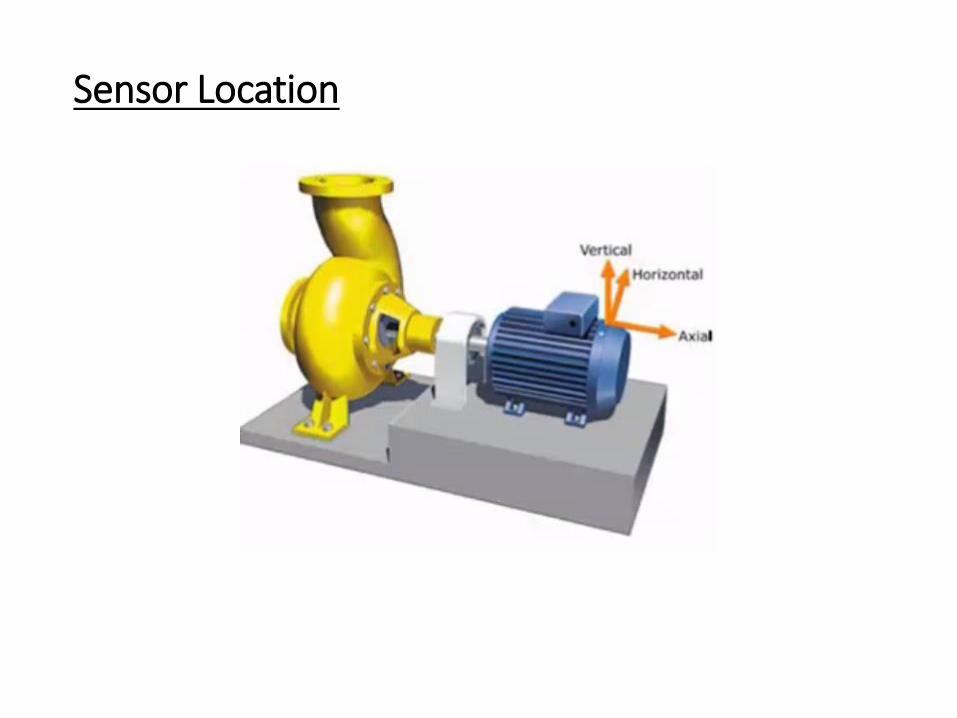
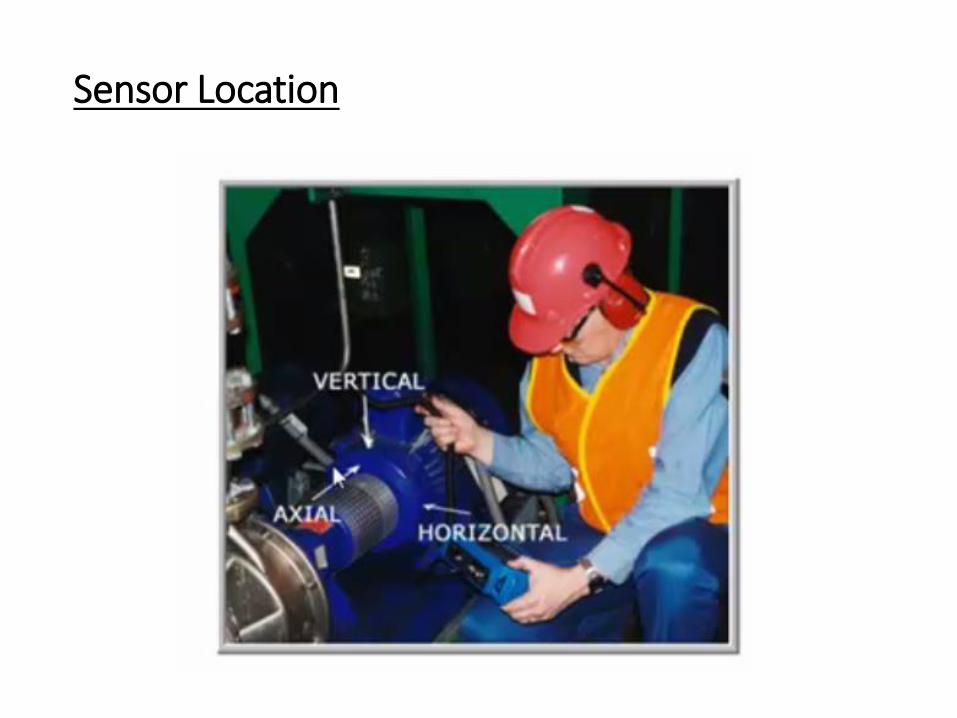
The horizontal and vertical locations at the bearing centerline are shown. These locations are used to sense the vibrations from radial forces such as mass unbalance. Vibrations from axially-directed forces such as gearmesh and bearing faults are measured in the axial direction in the load zone.
Sensor Location
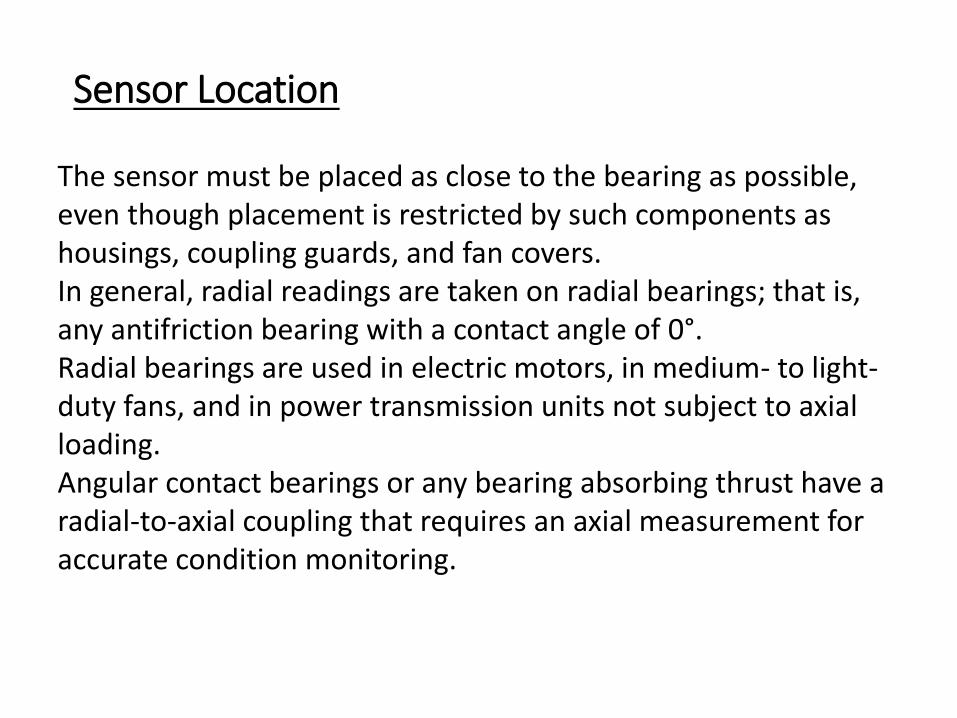
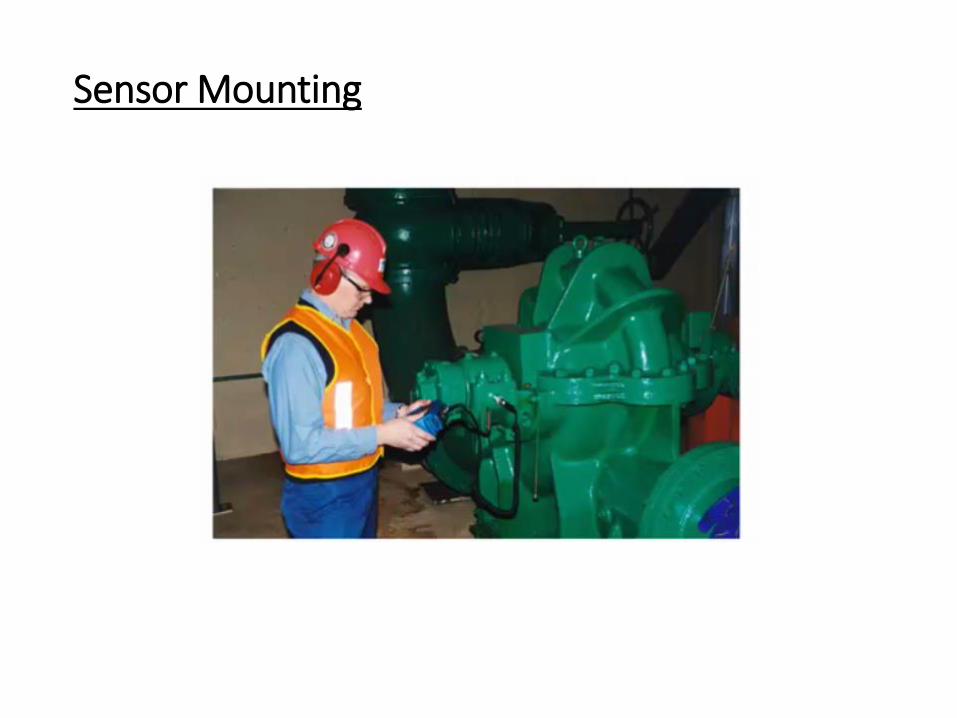
The sensor must be placed as close to the bearing as possible, even though placement is restricted by such components as housings, coupling guards, and fan covers.In general, radial readings are taken on radial bearings; that is, any antifriction bearing with a contact angle of 0°. Radial bearings are used in electric motors, in medium- to light-duty fans, and in power transmission units not subject to axial loading. Angular contact bearings or any bearing absorbing thrust have a radial-to-axial coupling that requires an axial measurement for accurate condition monitoring.
Sensor Location
Sensor Location
Sensor Location
Sensor Location
Sensor Location
Sensor Location
Sensor Location
Sensor Location
Sensor Location
Sensor Location
Sensor Location
Sensor Location
Sensor Location
Sensor Location
Sensor Location
Sensor Location
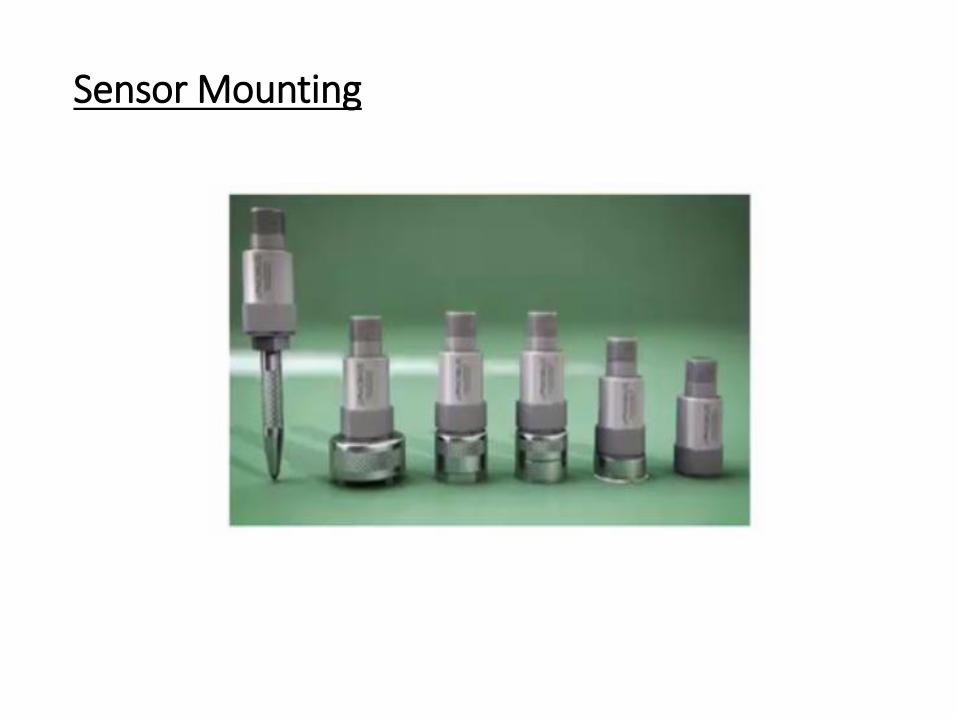
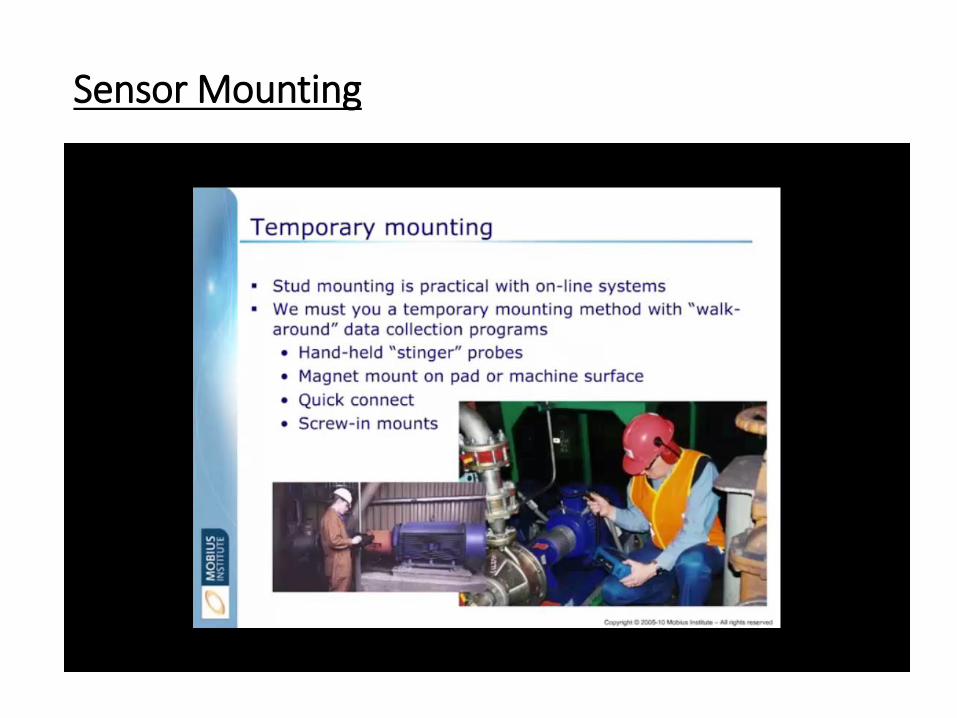
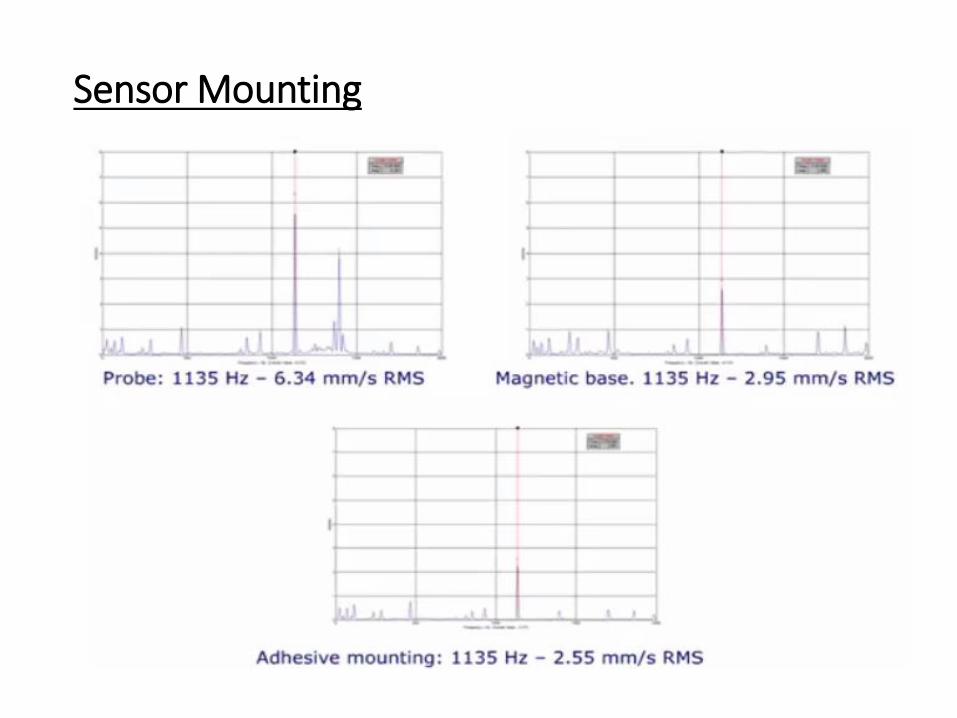
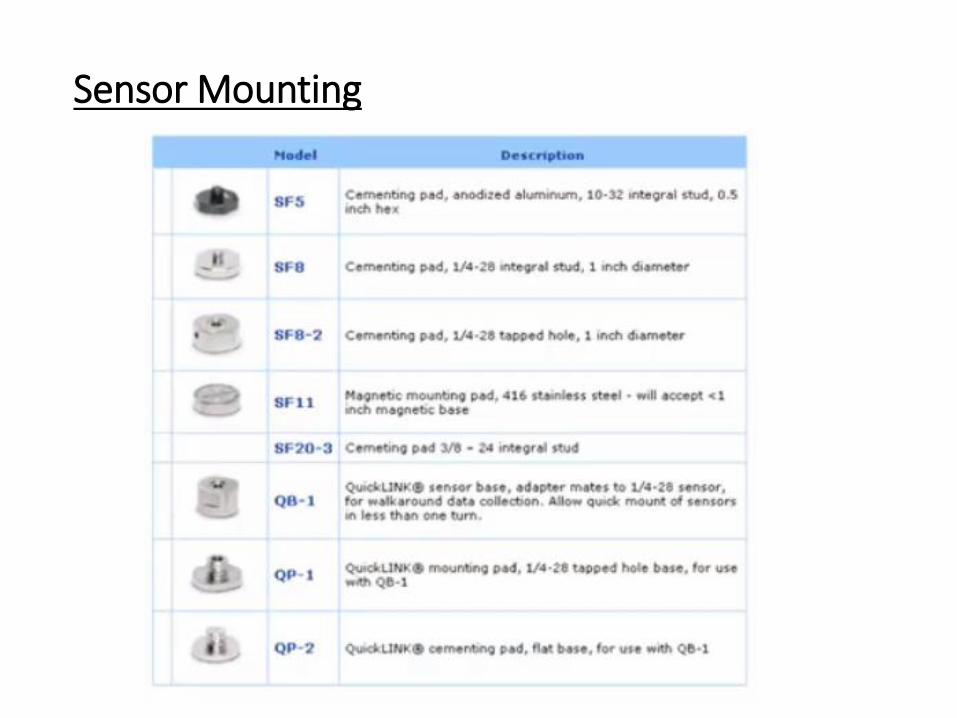
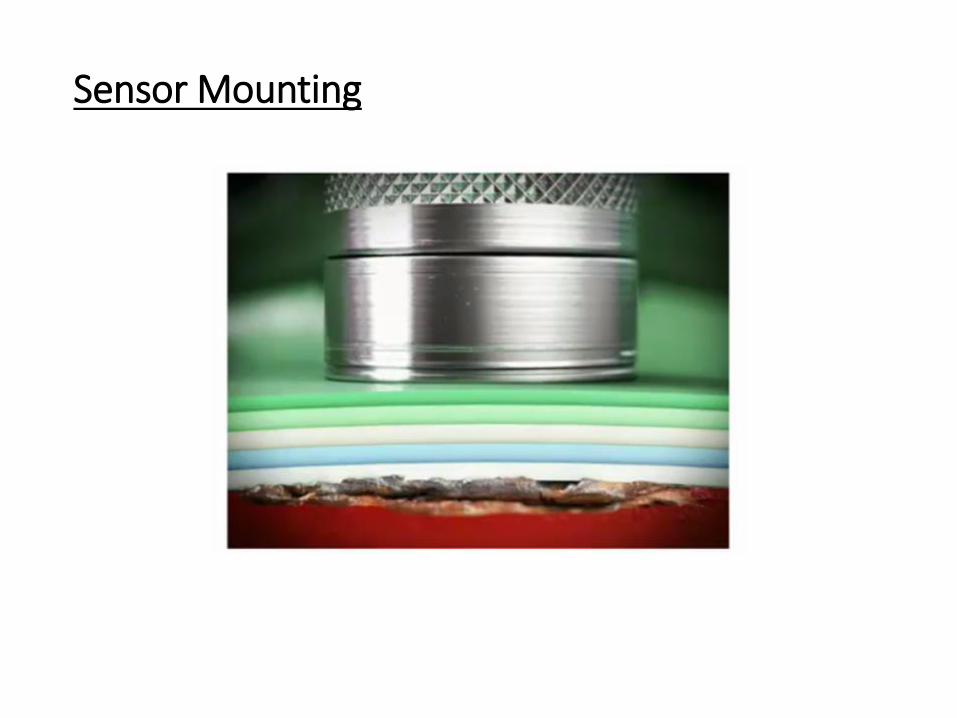
Sensor Mounting
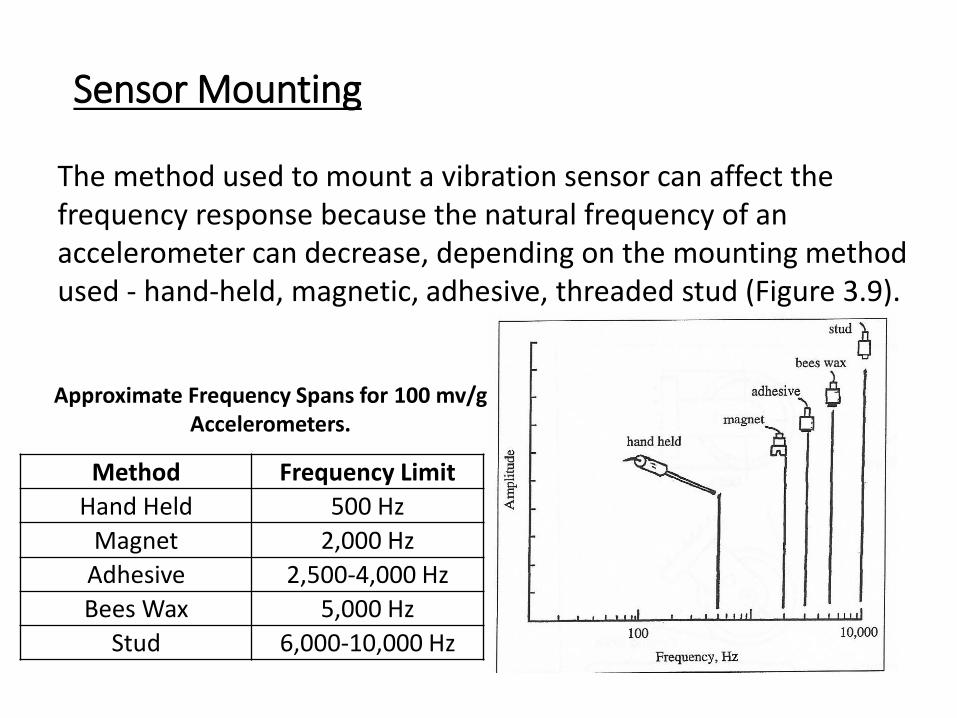
The method used to mount a vibration sensor can affect the frequency response because the natural frequency of an accelerometer can decrease, depending on the mounting method used - hand-held, magnetic, adhesive, threaded stud (Figure 3.9).
Method Frequency Limit
Hand Held 500 Hz
Magnet 2,000 Hz
Adhesive 2,500-4,000 Hz
Bees Wax 5,000 Hz
Stud 6,000-10,000 Hz
Approximate Frequency Spans for 100 mv/g Accelerometers.
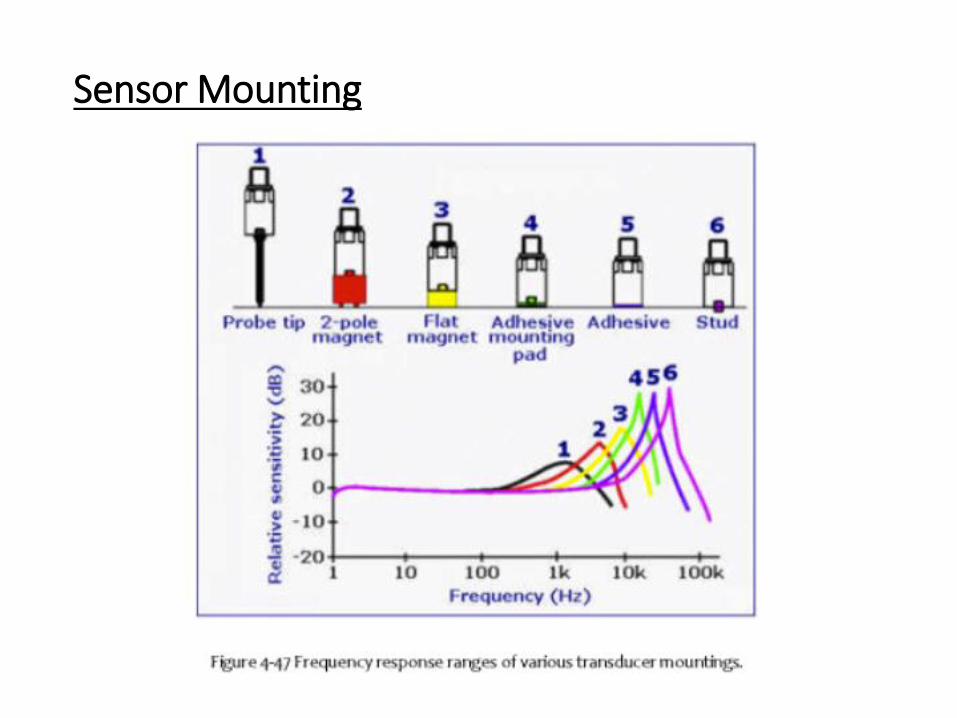
Sensor Mounting
Sensor Mounting
Sensor Mounting
Sensor Mounting
Sensor Mounting
Sensor Mounting
Sensor Mounting
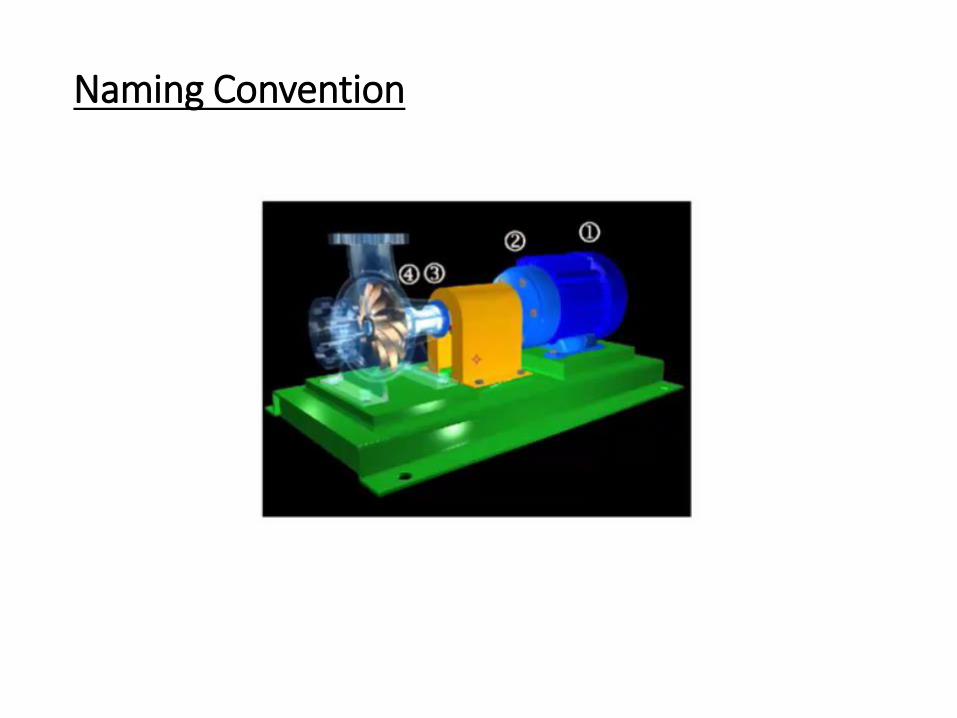
Naming Convention
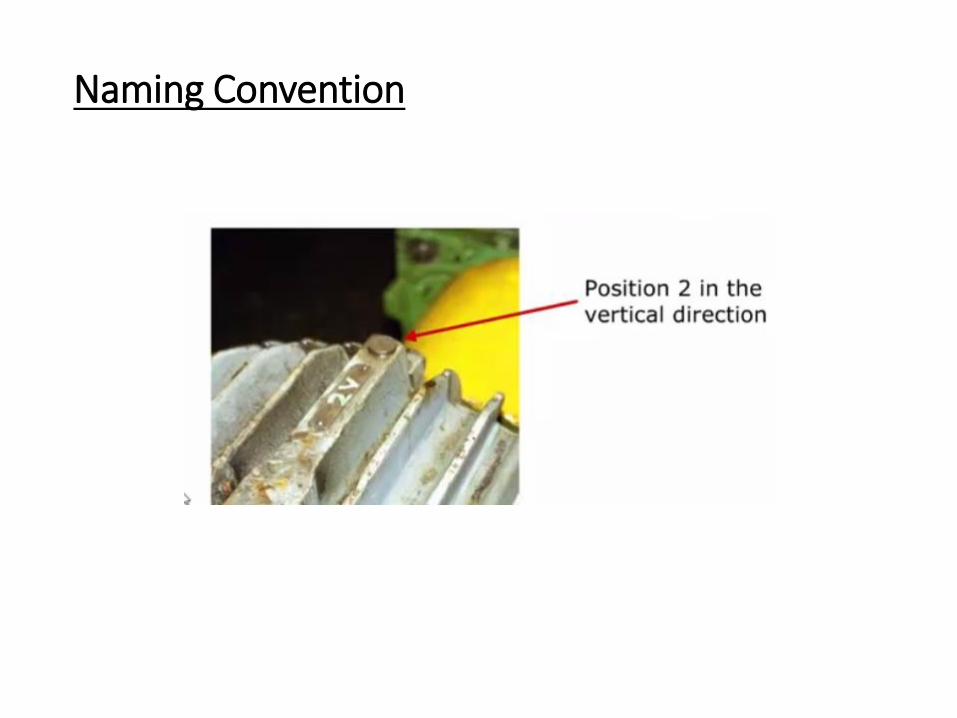
Naming Convention
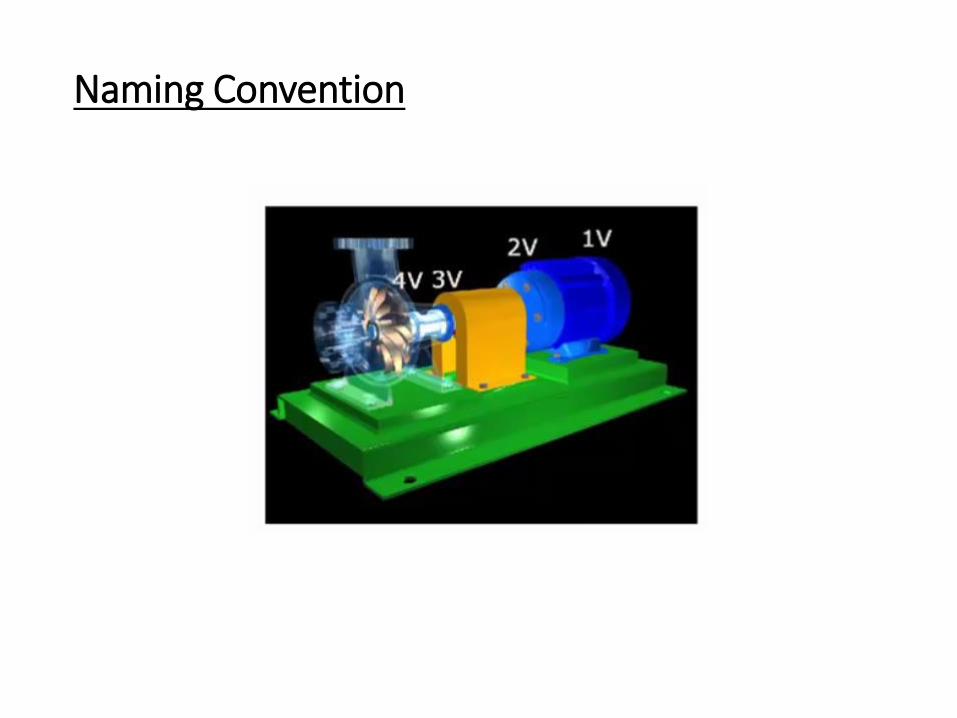
Naming Convention
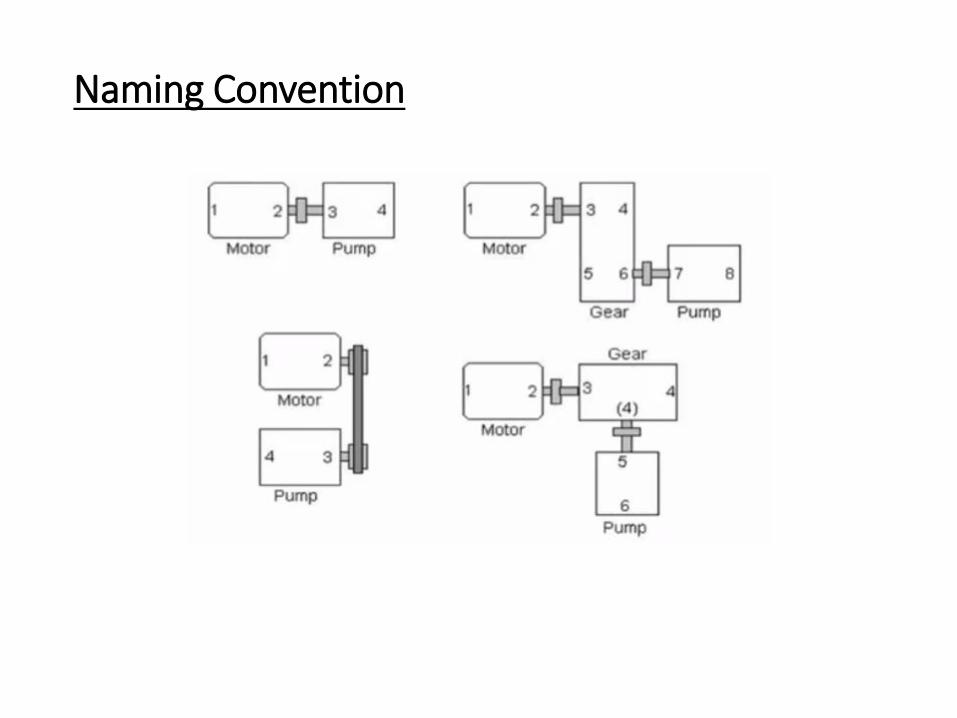
Naming Convention
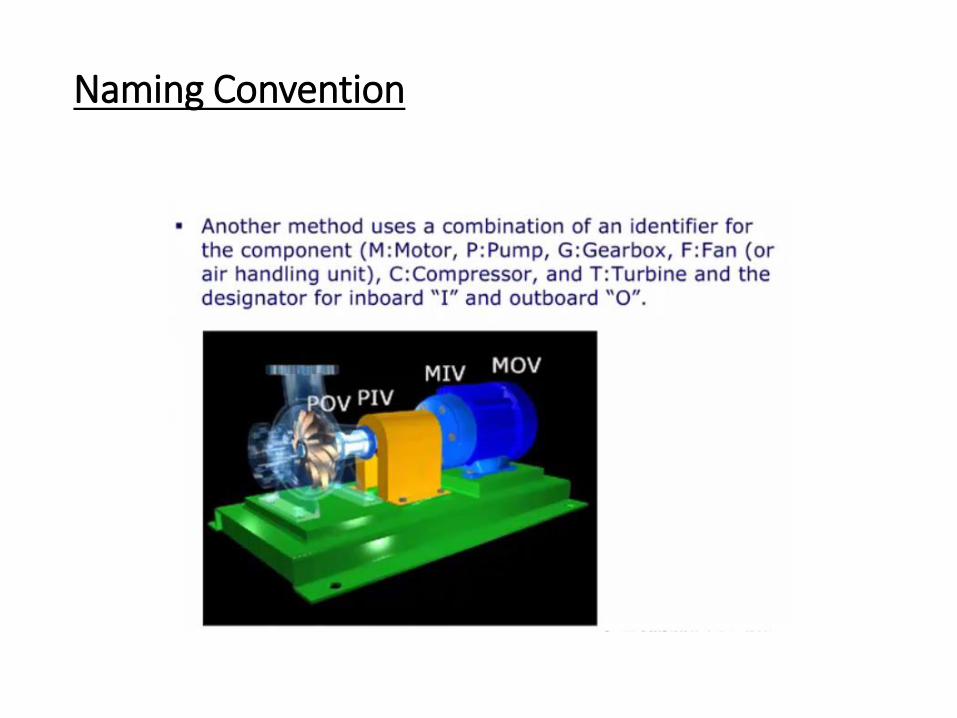
Naming Convention
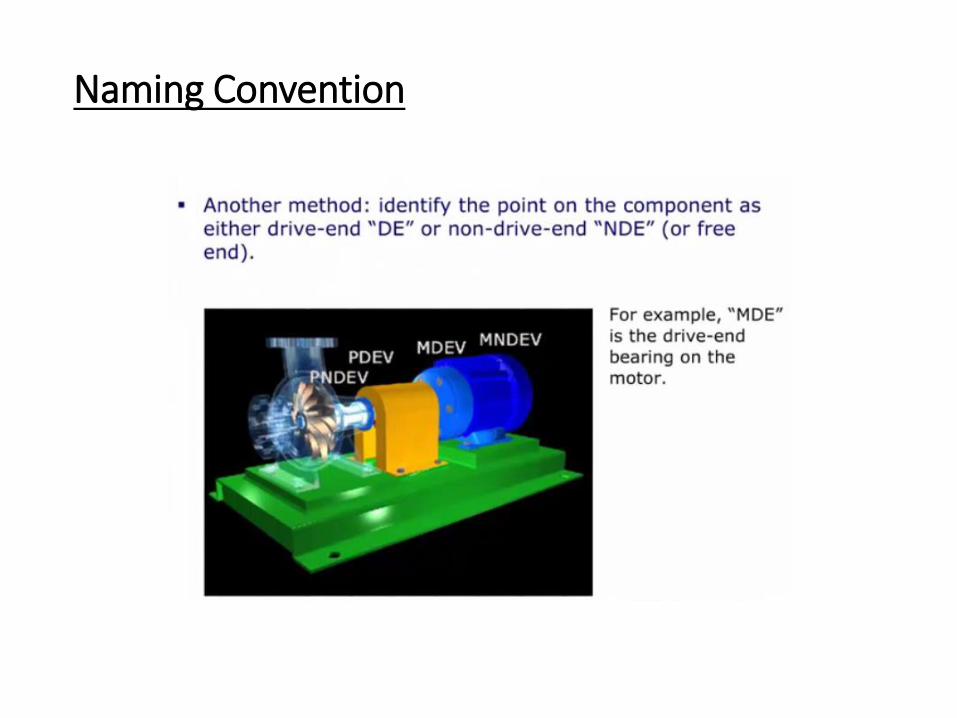
Naming Convention
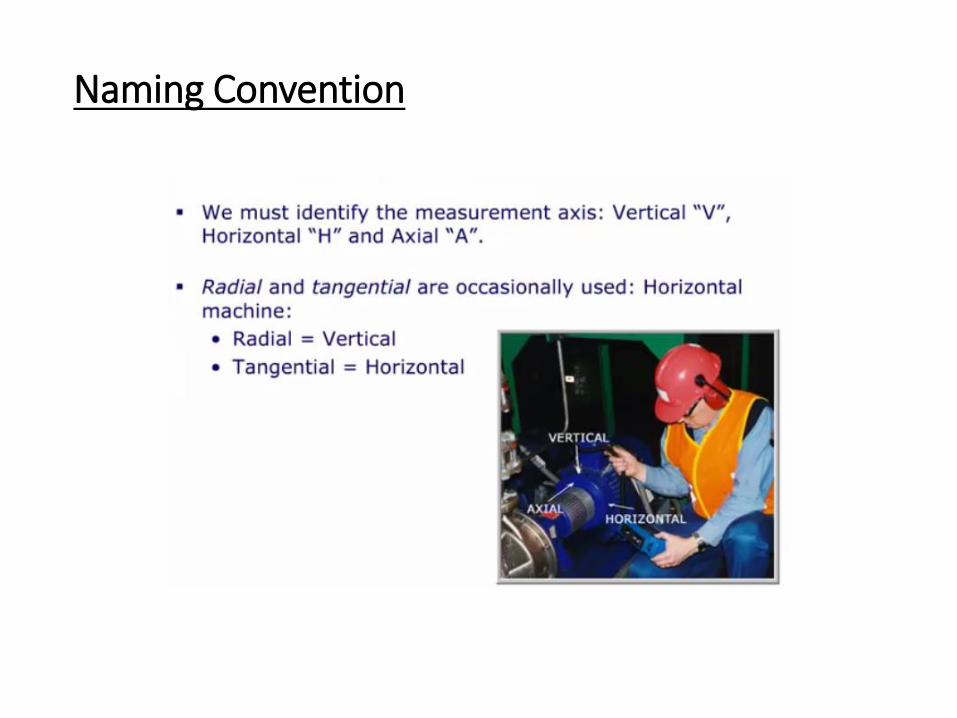
Naming Convention
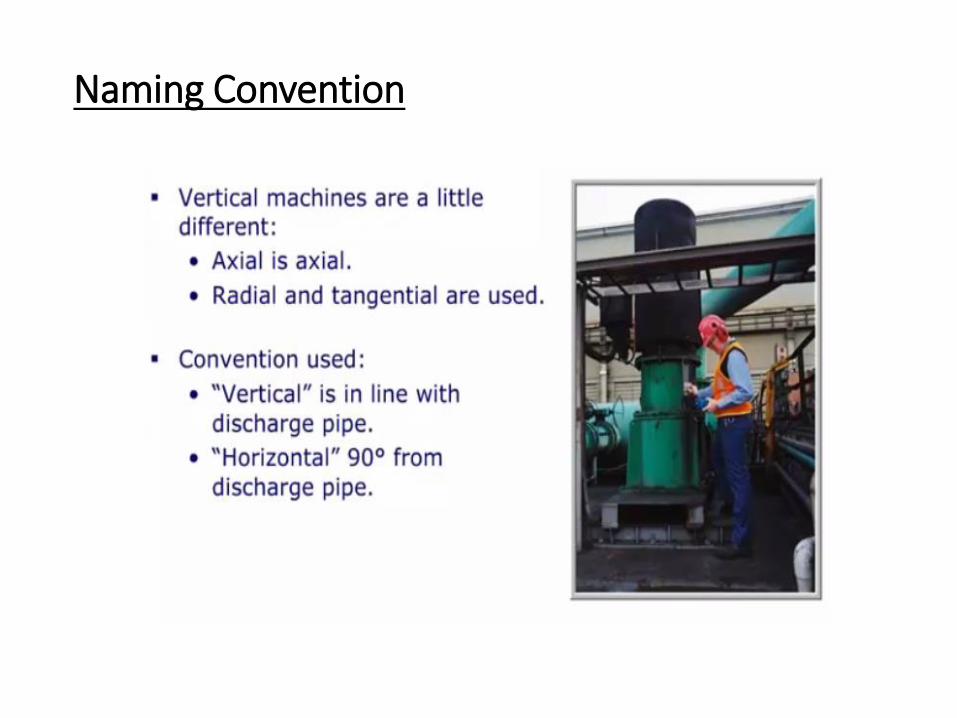
Naming Convention
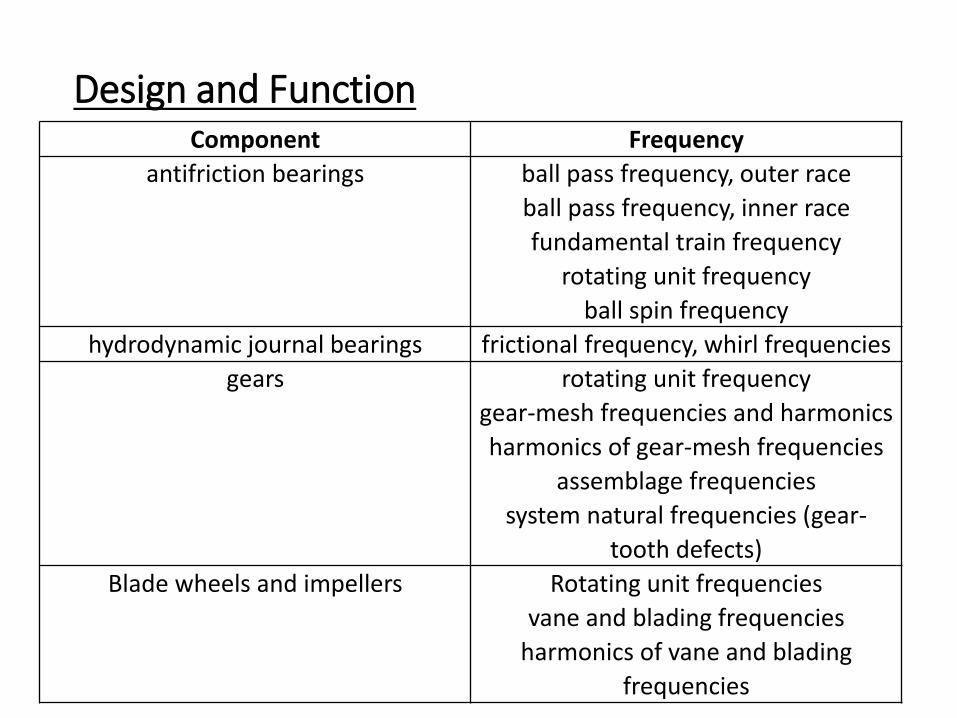
Design and Function Component Frequency
antifriction bearings ball pass frequency, outer race
ball pass frequency, inner race
fundamental train frequency
rotating unit frequency
ball spin frequency
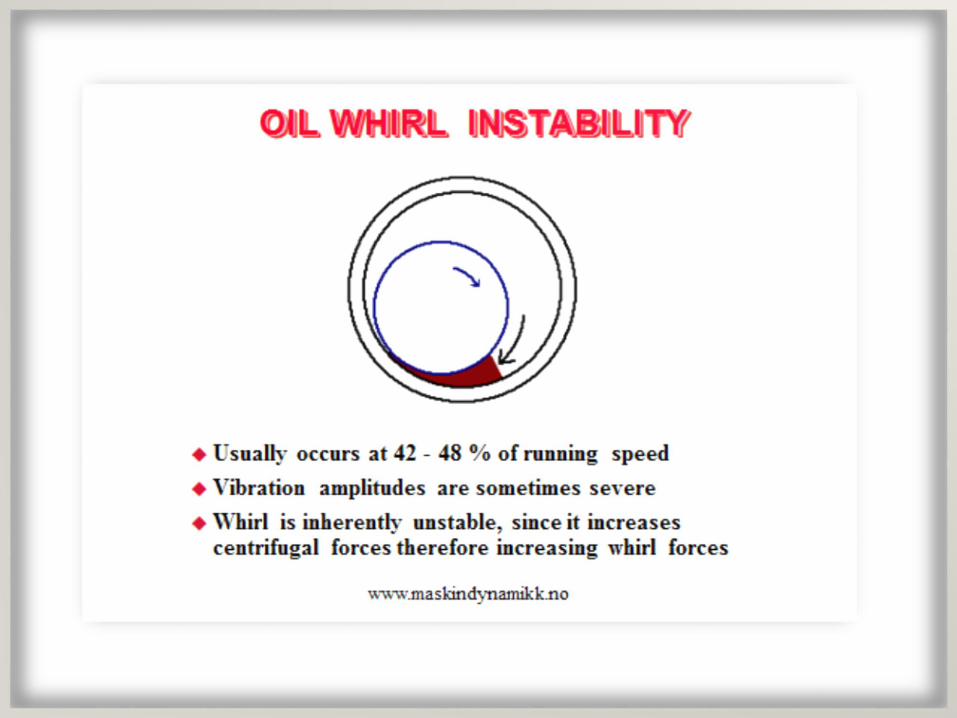
hydrodynamic journal bearings frictional frequency, whirl frequencies
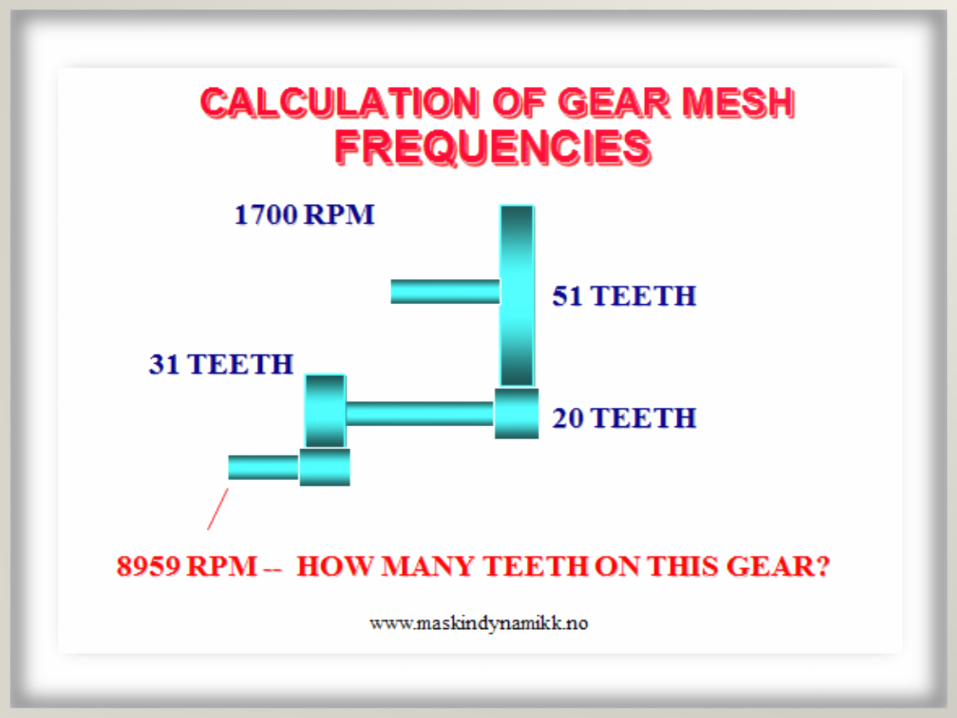
gears rotating unit frequency
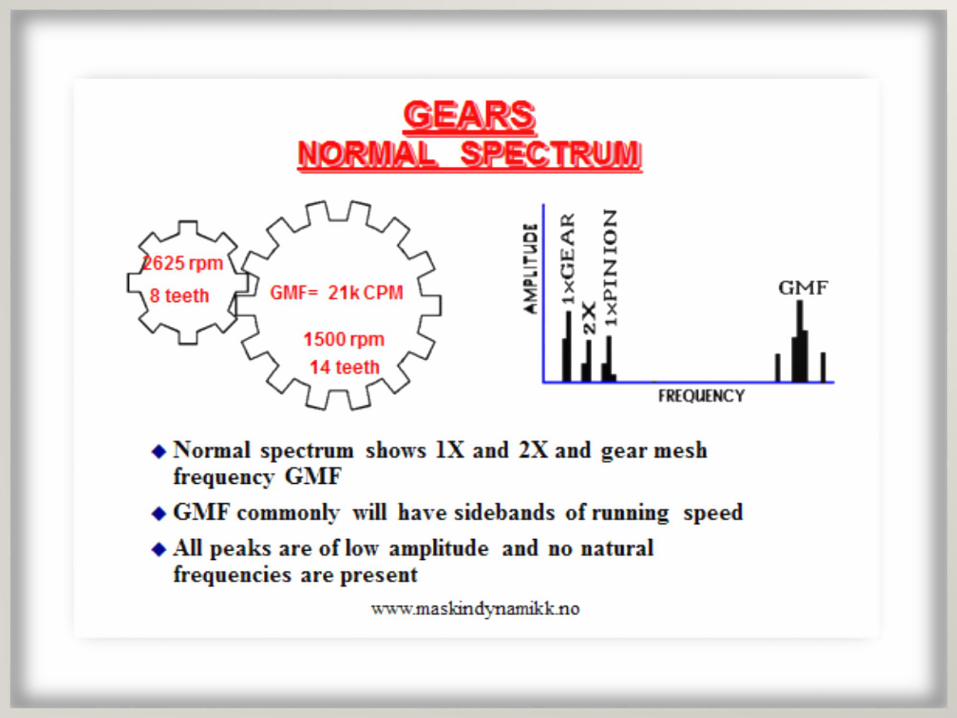
gear-mesh frequencies and harmonics
harmonics of gear-mesh frequencies
assemblage frequencies
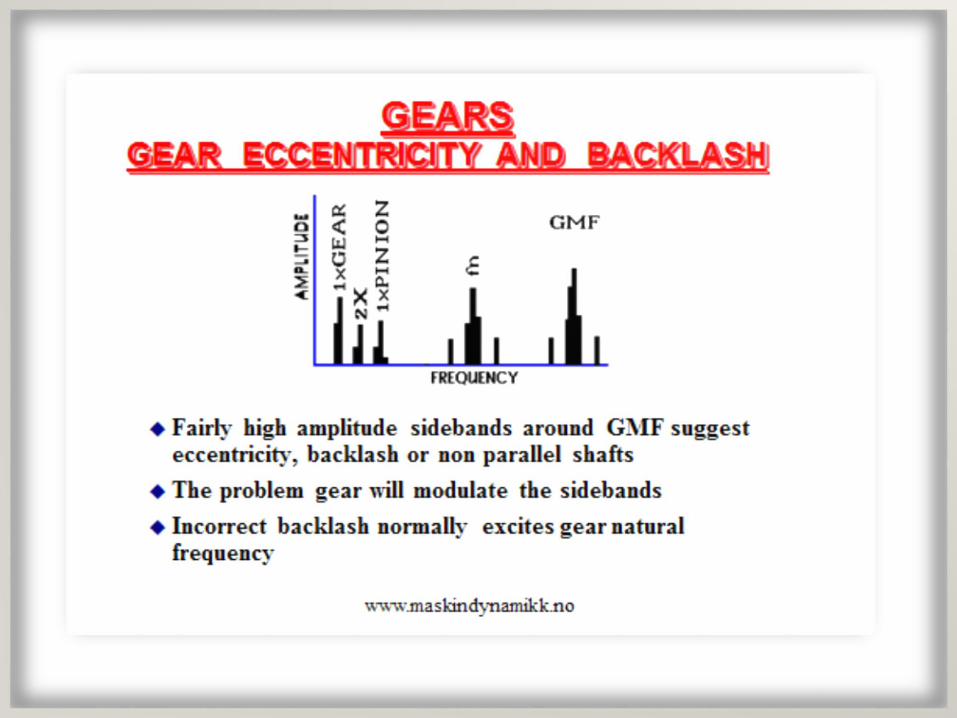
system natural frequencies (gear-
tooth defects)
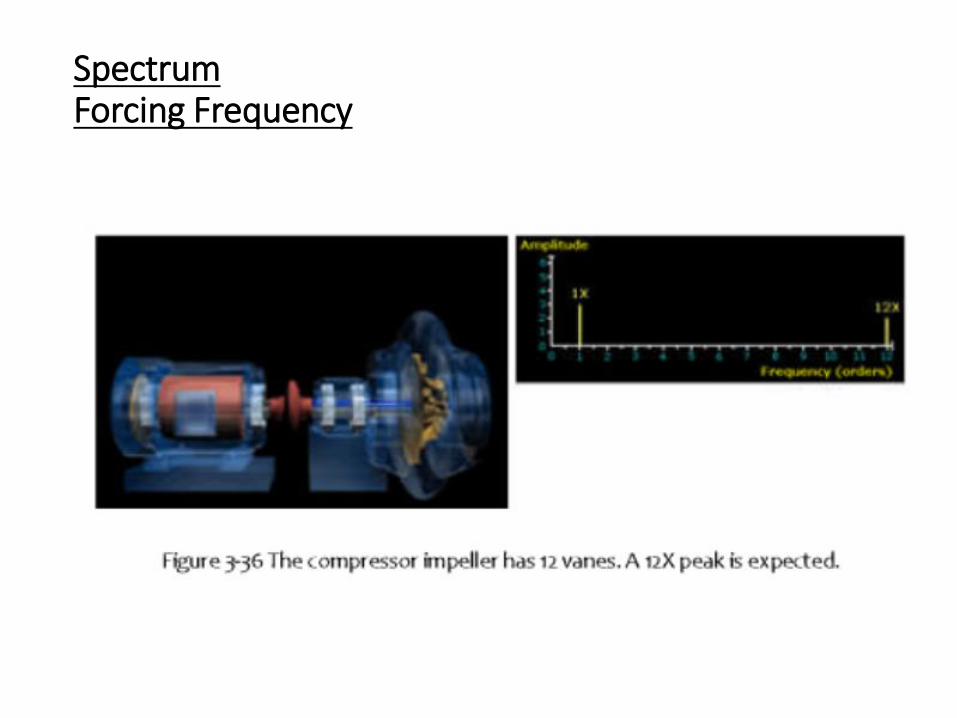
Blade wheels and impellers Rotating unit frequencies
vane and blading frequencies
harmonics of vane and blading
frequencies
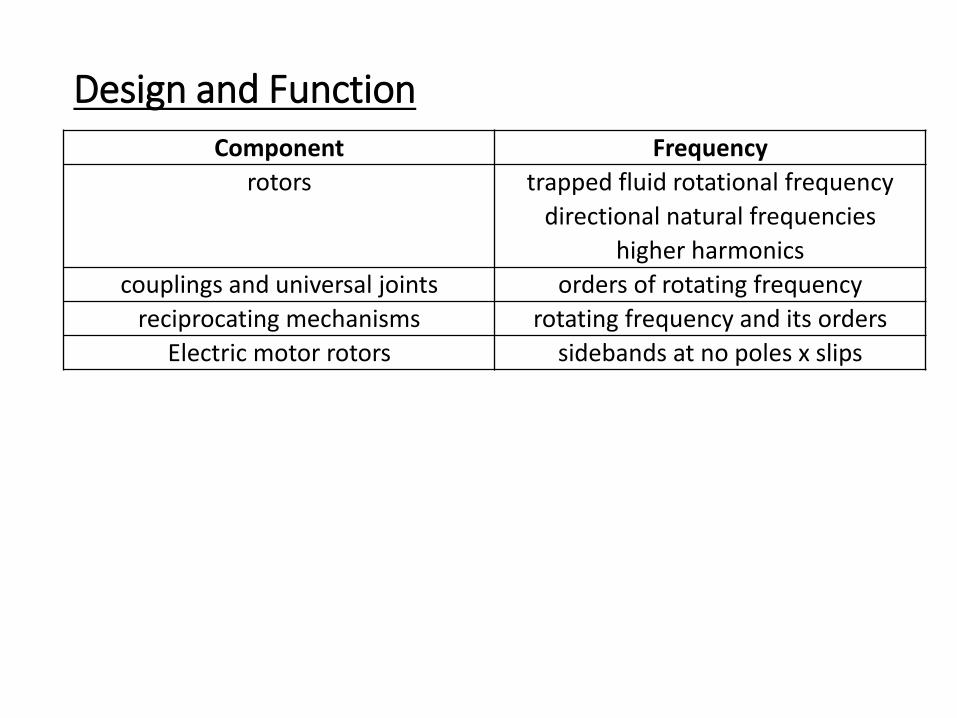
Design and Function
Component Frequency
rotors trapped fluid rotational frequency
directional natural frequencies
higher harmonics
couplings and universal joints orders of rotating frequency
reciprocating mechanisms rotating frequency and its orders
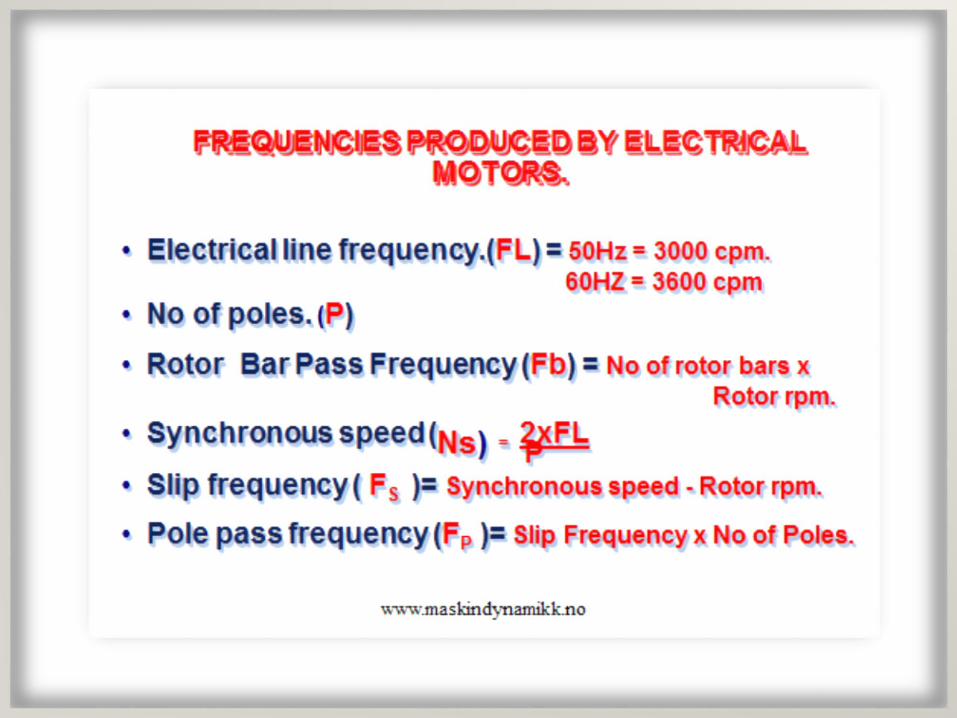
Electric motor rotors sidebands at no poles x slips
Chapter 5 – VIBRATION INSTRUMENTS
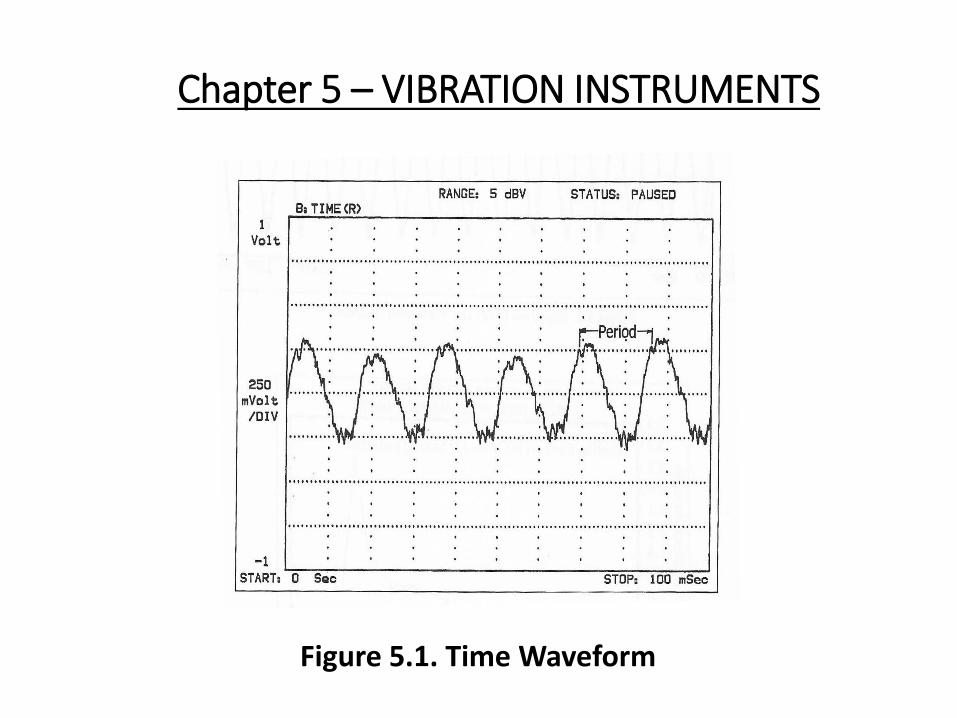
The sensor which changes the mechanical motion of the machine to an electrical signal is connected to an instrument which provides an analytical read out and/or print out. The read out can be as simple as a single number from a meter or a waveform from an oscilloscope. More elaborate analyzers provide spectra (amplitude versus frequency) and digital time waveforms. Data collectors provide overall values, filtered values, phase readings, spectra, and time waveforms.
Chapter 5 – VIBRATION INSTRUMENTS
Figure 5.1. Time Waveform
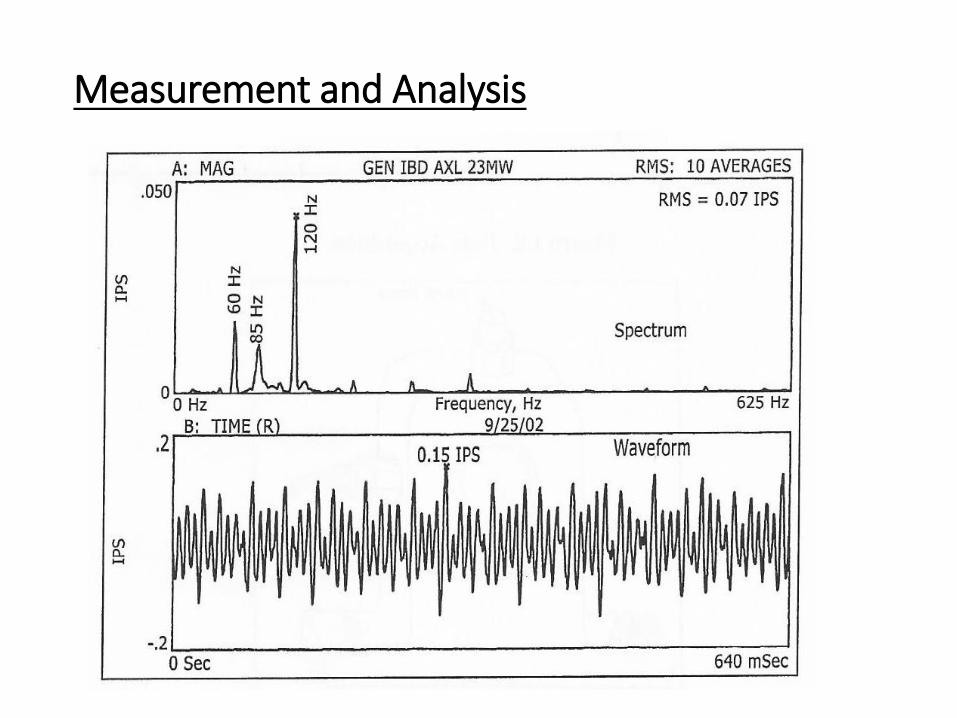
Chapter 5 – VIBRATION INSTRUMENTS
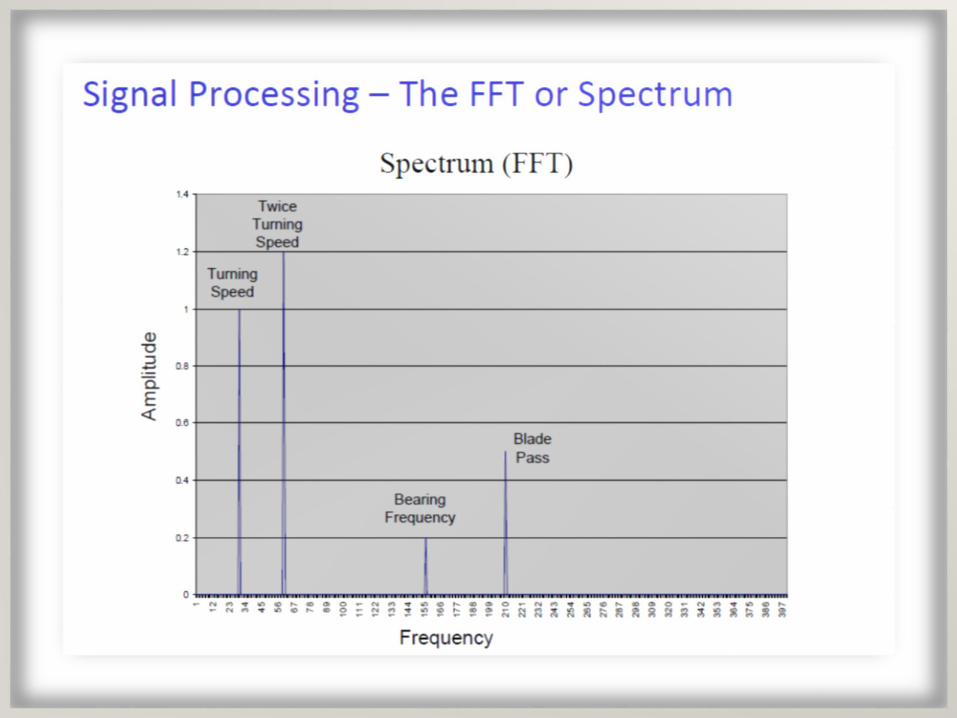
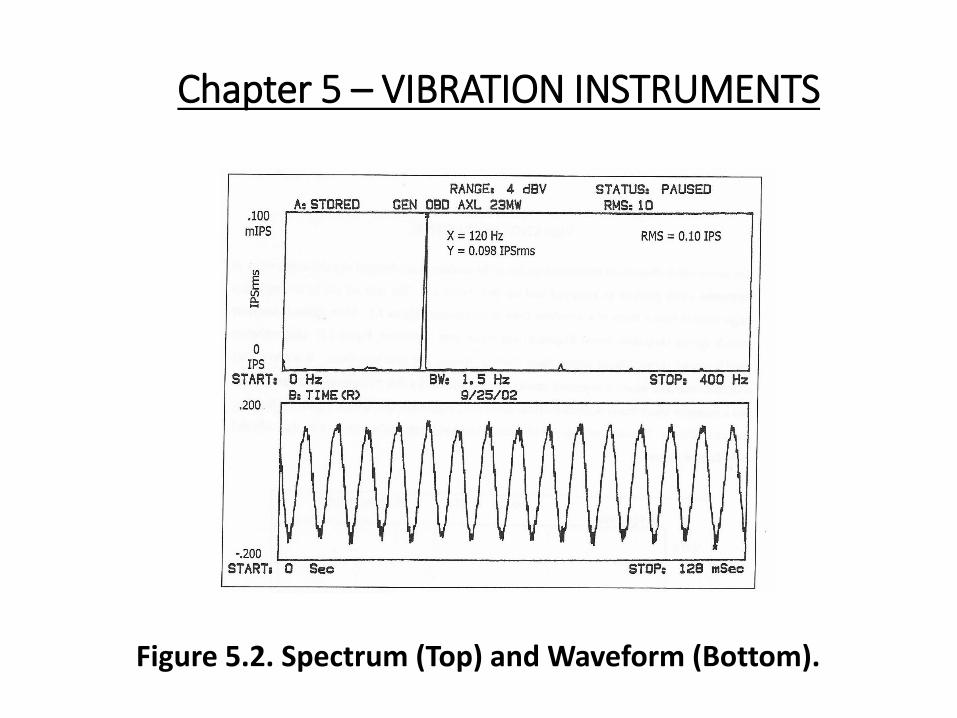
Figure 5.2. Spectrum (Top) and Waveform (Bottom).
Chapter 5 – VIBRATION INSTRUMENTS
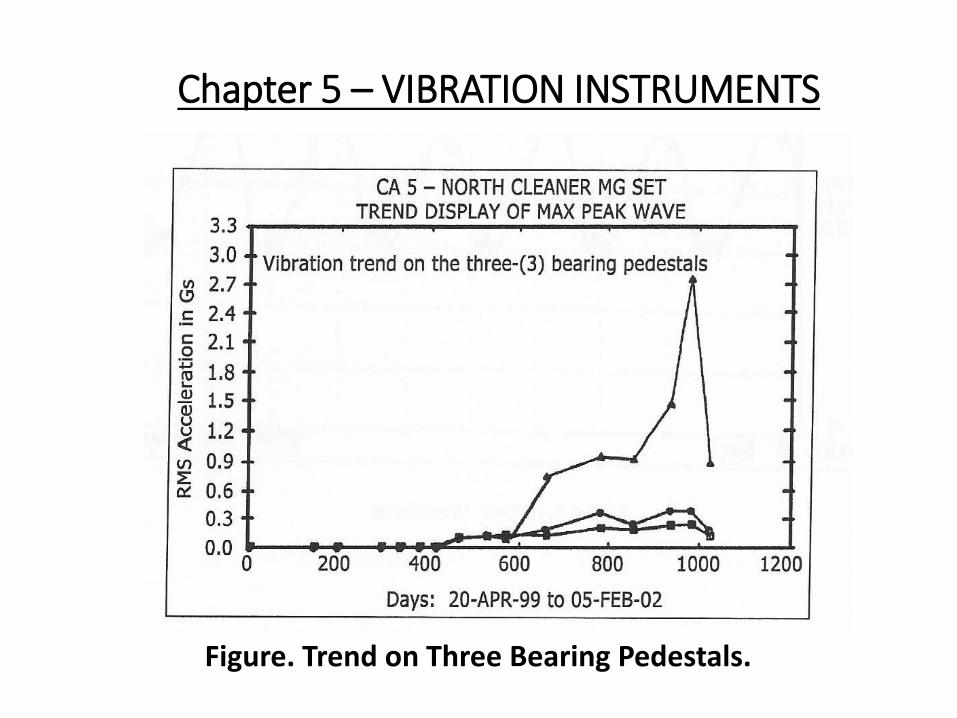
Figure. Trend on Three Bearing Pedestals.
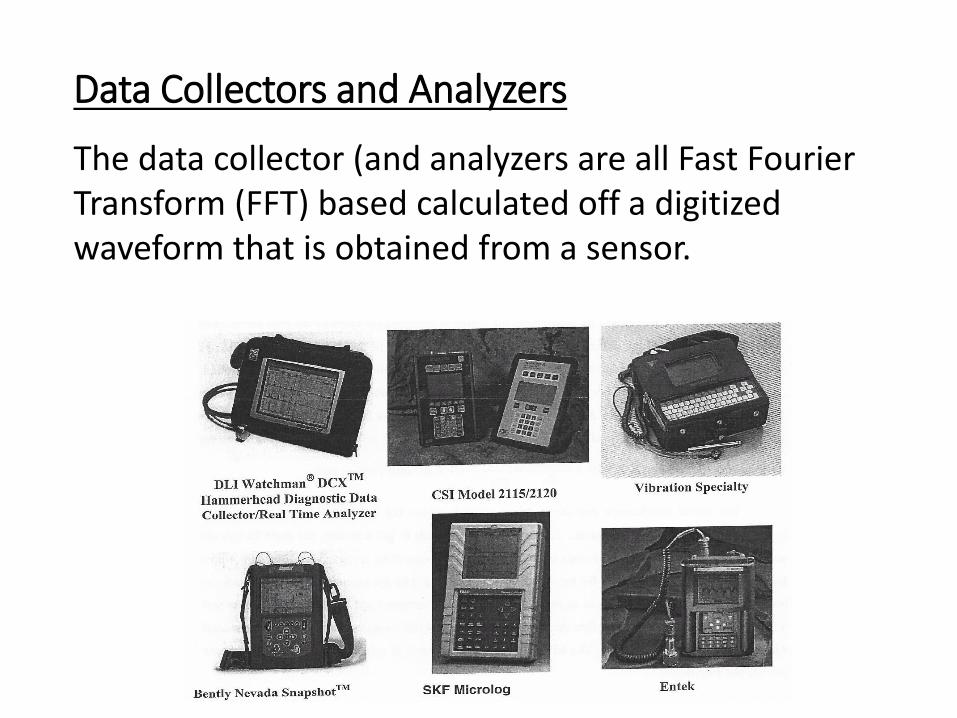
Data Collectors and Analyzers
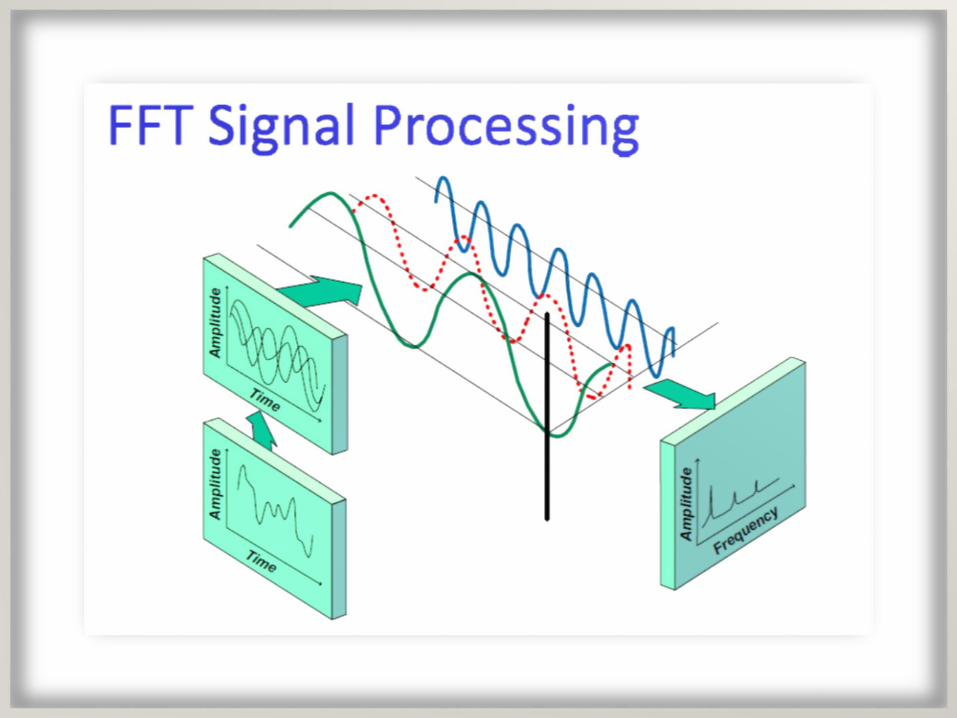
The data collector (and analyzers are all Fast Fourier Transform (FFT) based calculated off a digitized waveform that is obtained from a sensor.
SpectrumOrders
SpectrumOrders
SpectrumOrder
SpectrumOrder
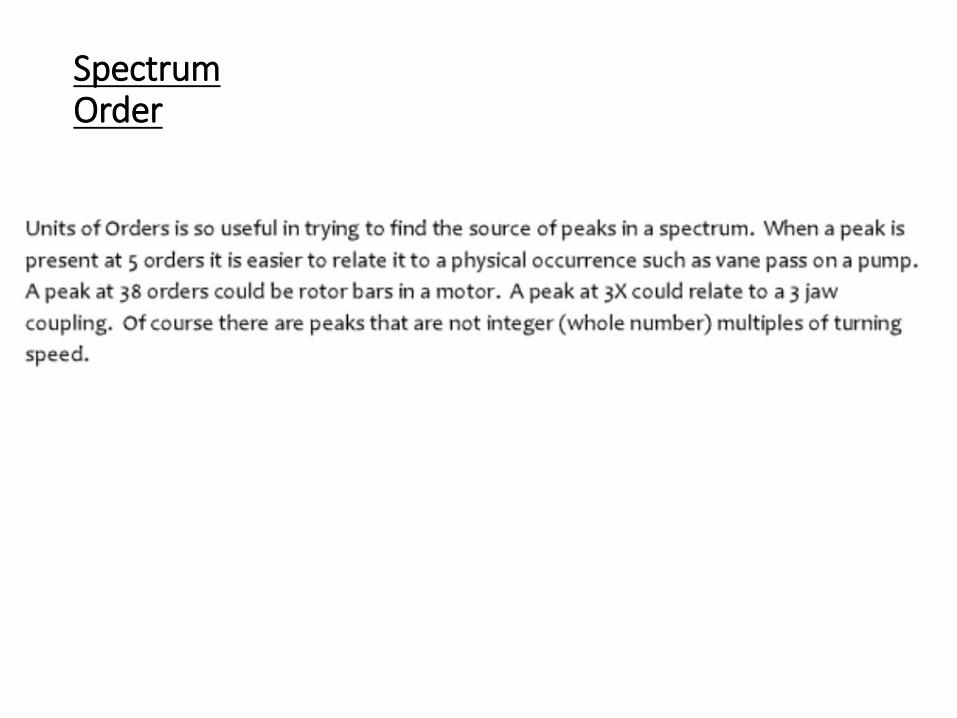
SpectrumOrder
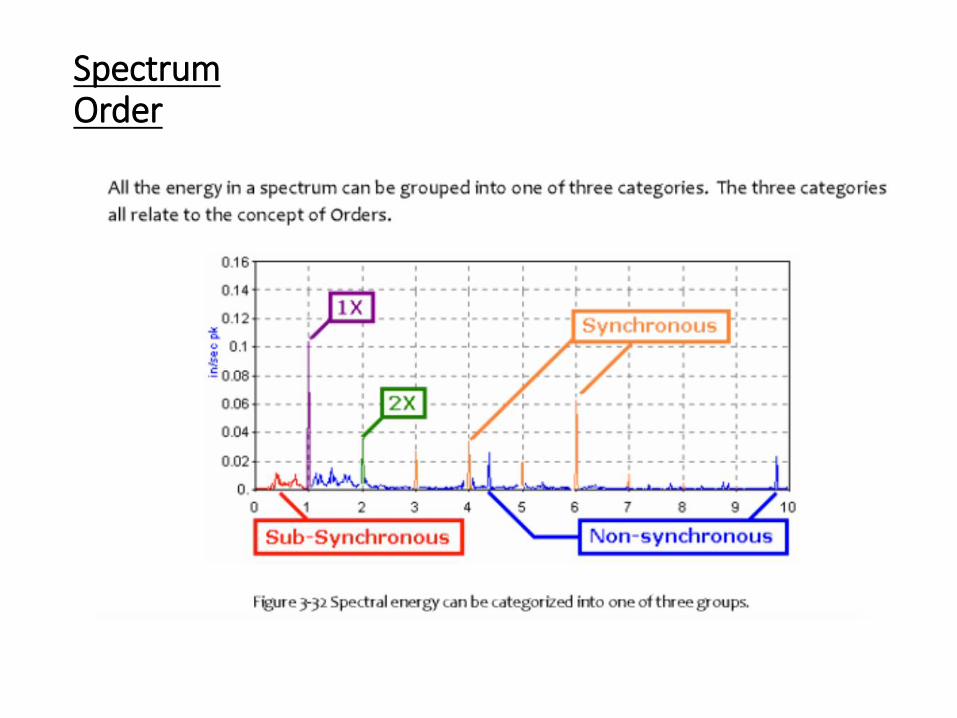
SpectrumOrder
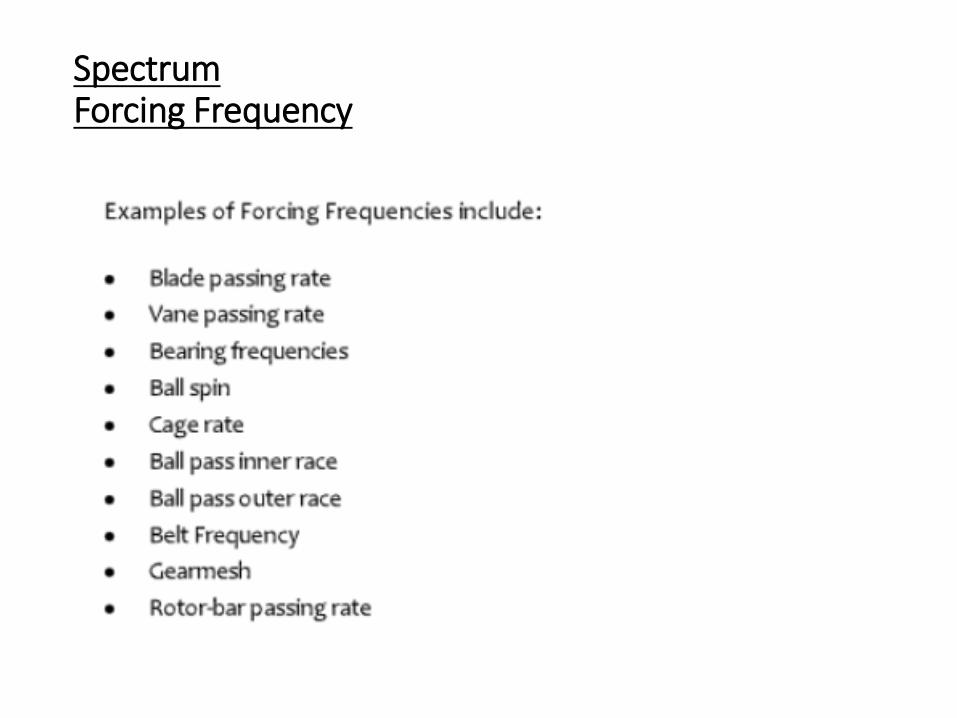
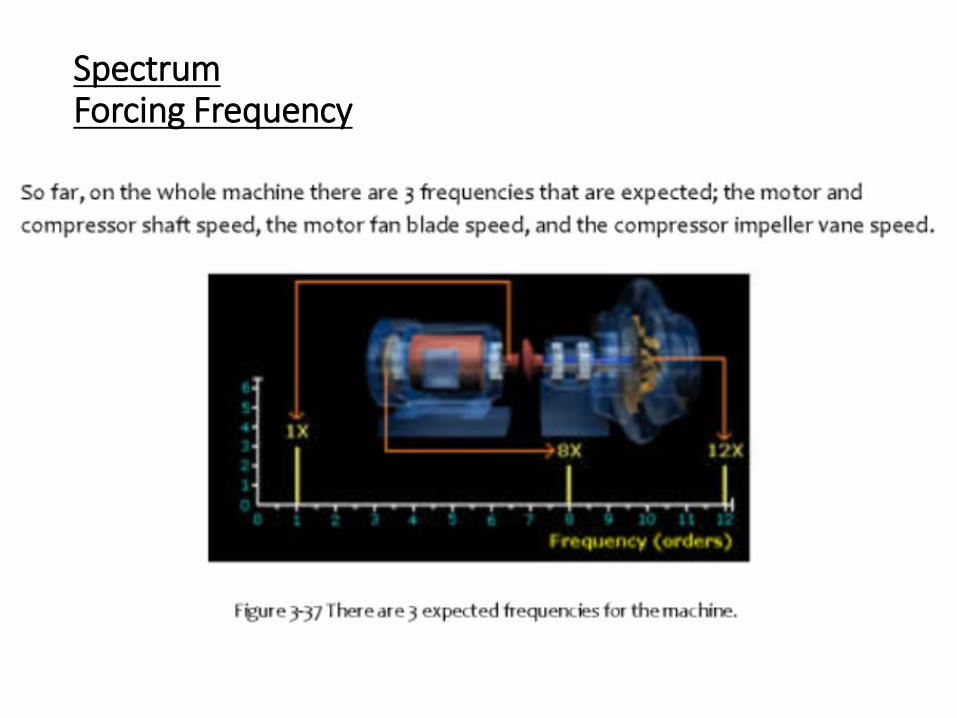
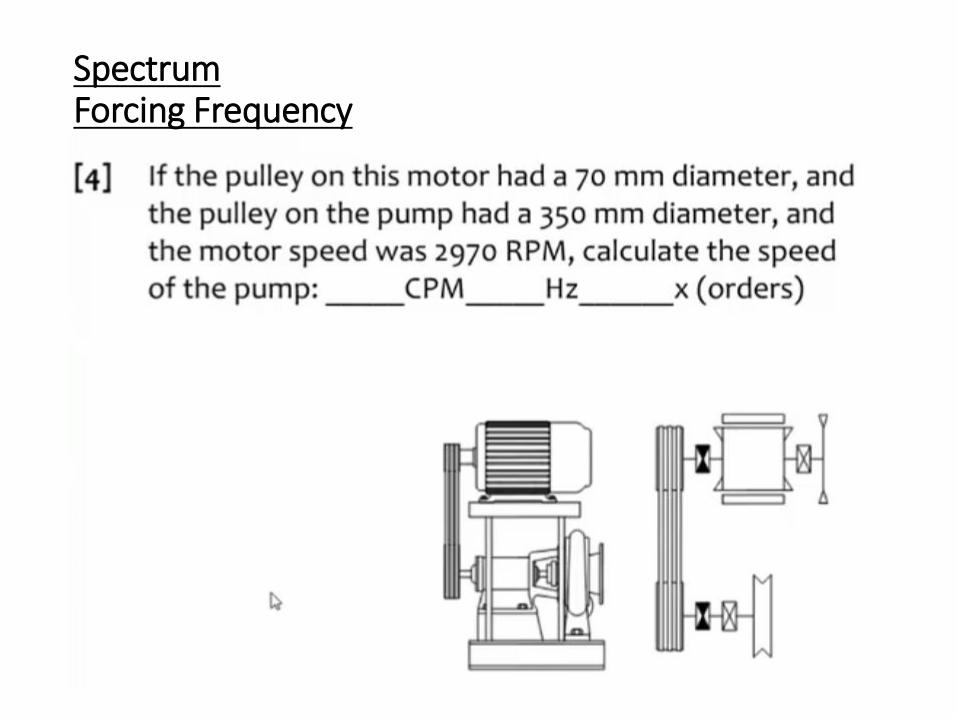
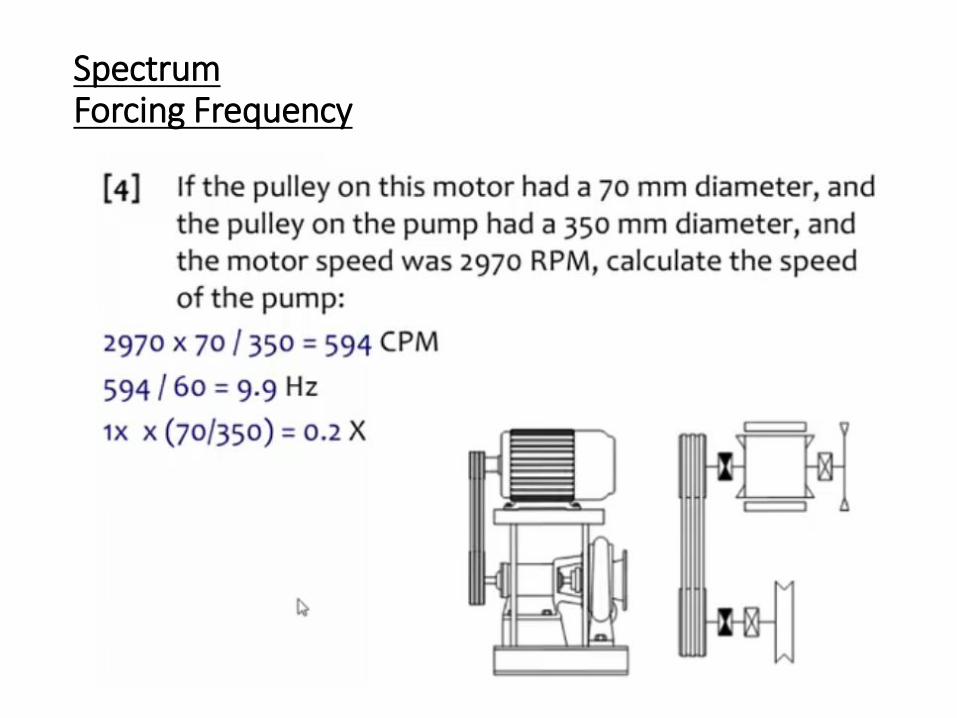
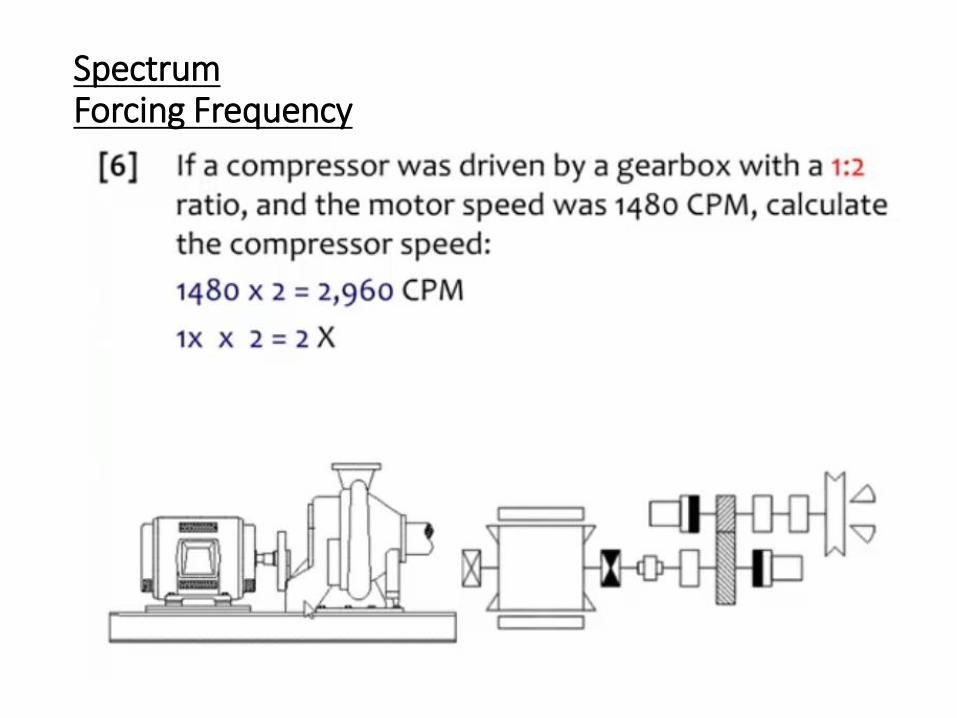
SpectrumForcing Frequency
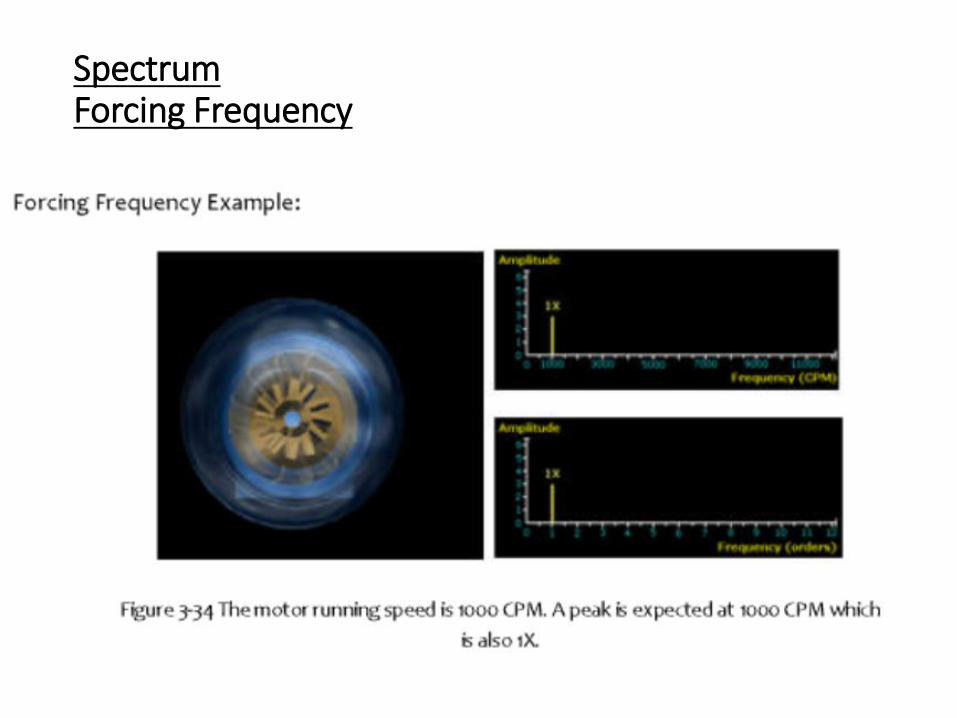
SpectrumForcing Frequency
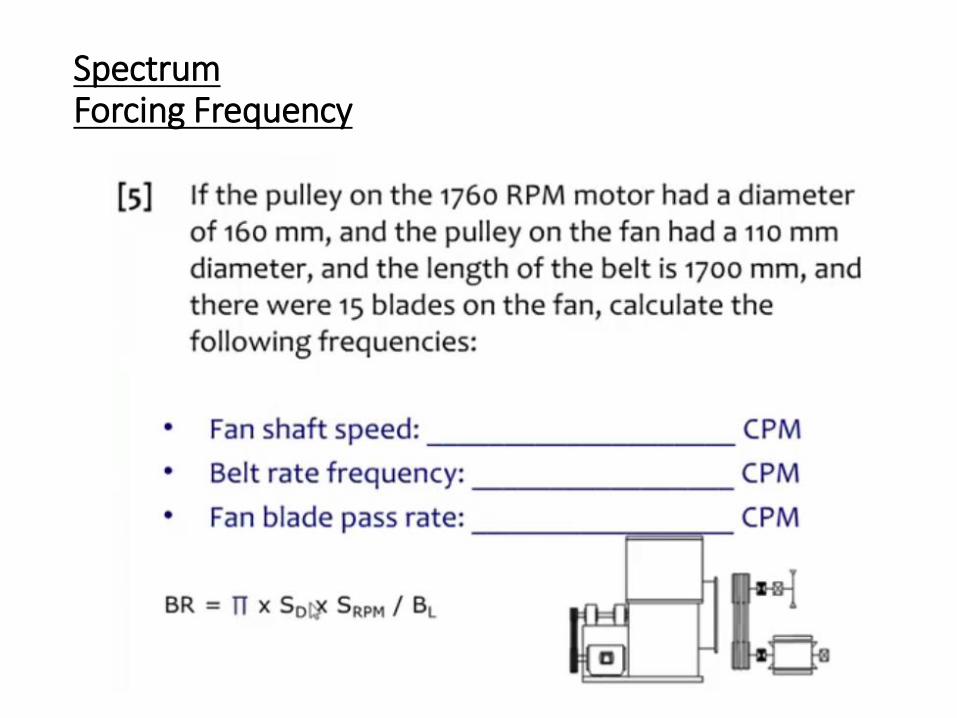
SpectrumForcing Frequency
SpectrumForcing Frequency
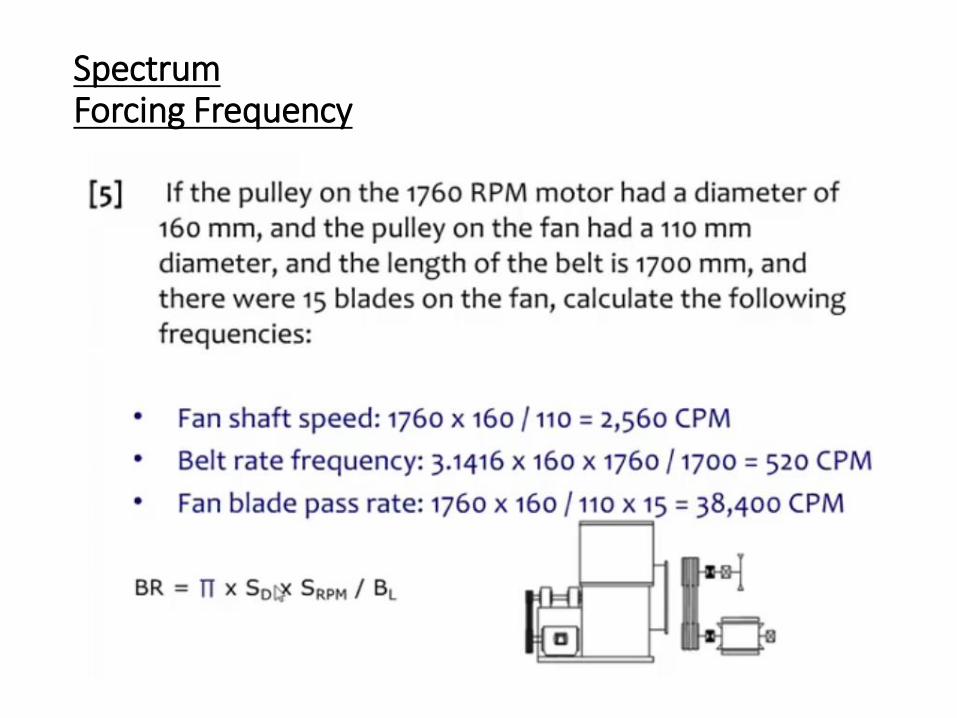
SpectrumForcing Frequency
SpectrumForcing Frequency
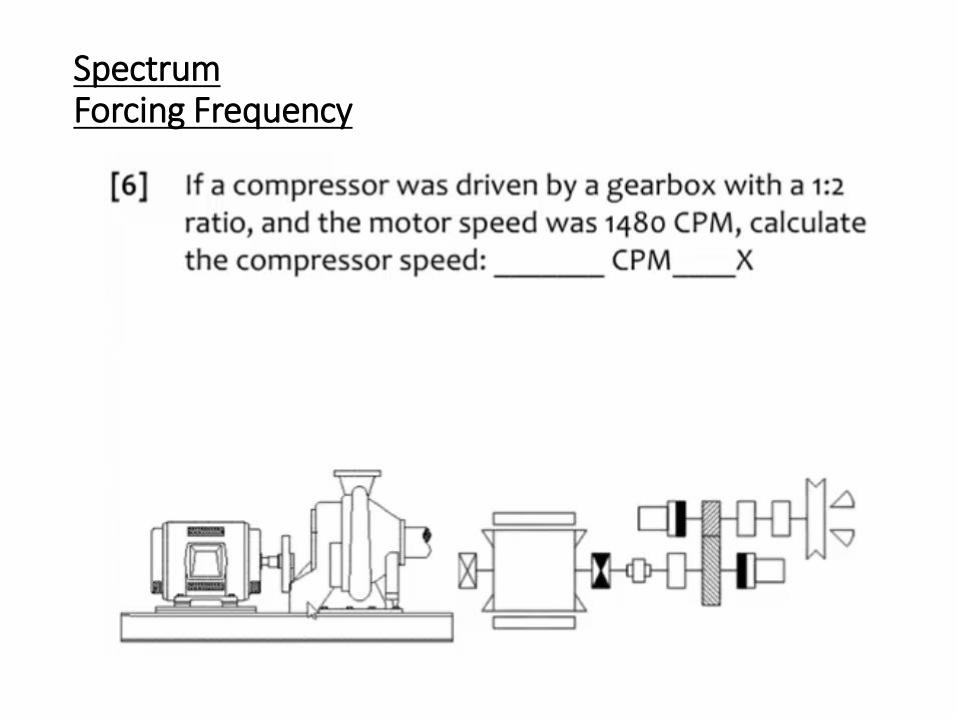
SpectrumForcing Frequency
SpectrumForcing Frequency
SpectrumForcing Frequency
SpectrumForcing Frequency
SpectrumForcing Frequency
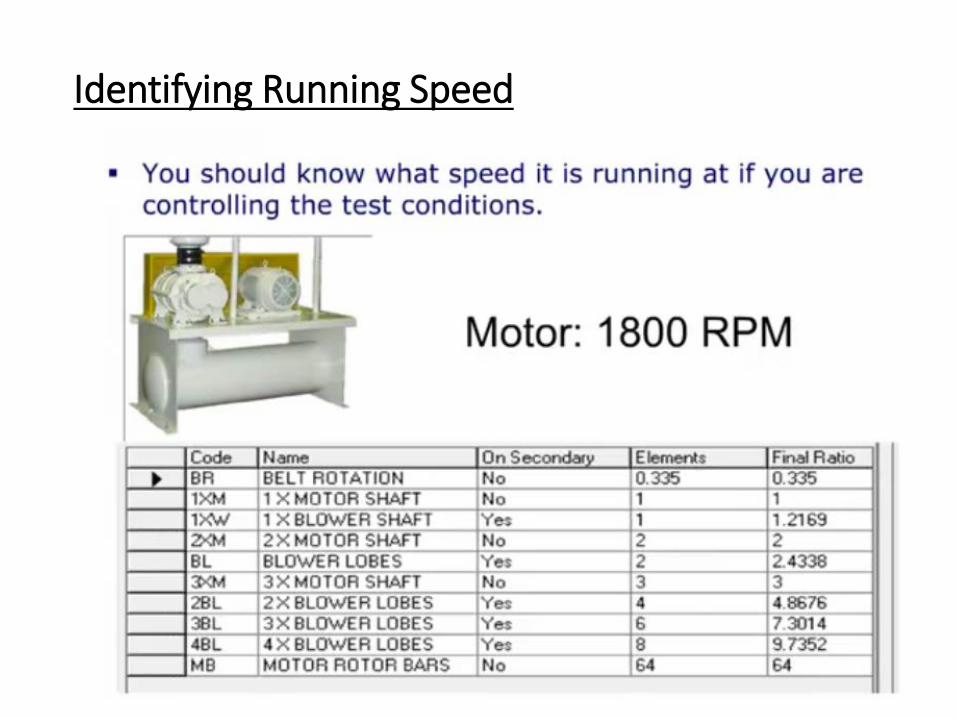
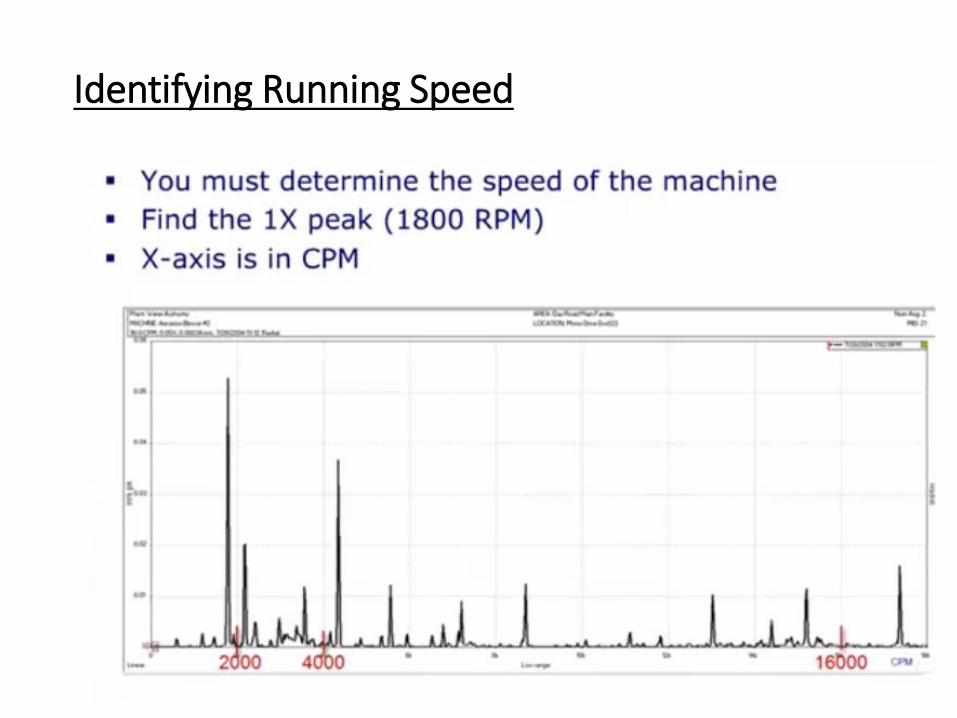
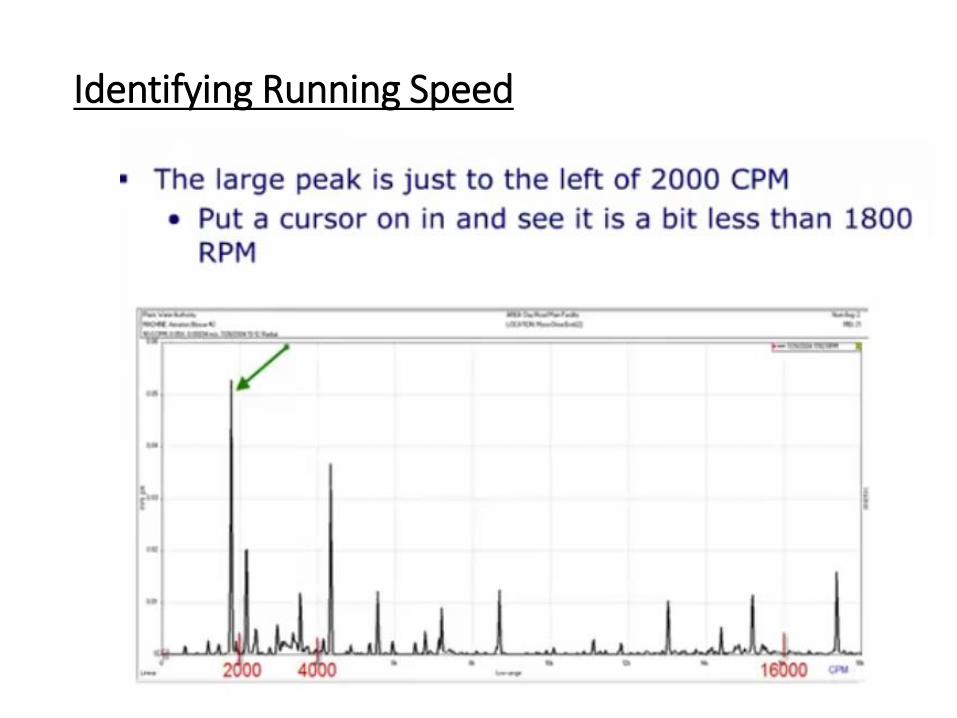
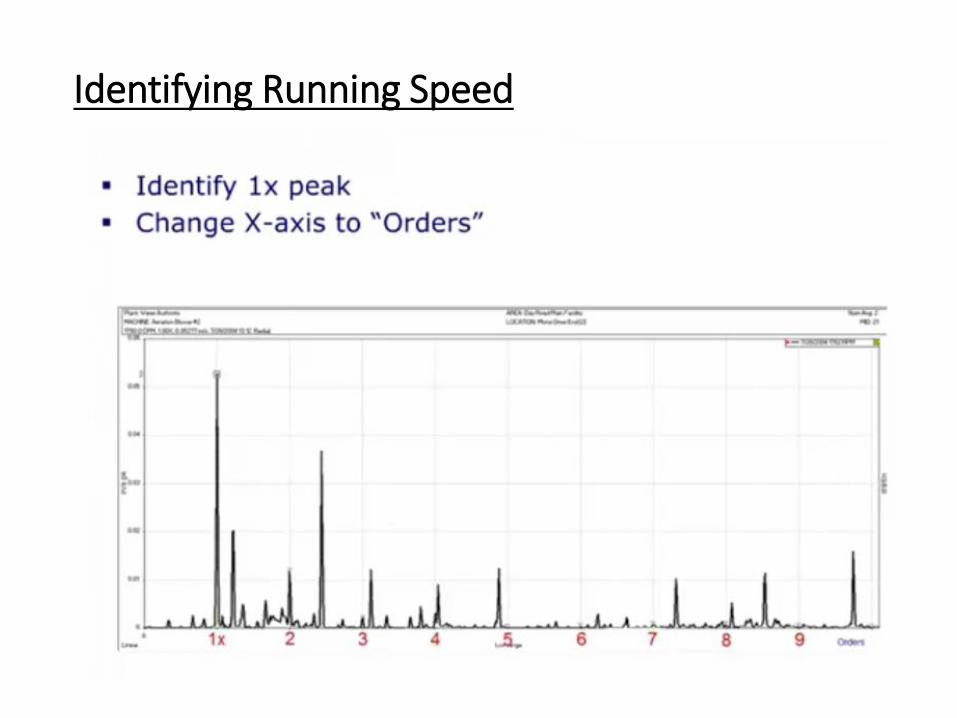
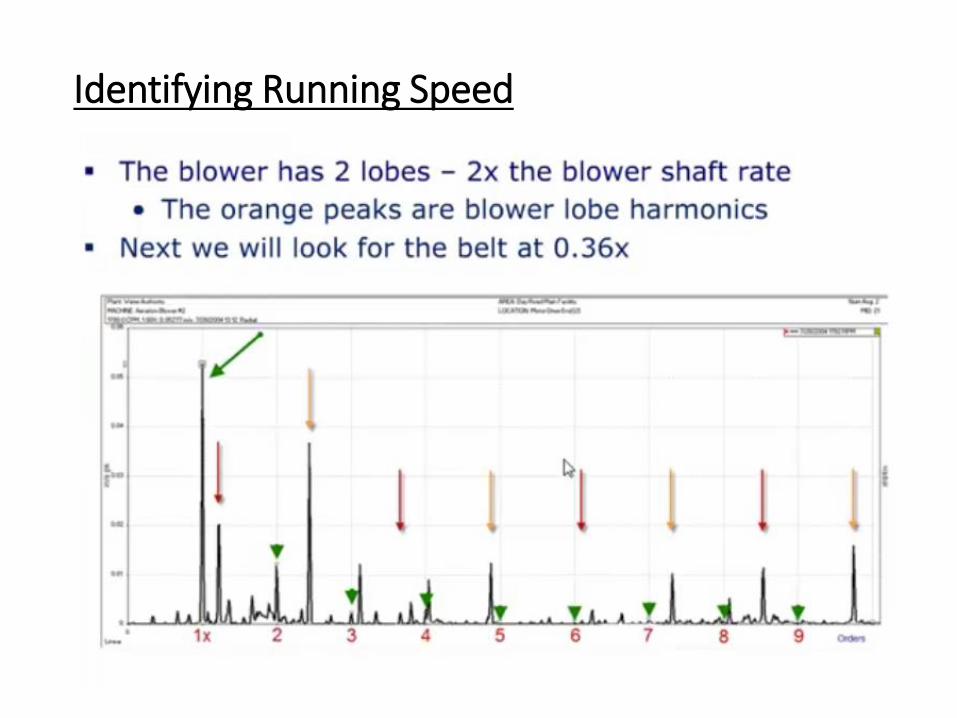
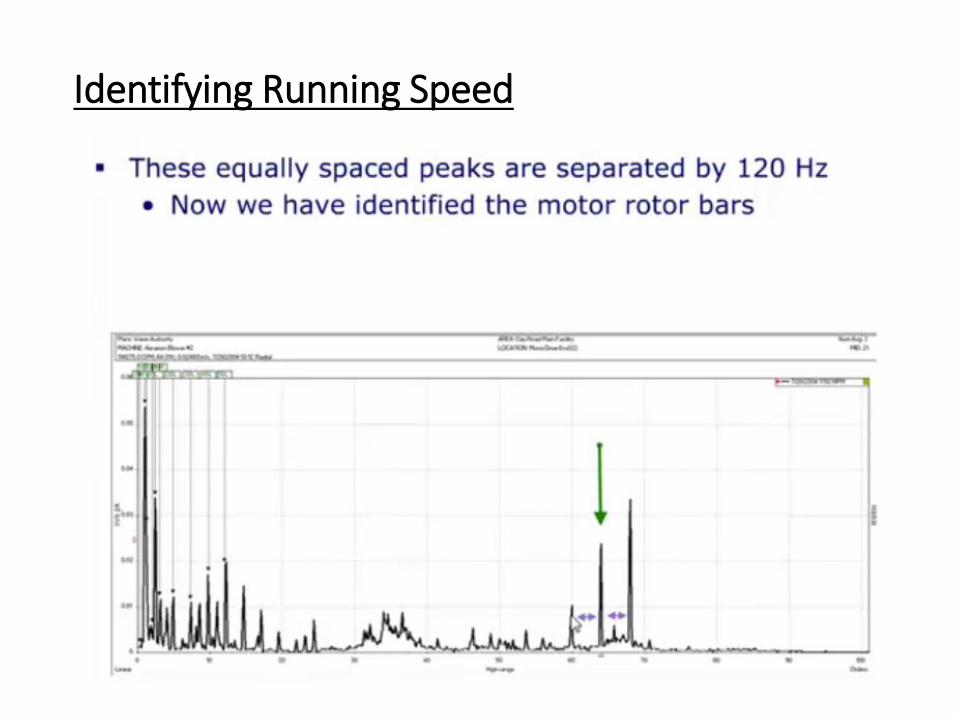
Identifying Running Speed
Identifying Running Speed
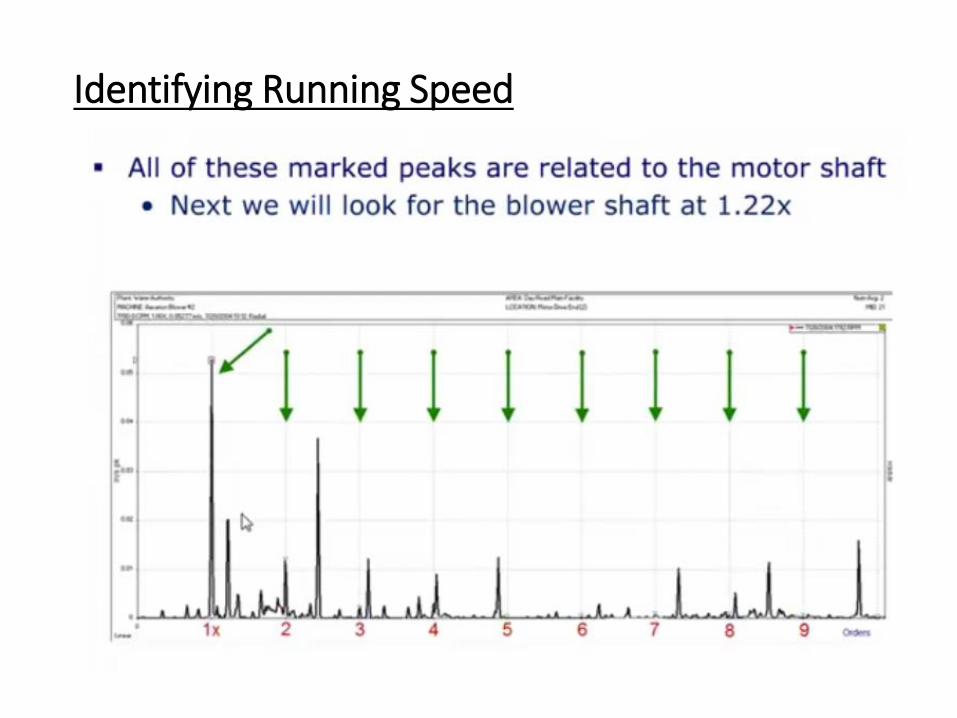
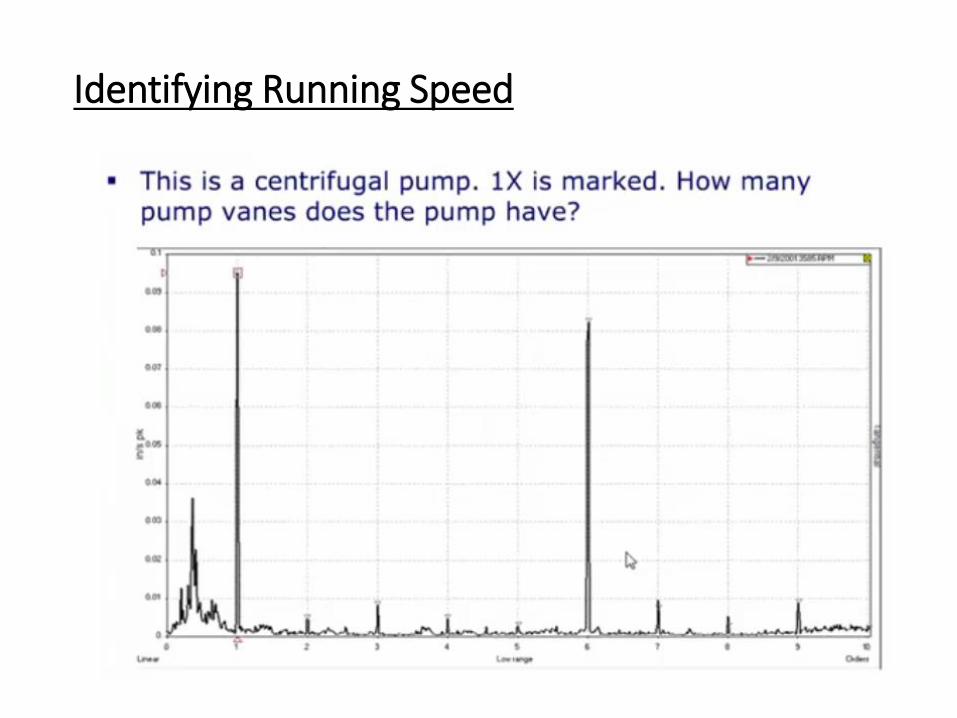
Identifying Running Speed
Identifying Running Speed
Identifying Running Speed
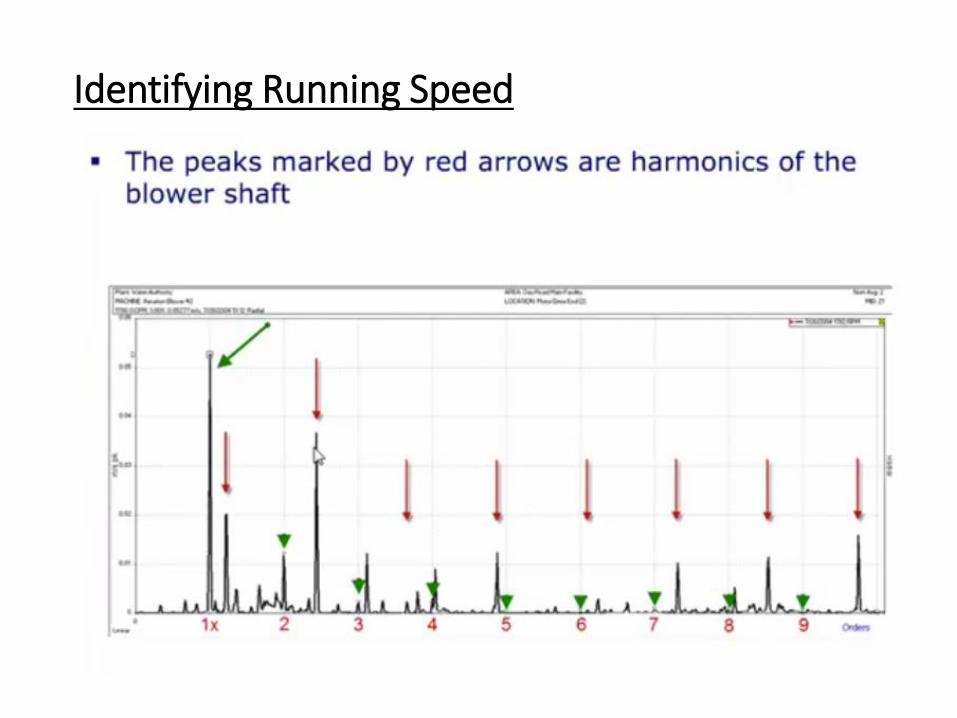
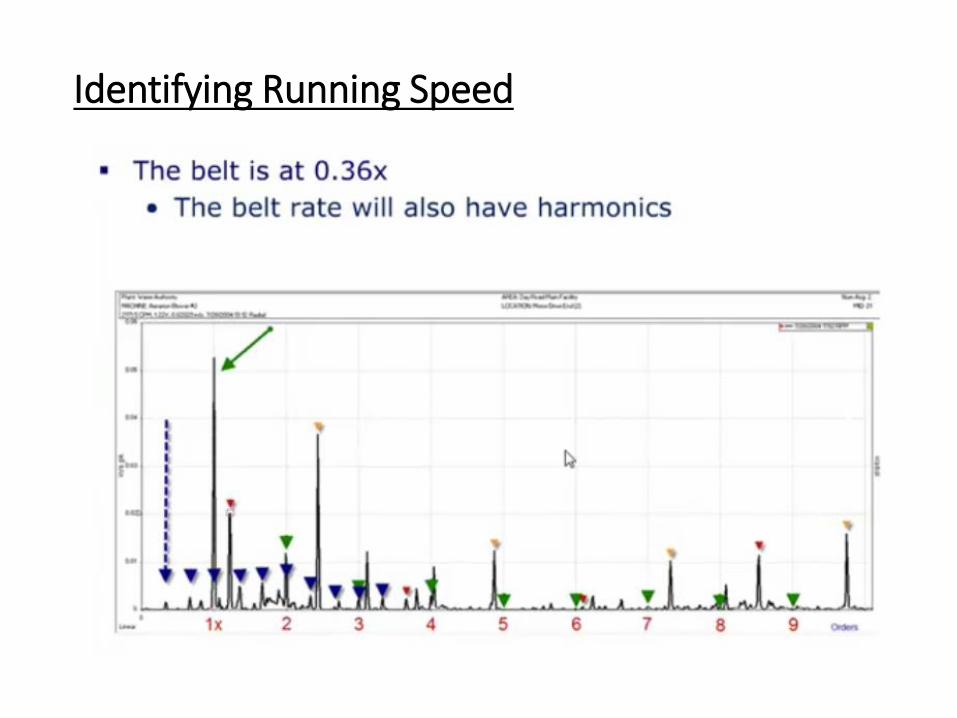
Identifying Running Speed
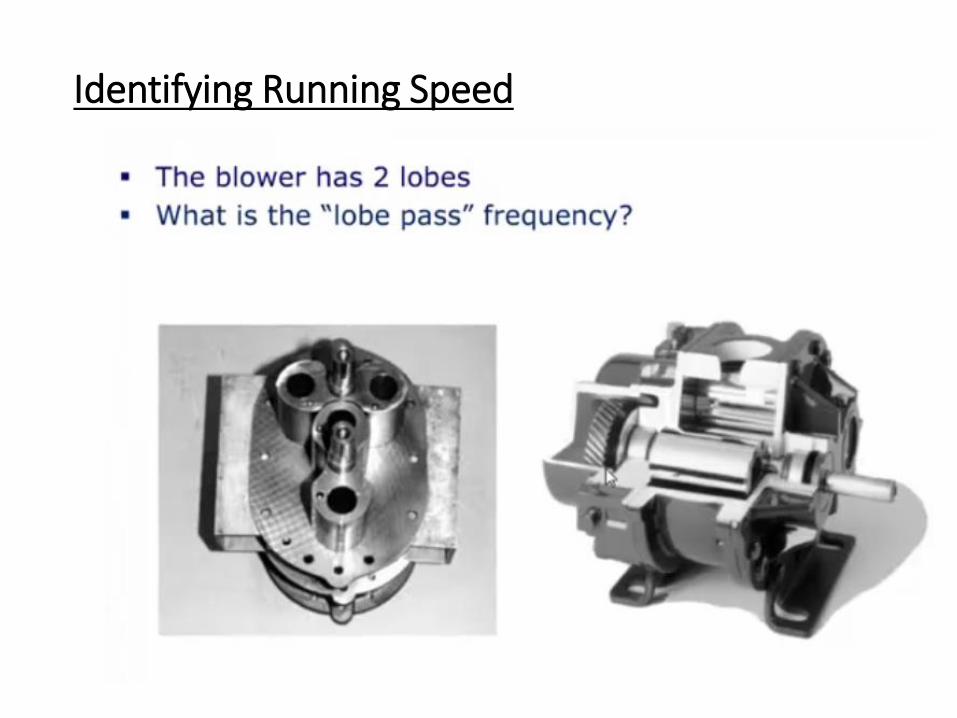
Identifying Running Speed
Identifying Running Speed
Identifying Running Speed
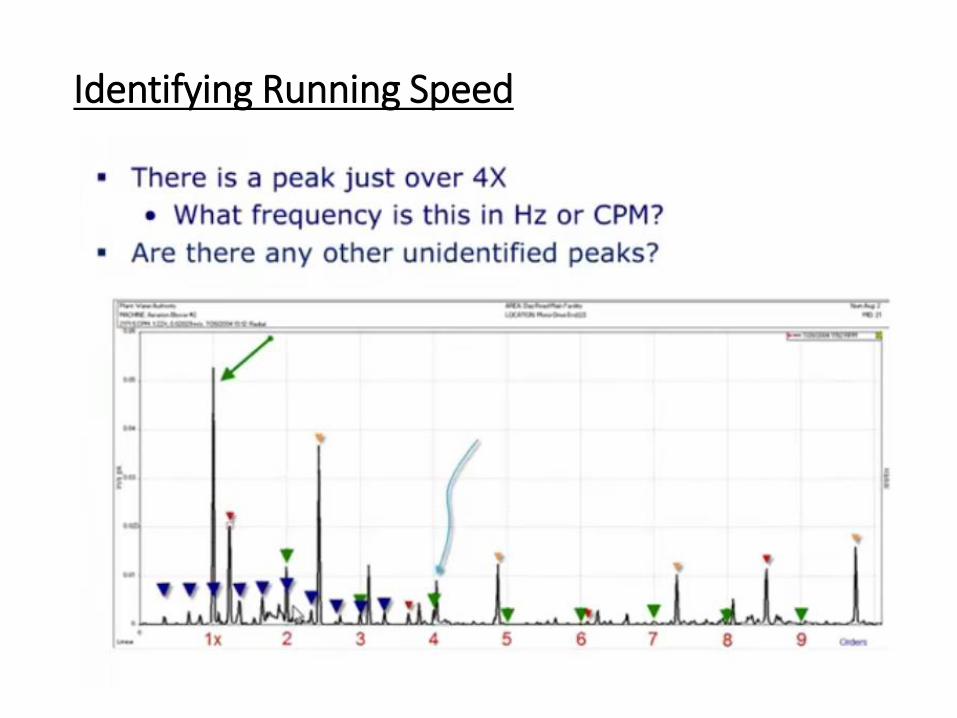
Identifying Running Speed
Identifying Running Speed
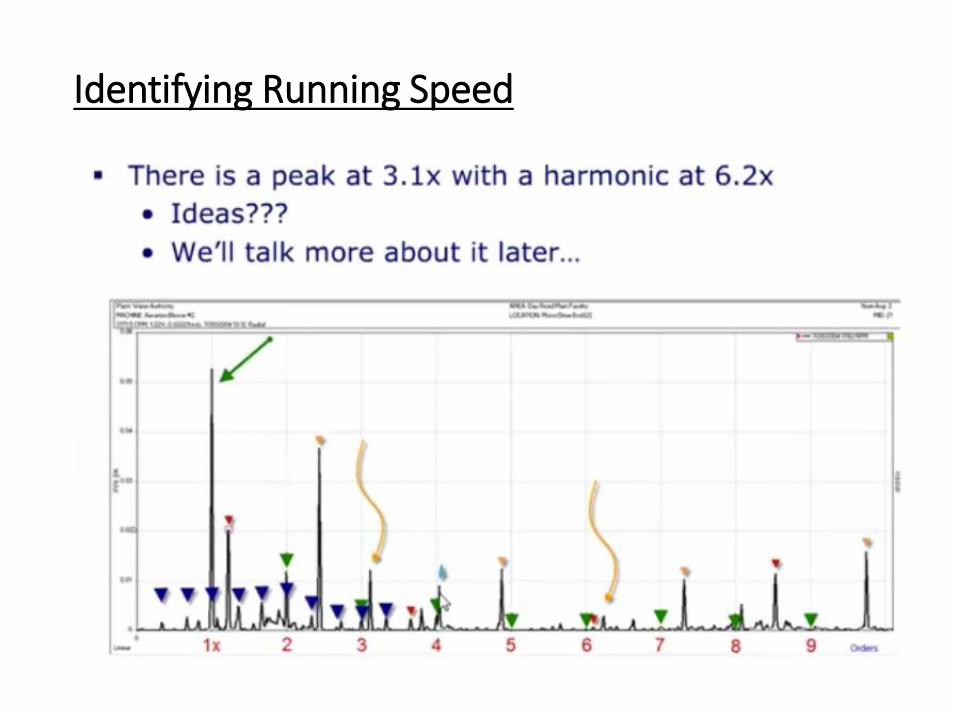
Identifying Running Speed
Identifying Running Speed
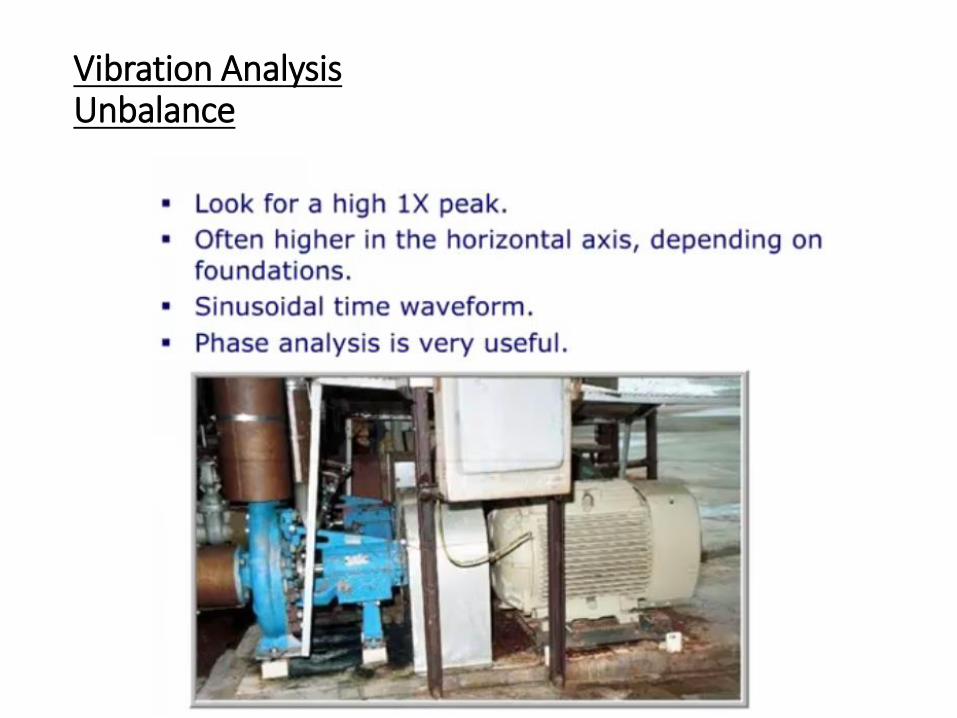
Vibration AnalysisUnbalance
Vibration AnalysisUnbalance
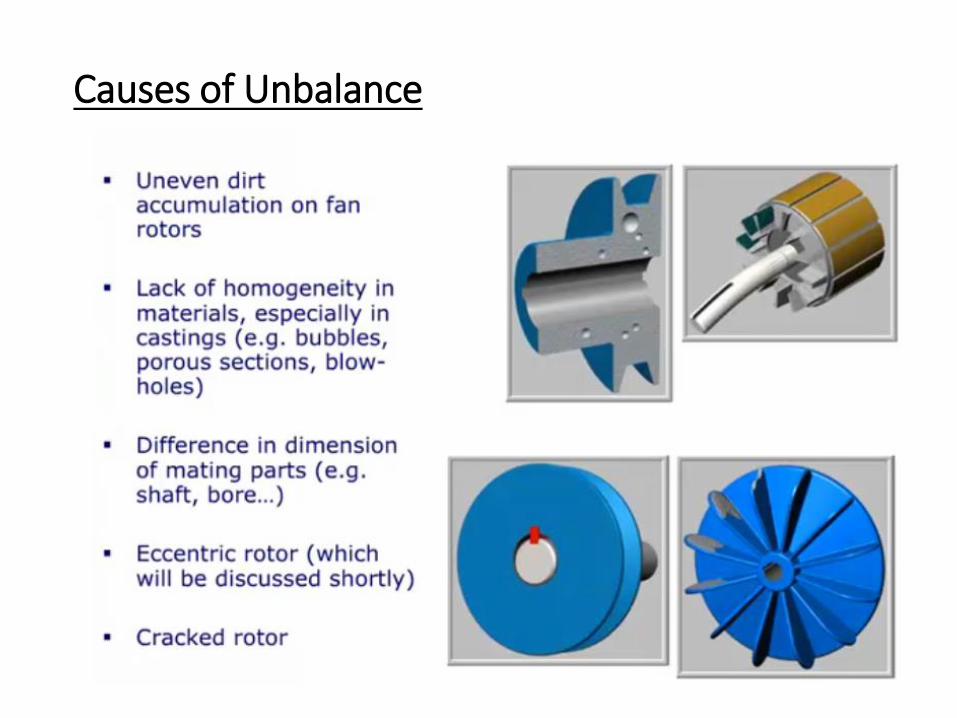
Causes of Unbalance
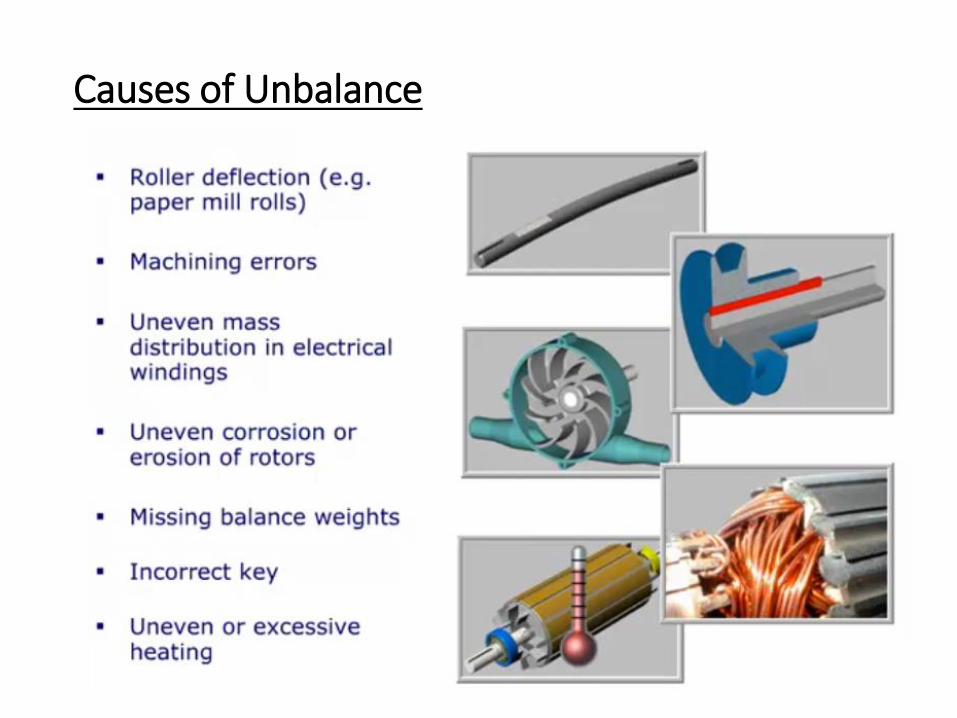
Causes of Unbalance
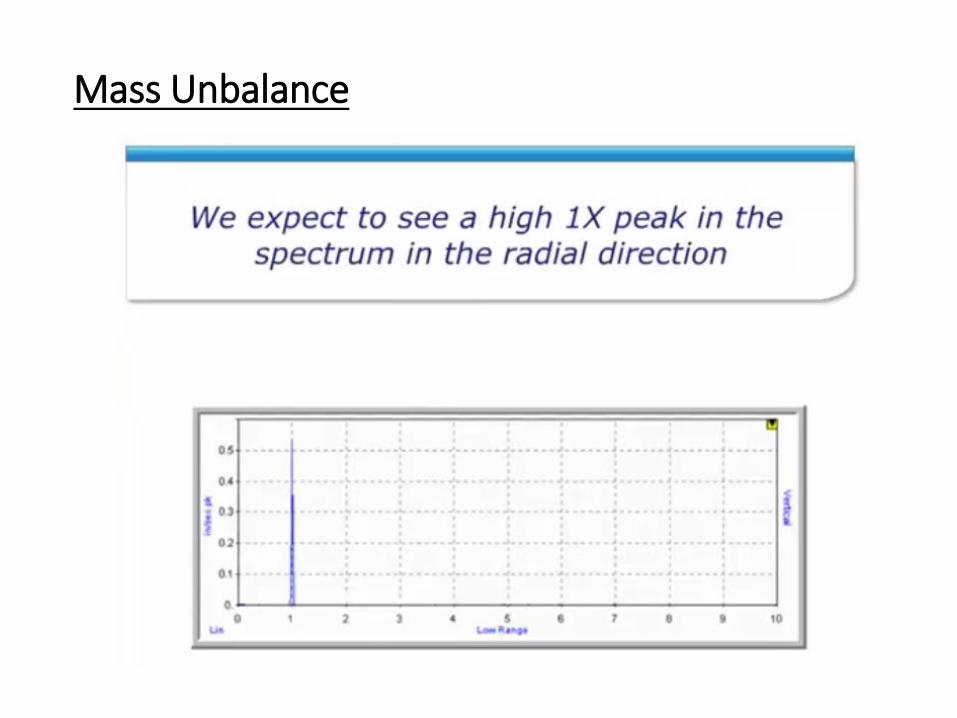
Mass Unbalance
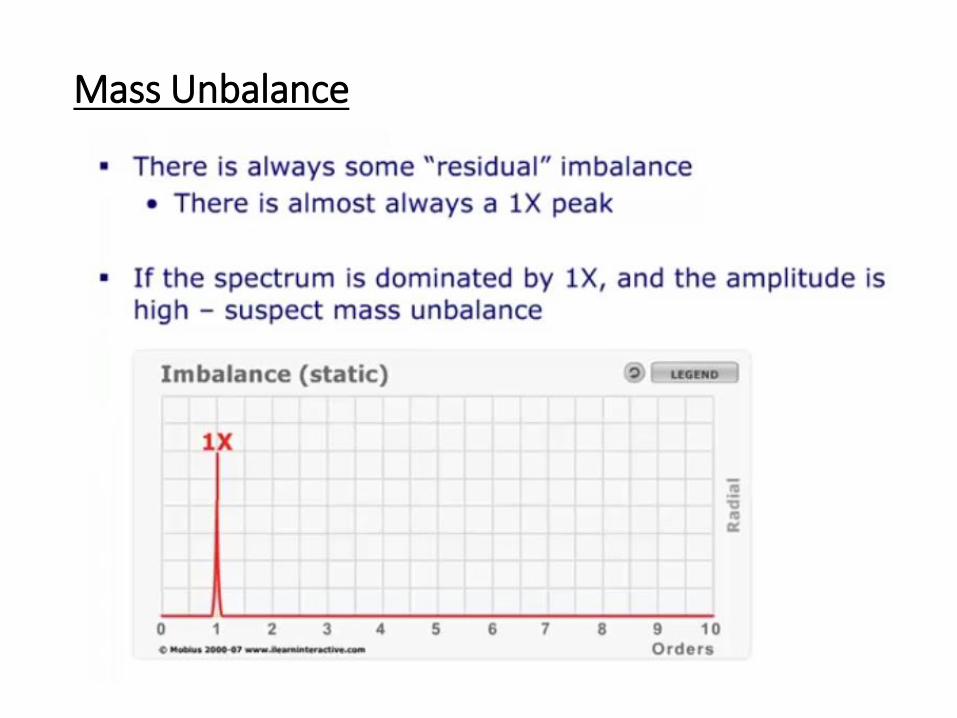
Mass Unbalance
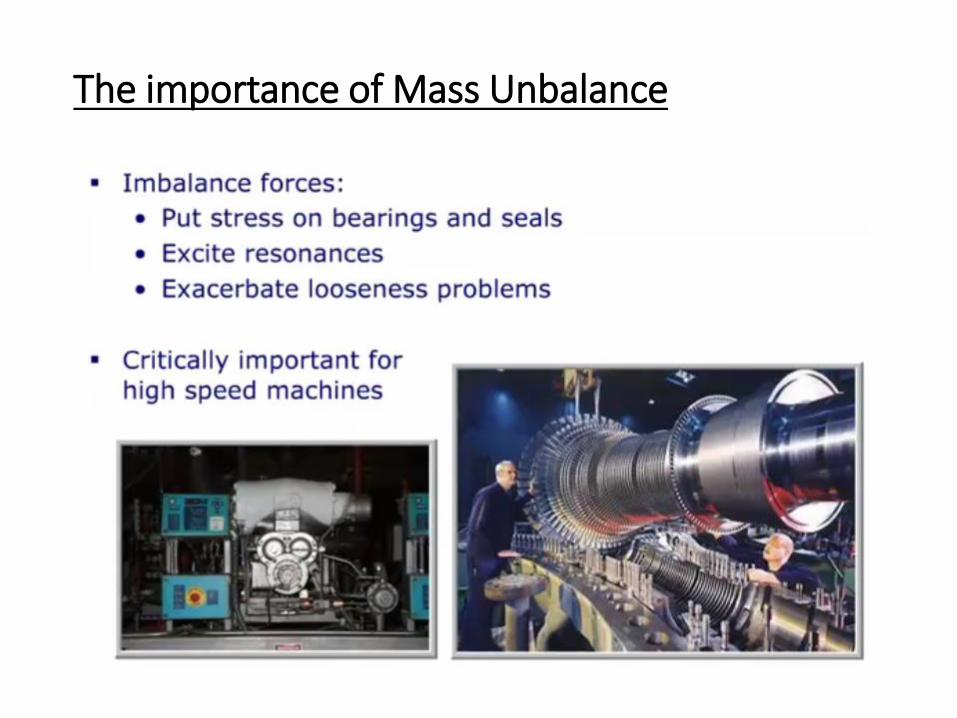
The importance of Mass Unbalance
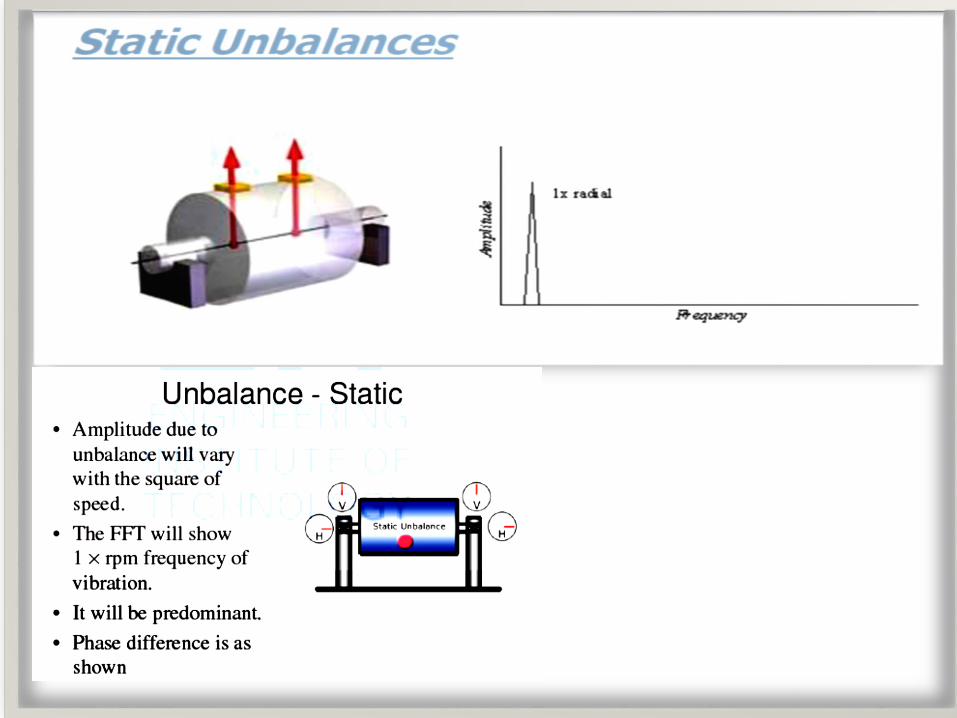
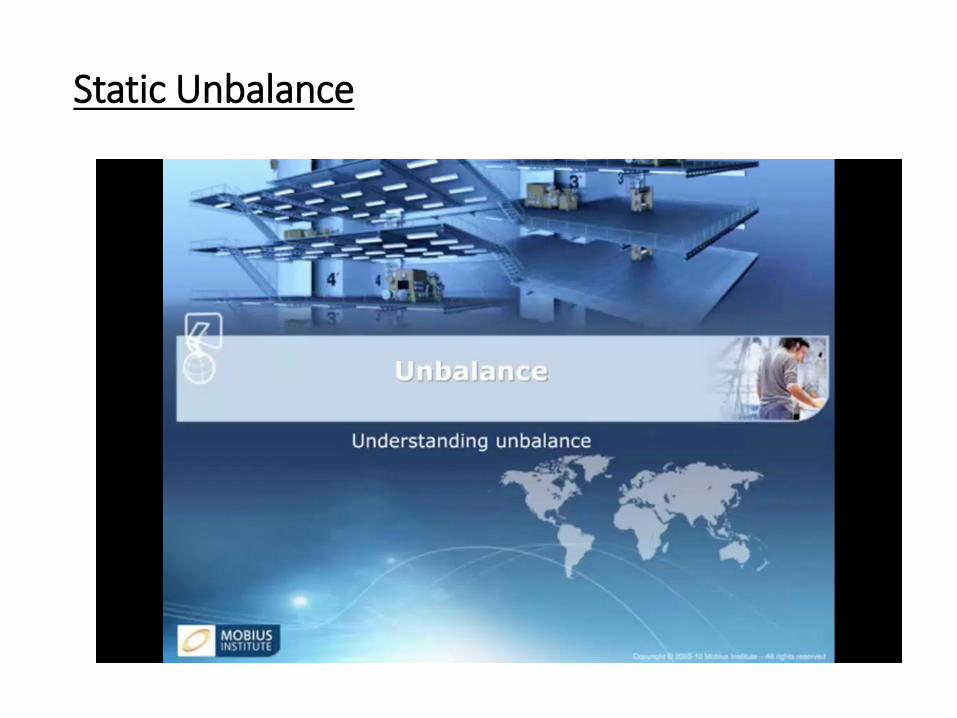
Static Unbalance
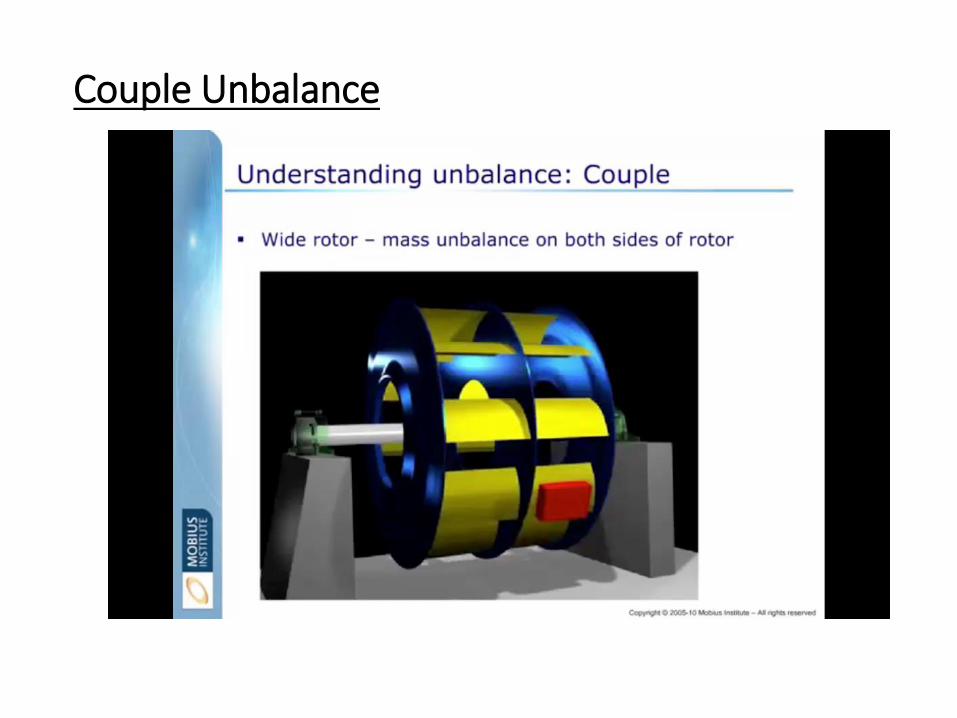
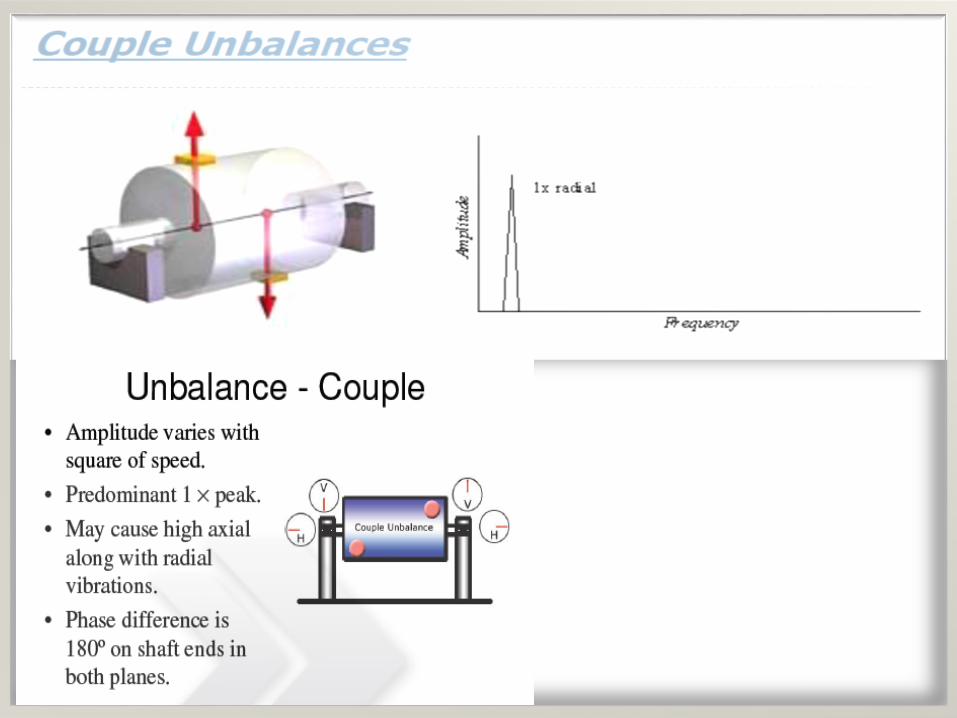
Couple Unbalance
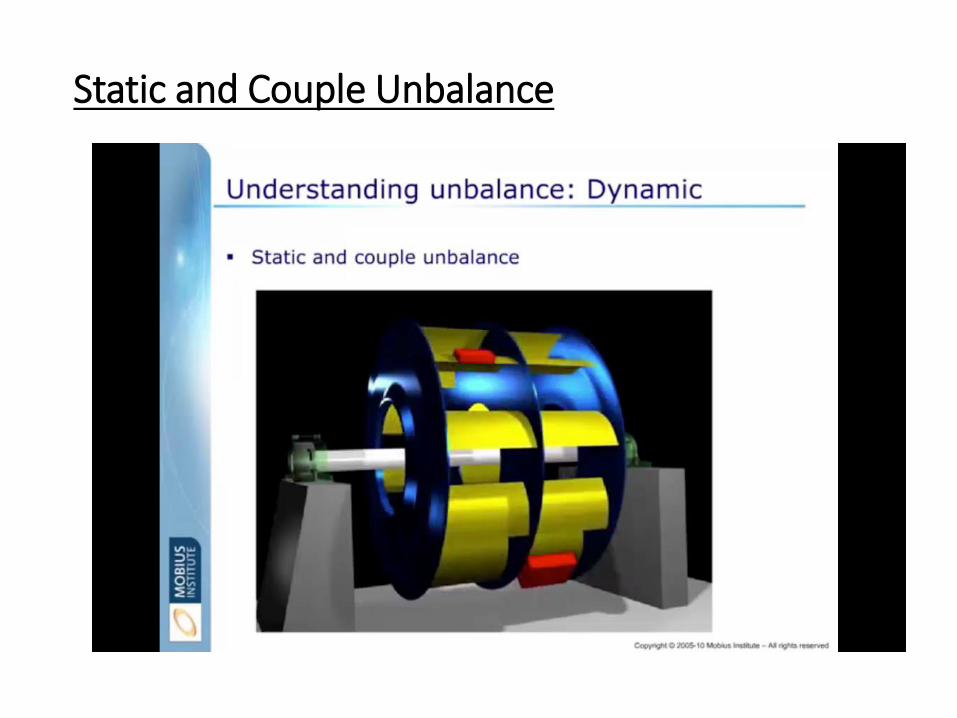
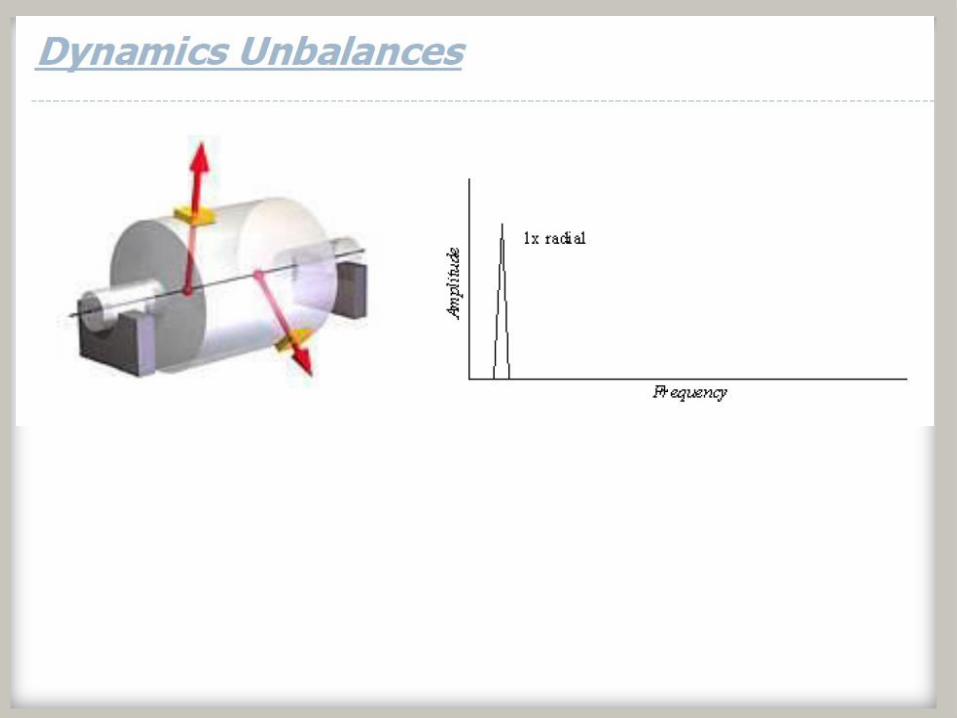
Static and Couple Unbalance
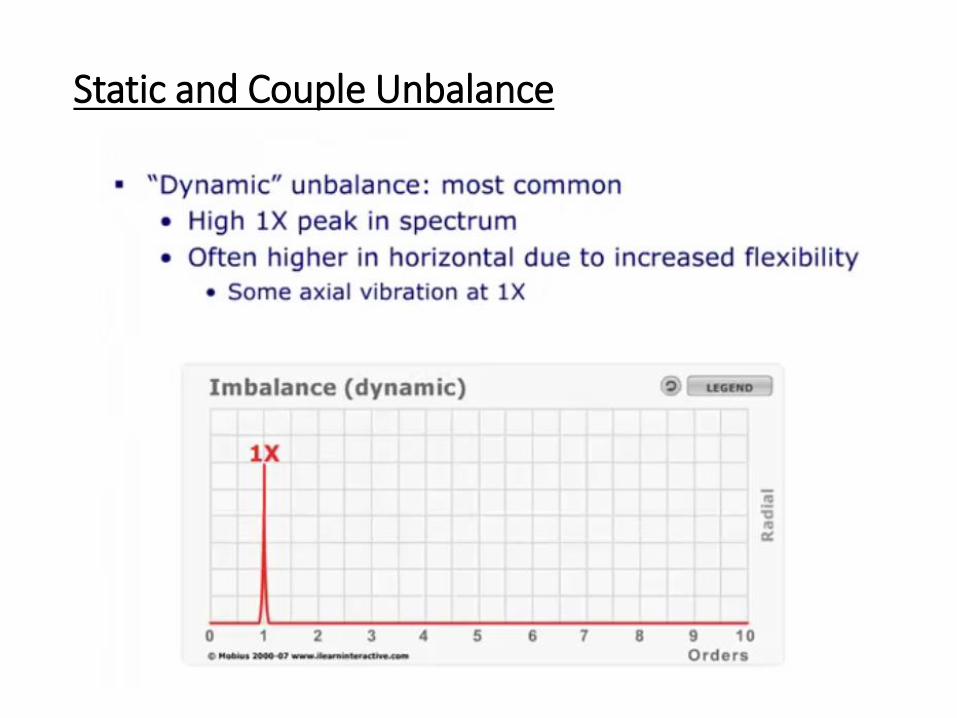
Static and Couple Unbalance
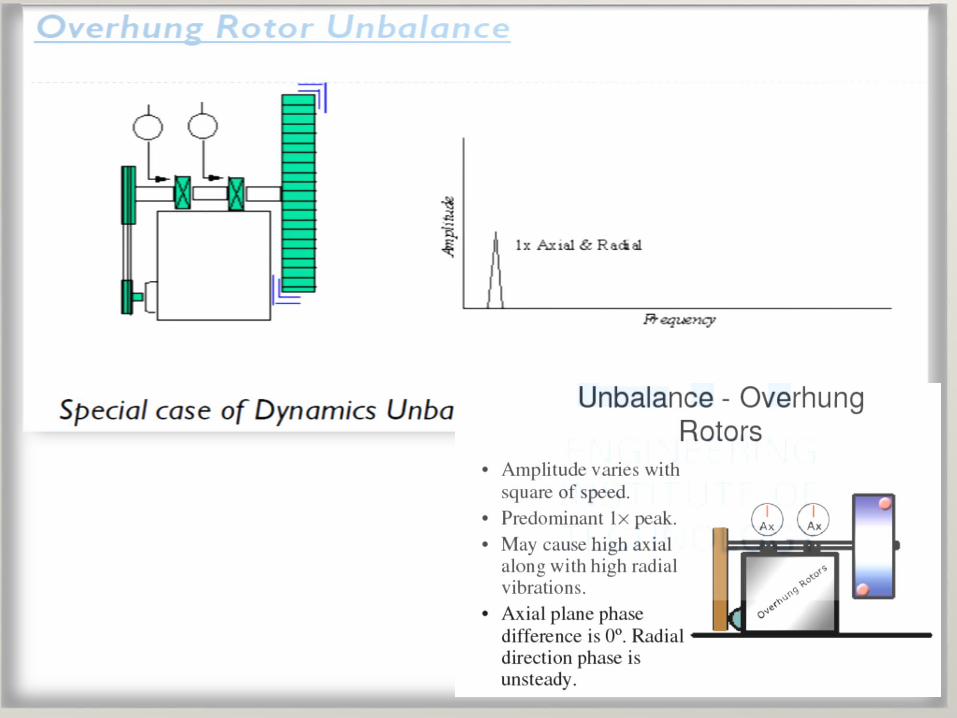
Vibration AnalysisUnbalance
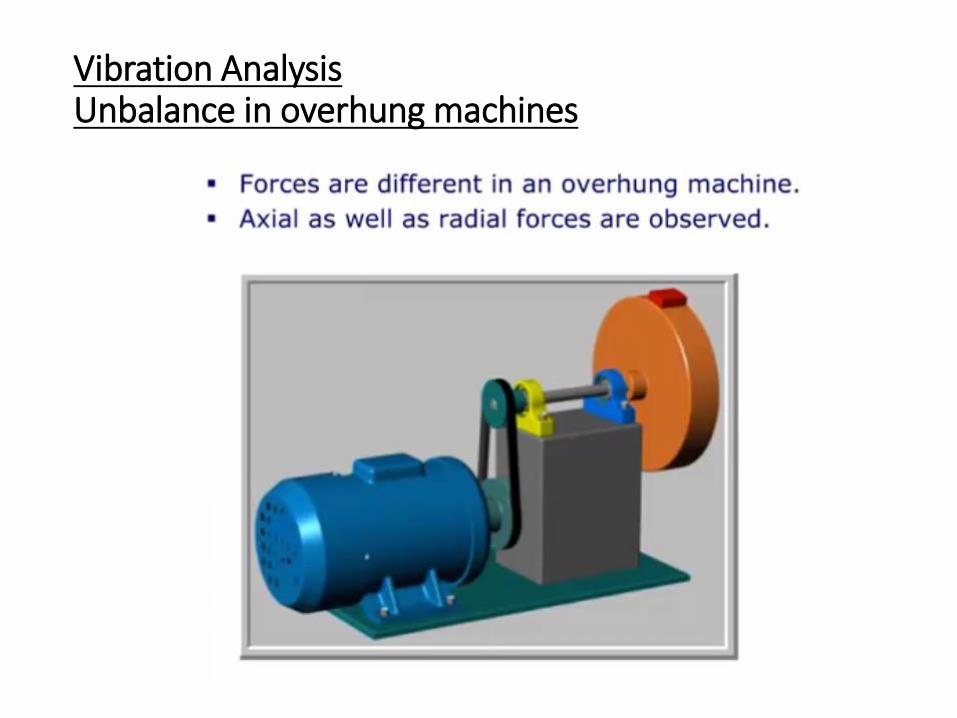
Vibration AnalysisUnbalance in overhung machines
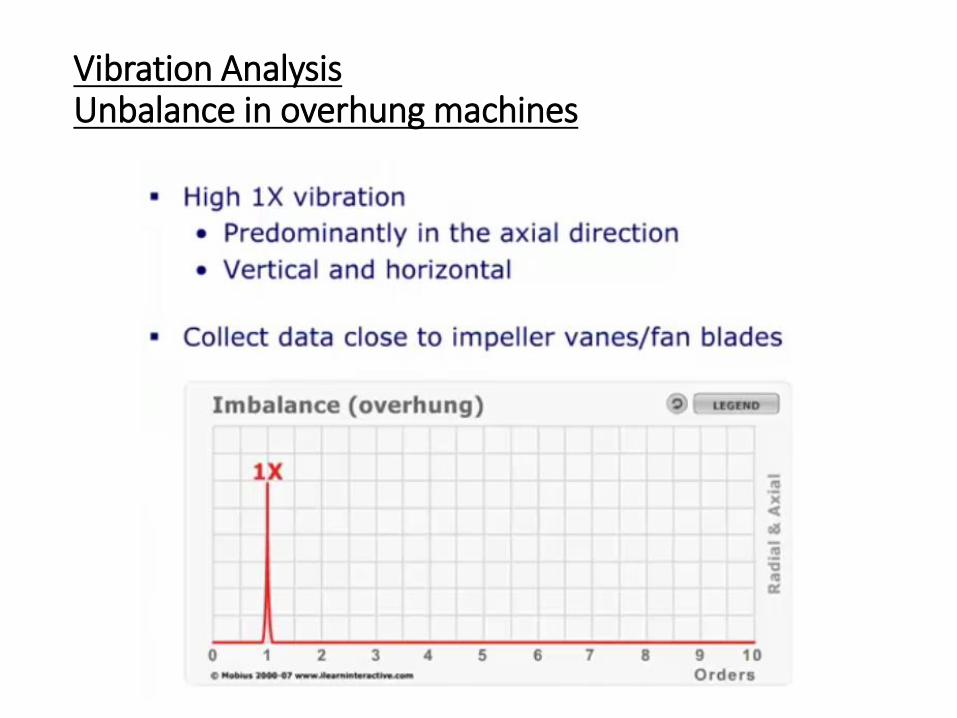
Vibration AnalysisUnbalance in overhung machines
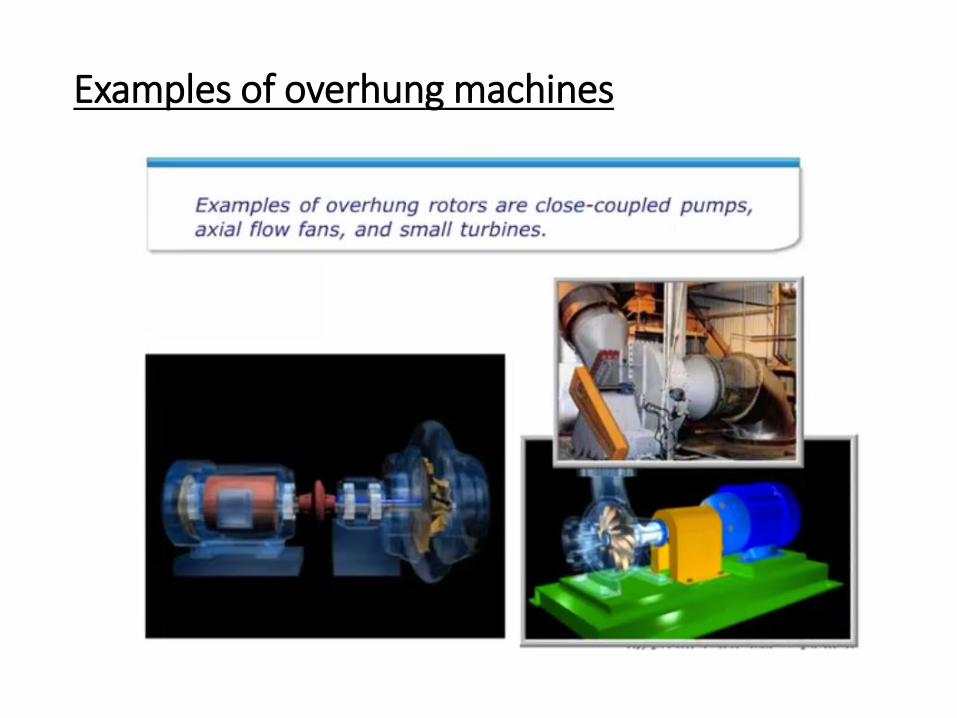
Examples of overhung machines
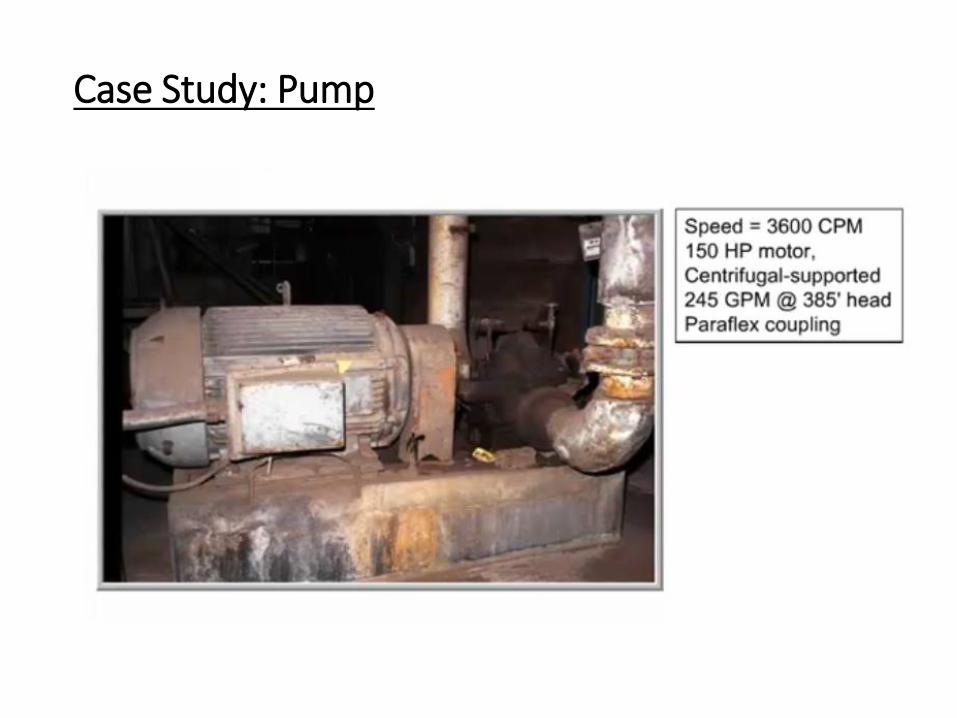
Case Study: Pump
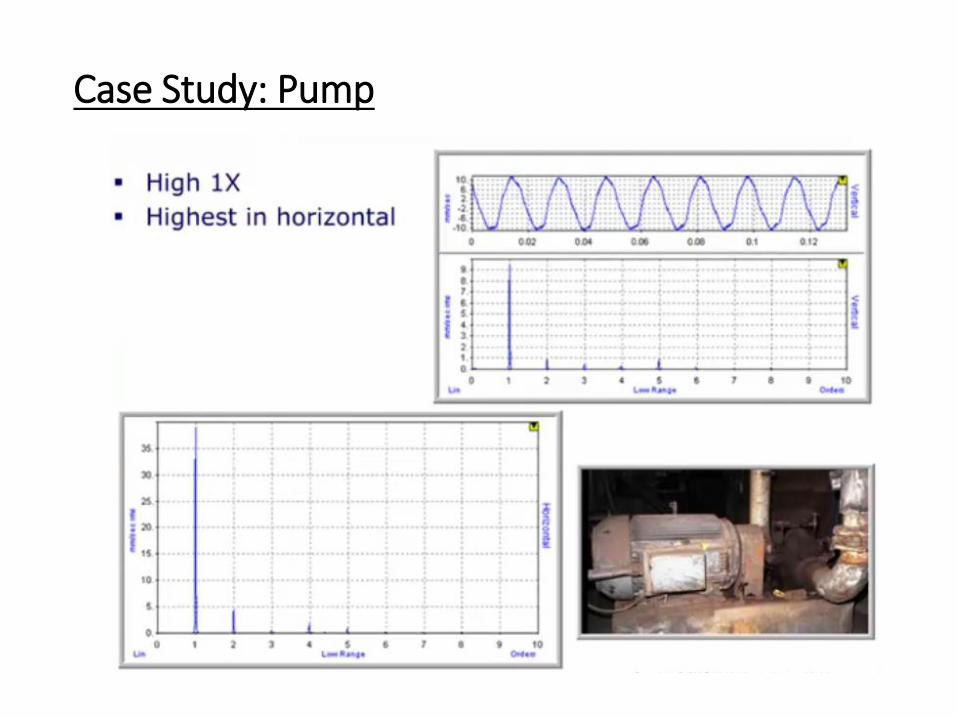
Case Study: Pump
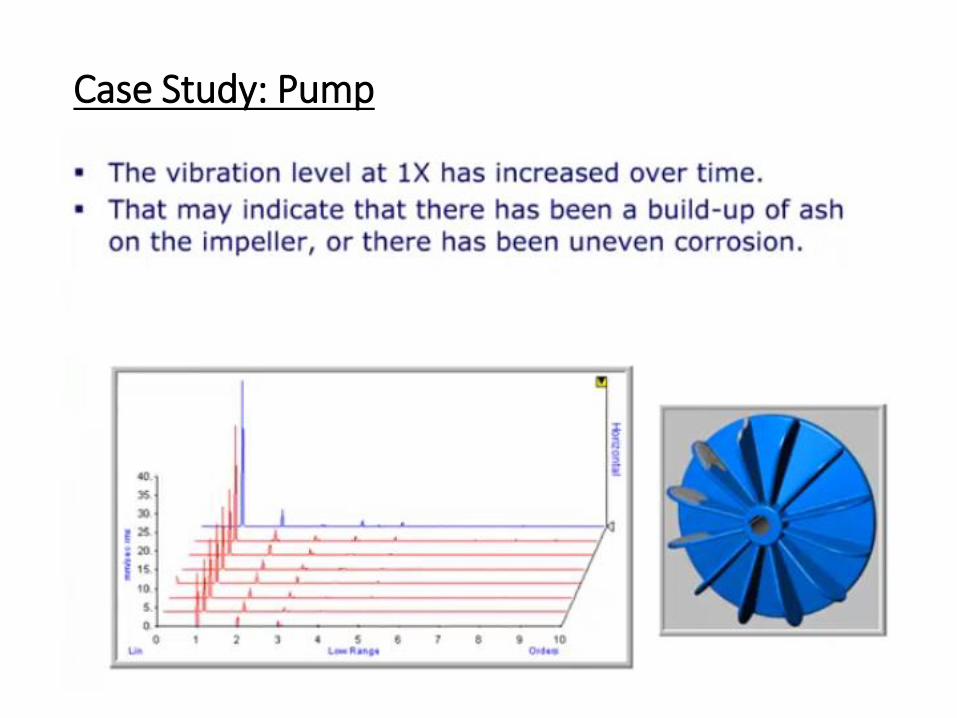
Case Study: Pump
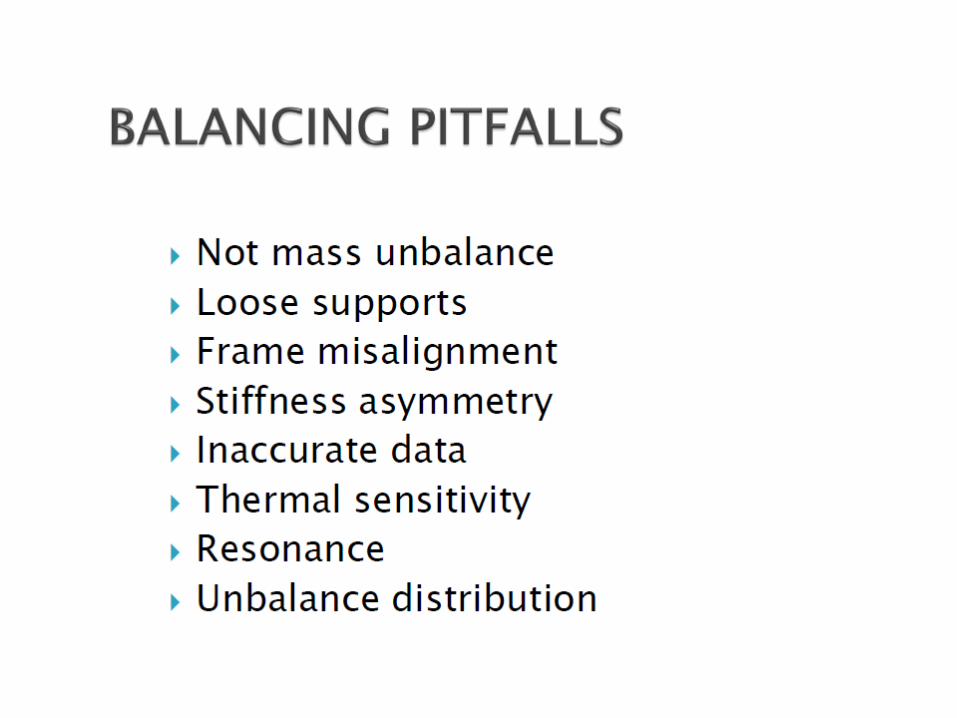
Balancing
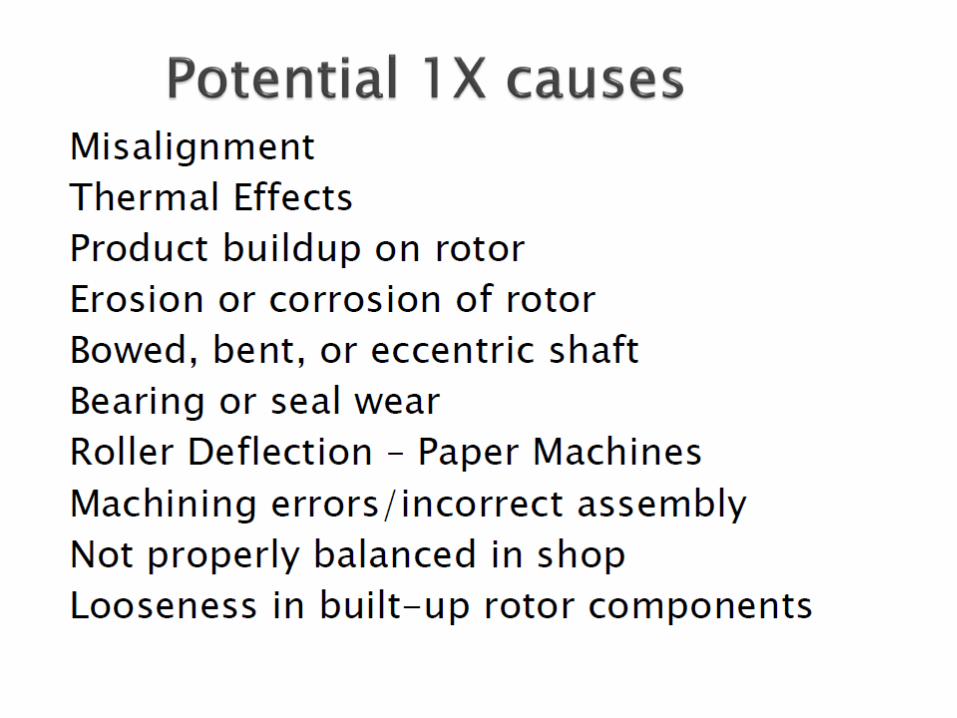
Balancing
Balancing
Balancing
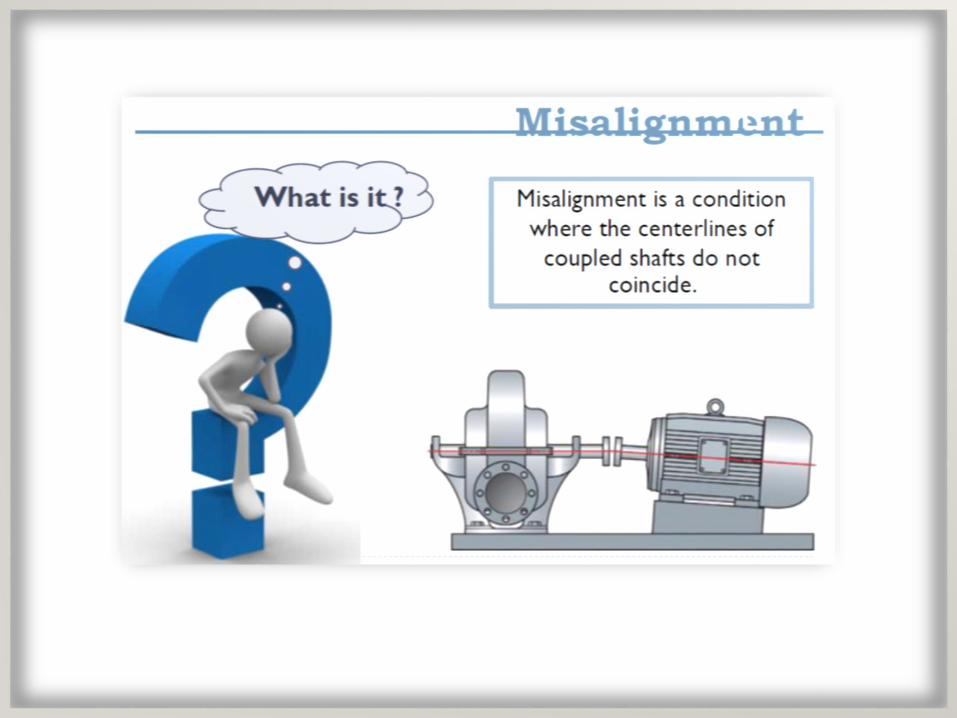
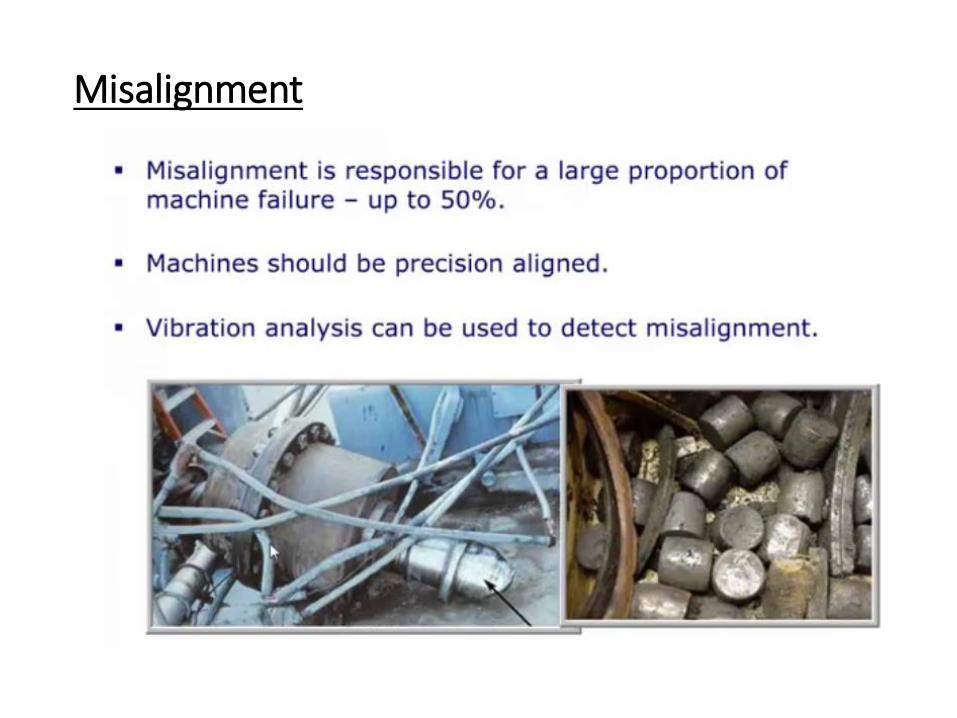
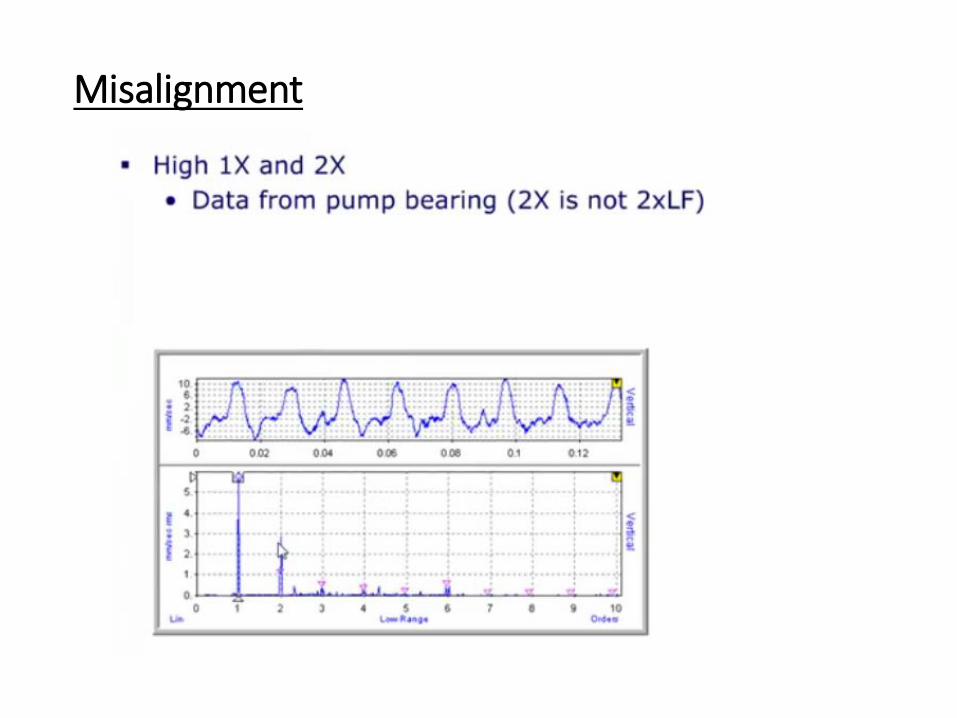
Misalignment
Misalignment
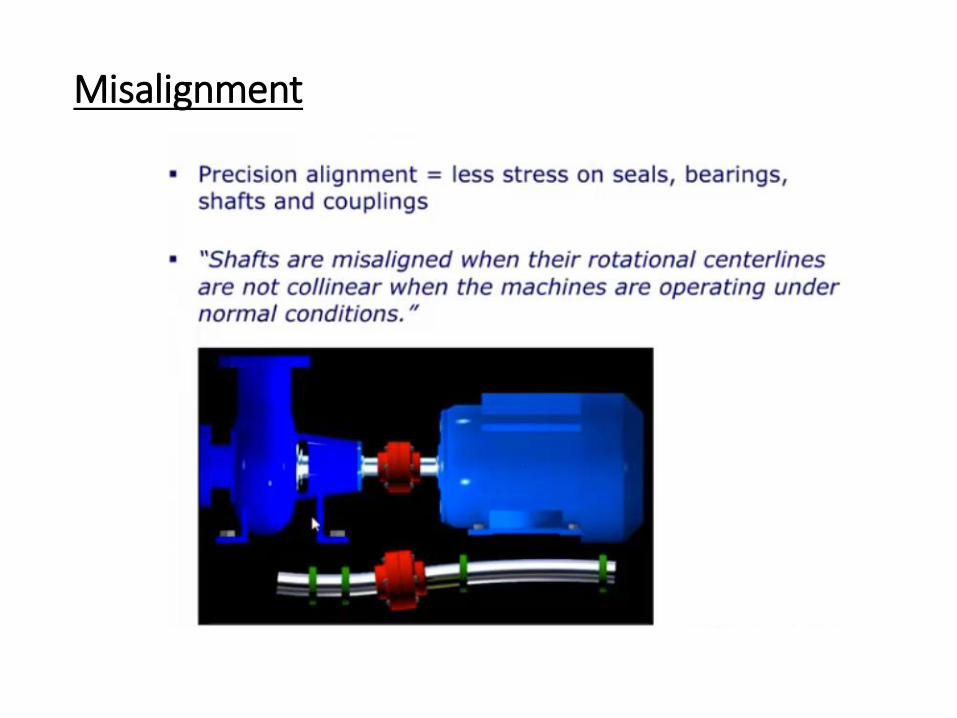
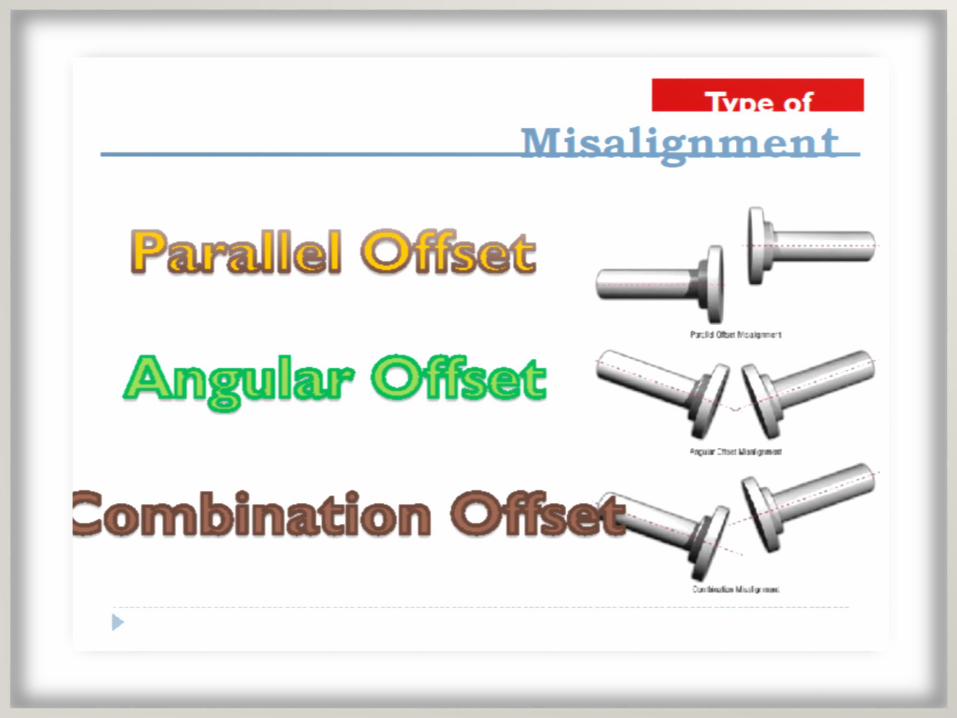
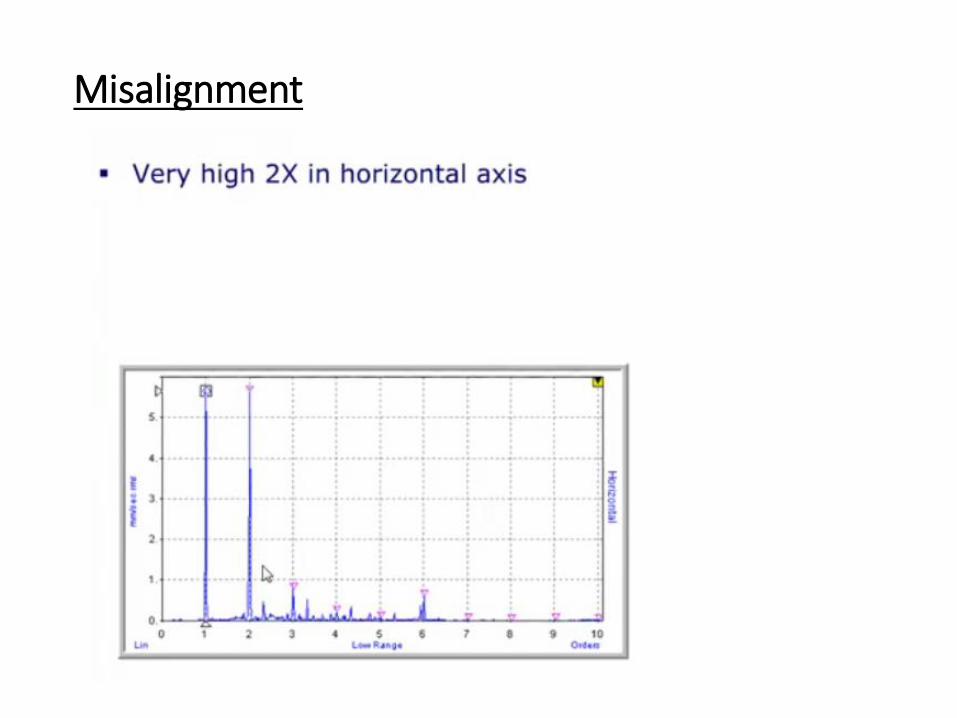
Misalignment
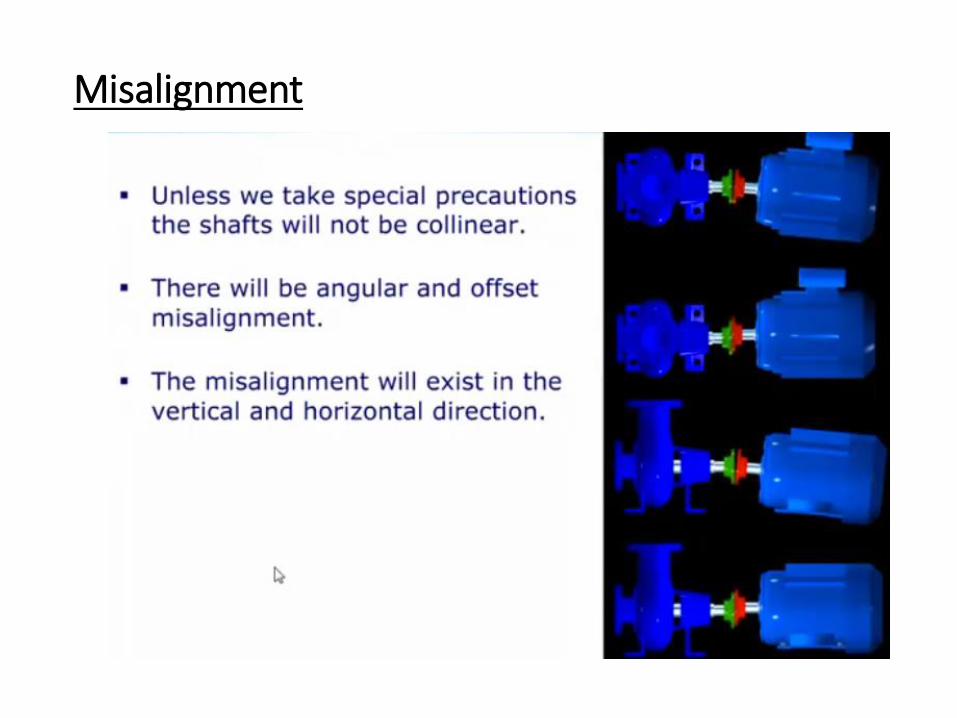
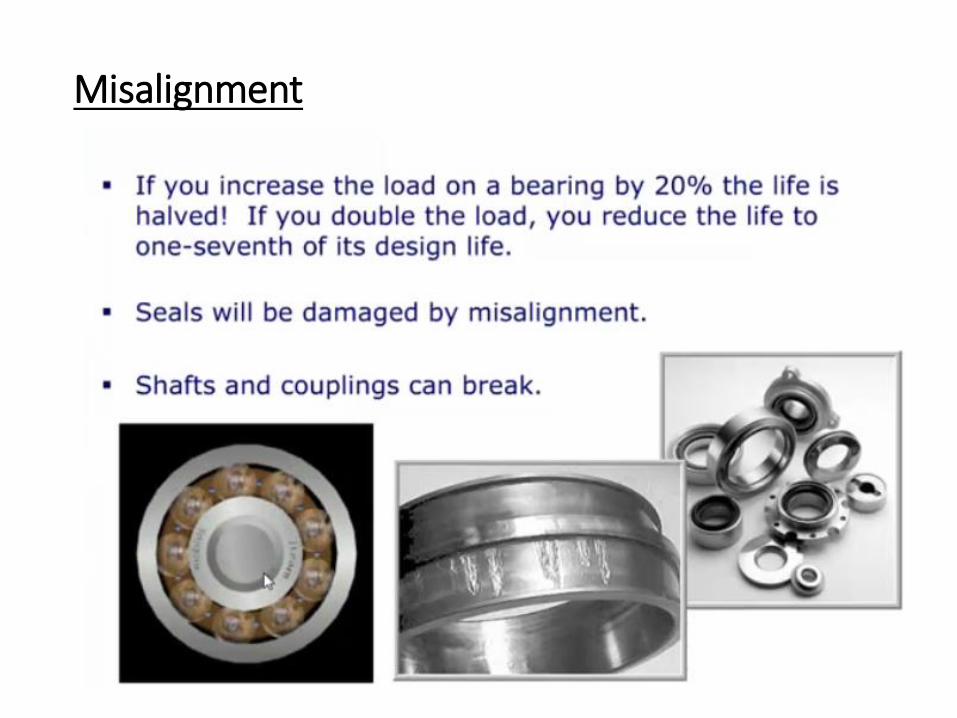
Misalignment
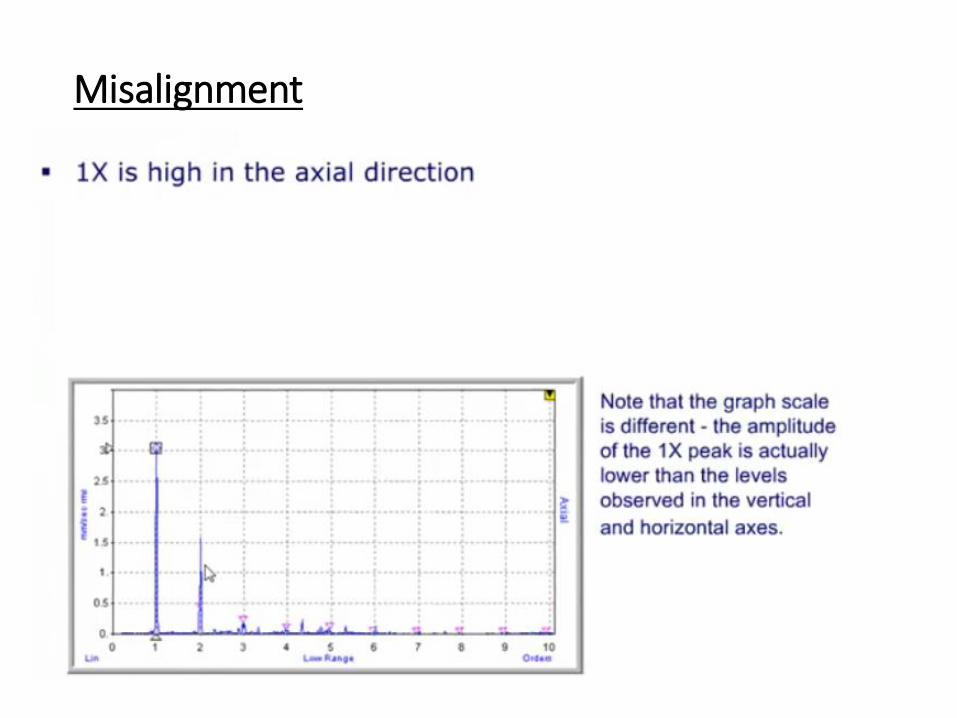
Misalignment
Misalignment
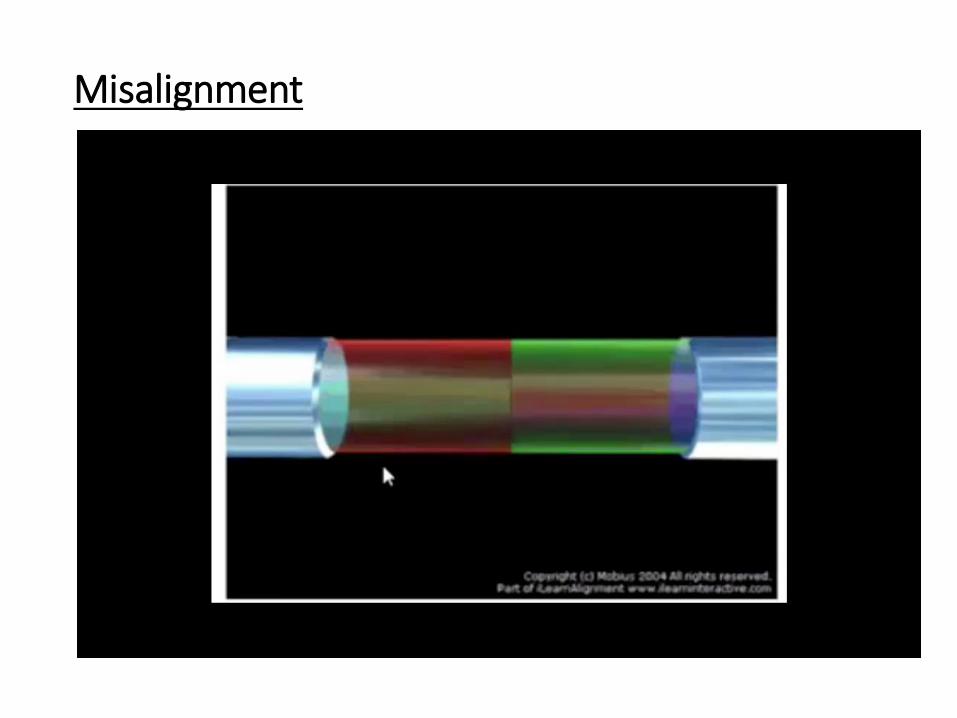
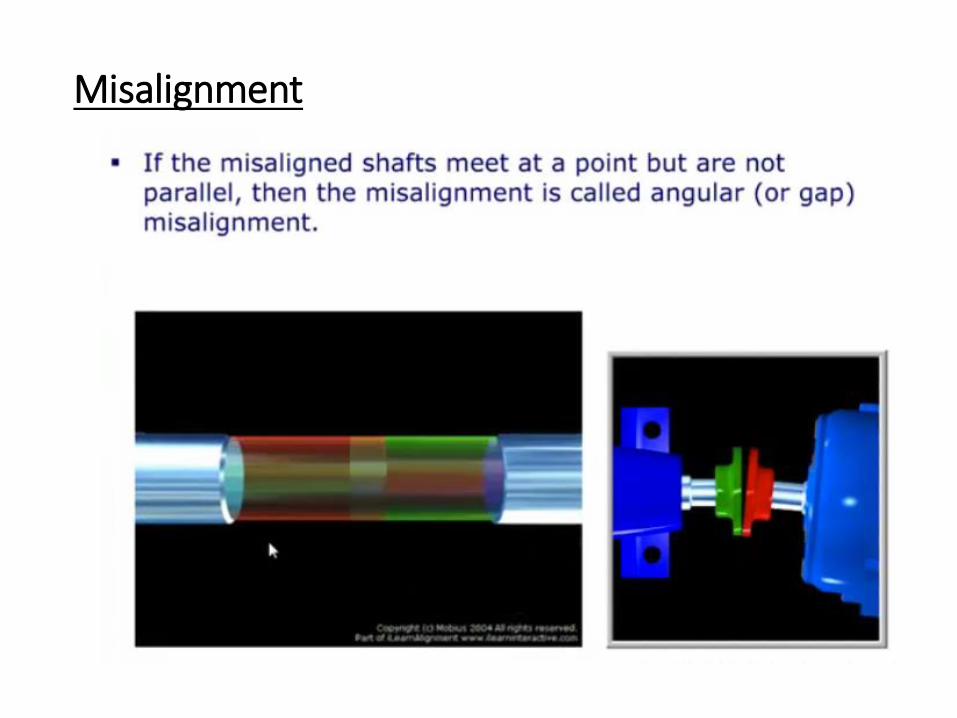
Misalignment
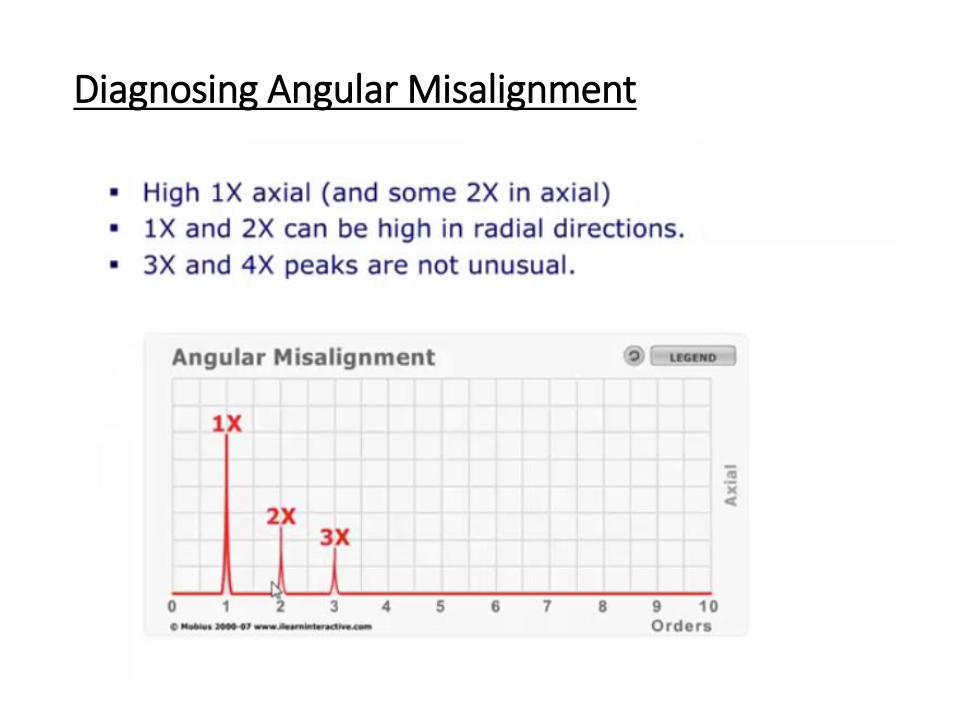
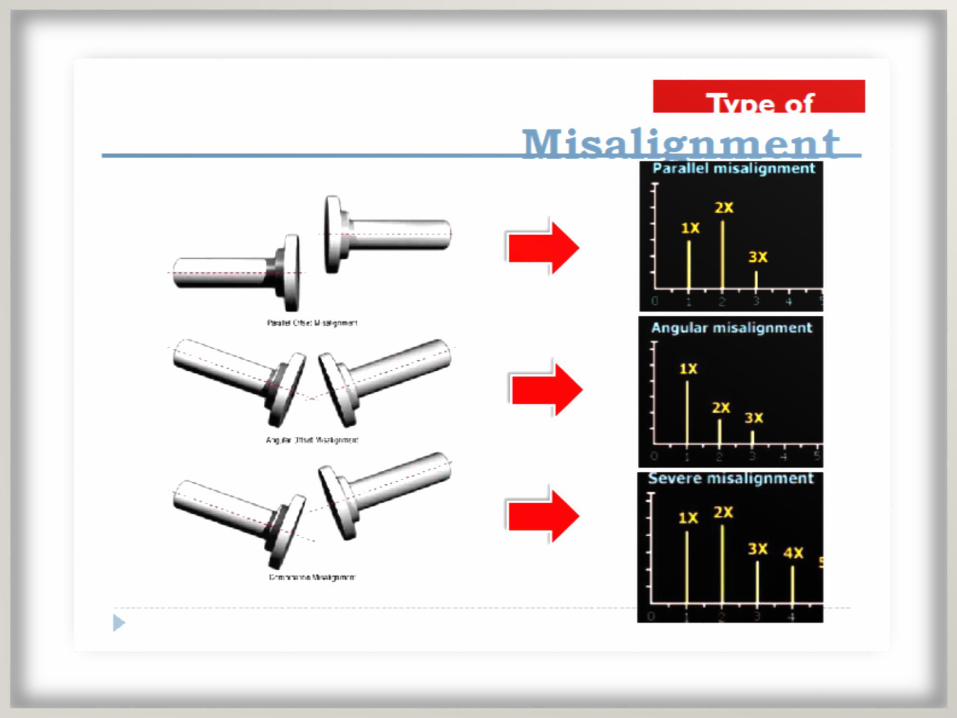
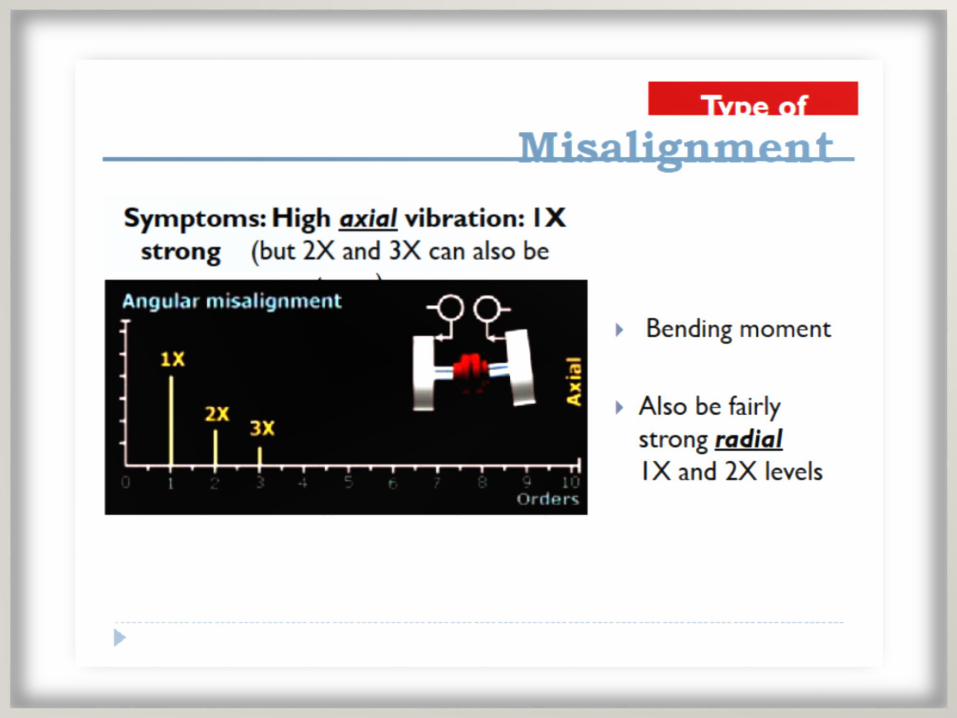
Diagnosing Angular Misalignment
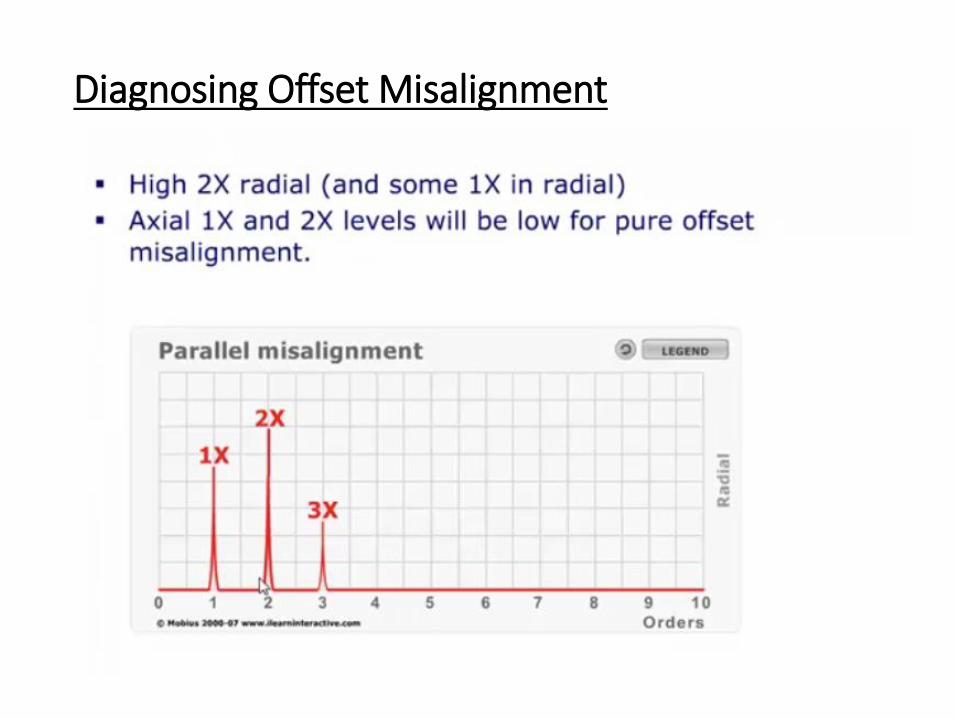
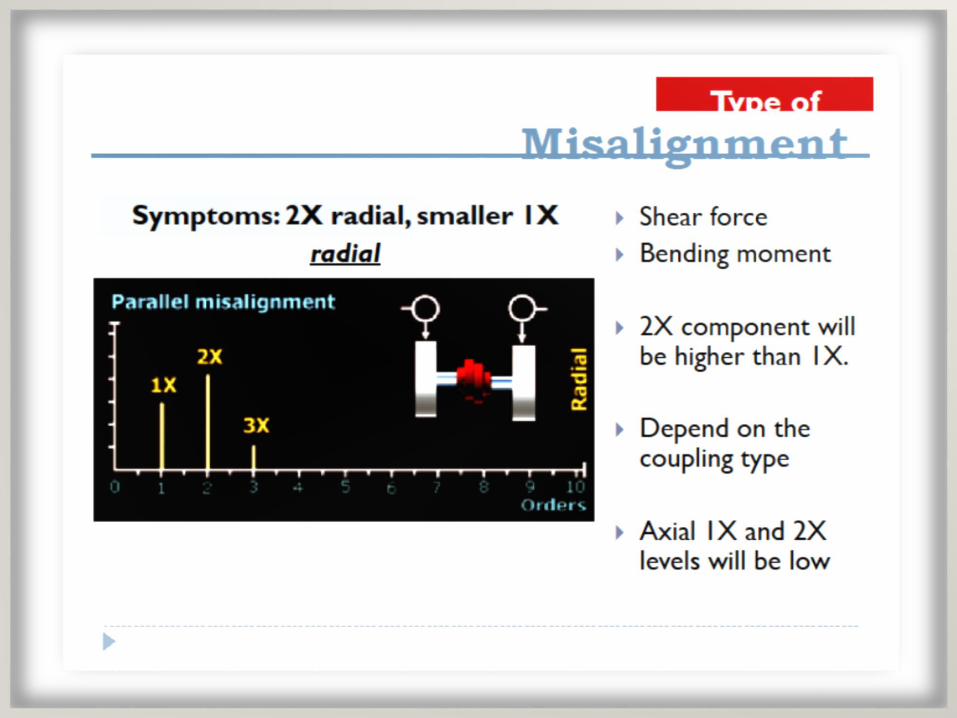
Diagnosing Offset Misalignment
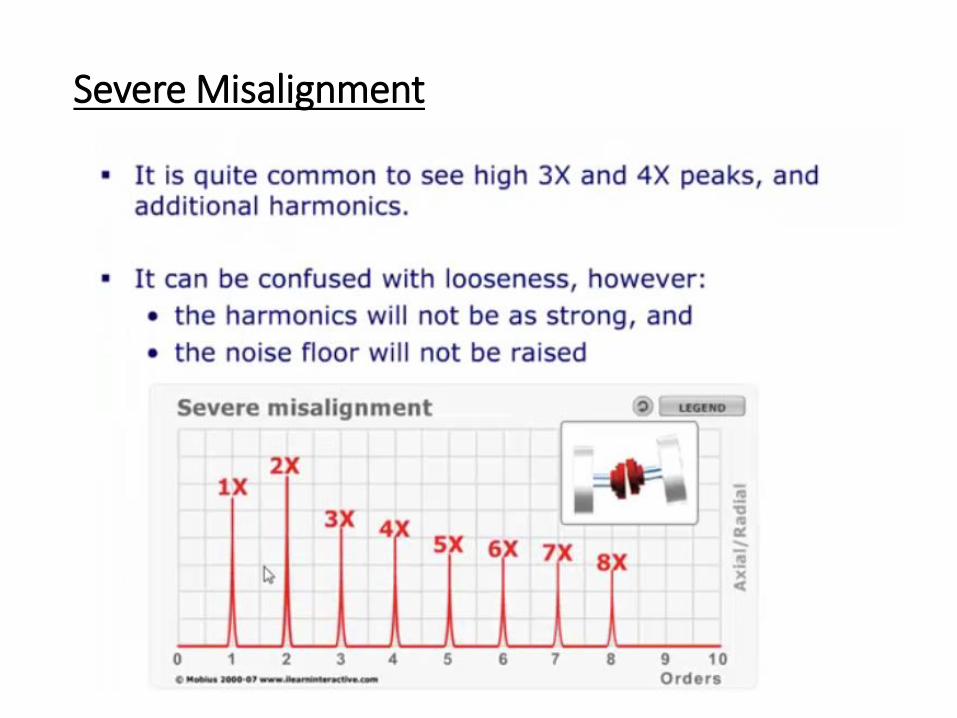
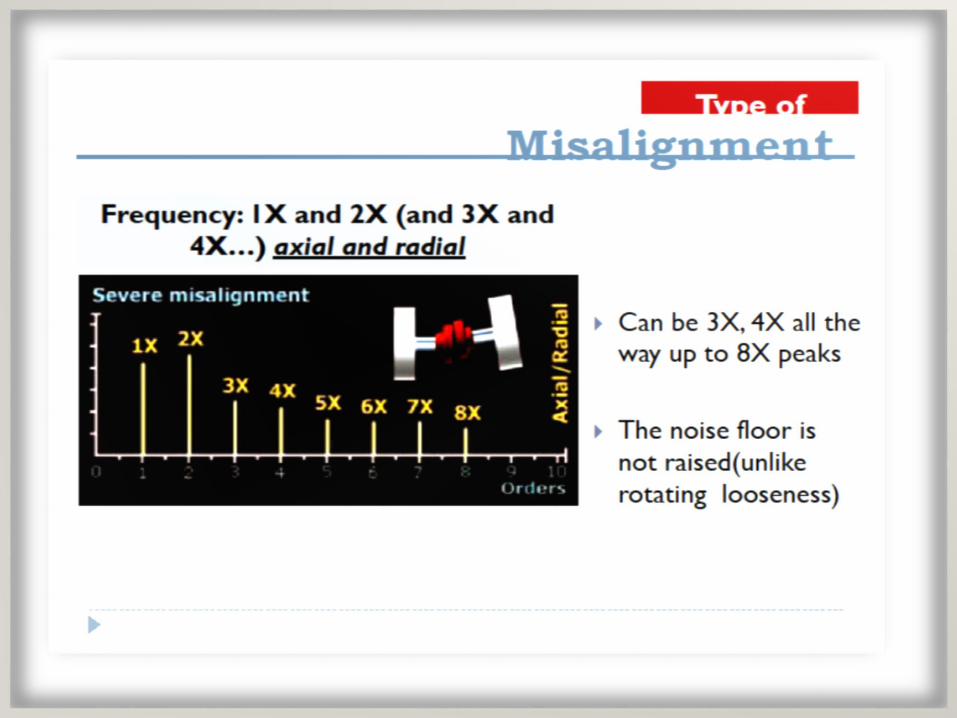
Severe Misalignment
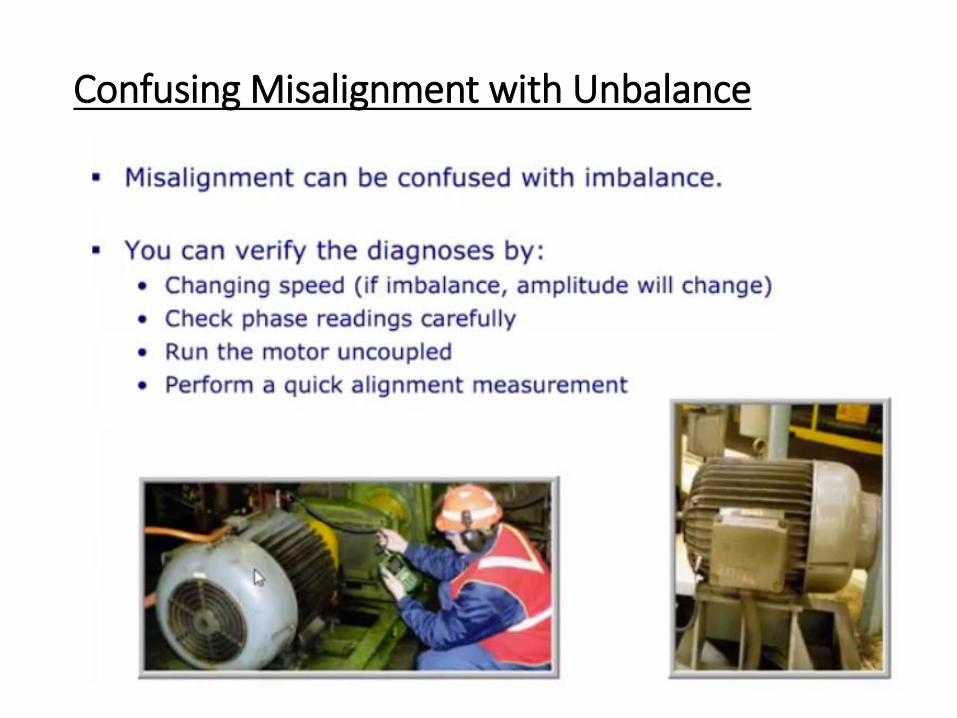
Confusing Misalignment with Unbalance
Misalignment
Misalignment
Misalignment
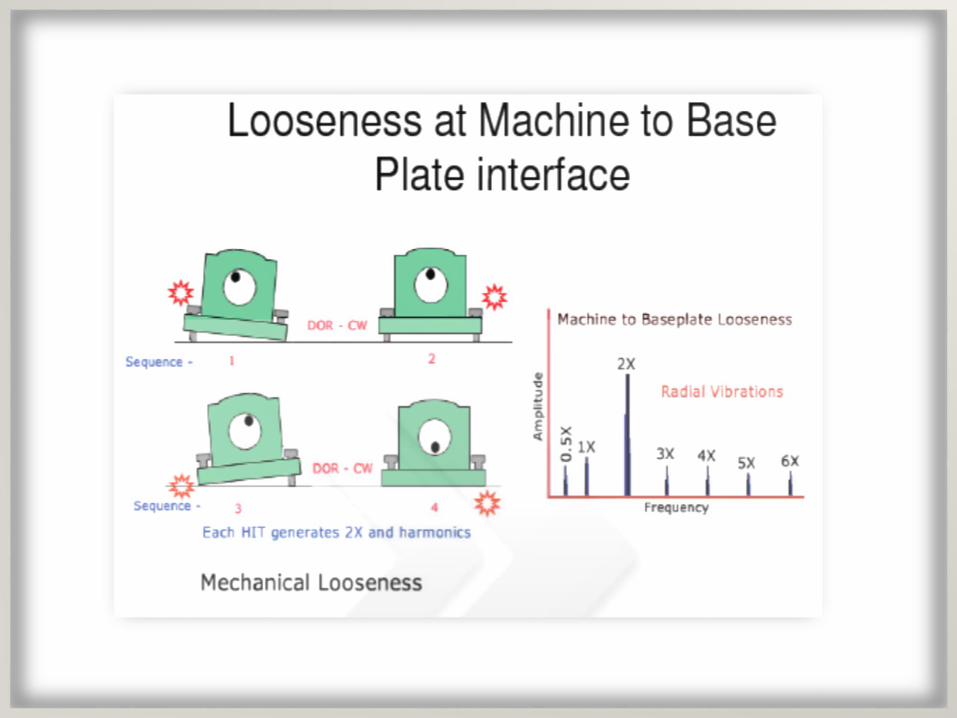
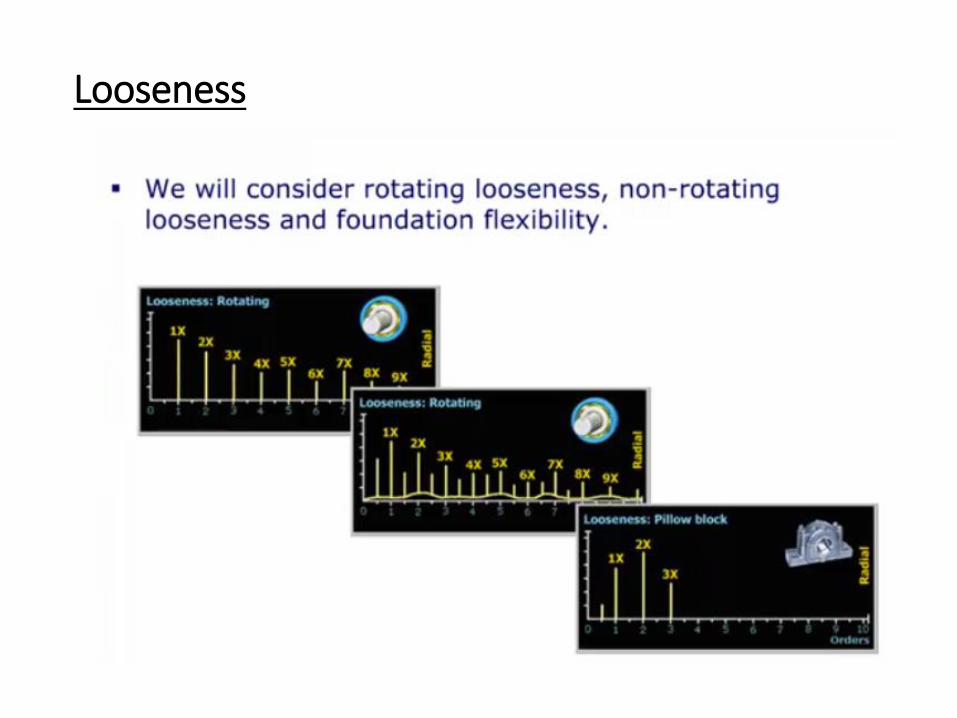
Looseness
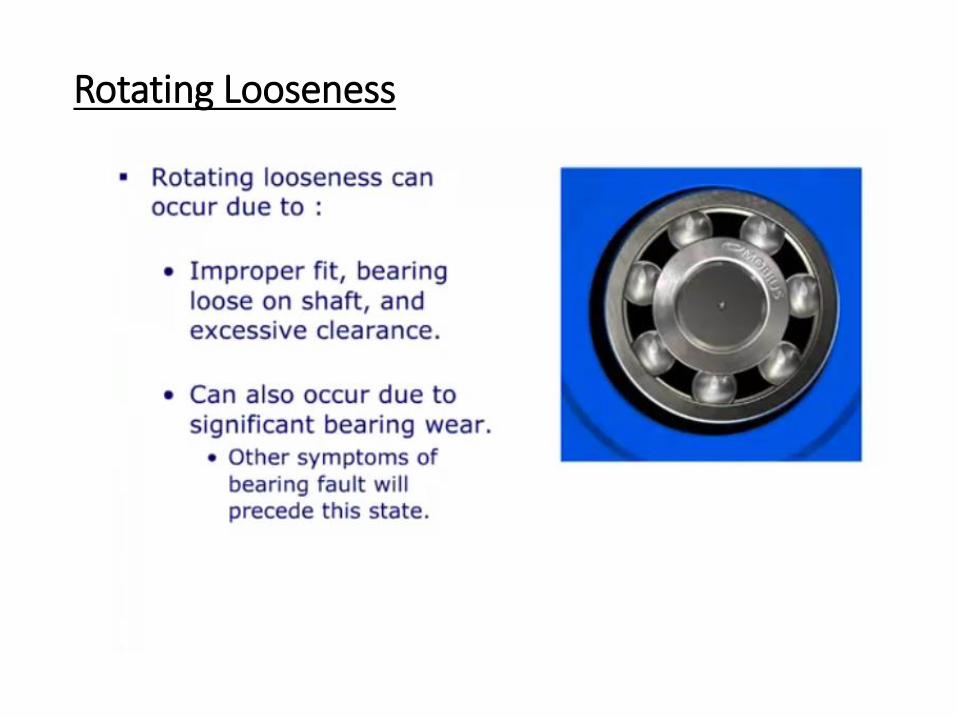
Rotating Looseness
Rotating Looseness
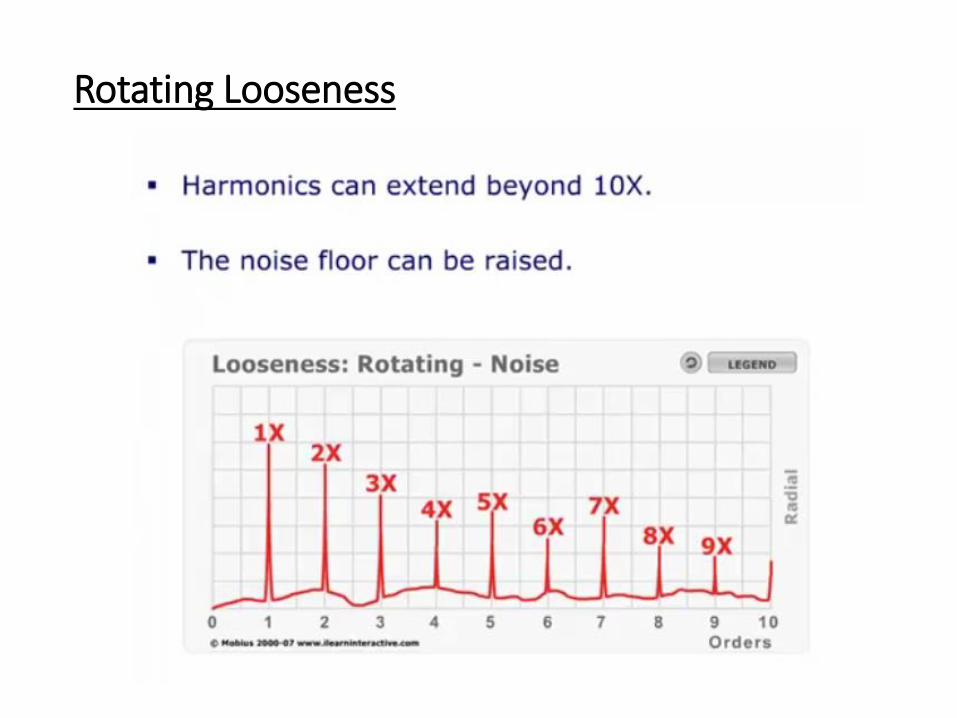
Rotating Looseness
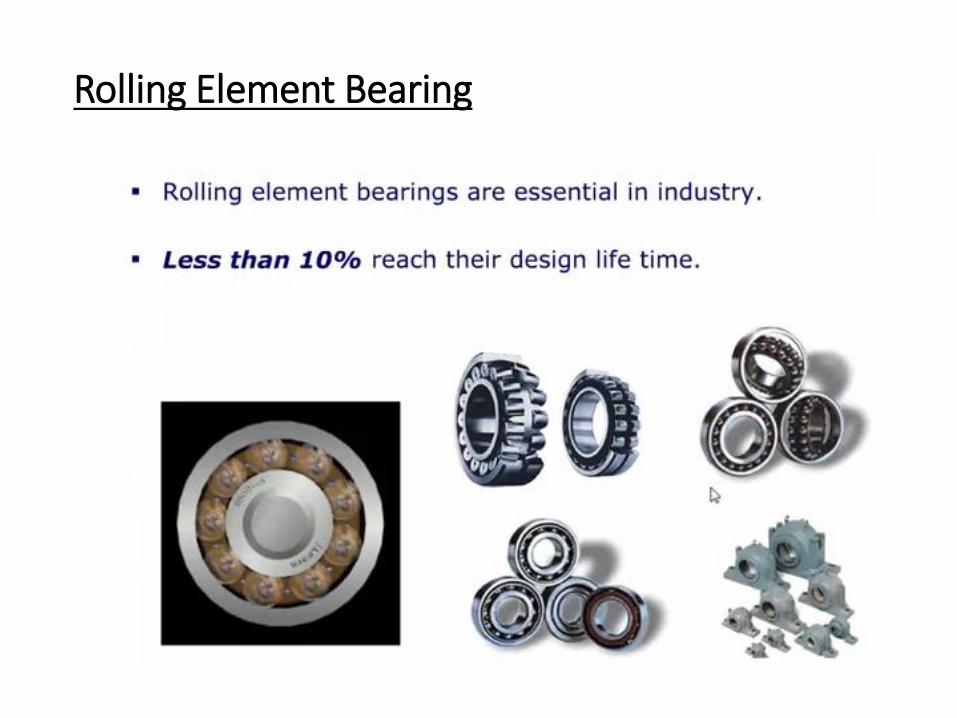
Rolling Element Bearing
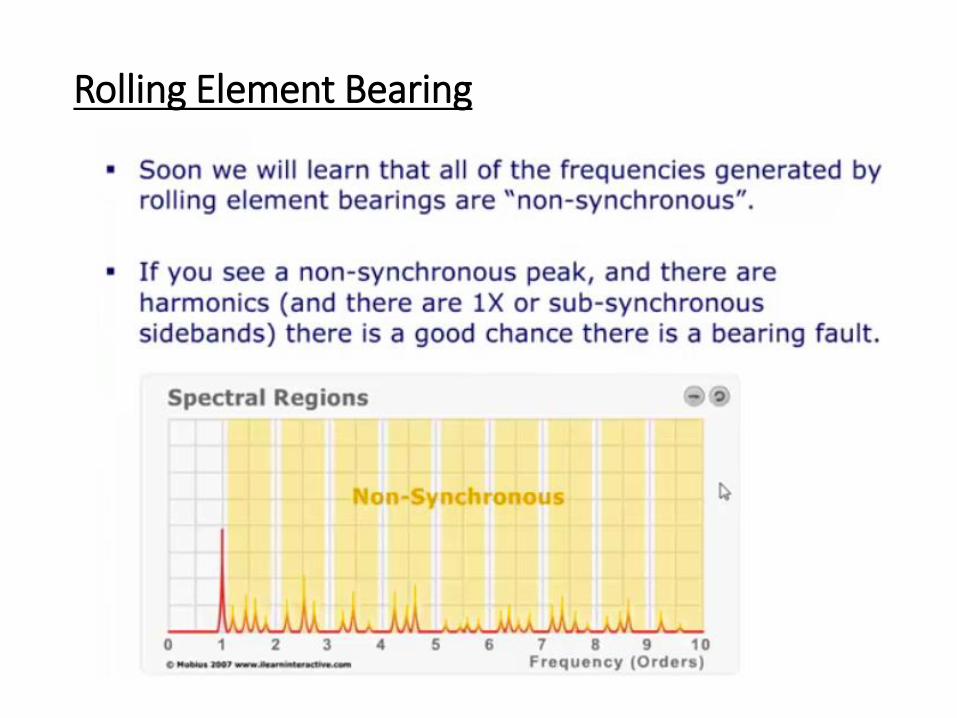
Rolling Element Bearing
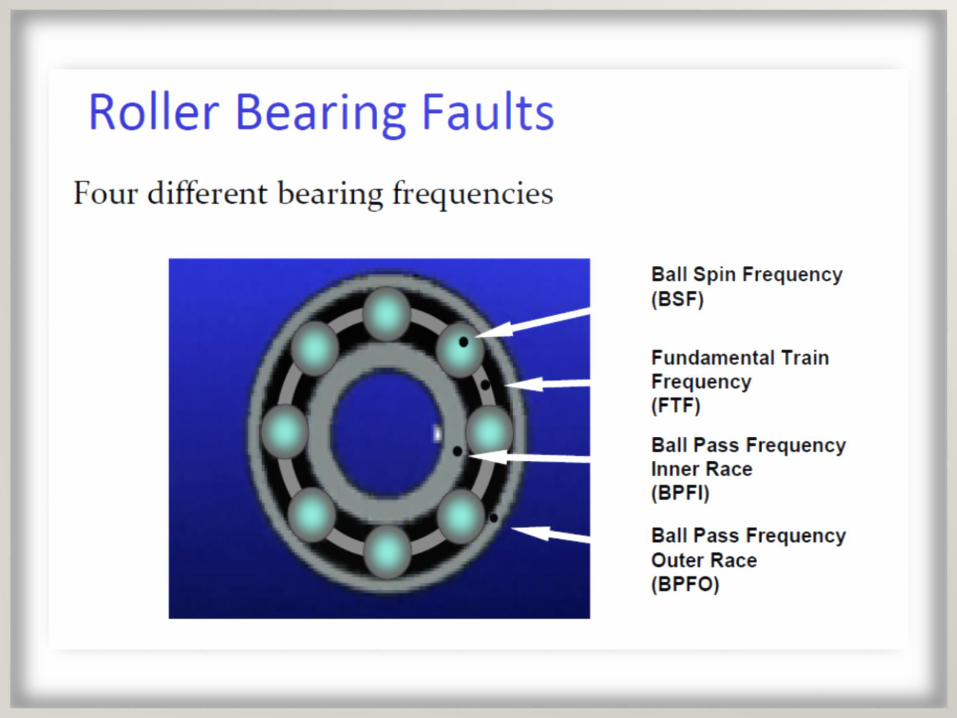
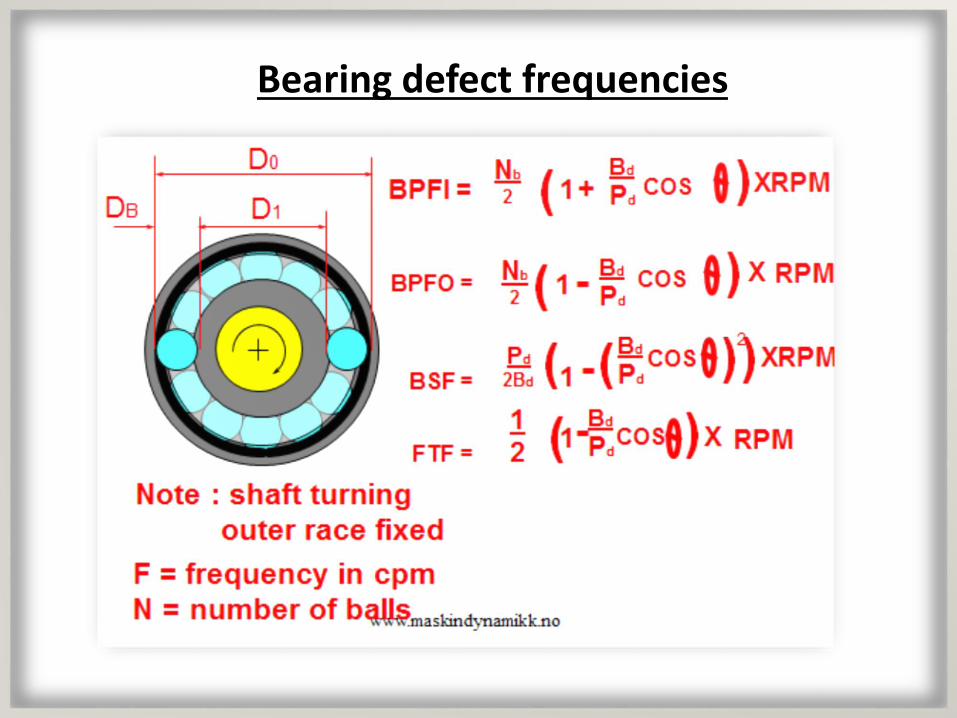
Bearing defect frequencies
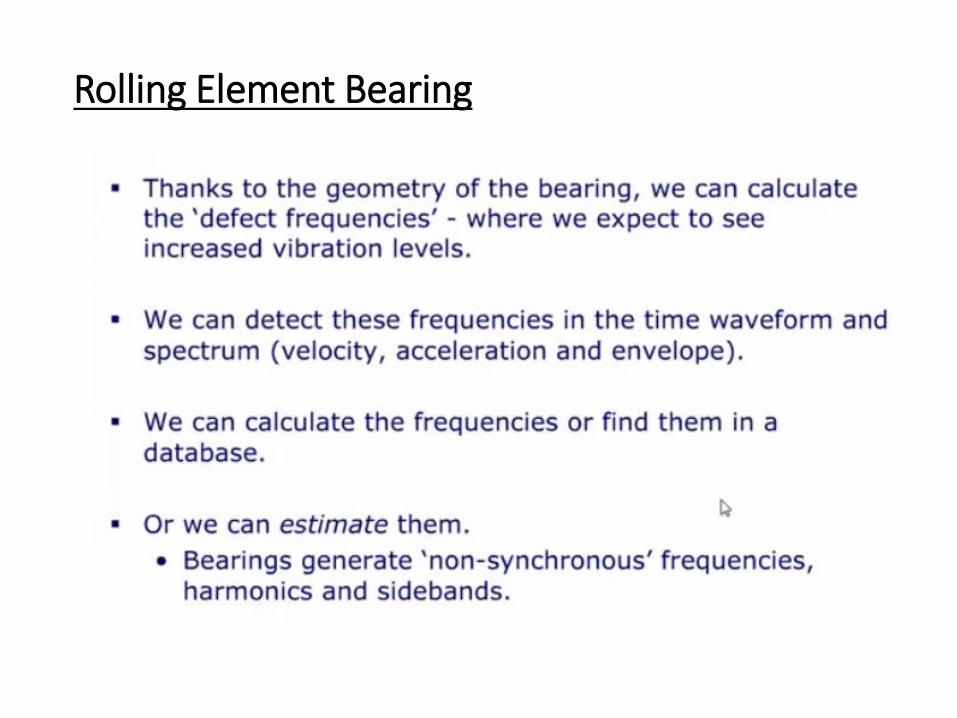
Rolling Element Bearing
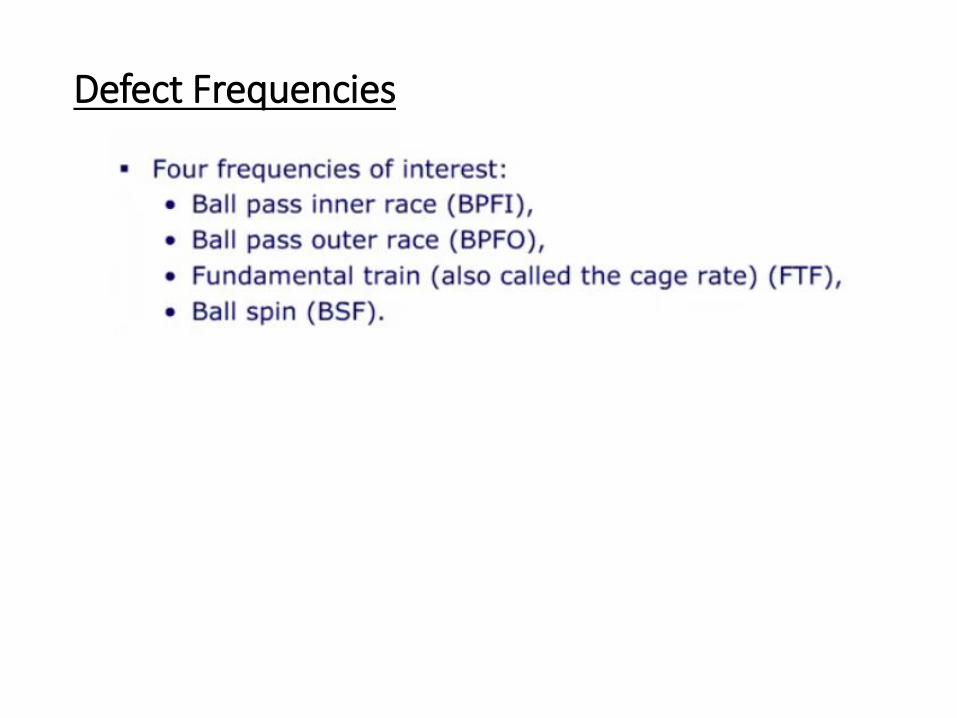
Defect Frequencies
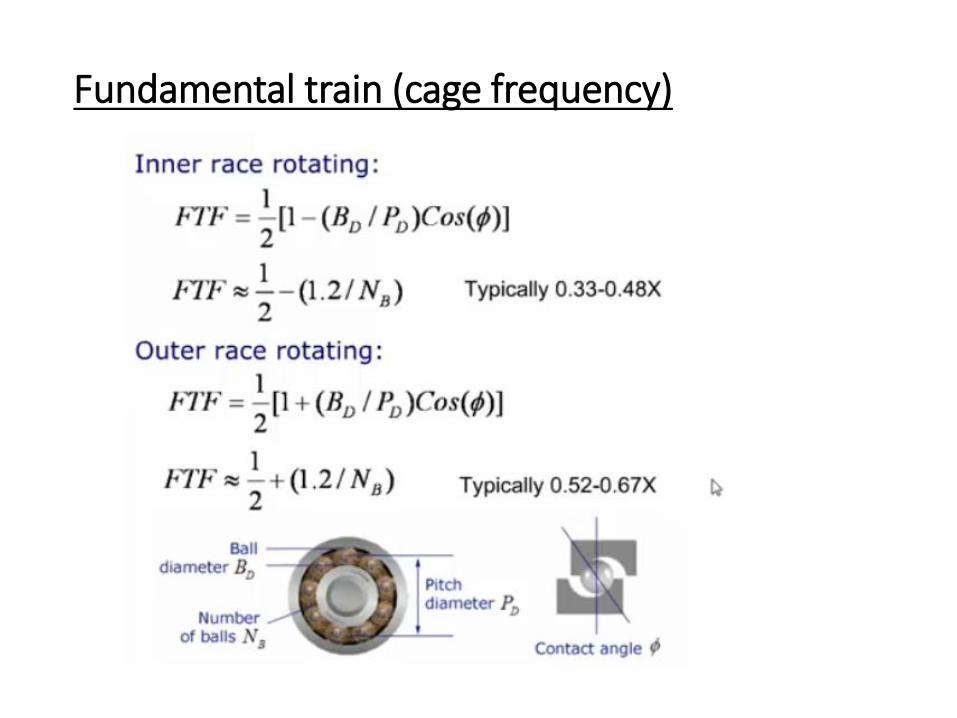
Fundamental train (cage frequency)
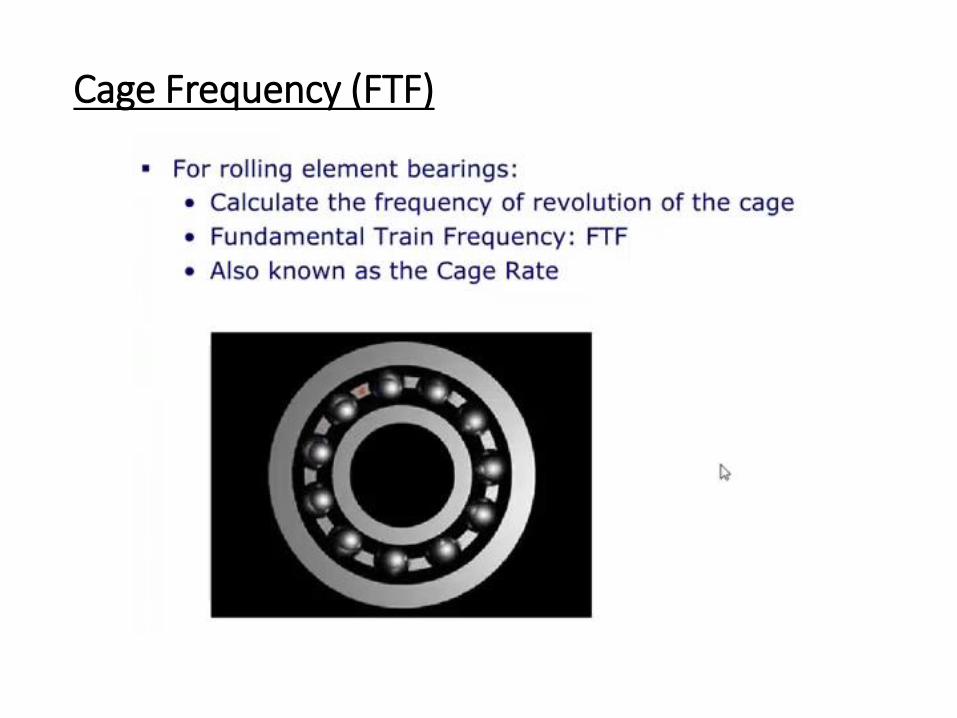
Cage Frequency (FTF)
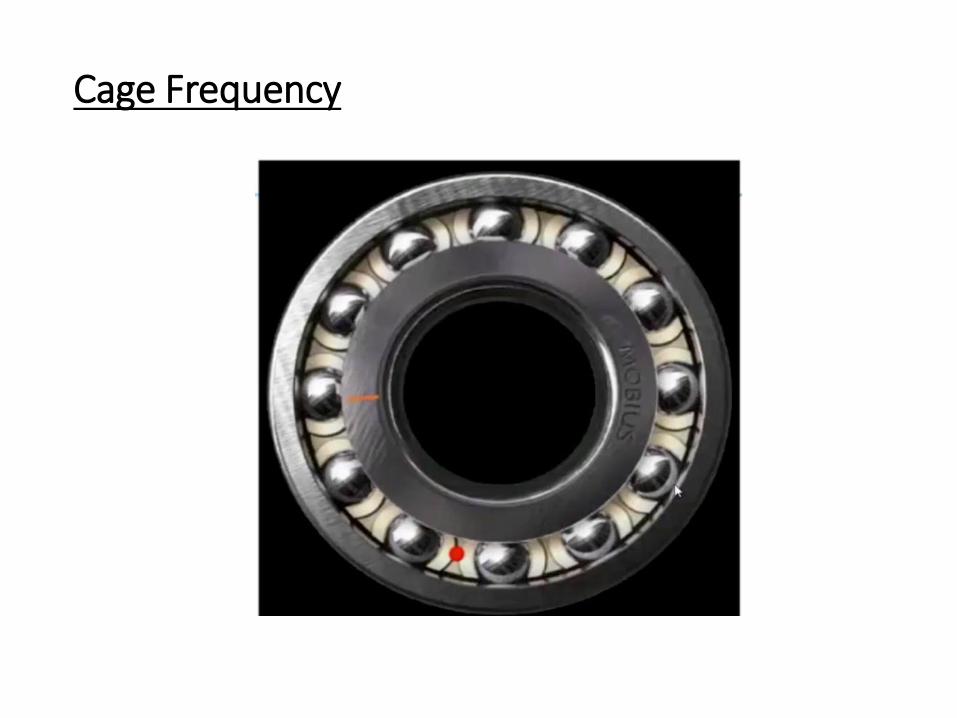
Cage Frequency
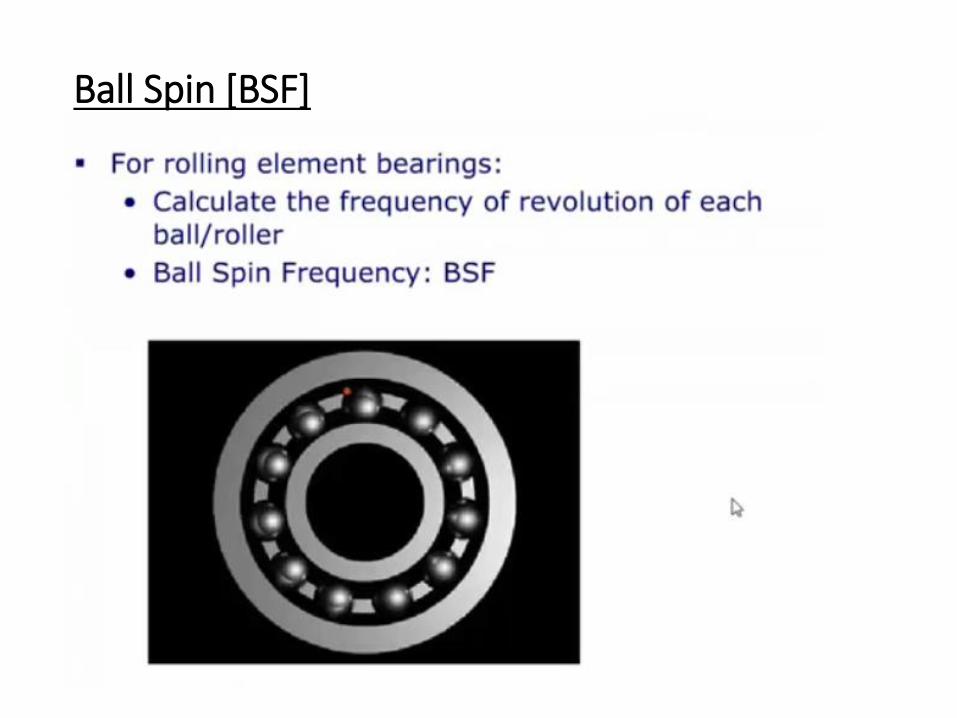
Ball Spin [BSF]
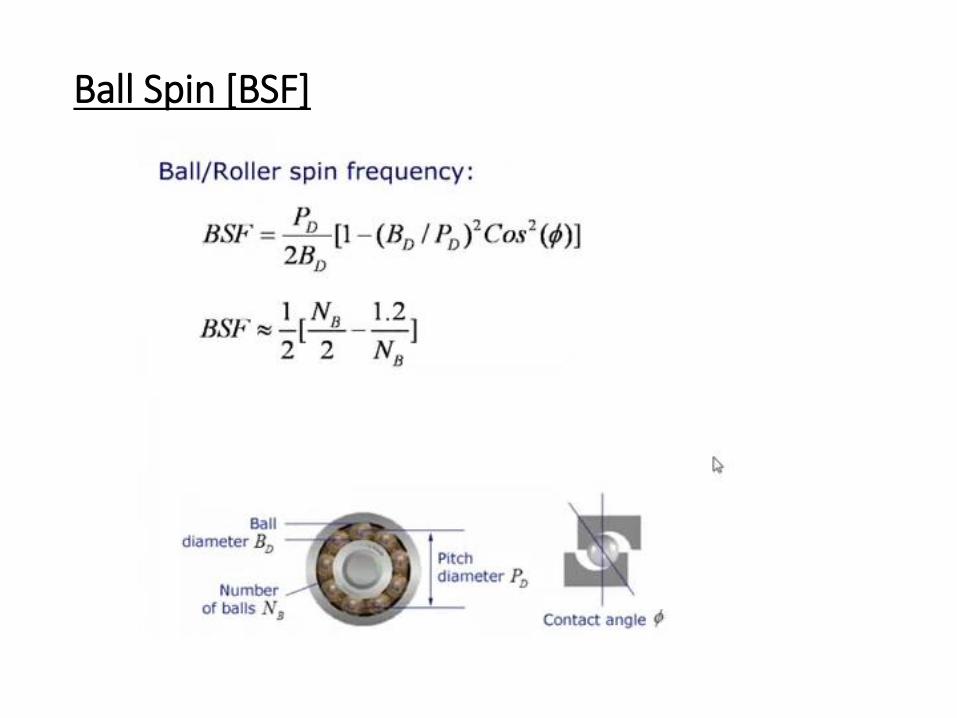
Ball Spin [BSF]
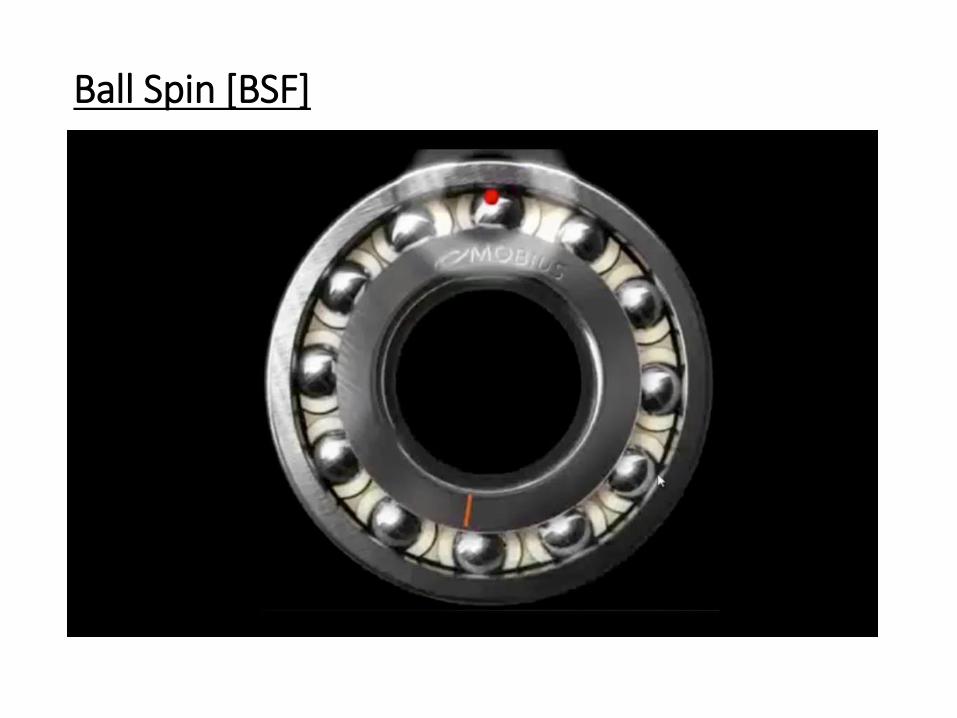
Ball Spin [BSF]
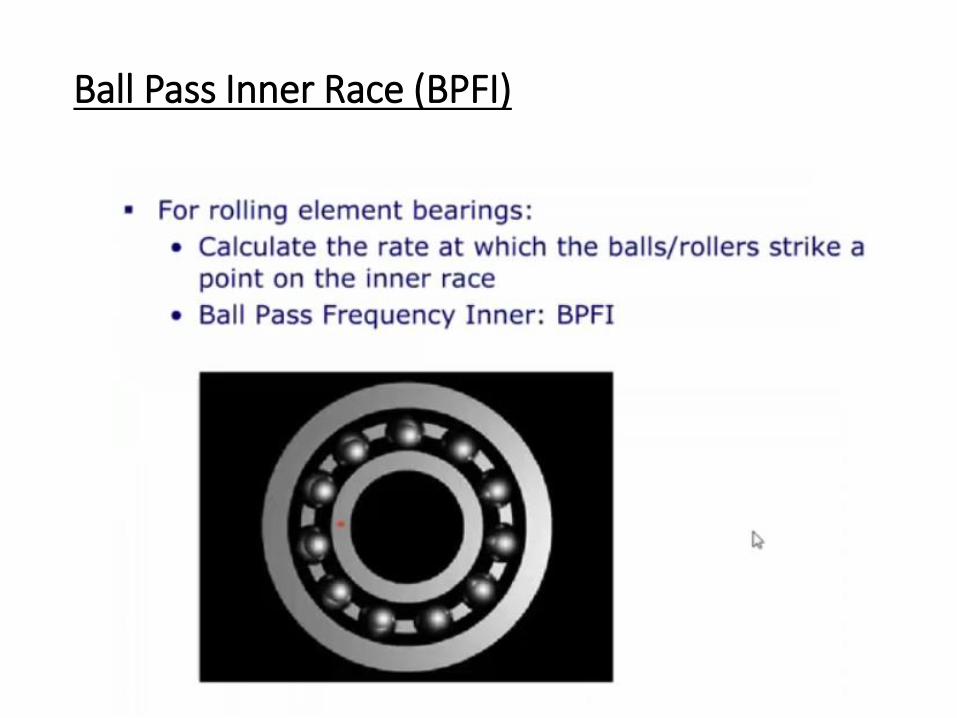
Ball Pass Inner Race (BPFI)
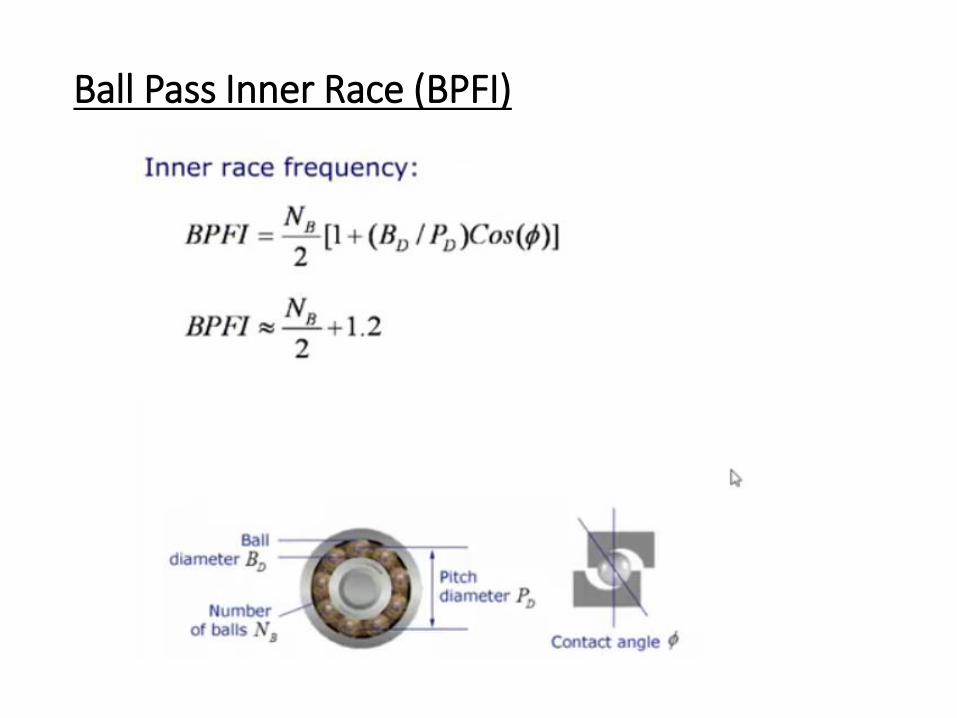
Ball Pass Inner Race (BPFI)
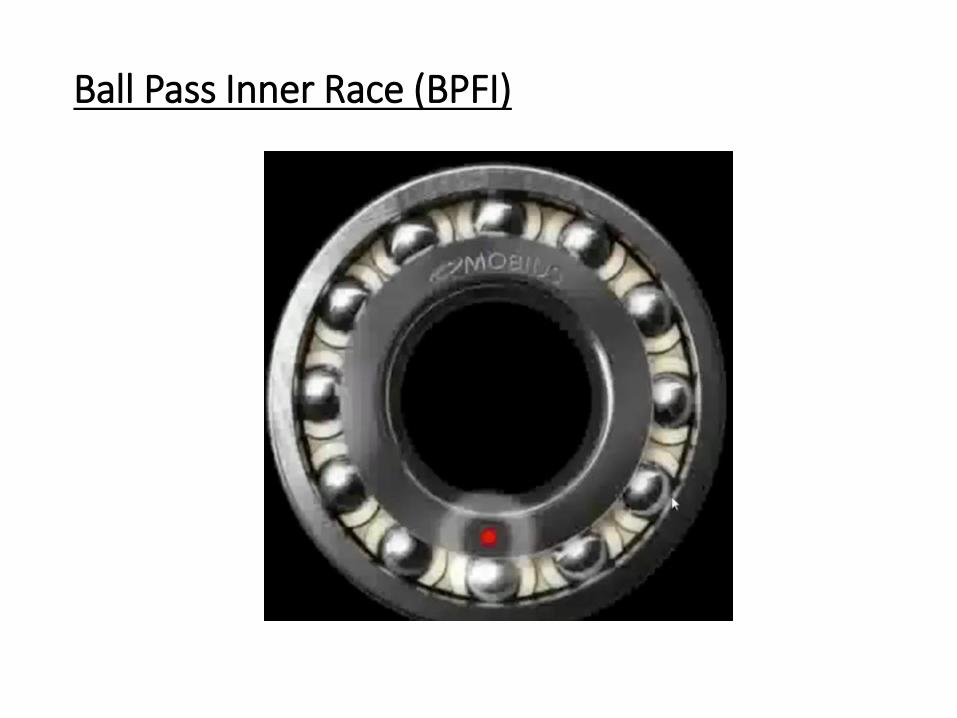
Ball Pass Inner Race (BPFI)
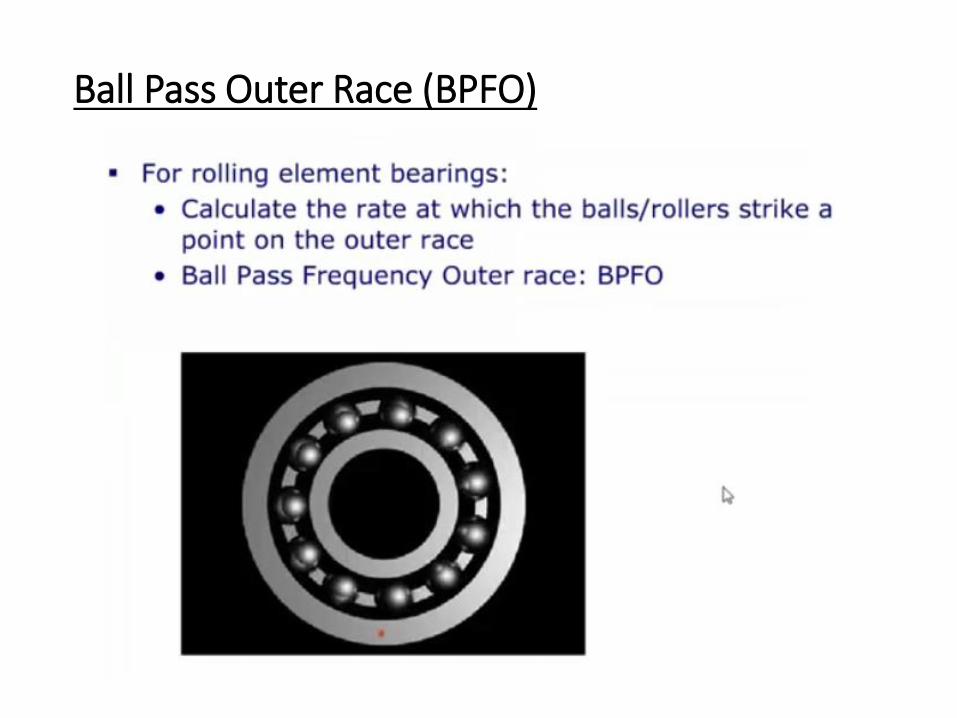
Ball Pass Outer Race (BPFO)
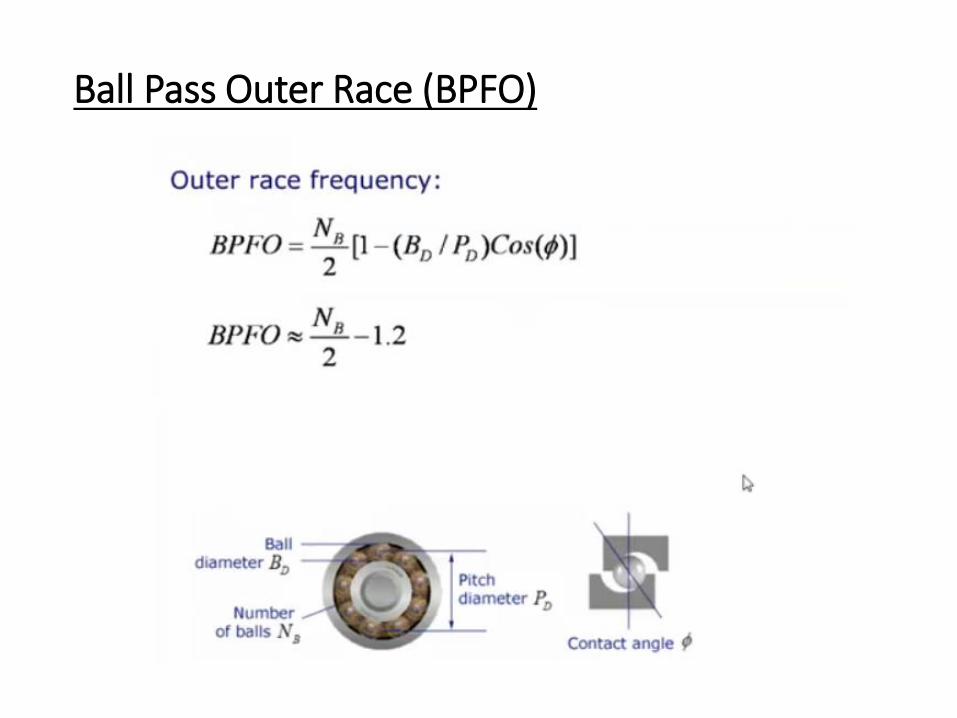
Ball Pass Outer Race (BPFO)
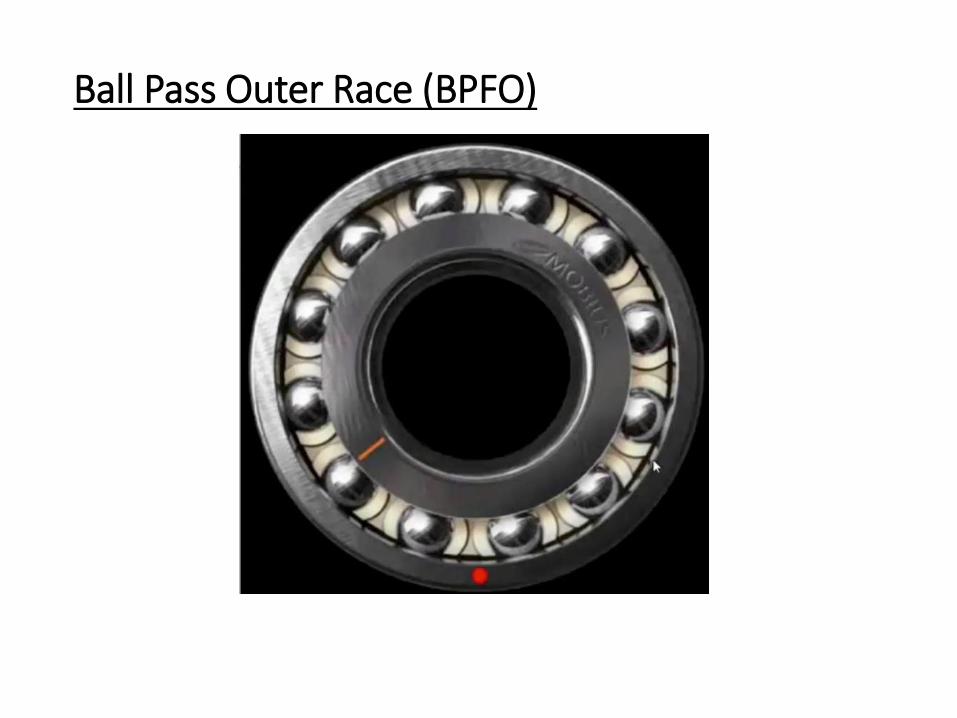
Ball Pass Outer Race (BPFO)
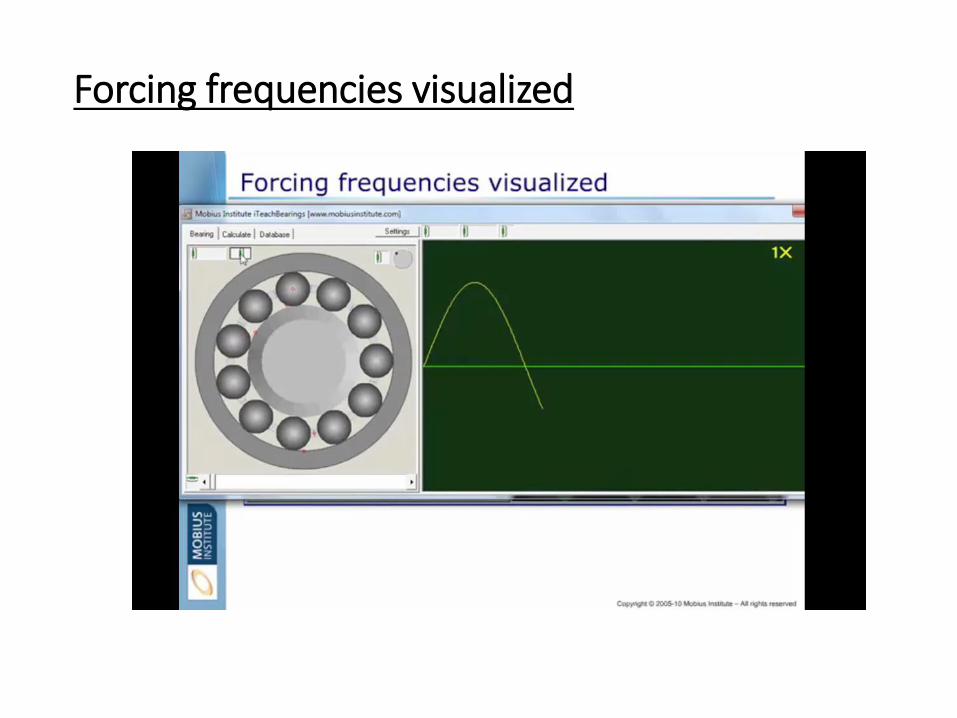
Forcing frequencies visualized
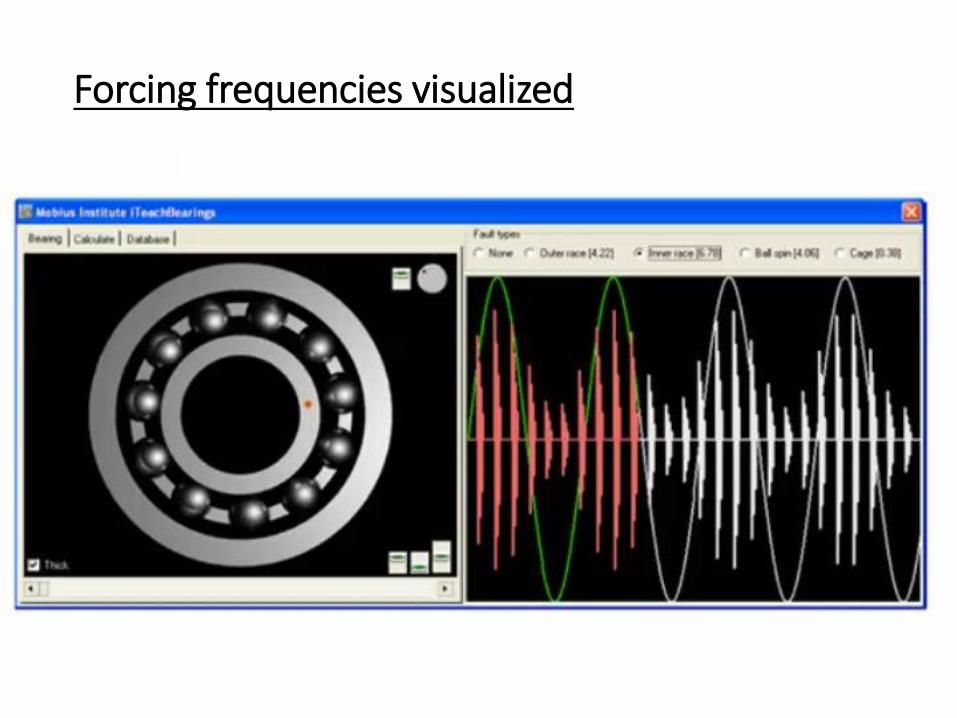
Forcing frequencies visualized
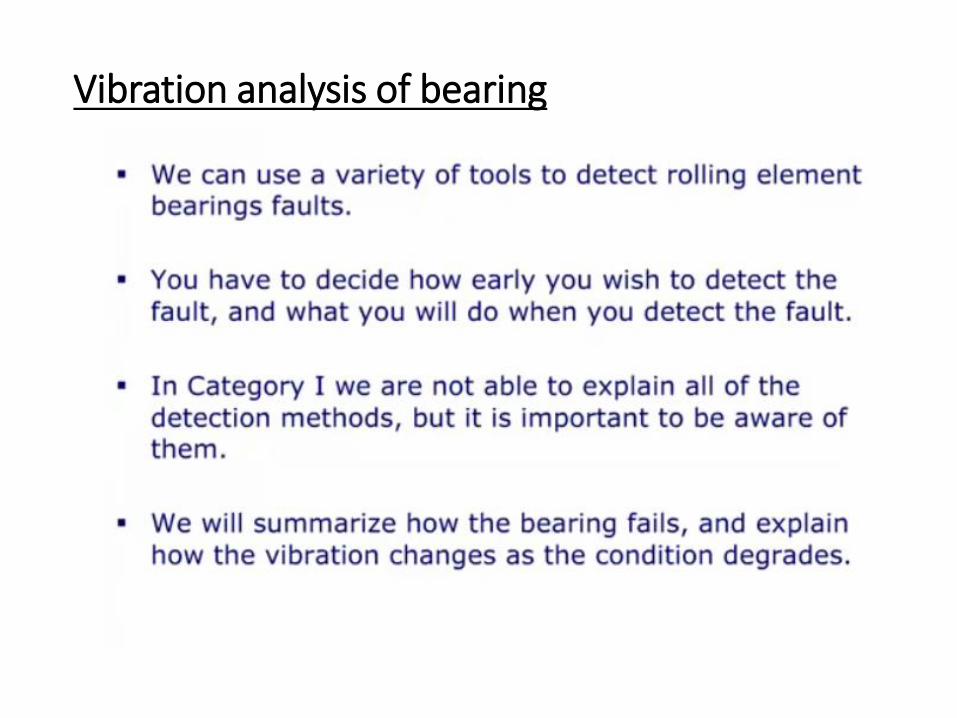
Vibration analysis of bearing
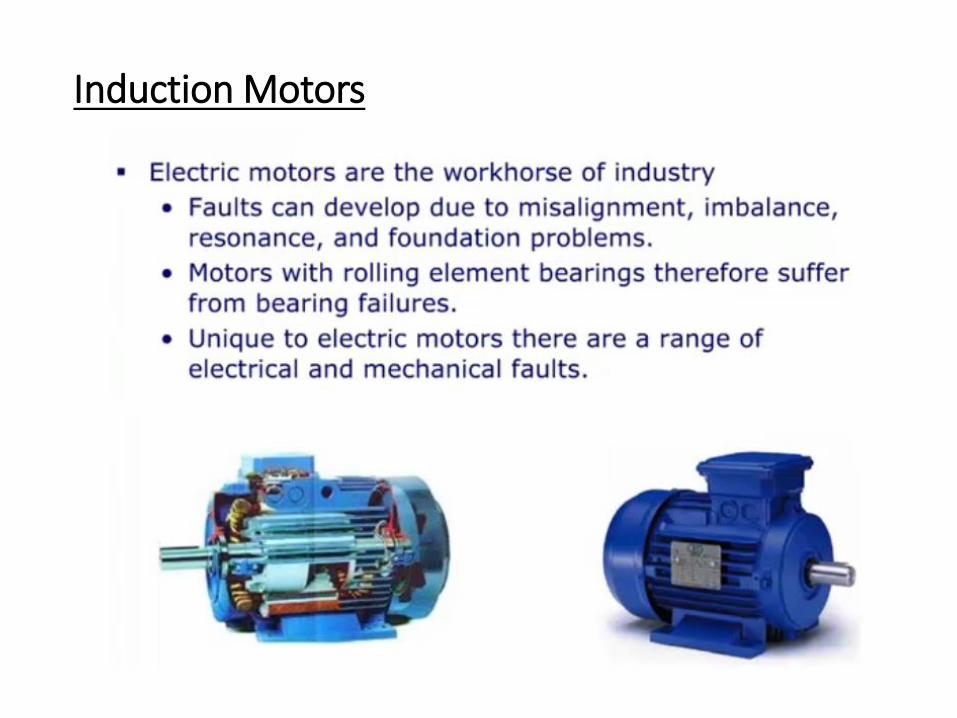
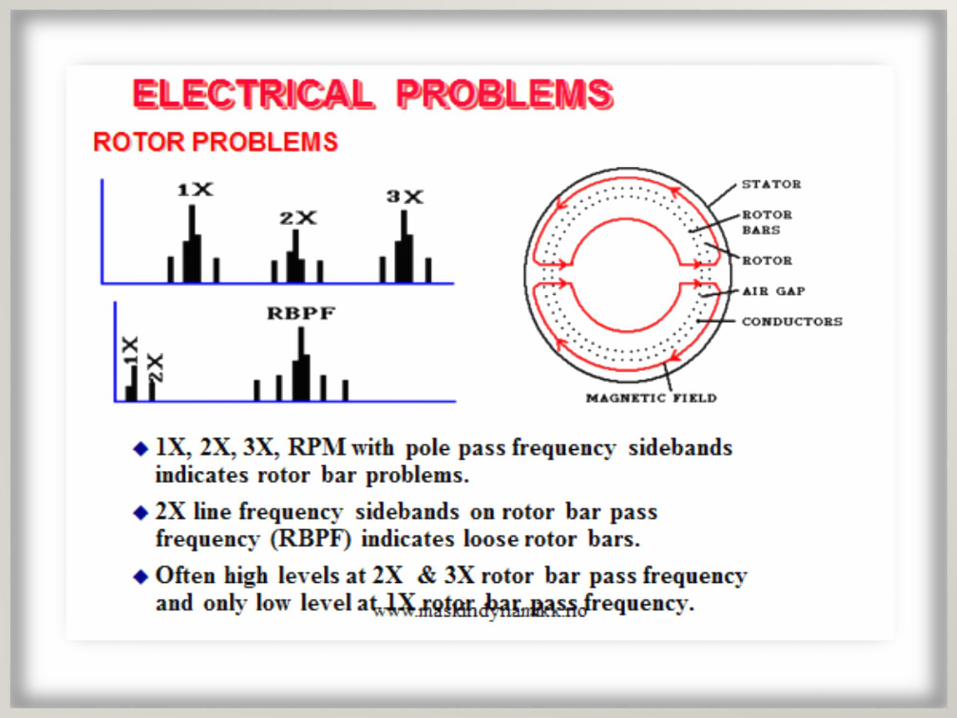
Induction Motors
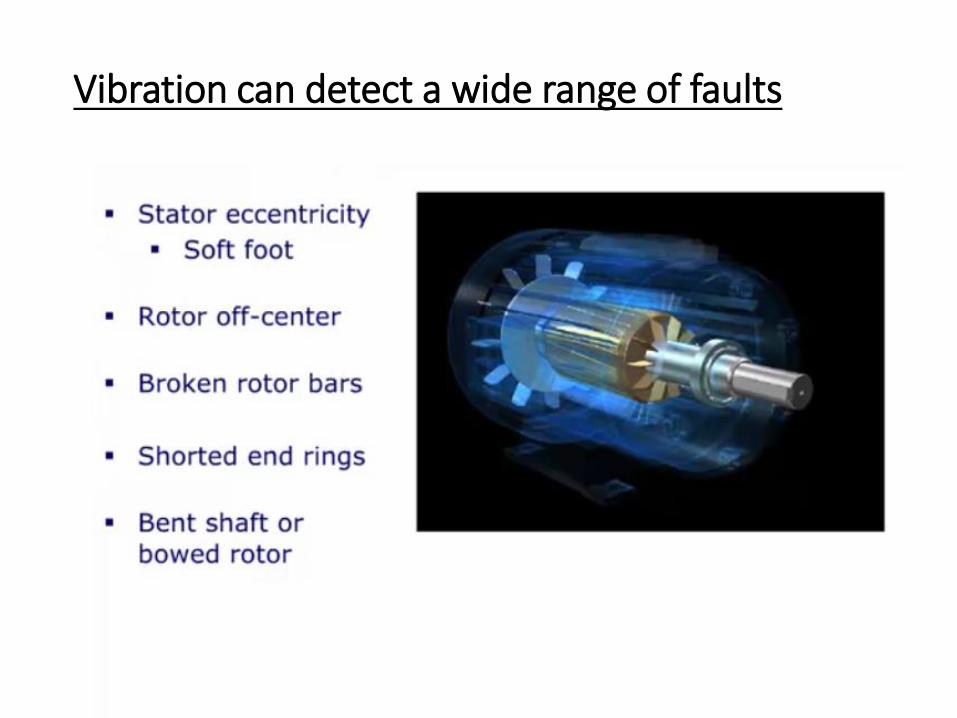
Vibration can detect a wide range of faults
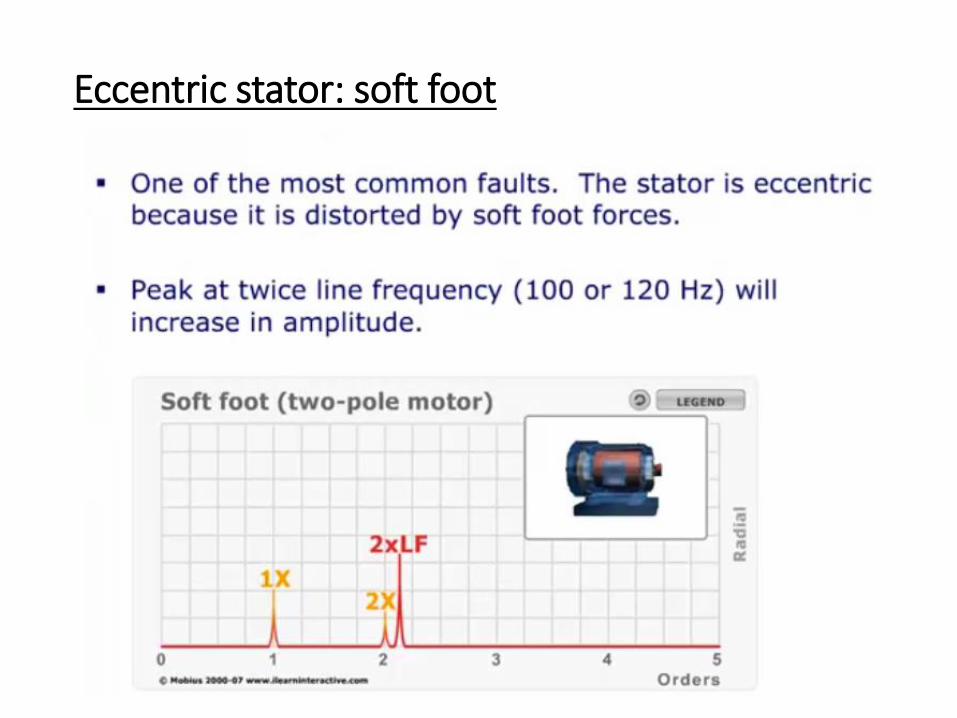
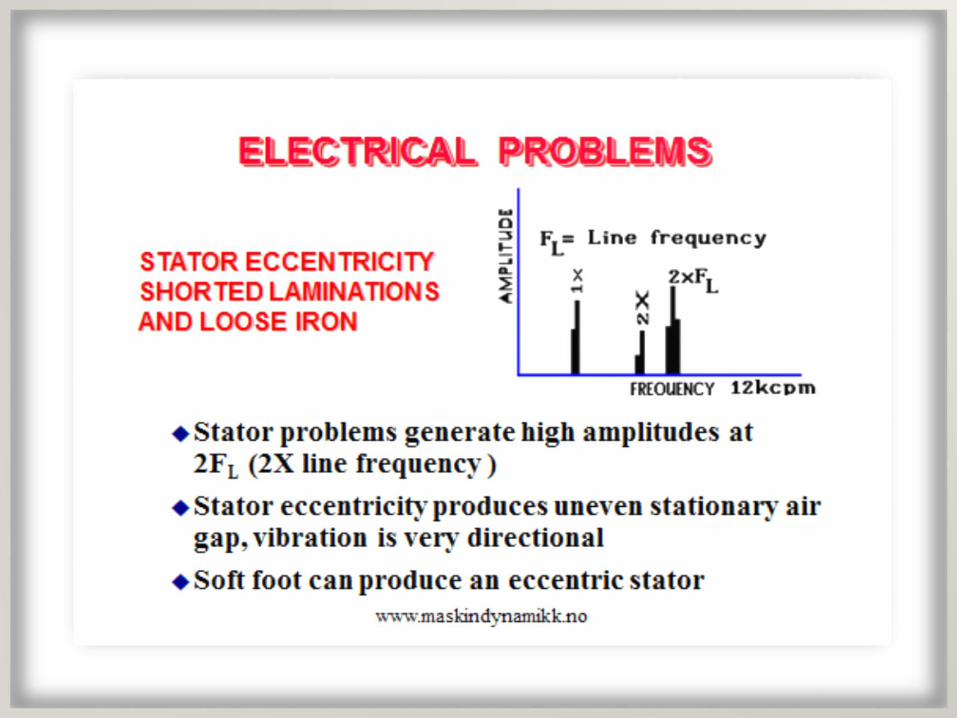
Eccentric stator: soft foot
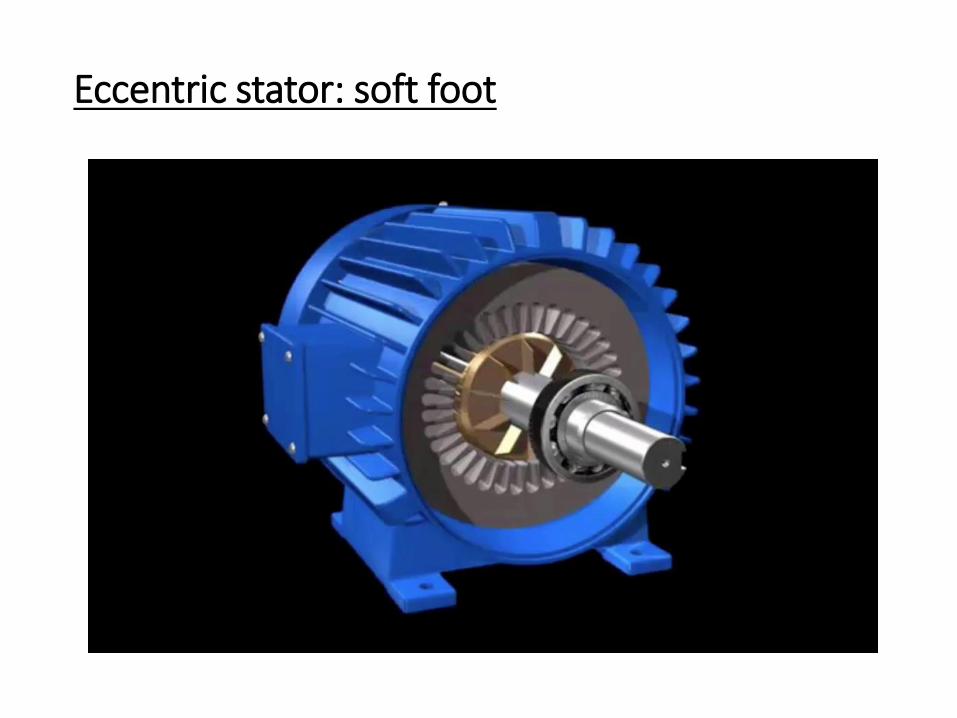
Eccentric stator: soft foot
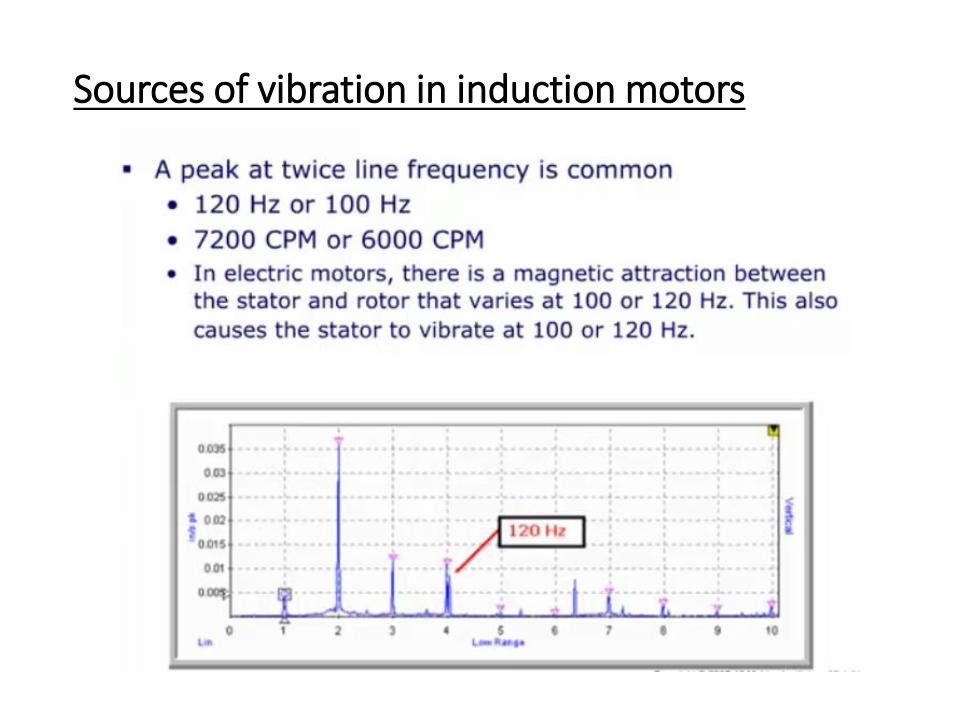
Sources of vibration in induction motors
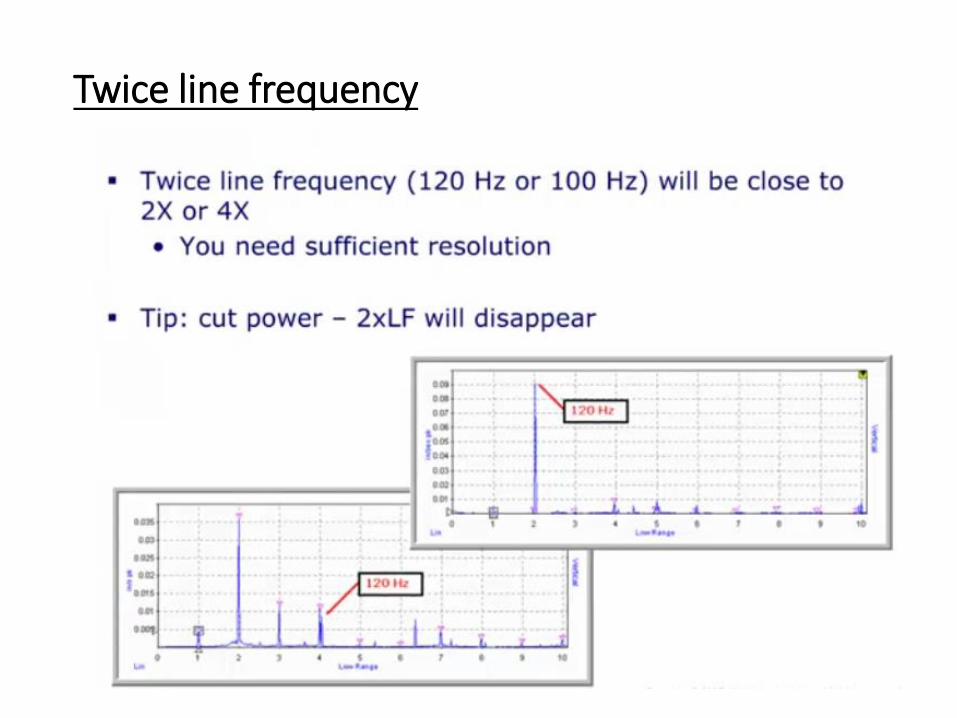
Twice line frequency