Embed Size (px)
Citation preview

DEVELOPMENT OF SIP FOR CHRONIC PAIN1
Please cite as: McEntee, M. L., Vowles, K. E., & McCracken, L. M. (in press). Development of a chronic pain specific version of the Sickness Impact Profile. Health Psychology.
APA required document deposit procedures require the following information: Copyright - American Psycological Association. Journal home page - www.apa.org/pubs/journals/hea/. This article may not exactly replicate the final version published in the APA journal. It is not the copy of record
Development of a Chronic Pain Specific Version of the Sickness Impact Profile
Mindy L. McEntee and Kevin E. Vowles
University of New Mexico
Lance M. McCracken
King’s College London
17 July 2015
Correspondence should be addressed to Mindy McEntee, Department of Psychology, University
of New Mexico, MSC03 2220, 1 University of New Mexico, Albuquerque, NM 87131-0001. E-mail:
[email protected] or to Kevin Vowles, Department of Psychology, University of New
Mexico, MSC03 2220, 1 University of New Mexico, Albuquerque, NM 87131-0001. E-mail:

DEVELOPMENT OF SIP FOR CHRONIC PAIN2
ABSTRACT
Objective: Given the prevalence and complexity of chronic pain, there is a need for measures of
disability that: (1) provide comprehensive, useful clinical information with regard to patient
functioning, and (2) do so as briefly as possible to minimize respondent burden. The primary
objective of this study was to reduce the length of a well-known, highly detailed measure of
disability, the 136-item Sickness Impact Profile (SIP), and develop a psychometrically sound short
form for use in chronic pain (SIP for Chronic Pain, SIP-CP). Methods: A 2-parameter logistic item
response theory model was used to develop the SIP-CP in a sample of adults presenting for
treatment at an interdisciplinary rehabilitation program (N = 723). Items were assessed for
inclusion at the subscale level; poorly contributing items were removed sequentially and model fit
was evaluated at each step until adequate fit was achieved. Finally, linear regressions examined
the variance accounted for by the SIP-CP in relation to the full-length SIP in measures of patient
functioning. Results: The SIP-CP contains 42 items that yield seven subscale scores and two
summary dimension scores, Physical and Psychosocial disability. Acceptable reliability and
evidence of convergent and divergent validity were demonstrated for each component. The SIP-
CP accounted for a similar amount of the variance in measures of depression, pain-related
anxiety, pain acceptance, classes of prescribed analgesics, and pain-related medical visits as the
full-length SIP. Conclusions: The SIP-CP appears to provide robust clinical information with little
loss of association with other key aspects of functioning, while substantially lowering response
burden.
Keywords: chronic pain, assessment, item response theory, disability, functioning, Sickness
Impact Profile

DEVELOPMENT OF SIP FOR CHRONIC PAIN3
Development of a chronic pain specific version of the Sickness Impact Profile
Chronic pain affects an estimated 100 million adults in the US, more than the total
affected by heart disease, cancer, and diabetes combined (Gaskin & Richard, 2012), and can be
highly complex and debilitating. In contrast to acute pain, chronic pain persists beyond the
expected time for healing and does not appear to serve any adaptive function (Ashburn & Staats,
1999). The impacts of chronic pain can be substantial and widespread, often leading to significant
disability across multiple domains of functioning (Breivik, Collett, Ventafridda, Cohen, &
Gallacher, 2006; Fredheim et al., 2008; Gaskin & Richard, 2012; Gatchel, Peng, Peters, Fuchs, &
Turk, 2007). Reducing disability is therefore a priority goal for treatment.
Broadly speaking, there is no single measure that serves as the gold standard for
assessing disability in chronic pain, particularly for non-headache pain (De Bruin, De Witte,
Stevens, & Diederiks, 1992; Jensen, Turner, Romano, & Fisher, 1999). One of the most
established measures of illness-related disability is the Sickness Impact Profile (Bergner, Bobbitt,
Carter, & Gilson, 1981). The SIP was designed to provide a broad assessment of how illness
disrupts daily activities in physical, psychological, and social domains (Bergner, 1993; Bergner et
al., 1981; Bergner, Bobbitt, Kressel, et al., 1976; Bergner, Bobbitt, Pollard, Martin, & Gilson,
1976). Completion of the 136-item measure yields an overall score indicating total disability, three
dimension scores assessing Physical, Psychosocial, and Independence/other disability, and 12
subscale scores including Ambulation, Mobility, Body Care and Movement, Communication,
Alertness Behavior, Emotional Behavior, Social Interaction, Sleep and Rest, Eating, Work, Home
Management, and Recreation and Pastimes. All scores range from 0 to 1 with higher scores
representing greater disability due to health concerns. To date, few alternative measures are as
thorough and informative as the SIP.
The SIP has been widely used in the area of chronic pain, where it appears to provide a
broader and more detailed assessment of patient functioning than other clinical assessments (De
Bruin et al., 1992; Lindeboom et al., 2004; Lipsett et al., 2000; Watt-Watson & Graydon, 1989).

DEVELOPMENT OF SIP FOR CHRONIC PAIN4
From a psychometric perspective, the SIP has demonstrated acceptable content and criterion
validity along with good test-retest reliability in chronic pain (Deyo, Inui, Leininger, & Overman,
1982; Deyo, Inui, Leininger, & Overman, 1983; Follick, Smith, & Ahern, 1985; Sullivan, Ahlmen, &
Bjelle, 1990). The SIP has also demonstrated good sensitivity and specificity in chronic pain, with
the ability to detect clinically and statistically significant changes in functioning (Deyo & Inui, 1984;
Follick et al., 1985; Sullivan et al., 1990; Vowles & McCracken, 2008; Vowles, Witkiewitz,
Sowden, & Ashworth, 2014).
While the SIP appears useful in chronic pain settings, there are at least four key
limitations. First, the factor structure has not been supported (De Bruin, Diederiks, De Witte,
Stevens, & Philipsen, 1994; Lindeboom et al., 2004; Nanda, McLendon, Andresen, & Armbrecht,
2003). Second, the scoring method includes potentially arbitrary item weights, which were based
on healthcare provider judgments of severity. Lacking empirical support, this may contribute to
the aforementioned factor instability (De Bruin et al., 1994; Lindeboom et al., 2004; MacKenzie,
Charlson, DiGioia, & Kelley, 1986; Pollard & Johnston, 2001). Third, the SIP includes items that
may not be widely pertinent to chronic pain and therefore add unnecessarily to the response
burden (Deyo, 1986; Deyo et al., 1982). Fourth and finally, the SIP is lengthy, requiring
substantial time to complete and score, which makes it less acceptable to patients and providers
(Busija et al., 2011; Damiano, 1996; De Bruin, Diederiks, De Witte, Stevens, & Philipsen, 1997;
Deyo et al., 1983; Lipsett et al., 2000; Read, Quinn, & Hoefer, 1987). At present, the only
abbreviated version of the SIP specific to chronic pain is the Roland Morris Disability
Questionnaire (Roland & Fairbank, 2000; Roland & Morris, 1983), which covers only a limited
range of activities in the physical functioning domain and does not assess psychological or social
functioning (Stratford, Solomon, Binkley, Finch, & Gill, 1993).
To summarize, the SIP has a number of strengths regarding use in chronic pain, chiefly
the broad clinical information that it provides and extensive assessment across areas of
functioning. It also has a number of limitations, including factor structure, relevance of certain

DEVELOPMENT OF SIP FOR CHRONIC PAIN5
items for this population, and length. The current study sought to derive a chronic pain specific
version of the SIP, the SIP-CP, which retains the strengths of the original SIP while minimizing
the limitations. Notably, prior studies failing to replicate the factor structure of the SIP have relied
on classical test theory (CTT) methodology. The present study utilized item response theory (IRT)
to evaluate and reduce items, a psychometric method widely used in education assessment
which allows for more complex (nonlinear) models. In addition, a series of follow-up correlation
and regression analyses were performed to evaluate the association of the SIP-CP, both alone
and in contrast to the original SIP, with key aspects of patient functioning, including depression,
pain-related anxiety, pain acceptance, classes of prescribed analgesics, and number of pain-
related medical visits.
Method
Participants
Participants included 723 patients presenting for treatment at an interdisciplinary pain
treatment center in the United Kingdom between 2005 and 2012. Prior to an individual intake
interview with a psychologist, all participants completed a battery of self-report questionnaires.
The study was approved by the Bath and Northeast Somerset NHS Research Ethics Board. The
sample was primarily White European (97.5%), female (65.7%), and married (63%). Mean
participant age was 46.4 years (SD = 12.1) and mean education was 12.3 years (SD = 2.5).
Median duration of pain was 84 months (ranging from 7 to 660); many patients were not currently
working (50.6%) or had retired early (20.8%) due to pain. The most commonly reported pain site
was lower back (48%), followed by lower limbs (14.6%), full body (11.7%), and upper limbs
(10.5%). Reported average pain intensity over the past week on a 0 (no pain) to 10 (maximal pain
possible) rating scale was 7.2 (SD = 1.8).
Measures
Demographic and clinical information. Demographic variables collected included
participant age, sex, years of education, employment status, and ethnic/racial background. Self-

DEVELOPMENT OF SIP FOR CHRONIC PAIN6
reported pain-related data included duration of pain in months, location(s) of pain, average pain
intensity over the past week, and the number of medical visits over the past six months related to
pain. Analgesic medications were tallied via chart review with the total number of classes of
analgesic medications (e.g., opioids, NSAIDS, tricyclic antidepressants, muscle relaxants,
sedatives, anticonvulsants, selective serotonin reuptake inhibitors, over-the-counter analgesics)
taken for pain coded according to the British National Formulary (bnf.org).
Sickness Impact Profile (Bergner et al., 1981). As noted, the 136 items of the SIP are
written in a yes/no response format, with a “yes” response indicating greater disability.
Respondents are asked to indicate which items apply to them on a given day in relation to their
current health.
Beck Depression Inventory-II (BDI-II; Beck, Steer, & Brown, 1996). The BDI-II is a 21-
item measure of depression with well-established psychometric properties (Beck, Steer, & Carbin,
1988). Scores range from 0 to 63 with larger values indicating more severe symptoms. Of note,
the treatment program changed measures of depression midway through the collection of data for
this study, so BDI-II data was available for only a subset of 355 individuals. Cronbach's alpha in
the sample was .88.
British Columbia Major Depression Inventory (BCMDI; Iverson & Remick, 2004). The
BCMDI is a 16-item index of depression based on the Diagnostic and Statistical Manual for
Mental Disorders-IV (DSM-IV; American Psychiatric Association, 2000) criteria for Major
Depressive Disorder. Scores range from 0 to 120 with higher scores indicating more severe
symptoms. The BCMDI has demonstrated adequate internal consistency, test-retest reliability,
and good sensitivity and specificity (Iverson & Remick, 2004). Due to changes in measure
selection for depression, BCMDI data was available for a subset of 358 individuals who did not
complete the BDI-II. Cronbach's alpha for the BCMDI in the sample was .86.
Pain Anxiety Symptoms Scale-20 (PASS-20; McCracken & Dhingra, 2002). The PASS-
20 is a 20 item measure of fear, anxiety, and avoidance responses specific to pain. Scores range

DEVELOPMENT OF SIP FOR CHRONIC PAIN7
from 0 to 100 with higher scores indicating greater symptoms. The PASS-20 is strongly correlated
with the original 40-item PASS (McCracken, Zayfert, & Gross, 1992) and other measures of
functioning and has demonstrated strong internal consistency and reliability with good predictive
and construct validity (McCracken & Dhingra, 2002; Roelofs et al., 2004). Cronbach's alpha
was .85 in this sample.
Chronic Pain Acceptance Questionnaire (CPAQ; McCracken, Vowles, & Eccleston,
2004). The CPAQ is a 20-item measure of pain-related acceptance. Total scores range from 0 to
120 with higher scores indicating greater acceptance and have been significantly correlated with
measures of physical and emotional functioning. The measure has demonstrated adequate factor
structure as well as acceptable internal consistency and test-retest reliability (McCracken &
Eccleston, 2005; McCracken et al., 2004; Vowles, McCracken, McLeod, & Eccleston, 2008).
Cronbach's alpha for the CPAQ total score was .73 for this sample.
Statistical Analyses
All IRT analyses were performed using Mplus software (Muthén & Muthén, 2012).
Correlation and regression analyses were performed using SPSS, Version 21 (IBM Corporation).
IRT analyses of the SIP subscales. An IRT approach was used to examine the relative
usefulness of each item and guide selection of items for a shortened version of the SIP specific
for a treatment seeking chronic pain population. IRT utilizes mathematical models that describe
the relation between an individual's response to an item and their level of the hypothetical latent
trait being assessed in probabilistic terms (Hays, Morales, & Reise, 2000), and provides the
opportunity to either select items that provide an accurate assessment across the entire range of
a trait or items that provide maximum discriminatory value surrounding a critical range of a trait
(e.g., a clinical cutoff score). In the present study, the goal was to minimize patient burden by
reducing the length of the measure while capturing as much breadth of clinical information as
possible. Accordingly, IRT was used to identify items that weren't providing any significant
information about the trait of interest (i.e., disability associated with chronic pain) and could

DEVELOPMENT OF SIP FOR CHRONIC PAIN8
therefore be eliminated, as well as items which provided an accurate assessment across a broad
range of disability in chronic pain and should therefore be retained. Given that the item weights of
the original SIP were arbitrarily determined during its construction by healthcare providers and
have not been psychometrically supported, no item weights were used.
Core fundamental assumptions for using IRT include unidimensionality and local
independence, which were verified by examining eigenvalues during preliminary exploratory
factor analysis. Other assumptions of IRT include monotonicity, which requires that the probability
of endorsing an item increases along with increases in the underlying latent trait, and parameter
invariance across groups, which allows for the comparing of scores across respondents
endorsing different items and modeling change over time (Hays et al., 2000). Accordingly, item
response theory is well suited for the selection of items to retain on a measure. Advantages of
IRT in the present study include the use of non-linear modeling (as opposed to the linear relation
presumed in CTT) and the ability to estimate a trait of interest (disability in chronic pain) with
fewer items (Hays et al., 2000).
Given the forced choice format of the SIP (i.e., yes/no), a two-parameter logistic IRT
model was used to provide estimates for two independent aspects of each item: difficulty and
discrimination value. Within IRT, the difficulty and discrimination of each item is graphically
represented in an item characteristic curve (ICC), a non-linear regression line representing the
likelihood of endorsing that particular item as a function of the underlying trait. ICCs for
dichotomous items like those on the SIP form an S-shaped curve; in the center of this curve,
small changes in the level of the underlying trait are associated with large changes in the
probability of endorsing that item (Embretson & Reise, 2000). The exact shape and location of the
S-shaped curve for each item depends on the estimated difficulty and discrimination parameters;
a reverse S-shaped curve indicates negative discrimination, which suggests a poorly performing
item that is best excluded. Curves that form a straight horizontal line indicate that the item
provides no discrimination or is undefined, while a straight vertical line indicates perfect

DEVELOPMENT OF SIP FOR CHRONIC PAIN9
discrimination just above and below that point, but no ability to distinguish between those with
levels of the latent trait further above or below it. See Ainsworth (2011) for a detailed discussion.
Items were evaluated at the level of the subscale with the intent of maintaining the broad
framework of the SIP. Inadequate items were removed individually based on manual inspection of
ICCs. Because ICCs on a subscale are a function of how those items work together (and not just
the sum of individual ICCs), subscale ICCs were re-evaluated after each step in the reduction
process.
Fit was initially evaluated using chi-square analyses, with non-significant values indicating
appropriate model fit. However, since the significance of χ2 model fit tends to increase with larger
sample sizes, the priority was to achieve consensus among root mean square error of
approximation (RMSEA), comparative fit index (CFI), and Tucker-Lewis index (TLI) fit indices. For
RMSEA, good fit was defined as a test statistic ≤ .05, with values ≤ .08 considered adequate fit
(Bryne, 2001). Good fit for CFI and TLI was defined by a test statistic ≥ .95, with adequate fit
attained by values of ≥ .90 or larger (Hu & Bentler, 1999). Following the removal of all poorly
functioning items as demonstrated by model fit indices and visual inspection of ICCs, chi-square
difference tests were conducted to determine whether the removal of additional items significantly
improved model fit across further iterations of the subscale. For instances in which two items
shared the same ICC characteristics (suggesting potential redundancy), items were evaluated for
uniqueness relative to other items and clinical relevance for chronic pain and retained or removed
accordingly. Since this process was exploratory in nature, removal of items occasionally
produced changes in ICCs which suggested that inclusion of that item may yield better model fit.
In such cases, effects of re-adding these items to the subscale on ICCS and subsequent model fit
were examined to determine whether they should be retained for the SIP-CP. This procedure was
followed for each of the 12 original subscales of the SIP. In cases where item removal was
straightforward (e.g., negatively sloping ICC), the item was removed without the need for study
team discussion. In cases where there was ambiguity or where items shared ICC characteristics,

DEVELOPMENT OF SIP FOR CHRONIC PAIN10
the first and second authors made a joint determination of the most appropriate course of action
in terms of item removal and retention.
Evaluation of SIP-CP Dimension and Total Scores. Following the evaluation of model
fit of items at the subscale level, overall fit of the dimension scores (i.e., Physical, Psychosocial,
and Independence/other disability) and total disability was assessed. To further aid in evaluation
of the revised scores, correlation coefficients were calculated amongst the SIP and SIP-CP with
the included measures of depression, pain-related anxiety, pain acceptance, classes of
prescribed analgesics, and number of pain-related medical visits. Any dimension score that did
not achieve adequate fit and was not correlated consistently with measures of functioning was
removed from further analyses.
Finally, a series of linear regressions was performed to investigate the variance accounted
for by the SIP and SIP-CP scores in measures of depression, pain-related anxiety, pain
acceptance, number of classes of pain medications, and number of pain-related medical visits.
These analyses served two primary purposes. The first was to examine whether there were
differences in the amount of variance accounted for by the original SIP and the SIP-CP, since it
is possible that a substantial reduction in the number of items on the SIP-CP would adversely
affect variance accounted for in aspects of patient functioning. On the other hand, if the IRT
analyses were useful in reducing the number of unimportant or redundant items on the SIP, then
variance should not be greatly reduced on the SIP-CP. The second purpose of the regression
analyses was to investigate aspects of convergent validity of the SIP-CP after controlling for
relevant background variables, including gender, age, pain duration, and pain intensity.
Results
Descriptive Information

DEVELOPMENT OF SIP FOR CHRONIC PAIN11
Means and SDs for all study measures are displayed in Supplementary Table 11. All
distributions appeared normally distributed with no evidence of kurtosis.
IRT Analyses of the SIP Subscales
The final version of the SIP-CP is displayed in the online Supplementary Appendix. The
item reduction process is described below and a representative example is shown in Figure 1 and
Table 1 for the Mobility subscale. Item reduction details for each subscale, which show step by
step item removal and resultant model fit, as well as ICC details are available as supplementary
files (Supplementary Tables 2-10; Supplementary Figures).
Mobility. The Mobility subscale assesses the range of one's ability to get around within
and outside the home. The original subscale consisted of 10 items with adequate fit, χ2 (35) =
127.11, p < .001, RMSEA = .06, CFI = .93, TLI = .91. Following the IRT analyses displayed in
Table 1, the subscale was reduced to five items with evidence of good fit, χ2 (5) = 9.09, p = .106,
RMSEA = .03, CFI = .99, TLI = .98). All ICC’s are displayed in Figure 1. The figure displays ICC’s
for the original 10 items in the upper pane and the five retained items in the lower pane.
Ambulation. The Ambulation subscale assesses various aspects of walking (e.g.,
distance, speed, use of assistive devices). Model fit of the original 12 items was poor, χ2 (2) =
838.16, p < 0.001, RMSEA = .14, CFI = .65, TLI = .57; indices for the four items retained for the
SIP-CP indicated excellent fit, χ2 (2) = 3.4, p = 0.18, RMSEA = .03, CFI = .99, TLI = .99.
1 Given that approximately half of the sample experienced low back pain, we investigated whether
diagnosis or pain location was associated with differences in the measures utilized in the present study.
Overall, differences were significant only for the number of classes of pain medications taken; those
with back pain (M = 2.84, SD = 1.48) were taking significantly more medication classes than patients
with pain in other areas (M = 2.53 SD = 1.51), t (716) = 2.79, p = .005. Similarly, patients with a
spine or back-related diagnosis (M = 3.58, SD = 1.66) were taking significantly more medication
classes than those with other diagnoses (M = 2.87, SD = 1.62), t (334) = 31.12, p = .002.

DEVELOPMENT OF SIP FOR CHRONIC PAIN12
Body Care and Movement. The Body Care and Movement subscale of the SIP assesses
aspects of dressing (e.g., requiring full or partial assistance), standing (from sitting or lying down),
and toileting behavior. The 23 items on the original subscale approached adequate fit, χ2 (230) =
731.95, p < .001, RMSEA = .06, CFI = .89, TLI = .88, while the seven items retained after IRT
analyses demonstrated good fit, χ2 (14) = 36.65, p < .001, RMSEA = .05, CFI = .99, TLI = .99.
Communication. The Communication subscale assesses difficulties with written (e.g.,
trouble writing or typing) and oral (e.g., difficulty speaking, understood with difficulty)
communication. The nine items on the original subscale demonstrated good fit across RMSEA
and CFI indices and adequate fit on the TLI, χ2 (27) = 64.93, p < .001, RMSEA = .04, CFI = .95,
TLI = .94. IRT analyses reduced this to six items with good fit, χ2 (9) = 17.14, p < .001, RMSEA
= .04, CFI = .99, TLI = .98.
Alertness Behavior. The Alertness Behavior subscale assesses difficulty with cognitive
abilities often associated with executive functioning (e.g., confusion, forgetfulness, difficulty
concentrating or sustaining attention). The original 10 items demonstrated good fit on CFI and TLI
indices and adequate fit on RMSEA, χ2 (35) = 130.64, p < .001, RMSEA = .06, CFI = .98, TLI
= .97. IRT analyses reduced this to seven items which had good fit across indices, χ2 (14) =
25.04, p < .001, RMSEA = .05, CFI = .99, TLI = .99.
Emotional Behavior. The Emotional Behavior subscale assesses various forms of
psychological distress (e.g., acting nervous or restless, irritability and impatience, talking about
hopelessness). The original nine items exhibited adequate fit, χ2 (27) = 113.59, p < .001, RMSEA
= .07, CFI = .91, TLI = .89; IRT analyses reduced this to six items that demonstrated good fit, χ2
(14) = 33.26, p < .001, RMSEA = .04, CFI = .97, TLI = .96.
Social Interaction. The Social Interaction subscale assesses changes in the frequency
and other aspects of social interactions with friends (e.g., going out less to visit people, avoiding
social visits from others) and family members (e.g., have frequent outbursts of anger, not joking
with family members the way I usually do, refuse contact with my family). The original 20 items

DEVELOPMENT OF SIP FOR CHRONIC PAIN13
failed to demonstrate adequate model fit, χ2 (170) = 748.09, p < .001, RMSEA = .07, CFI = .86,
TLI = .85. IRT analyses reduced this subscale to seven items which demonstrated good fit across
all indices, χ2 (14) = 30.72, p < .001, RMSEA = .04, CFI = .98, TLI = .97.
Sleep and Rest. The Sleep and Rest subscale assesses changes in sleep habits (e.g.,
spending much of the day lying down to rest, sleeping less at night). The original seven items
indicated poor fit, χ2 (14) = 104.12, p < .001, RMSEA = .09, CFI = .43, TLI = .15, while the revised
four item subscale of the SIP-CP demonstrated good fit, χ2 (2) = 2.37, p < .001, RMSEA = .02,
CFI = .99, TLI = .96.
Home Management. The Home Management subscale assesses the degree to which
one is able to perform typical household chores (e.g., doing less of the regular daily work around
the house than usual, have given up taking care of personal/household business affairs such as
paying bills, etc.). The original 10 item subscale failed to demonstrate adequate fit, χ2 (35) =
412.80, p < .001, RMSEA = .12, CFI = .89, TLI = .85. More importantly, ICCs for eight of the 10
items included on this subscale were reverse S-shaped curves, indicating highly problematic
items. Without a sufficient number of items left to define the model, the subscale was dropped
from the SIP-CP.
Work. The original Work subscale of the SIP contains nine items assessing changes in
work-related functioning (e.g., working shorter hours, taking frequent rests, not accomplishing as
much as usual, acting irritable toward work associates). Notably, participants not currently
working outside of the home are automatically scored as having a set level of disability in this
area, regardless of their reason for not working (e.g., homemaker, retired not due to pain, etc.).
Further, the original construction of this subscale was such that endorsement of item 1 (“I am not
working at all”) yielded a work disability score of .70 (as noted, on a 0 – 1 scale) with instructions
to skip the remaining eight items of the subscale. Perhaps unsurprisingly, ICCs showed that
these eight items were problematic as indicated by reverse S-shaped curves. With only the first

DEVELOPMENT OF SIP FOR CHRONIC PAIN14
item functioning as intended, a model for this subscale could not be properly defined and was
thus dropped from the SIP-CP.
Recreation and Pastimes. The Recreation and Pastimes subscale assesses changes in
the frequency and duration of engagement in personal hobbies or recreational activities (e.g.,
going out for entertainment less often, doing more inactive pastimes in place of my usual
activities, not doing any of my usual inactive pastimes). The original eight item subscale
demonstrated poor fit, χ2 (20) = 279.45, p < .001, RMSEA = .13, CFI = .55, TLI = .37. IRT
analyses produced a four item subscale which demonstrated good fit, χ2 (2) = 4.79, p < .001,
RMSEA = .04, CFI = .99, TLI = .97.
Eating. The Eating subscale assesses one’s ability to feed themselves (e.g., feed myself
with the help of someone else, do not feed myself at all and must be fed) along with changes in
eating habits (e.g., eating much less than usual, eating special or different foods, drinking less
fluids). The original nine item subscale demonstrated good fit for both RMSEA and CFI with
adequate fit on TLI, χ2 (14) = 21.50, p = .09, RMSEA = .03, CFI = .95, TLI = .92. The revised four
item Eating subscale demonstrated good fit across all indices, χ2 (2) = 2.59, p = .091, RMSEA
= .02, CFI = .99, TLI = .99.
Evaluation of SIP-CP Dimension and Total Disability Scores
Physical dimension score. The original Physical dimension score contained 45 items
across three subscales (Mobility, Ambulation, and Body Care and Movement) which failed to
demonstrate adequate model fit, χ2 (945) = 3109.62, p < .001, RMSEA = .06, CFI = .78, TLI = .77.
As previously described, IRT analyses were able to shorten and retain all three of these
subscales with adequate fit consistent across RMSEA, CFI, and TLI at the subscale level. This
produced the resulting 16 item Physical dimension score for the SIP-CP which also demonstrated
adequate fit across RMSEA, CFI, and TLI, χ2 (104) = 448.81, p < .001, RMSEA = .07, CFI = .92,
TLI = .91. Physical dimension scores for SIP and SIP-CP were significantly correlated (r = .95, p
< .001); subscale scores between the two versions were also significantly correlated (range: .85

DEVELOPMENT OF SIP FOR CHRONIC PAIN15
- .86; all ps < .001). The SIP and SIP-CP Physical dimension scores were also significantly
correlated with all measures of patient functioning (see Table 2 for details). Overall, the
magnitude of correlations with measures of patient functioning were equivalent between the SIP
and SIP-CP, with the latter being marginally smaller in some cases. Internal consistency of the
SIP-CP Physical dimension score was acceptable, Cronbach’s α = .81.
Psychosocial dimension score. The original Psychosocial dimension score consisted of
48 items across four subscales (Communication, Alertness Behavior, Emotional Behavior, and
Social Interaction) which demonstrated good fit on RMSEA and close to adequate fit on both the
CFI and TLI, χ2 (1080) = 2484.19, p < .001, RMSEA = .04, CFI = .88, TLI = .87. As previously
described, IRT analyses were able to shorten and retain all four subscales with adequate fit
consistent across RMSEA, CFI, and TLI. In total, there were 26 items retained for the SIP-CP
Psychosocial dimension score with adequate model fit across indices, χ2 (299) = 1002.50, p
< .001, RMSEA = .06, CFI = .89, TLI = .89. As was the case with the Physical dimension scores,
Psychosocial dimension scores for the SIP and SIP-CP were significantly correlated (r = .96, p
< .001); subscale scores between the two versions were also significantly correlated (range: .86
- .95; all ps < .001). The SIP and SIP-CP Psychosocial dimension scores were both significantly
correlated with all included measures of patient functioning (see Table 3 for details). Consistent
with the findings for the Physical dimension scores, the overall magnitude of correlations with
measures of patient functioning were close between the SIP and SIP-CP, with the only difference
being that the SIP-CP correlations were marginally smaller in all cases. Internal consistency of
the dimension score was acceptable, with Cronbach’s α = .86.
Independence/other dimension score. The original Independence/other dimension
score contained 43 items across five subscales (Sleep and Rest, Home Management, Work,
Recreation and Pastimes, and Eating) and demonstrated poor model fit, χ2 (779) = 3714.93, p
< .001, RMSEA = .07, CFI = .58, TLI = .55. Work and Home Management were removed due to a
lack of adequately performing items, while the remaining three subscales (Sleep and Rest,

DEVELOPMENT OF SIP FOR CHRONIC PAIN16
Recreation and Pastimes, and Eating) each demonstrated good fit at the subscale level. The
resulting 12 item Independence/other dimension score, however, failed to achieve adequate
model fit, χ2 (54) = 241.09, p < .001, RMSEA = .07, CFI = .63, TLI = .55, with poor internal
consistency (Cronbach’s α = .48). Given the poor fit criteria, the dimension was discarded2.
Total disability score. The total disability score of all 136 SIP items demonstrated
unacceptable fit for all indices with the exception of RMSEA, χ2 (8777) = 15509.41, p < .001,
RMSEA = .03, CFI = .70, TLI = .69. Fit for total disability remained poor when using the two
retained dimension scores of the SIP-CP, χ2 (819) = 2883.33, p < .001, RMSEA = .06, CFI = .79,
TLI = .78. Given poor fit for the total disability score across all versions tested (including a SIP-CP
model with all three dimension scores – see Footnote 2), the total score was not retained as a
scoring method for the SIP-CP. Instead, the Physical and Psychosocial Disability dimension
scores were retained, and were significantly and moderately correlated with one another, r = .47,
p < .001.
Regression Analyses. The final analyses consisted of a series of multiple linear
regressions to compare the variance accounted for by the Physical and Psychosocial dimension
scores of the SIP and SIP-CP in measures of patient functioning, after controlling for
demographic and pain-related variables (i.e., participant age, sex, pain duration and pain
2 Attempts to integrate the Independence/other subscales with good fit into Physical and
Psychosocial dimension scores were unsuccessful; all attempts to redistribute these subscales
resulted in poorer (non-adequate) fit across CFI and TLI indices. Overall model fit for SIP-
CP total disability score (54 items including Physical, Psychosocial and Independence/other
dimension scores) was also poor, with only the RMSEA indicating adequate fit, χ2 (1377) =
3481.84, p < .001, RMSEA = .05, CFI = .79, TLI = .78.

DEVELOPMENT OF SIP FOR CHRONIC PAIN17
intensity). In each regression, age, sex, and pain duration were entered as a block in the first
step, pain intensity was entered in the second step, and Physical and Psychosocial dimension
scores were then entered as a block in the third step. All regression results are displayed in Table
3.
Variance accounted for by the SIP-CP was smaller than the SIP for five of the six
measures of functioning, and equivalent for classes of pain medications. The magnitude of
reductions in variance accounted for between the SIP and SIP-CP appeared modest with an
average reduction of 2.7% across the five regression analyses (range of reduction = 0.7% for the
number of medical visits related to pain to 7.3% for the BDI-II; values in table have been
rounded). In each case, the variance accounted for by the SIP-CP remained statistically
significant in the prediction of criterion variables.
The regression analyses were also conducted to investigate the utility of the SIP-CP in
relation to other aspects of functioning that are important in those with chronic pain. The variance
accounted for by the two domain scores of the SIP-CP independently accounted for an average r2
of .31 across the four self-report measures (range r2 = .15 for pain acceptance to .41 for the
BCMDI) and was .06 for both the pain medications and pain-related medical visits variables.
Significant regression coefficients were indicated across all six analyses. In most cases, both
Physical and Psychosocial Disability had statistically significant coefficients with only two
exceptions, including the regression coefficient of Physical Disability for the BDI (p = .06) and the
coefficient of Psychosocial Disability for the pain medications variable (p = .29).
Discussion
The goal in the development of the SIP-CP was to create a shortened measure to reduce
patient response burden while retaining as much of the breadth and depth of the clinical
information captured by the SIP as possible. Previous attempts to shorten the SIP have all relied
on classical test theory, a test-centered approach that presumes a linear relationship in which the
test score is the sum of a respondent's true score and error score. Item response theory, in

DEVELOPMENT OF SIP FOR CHRONIC PAIN18
contrast, uses nonlinear mathematical models to describe the relationship between the likelihood
of endorsing an item and level of the underlying latent trait (Embretson & Reise, 2000). The use
of IRT in the present analyses allowed items to be evaluated in a way that has not been a part of
previous attempts to shorten the SIP and remains absent in many other measures of disability for
chronic pain.
With the focus on retaining a full range of clinical information, item selection was based on
model fit at the subscale level. Good model fit across RMSEA, CFI, and TLI indices were initially
obtained for 10 of the 12 subscales in the original SIP, with adequate psychometric support to
retain seven of the 12 original subscales in the final SIP-CP. Physical and Psychosocial
dimension scores demonstrated adequate model fit according to RMSEA, CFI, and TLI fit indices,
while the Independence/other disability score and the total disability score had poor fit with the
data and were both dropped from the SIP-CP and further analyses. Overall, the regression
analyses suggest a reasonable tradeoff between patient burden and breadth of clinical
information, as a 69.1% reduction in the number of items from the SIP (136 items) to the SIP-CP
(42 items) was associated with an average loss of only 2.7% of the variance in measures of
patient functioning, including depression, pain-related anxiety, pain acceptance, classes of pain
medications, and number of pain-related medical visits over the previous six months.
Psychometric characteristics of the SIP-CP, as measured by internal consistency and fit indices,
were also greatly improved relative to the SIP. In sum, these results appear to provide robust
support for the utility of the SIP-CP.
As part of the evaluation process, two subscales, Work and Home Management, were
dropped from further analysis as an adequate fitting set of items could not be specified.
Eventually, the Independence/Other dimension score was also dropped due to clearly poor fitting
models. Unfortunately, these exclusions involved areas of importance in chronic pain. In the case
of the Work subscale, the original construction was a likely culprit for unacceptable performance,
as respondents were instructed to skip eight of nine items if the initial item (“I am not working at

DEVELOPMENT OF SIP FOR CHRONIC PAIN19
all”) was positively endorsed. It may be that a single item of work disability (assessing
employment/unemployment in a similar manner) is enough to provide useful information in this
area. Certainly current work status is a useful marker regarding current functioning and treatment
outcomes (Hoffman, Papas, Chatkoff, & Kerns, 2007; Vowles, Gross, & Sorrell, 2004; Wideman &
Sullivan, 2011).
The exclusion of the Home Management subscale, and eventually the
Independence/other dimension score, including the Sleep and Rest, Eating, and Recreation and
Pastimes subscales, suggest that there is potentially room for the development of additional items
or subscales for the SIP-CP directed at these areas. While the development of new items was not
a part of the present step toward questionnaire development, it could certainly be addressed in
future data collection. As discussed previously, the IRT approach is particularly well suited to both
identification of “high performing” items and constructing subscales that make use of such items.
While the exclusion of poorly performing item sets presents potential limitations in terms of the
breath of information provided, the fact that the SIP-CP accounted for variance rates that were
remarkably similar to the SIP suggests that the loss of these items did not contribute to
substantial losses in convergent validity.
There are several objectives to pursue in the future with regard to the utility of the SIP-CP.
Although measurements in IRT are based on items rather than the sample, there is still a need to
ensure the heterogeneity of this sample by testing whether the factor structure of the SIP-CP can
be replicated in another large, independent sample of individuals seeking treatment for chronic
pain. Formal testing of the local independence assumption for dimension scores should examine
whether there are highly similar or highly correlated items across subscales, while testing for
parameter invariance by examining differential item functioning across groups (by age, sex,
socioeconomic status, pain duration, etc.) would further establish whether the SIP-CP can be
applied to a broader population of individuals with chronic pain. Sensitivity to treatment-related
change, a strength of the original SIP, should also be examined in the SIP-CP. In addition, the

DEVELOPMENT OF SIP FOR CHRONIC PAIN20
SIP-CP does not include item weights, as those used in the SIP were based on expert judgment,
rather than empirical inquiry. Further efforts to determine and test empirically supported item
weights, like those generated through IRT methods by Lindeboom and colleagues (2004), may be
of use.
Finally, tests examining the relative utility of the SIP-CP in relation to other measures of
disability may be informative. For example the SF-36 (Ruta, Garratt, Abdalla, Buckingham, &
Russell, 1993) and US National Institutes of Health-sponsored PROMIS Pain Interference
(Amtmann et al., 2010) measures, along with many other options, are available and it is not clear
that the item burden of the SIP-CP, which is greater than most other available measures, offers
more useful or broad information with regard to assessing changes in individual patient
functioning. Our clinical experience suggests that the SIP (and now SIP-CP) provides a richer
source of information and stands to offer greater utility clinical and research endeavors, but future
work will have to evaluate the accuracy of those observations empirically.
There are limitations to consider. First, the majority of data collected were self-report and
there may be inaccuracies in reporting or recall. Second, item selection prioritized the
maximization of fit at the level of the subscale (rather than at the level of the dimension or total
scores). This decision was pragmatic in nature given the need to have an overarching
organizational structure during the evaluation of 136 items. That being said, it is possible that item
evaluation at higher order levels may have identified a differing item set. As noted, the results of
the regression analyses suggest that the pragmatic decision to focus on subscale level of
analysis did not contribute to substantial losses at the level of relations with other measures of
functioning. In addition, we did not collect data across multiple time points, which precludes
evaluation of temporal stability (e.g., test-retest reliability) or change over time. Finally, it is worth
noting that this measure was developed in and intended for individuals with chronic pain actively
seeking treatment for their condition. Accordingly, it may not be appropriate for use in those with
less severe levels of disability.

DEVELOPMENT OF SIP FOR CHRONIC PAIN21
To summarize, the present study found that an IRT derived shortened version of the SIP
for individuals with chronic pain seeking treatment, the SIP-CP, was psychometrically supported
and reduced patient response burden while accounting for a similar proportion of the variance
across several measures of patient functioning. Two higher order dimension scores, Physical and
Psychosocial Disability, were supported, along with seven lower-order subscale scores, including
Body Care and Movement, Mobility, Ambulation, Communication, Alertness Behavior, Emotional
Behavior, and Social Interaction. The performance of the SIP-CP warrants future use to further
evaluate its validity and clinical utility in this area.

DEVELOPMENT OF SIP FOR CHRONIC PAIN22
References
Ainsworth, A. (2011). Introduction to item response theory. Retrieved 11/10/2013
http://www.csun.edu/~ata20315/psy427/Topic08_IntroIRT.ppt
Ashburn, M.A., & Staats, P.S. (1999). Management of chronic pain. The Lancet, 353,
1865-1869.
Beck, A., Steer, R., & Brown, G. (1996). Manual for the BDI-II: San Antonio, TX:
Psychological Corporation.
Bergner, M. (1993). Development, testing, and use of the Sickness Impact Profile. In S. R.
Walker & R. M. Rosser (Eds.), Quality of life assessment: Key issues in the 1990s (2nd ed., pp.
95-111). New York, NY: Springer.
Bergner, M., Bobbitt, R.A., Carter, W.B., & Gilson, B.S. (1981). The Sickness Impact
Profile: Development and final revision of a health status measure. Medical Care, 19, 787-805.
Bergner, M., Bobbitt, R.A., Kressel, S., Pollard, W.E., Gilson, B.S., & Morris, J.R. (1976).
The Sickness Impact Profile: Conceptual formulation and methodology for the development of a
health status measure. International Journal of Health Services, 6, 393-415.
Bergner, M., Bobbitt, R.A., Pollard, W.E., Martin, D.P., & Gilson, B.S. (1976). The
Sickness Impact Profile: Validation of a health status measure. Medical Care, 14, 57-67.
Breivik, H., Collett, B., Ventafridda, V., Cohen, R., & Gallacher, D. (2006). Survey of
chronic pain in Europe: Prevalence, impact on daily life, and treatment. European Journal of Pain,
10, 287-287.
Bryne, B.M. (2001). Structural equation modeling with AMOS: Basic concepts,
applications, and programming. Mahwah, NJ: Lawrence Earlbaum.
Busija, L., Pausenberger, E., Haines, T.P., Haymes, S., Buchbinder, R., & Osborne, R.H.
(2011). Adult measures of general health and health‐related quality of life: Medical Outcomes
Study Short Form 36‐item (SF‐36) and Short Form 12‐item (SF‐12) Health Surveys, Nottingham
Health Profile (NHP), Sickness Impact Profile (SIP), Medical Outcomes Study Short Form 6D

DEVELOPMENT OF SIP FOR CHRONIC PAIN23
(SF‐6D), Health Utilities Index Mark 3 (HUI3), Quality of Well‐Being Scale (QWB), and
Assessment of Quality of Life (AQOL). Arthritis Care & Research, 63, S383-S412.
Damiano, A.M. (1996). The Sickness Impact Profile. In B. Spilker (Ed.), Quality of life and
pharmacoeconomics in clinical trials (2nd ed., pp. 347-354). Philadelphia, PA: Lippincott-Raven.
De Bruin, A., De Witte, L., Stevens, F., & Diederiks, J. (1992). Sickness Impact Profile:
The state of the art of a generic functional status measure. Social Science & Medicine, 35, 1003-
1014.
De Bruin, A., Diederiks, J., De Witte, L., Stevens, F., & Philipsen, H. (1994). The
development of a short generic version of the Sickness Impact Profile. Journal of Clinical
Epidemiology, 47, 407-418.
De Bruin, A., Diederiks, J., De Witte, L., Stevens, F., & Philipsen, H. (1997). Assessing the
responsiveness of a functional status measure: The Sickness Impact Profile versus the SIP68.
Journal of Clinical Epidemiology, 50, 529-540.
Deyo, R.A. (1986). Comparative validity of the Sickness Impact Profile and shorter scales
for functional assessment in low-back pain. Spine, 11, 951-954.
Deyo, R.A., & Inui, T.S. (1984). Toward clinical applications of health status measures:
Sensitivity of scales to clinically important changes. Health Services Research, 19, 275-289.
Deyo, R.A., Inui, T.S., Leininger, J., & Overman, S. (1982). Physical and psychosocial
function in rheumatoid arthritis: Clinical use of a self-administered health status instrument.
Archives of Internal Medicine, 142, 879-882.
Deyo, R.A., Inui, T.S., Leininger, J.D., & Overman, S.S. (1983). Measuring functional
outcomes in chronic disease: A comparison of traditional scales and a self-administered health
status questionnaire in patients with rheumatoid arthritis. Medical Care, 21, 180-192.
Embretson, S.E., & Reise, S.P. (2000). Item response theory for psychologists. Mahwah,
New Jersey: Lawrence Erlbaum Associates, Inc.

DEVELOPMENT OF SIP FOR CHRONIC PAIN24
Follick, M.J., Smith, T.W., & Ahern, D.K. (1985). The Sickness Impact Profile: A global
measure of disability in chronic low back pain. Pain, 21, 67-76.
Fredheim, O., Kaasa, S., Fayers, P., Saltnes, T., Jordhøy, M., & Borchgrevink, P. (2008).
Chronic non‐malignant pain patients report as poor health‐related quality of life as palliative
cancer patients. Acta Anaesthesiologica Scandinavica, 52, 143-148.
Gaskin, D.J., & Richard, P. (2012). The economic costs of pain in the United States. The
Journal of Pain, 13, 715-724.
Gatchel, R.J., Peng, Y.B., Peters, M.L., Fuchs, P.N., & Turk, D.C. (2007). The
biopsychosocial approach to chronic pain: Scientific advances and future directions.
Psychological Bulletin, 133, 581-624.
Hays, R.D., Morales, L.S., & Reise, S.P. (2000). Item response theory and health
outcomes measurement in the 21st century. Medical Care, 38(9S), II28-II42.
Hu, L.T., & Bentler, P.M. (1999). Cutoff criteria for fit indexes in covariance structure
analysis: Conventional criteria versus new alternatives. Structural Equation Modeling, 6, 1-55.
Iverson, G.L., & Remick, R. (2004). Diagnostic accuracy of the British Columbia Major
Depression Inventory. Psychological Reports, 95, 1241-1247.
Jensen, M.P., Turner, J.A., Romano, J.M., & Fisher, L.D. (1999). Comparative reliability
and validity of chronic pain intensity measures. Pain, 83, 157-162.
Lindeboom, R., Holman, M., Dijkgraaf, M., Sprangers, M., Buskens, E., Diederiks, J., & De
Haan, R. (2004). Scaling the Sickness Impact Profile using item response theory: An exploration
of linearity, adaptive use, and patient driven item weights. Journal of Clinical Epidemiology, 57,
66-74.
Lipsett, P.A., Swoboda, S.M., Campbell, K.A., Cornwell III, E., Dorman, T., & Pronovost,
P.J. (2000). Sickness Impact Profile score versus a Modified Short-Form Survey for functional
outcome assessment: Acceptability, reliability, and validity in critically ill patients with prolonged
intensive care unit stays. The Journal of Trauma and Acute Care Surgery, 49, 737-743.

DEVELOPMENT OF SIP FOR CHRONIC PAIN25
MacKenzie, C.R., Charlson, M.E., DiGioia, D., & Kelley, K. (1986). Can the Sickness
Impact Profile measure change? An example of scale assessment. Journal of Chronic Diseases,
39(6), 429-438.
McCracken, L.M., & Dhingra, L. (2002). A short version of the Pain Anxiety Symptoms
Scale (PASS-20): Preliminary development and validity. Pain Research & Management: The
Journal of the Canadian Pain Society, 7, 45-50.
McCracken, L.M., & Eccleston, C. (2005). A prospective study of acceptance of pain and
patient functioning with chronic pain. Pain, 118, 164-169.
McCracken, L.M., Vowles, K.E., & Eccleston, C. (2004). Acceptance of chronic pain:
Component analysis and a revised assessment method. Pain, 107, 159-166.
McCracken, L.M., Zayfert, C., & Gross, R.T. (1992). The Pain Anxiety Symptoms Scale:
Development and validation of a scale to measure fear of pain. Pain, 50, 67-73.
Muthén, L.K., & Muthén, B.O. (2012). Mplus users guide (version 7). Los Angeles, CA:
Muthén & Muthén.
Nanda, U., McLendon, P.M., Andresen, E.M., & Armbrecht, E. (2003). The SIP68: An
abbreviated Sickness Impact Profile for disability outcomes research. Quality of Life Research,
12, 583-595.
Pollard, B., & Johnston, M. (2001). Problems with the Sickness Impact Profile: A
theoretically based analysis and a proposal for a new method of implementation and scoring.
Social Science & Medicine, 52, 921-934.
Read, J.L., Quinn, R.J., & Hoefer, M.A. (1987). Measuring overall health: An evaluation of
three important approaches. Journal of Chronic Diseases, 40, S7-S21.
Roelofs, J., McCracken, L., Peters, M.L., Crombez, G., van Breukelen, G., & Vlaeyen,
J.W. (2004). Psychometric evaluation of the Pain Anxiety Symptoms Scale (PASS) in chronic
pain patients. Journal of Behavioral Medicine, 27(2), 167-183.

DEVELOPMENT OF SIP FOR CHRONIC PAIN26
Roland, M., & Fairbank, J. (2000). The Roland–Morris Disability Questionnaire and the
Oswestry Disability Questionnaire. Spine, 25, 3115-3124.
Roland, M., & Morris, R. (1983). A study of the natural history of back pain. Part i:
Development of a reliable and sensitive measure of disability in low-back pain. Spine, 8, 141-144.
Stratford, P., Solomon, P., Binkley, J., Finch, E., & Gill, C. (1993). Sensitivity of Sickness
Impact Profile items to measure change over time in a low-back pain patient group. Spine, 18,
1723.
Sullivan, M., Ahlmen, M., & Bjelle, A. (1990). Health status assessment in rheumatoid
arthritis. I. Further work on the validity of the Sickness Impact Profile. The Journal of
Rheumatology, 17, 439-447.
Vowles, K.E., & McCracken, L.M. (2008). Acceptance and values-based action in chronic
pain: A study of treatment effectiveness and process. Journal of Consulting and Clinical
Psychology, 76, 397-407.
Vowles, K.E., McCracken, L.M., McLeod, C., & Eccleston, C. (2008). The Chronic Pain
Acceptance Questionnaire: Confirmatory factor analysis and identification of patient subgroups.
Pain, 140(2), 284-291.
Vowles, K.E., Witkiewitz, K., Sowden, G., & Ashworth, J. (2014). Acceptance and
commitment therapy for chronic pain: Evidence of mediation and clinically significant change
following an abbreviated interdisciplinary program of rehabilitation. The Journal of Pain, 15, 101-
113.
Watt-Watson, J.H., & Graydon, J.E. (1989). Sickness Impact Profile: A measure of
dysfunction with chronic pain patients. Journal of Pain and Symptom Management, 4, 152-156.

DEVELOPMENT OF SIP FOR CHRONIC PAIN27
Table 1
Item Selection Process for Mobility Subscale
Iteration Original 1 2 3 4 Final
Item number &
adjustment (+/-)
N/A -7 -9 -10 -3 -5
χ2 127.107 104.926 80.481 46.603 27.496 9.085
df 35 27 20 14 9 5
p-value < .0001 < .0001 < .0001 < .0001 .0012 .1057
RMSEA .060 .063 .065 .057 .053 .034
CFI .926 .934 .937 .959 .973 .992
TLI .905 .912 .912 .938 .955 .984
Note. RMSEA <.05, CFI >.95, TLI >.95 constitute good fit.

DEVELOPMENT OF SIP FOR CHRONIC PAIN28
Table 2
SIP and SIP-CP Correlations with Clinical Measures
Physical Disability Psychosocial Disability
SIP SIP-CP SIP SIP-CP
Depression
BDI-II (n = 355) .40 .35 .67 .60
BCMDI (n = 358) .52 .47 .73 .69
Pain-related anxiety .44 .40 .55 .53
Pain-related acceptance -.35 -.34 -.48 -.43
Classes of pain medication .29 .29 .19 .17
Pain-related medical visits .28 .26 .28 .26
Note. All correlations statistically significant, p < .001. N = 723 unless otherwise noted.

DEVELOPMENT OF SIP FOR CHRONIC PAIN29
Table 3
Results of the Linear Regression Analyses for the SIP and SIP-CP Predicting Functioning
SIP SIP-CP
Step Predictor Δ r 2 Β (final) Δ r 2 Β (final)
Depression – BDI-II
1 Age
Sex
Pain Duration
.03* -.16***
.04
.02
.03* -.18***
.04
.03
2 Pain Intensity .05*** .06 .05*** .05
3 Physical Disability
Psychosocial Disability
.40*** .03
.63***
.32*** .09+
.54***
Total R2 .47 .40
Depression – BCMDI
1 Age
Sex
Pain Duration
.02* -.02
-.05
-.02
.02* -.03
-.05
-.02
2 Pain Intensity .08*** .12** .08*** .13***
3 Physical Disability
Psychosocial Disability
.45*** .11*
.63***
.41*** .15***
.58***
Total R2 .56 .52
Pain-Related Anxiety
1 Age .01 < -.01 .01 -.01

DEVELOPMENT OF SIP FOR CHRONIC PAIN30
Sex
Pain Duration
-.07+
< .01
-.06
.01
2 Pain Intensity .08*** .14*** .08*** .14***
3 Physical Disability
Psychosocial Disability
.26*** .14***
.43***
.25*** .16***
.42***
Total R2 .34 .33
(Tables continues)
Table 3 (con’t)
SIP SIP-CP
Step Predictor Δ r 2 Β (final) Δ r 2 Β (final)
Pain Acceptance
1 Age
Sex
Pain Duration
.04*** .03
.18***
< .01
.04*** .04
.18***
< .01
2 Pain Intensity .06*** -.14*** .06*** -.14***
3 Physical Disability
Psychosocial Disability
.18*** -.08+
-.39***
.15*** -.15***
-.32***
Total R2 .29 .26
Classes of Pain Medication
1 Age
Sex
Pain Duration
< .01 .02
-.03
-.02
< .01 .02
-.02
-.01
2 Pain Intensity .04*** .10* .04*** .10**
3 Physical Disability .06*** .24*** .06*** .23***

DEVELOPMENT OF SIP FOR CHRONIC PAIN31
Psychosocial Disability .03 .04
Total R2 .10 .10
Pain-Related Medical Visits
1 Age
Sex
Pain Duration
.01* -.11***
<.01
.03
.01* -.12***
.01
.03
2 Pain Intensity .04*** .11** .04*** .11**
3 Physical Disability
Psychosocial Disability
.07*** .16***
.15***
.06*** .15***
.16***
Total R2 .12 .12
+ p < .10, * p < .05, ** p < .005, ***p < .001
Figure 1
Item Characteristic Curves for SIP and SIP-CP Mobility Subscale

DEVELOPMENT OF SIP FOR CHRONIC PAIN32

DEVELOPMENT OF SIP FOR CHRONIC PAIN33
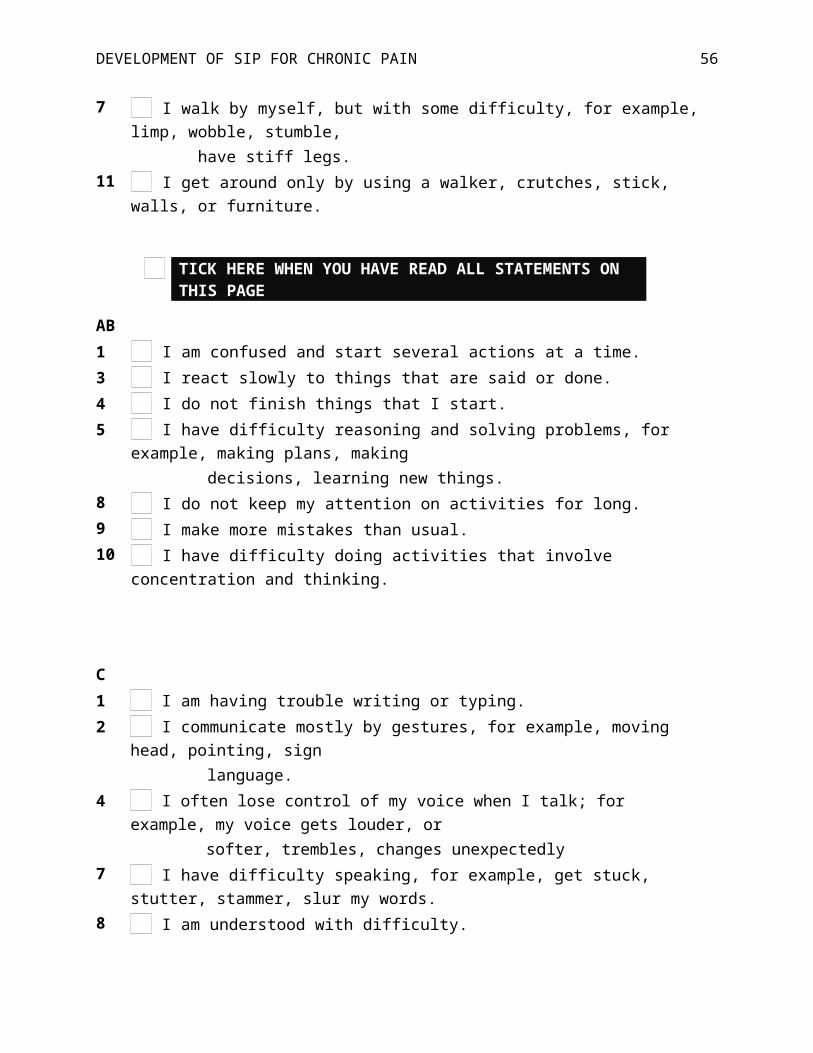
SIP for Chronic Pain (SIP-CP)
PLEASE RESPOND TO (TICK) ONLY THOSE STATEMENTS THAT YOU ARE SURE DESCRIBE YOU TODAY AND ARE RELATED TO YOUR STATE OF HEALTH.
EB1 I say how bad or useless I am, for example, that I am a burden to others.
2 I laugh or cry suddenly.
3 I often moan and groan in pain or discomfort.
5 I act nervous or restless.7 I act irritable and impatient with myself; for example, I talk badly about myself,
swear at myself, and blame myself for things that happen.9 I get sudden frights.
BCM1 I make difficult moves with help, for example, getting into or out of cars, the bath.
2 I do not move in or out of a bed or chair by myself but am moved by another person or mechanical aid.
6 I stand up only with someone's help.
14 I do not bathe myself completely, for example, I require assistance with bathing
17 I have trouble getting shoes, socks, stocking on.
19 I do not fasten my clothing, for example, I require assistance with buttons, zippers, and shoelaces.
23 I get dressed only with someone's help.
TICK HERE WHEN YOU HAVE READ ALL STATEMENTS ON THIS PAGE

DEVELOPMENT OF SIP FOR CHRONIC PAIN34
This group of statements is to do with anything you usually do in caring for your home or garden. Considering just those things that you do, please respond by ticking only those statements that you are sure describe you today and are related to your state of health.
M1 I am getting around only within one building.
2 I stay within one room.
4 I am staying in bed most of the time.
6 I stay at home most of the time.
8 I am not going in to town.
SI3 I show less interest in other people's problems, for example, I don't listen when they
tell me about their problems, I don't offer to help.4 I often act irritable to those around me, for example, snap at people, give sharp
answers, criticize easily.5 I show less affection.9 My sexual activity is decreased.
12 I make many demands, for example, insist that people do things for me, tell them how to do things.
15 I have frequent outbursts of anger at family members, for example, strike at them, scream, or throw things at them.
20 I am not joking with my family members as I usually do.
A2 I do not walk up or down hills.
3 I use stairs only with mechanical support, for example, handrails, stick, crutches.7 I walk by myself, but with some difficulty, for example, limp, wobble, stumble,
have stiff legs.11 I get around only by using a walker, crutches, stick, walls, or furniture.
TICK HERE WHEN YOU HAVE READ ALL STATEMENTS ON THIS PAGE
AB1 I am confused and start several actions at a time.3 I react slowly to things that are said or done.

DEVELOPMENT OF SIP FOR CHRONIC PAIN35
4 I do not finish things that I start.
5 I have difficulty reasoning and solving problems, for example, making plans, making decisions, learning new things.
8 I do not keep my attention on activities for long.9 I make more mistakes than usual.10 I have difficulty doing activities that involve concentration and thinking.
C1 I am having trouble writing or typing.2 I communicate mostly by gestures, for example, moving head, pointing, sign
language.4 I often lose control of my voice when I talk; for example, my voice gets louder, or
softer, trembles, changes unexpectedly7 I have difficulty speaking, for example, get stuck, stutter, stammer, slur my words.8 I am understood with difficulty.9 I do not speak clearly when I am under stress.
Now can you please review the questions to be certain that you have filled out all the information?
Look at the last tick box on each sheet to make sure that you have not missed a page.
TICK HERE WHEN YOU HAVE READ ALL STATEMENTS ON THIS PAGE

DEVELOPMENT OF SIP FOR CHRONIC PAIN36
Supplementary Table 1
Summary of Psychometric Data (N = 723)
Mean SD
Classes of pain medication 2.680 1.500
Medical visits for pain in the last 6 months 6.726 7.159
SIP total disability .265 .128
Physical dimension .231 .151
Body Care and Movement .215 .164
Mobility .228 .202
Ambulation .273 .171
Psychosocial dimension .272 .169
Communication .105 .143
Alertness Behavior .378 .302
Emotional Behavior .330 .229
Social interaction .270 .189
Independence/Other dimension .299 .114
Sleep and Rest .261 .174
Home Management .359 .224
Work .570 .250
Recreation and Pastimes .343 .193
Eating .046 .067
Depressiona
BDI-II (n=355) 20.575 9.891
BCMDI (n=358) 26.879 14.555
Pain-related anxiety (PASS-20) 47.594 19.184
Pain-related acceptance (CPAQ) 47.175 18.764a Depression measures changed midway through data collection; participants received either the BDI-II or BCMDI, but not both.

DEVELOPMENT OF SIP FOR CHRONIC PAIN37
Supplementary Table 2
Item Selection Process for Ambulation Subscale
Iteration Original 1 2 3 4 5 6 7 8 9 10 Final
Item number &
adjustment (+/-)
N/A -6 -5 -10 -4 -8 -1 +1,
-7
-1 -12 +7 -9
χ2 838.16 663.11 328.46 157.91 126.57 107.55 86.32 90.80 62.80 13.88 37.15 3.402
df 54 44 35 27 20 14 9 9 5 2 5 2
p-value <.0001 <.0001 <.0001 <.0001 <.0001 <.0001 <.0001 <.0001 <.0001 .001 <.0001 .1825
RMSEA .142 .140 .108 .082 .086 .096 .109 .112 .127 .091 .094 .031
CFI .648 .685 .839 .926 .936 .941 .936 .928 .931 .977 .955 .997
TLI .570 .607 .793 .901 .911 .912 .893 .882 .862 .930 .911 .991
Note. RMSEA <.05, CFI >.95, TLI >.95 constitute good fit.

DEVELOPMENT OF SIP FOR CHRONIC PAIN38
Supplementary Table 3
Item Selection Process for Body Care and Movement Subscale
Iteration Original 1 2 3 4 5 6 7 8 9 10 11Item number & adjustment (+/-)
N/A -12 -16 -3 -21 -18 -11 +18, +11, -7
-22 -18 -11 -20
χ2 731.95 679.36 676.45 614.7 511.39 494.45 462.37 403.49 285.1 265.29 229.42 214.49df 230 209 189 170 152 135 119 135 119 104 90 77p-value <.0001 <.0001 <.0001 <.0001 <.0001 <.0001 <.0001 <.0001 <.0001 <.0001 <.0001 <.0001RMSEA .055 .056 .060 .060 .057 .061 .063 .052 .044 .046 .046 .050CFI .890 .898 .898 .905 .921 .920 .992 .939 .960 .961 .961 .965TLI .869 .887 .886 .893 .911 .909 .911 .931 .955 .954 .954 .958(Table continues)

DEVELOPMENT OF SIP FOR CHRONIC PAIN39
Supplementary Table 3 (con’t)
Iteration 12 13 14 15 16 17 18 19 20 21 22 23 FinalItem number & adjustment (+/-)
-8 -5 -6 -15 +6,+15,-4
-9 -10 -13 -6 -15 +6,+15,-19
-15 +19
χ2 207.66 178.84 174.01 90.01 114.09 97.37 60.90 47.42 39.65 27.51 42.08 32.03 36.652df 65 54 44 35 44 35 27 20 14 9 14 9 14p-value <.0001 <.0001 <.0001 <.0001 <.0001 <.0001 .0002 .0005 .0003 .0012 .0001 .0002 .0008RMSEA .055 .057 .064 .047 .047 .050 .042 .044 .050 .053 .053 .060 .047CFI .962 .965 .961 .983 .979 .981 .988 .990 .990 .992 .986 .987 .991TLI .954 .958 .951 .978 .974 .976 .984 .986 .984 .986 .979 .979 .986Note. RMSEA <.05, CFI >.95, TLI >.95 constitute good fit.

DEVELOPMENT OF SIP FOR CHRONIC PAIN40
Supplementary Table 4
Item Selection Process for Communication Subscale
Iteration Original 1 2 Final
Item number &
adjustment (+/-)
N/A -6 -3 -5
χ2 64.931 51.404 46.389 17.139
df 27 20 14 9
p-value .0001 .0001 <.0001 .0466
RMSEA .044 .047 .057 .035
CFI .951 .959 .957 .988
TLI .935 .943 .935 .980
Note. RMSEA <.05, CFI >.95, TLI >.95 constitute good fit.

DEVELOPMENT OF SIP FOR CHRONIC PAIN41
Supplementary Table 5
Item Selection Process for Alertness Behavior Subscale
Iteration Original 1 2 Final
Item number &
adjustment (+/-)
N/A -2 -7 -6
χ2 80.075 55.384 46.167 25.038
df 35 27 20 14
p-value <.0001 .001 .008 .0342
RMSEA .065 .054 .060 .047
CFI .975 .985 .985 .992
TLI .968 .980 .978 .989
Note. RMSEA <.05, CFI >.95, TLI >.95 constitute good fit.

DEVELOPMENT OF SIP FOR CHRONIC PAIN42
Supplementary Table 6
Item Selection Process for Emotional Behavior Subscale
Iteration Original 1 2 3 4 Final
Item number &
adjustment (+/-)
N/A -6 -3 -8 +3,
+8
-2
+2,
-8
χ2 113.591 48.069 39.869 25.811 40.366 33.259
df 27 20 14 9 14 14
p-value <.0001 .0004 .0003 .0022 .0002 .0026
RMSEA .067 .044 .051 .051 .051 .044
CFI .914 .969 .969 .973 .962 .972
TLI .885 .957 .953 .955 .943 .959
Note. RMSEA <.05, CFI >.95, TLI >.95 constitute good fit.

DEVELOPMENT OF SIP FOR CHRONIC PAIN43
Supplementary Table 7
Item Selection Process for Social Interaction Subscale
Iteration Original 1 2 3 4 5 6 7Item number & adjustment (+/-)
N/A -2 -13 -11 -10 -1 -7 -6
χ2 748.09 631.60 568.40 527.25 491.34 362.78 231.23 201.88df 170 152 135 119 104 90 77 65p-value <.0001 <.0001 <.0001 <.0001 <.0001 <.0001 <.0001 <.0001RMSEA .069 .066 .067 .069 .072 .065 .053 .054CFI .862 .883 .888 .875 .874 .904 .941 .945TLI .846 .868 .873 .857 .854 .888 .931 .934(Table continues)

DEVELOPMENT OF SIP FOR CHRONIC PAIN44
Supplementary Table 7 (con’t)
Iteration 8 9 10 11 12 13 14 FinalItem number & adjustment (+/-)
-19 -8 -16 -18 -14 -15 -9 +15,+9,-17
χ2 156.97 118.24 82.56 69.64 34.38 9.87 6.24 30.72df 54 44 35 27 20 14 9 14p-value <.0001 <.0001 <.0001 <.0001 .0237 .7714 .7154 .0061RMSEA .051 .048 .043 .047 .032 <.0001 <.0001 .041CFI .956 .963 .972 .974 .988 1 1 .983TLI .946 .953 .964 .966 .983 1.006 1.005 .974Note. RMSEA <.05, CFI >.95, TLI >.95 constitute good fit.

DEVELOPMENT OF SIP FOR CHRONIC PAIN45
Supplementary Table 8
Selection Process for Sleep and Rest Subscale
Iteration Original 1 2 Final
Item number &
adjustment (+/-)
N/A -1 -6 -5
χ2 104.115 12.647 11.369 2.368
df 14 9 5 2
p-value <.0001 .1792 .0445 .3061
RMSEA .094 .024 .042 .016
CFI .430 .957 .925 .988
TLI .145 .928 .851 .964
Note. RMSEA <.05, CFI >.95, TLI >.95 constitute good fit.

DEVELOPMENT OF SIP FOR CHRONIC PAIN46
Supplementary Table 9
Selection Process for Recreation and Pastimes Subscale
Iteration Original 1 2 3 Final
Item number &
adjustment (+/-)
N/A -4 -8 -3 -7
χ2 279.454 252.094 52.936 12.772 4.792
df 20 14 9 5 2
p-value <.0001 <.0001 <.0001 .0256 .0911
RMSEA .134 .153 .082 .046 .044
CFI .549 .591 .905 .981 .991
TLI .368 .386 .841 .961 .974
Note. RMSEA <.05, CFI >.95, TLI >.95 constitute good fit.

DEVELOPMENT OF SIP FOR CHRONIC PAIN47
Supplementary Table 10
Selection Process for Eating Subscale
Iteration Original 1 2 3 Final
Item number &
adjustment (+/-)
N/A -3 -4 -7 +7,
-2
χ2 21.495 13.773 7.133 0.872 2.588
df 14 9 5 2 2
p-value .0896 .1306 .2109 .6468 .2742
RMSEA .027 .027 .024 <.0001 .020
CFI .948 .967 .984 1 .996
TLI .922 .945 .969 1.025 .988
Note. RMSEA <.05, CFI >.95, TLI >.95 constitute good fit.

DEVELOPMENT OF SIP FOR CHRONIC PAIN48
Supplementary Figure 1
Item Characteristic Curves for SIP and SIP-CP Ambulation Subscale

DEVELOPMENT OF SIP FOR CHRONIC PAIN49
Supplementary Figure 2
Item Characteristic Curves for SIP and SIP-CP Body Care and Movement Subscale

DEVELOPMENT OF SIP FOR CHRONIC PAIN50
Supplementary Figure 3
Item Characteristic Curves for SIP and SIP-CP Communication Subscale
Note. Scale changes along X-axis.

DEVELOPMENT OF SIP FOR CHRONIC PAIN51
Supplementary Figure 4
Item Characteristic Curves for SIP and SIP-CP Alertness Behavior Subscale

DEVELOPMENT OF SIP FOR CHRONIC PAIN52
Supplementary Figure 5
Item Characteristic Curves for SIP and SIP-CP Emotional Behavior Subscale

DEVELOPMENT OF SIP FOR CHRONIC PAIN53
Supplementary Figure 6
Item Characteristic Curves for SIP and SIP-CP Social Interaction Subscale
Note. Scale changes along X-axis.

DEVELOPMENT OF SIP FOR CHRONIC PAIN54
Supplementary Figure 7
Item Characteristic Curves for SIP and SIP-CP Sleep and Rest Subscale

DEVELOPMENT OF SIP FOR CHRONIC PAIN55
Supplementary Figure 8
Item Characteristic Curves for SIP and SIP-CP Recreation and Pastimes Subscale
DEVELOPMENT OF SIP FOR CHRONIC PAIN56
Supplementary Figure 9
Item Characteristic Curves for SIP and SIP-CP Eating Subscale

DEVELOPMENT OF SIP FOR CHRONIC PAIN57
Supplementary Figure 10
Item Characteristic Curves for SIP Home Management Subscale
Note. Subscale dropped from SIP-CP due to lack of adequately performing items (indicated by S-shaped curves) needed to define the model.

DEVELOPMENT OF SIP FOR CHRONIC PAIN58
Supplementary Figure 11
Item Characteristic Curves for SIP Work Subscale
Note. Subscale dropped from SIP-CP due to lack of adequately performing items (indicated by S-shaped curves) needed to define the model.