Embed Size (px)
DESCRIPTION
Bayesian Estimation of Nowcast and Forecast Flow. NSF Group Meeting Update Carolyn Krekeler 11/12/2010. Recent Developments. Implemented Nowcasting and Forecasting in Bayesian Network with message passing - PowerPoint PPT Presentation
Citation preview
Bayesian Estimation of Nowcast and Forecast Flow
NSF Group Meeting UpdateCarolyn Krekeler
11/12/2010
Recent Developments
• Implemented Nowcasting and Forecasting in Bayesian Network with message passing
• Reduced number of spatial nodes so relationships between adjacent nodes contain more information
• Investigated addition of point source rain data and Nexrad data, separately
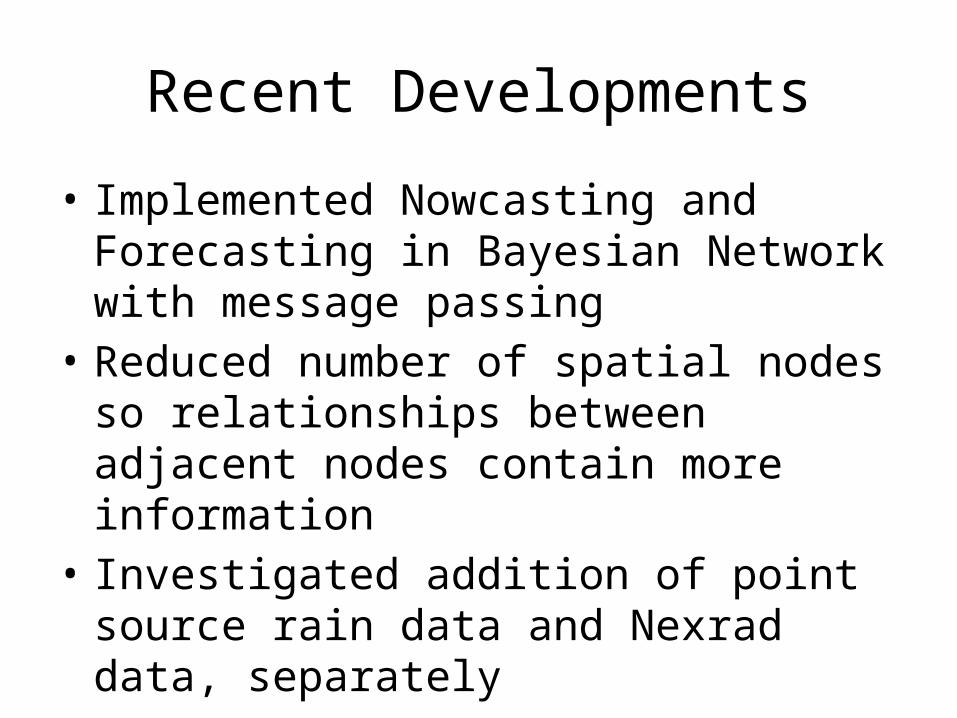
Network and Features
• Training Data– WAM Predictions, 1/1/1990 – 12/31/2008, ft3/s– NCDC Rain at Starke (confined) and High Springs (unconfined) accumulated over 5 day
periods, 10/1/2000 – 12/31/2008, mm
.
.
.
.
.
.
RC
RU
Nowcast Day
Forecast Day
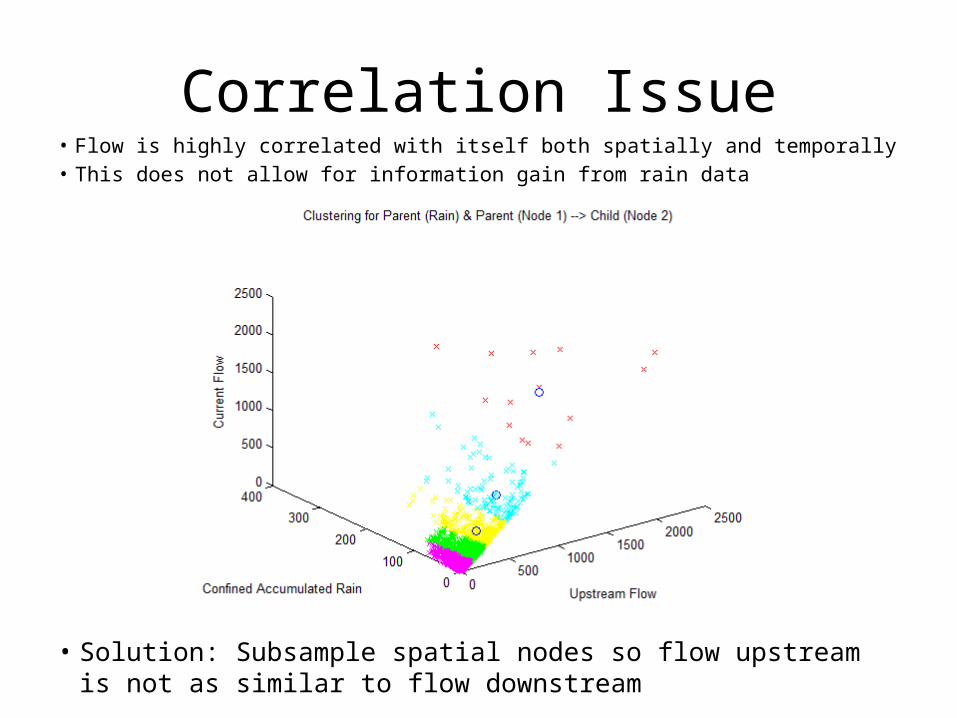
Correlation Issue• Flow is highly correlated with itself both spatially and temporally• This does not allow for information gain from rain data
• Solution: Subsample spatial nodes so flow upstream is not as similar to flow downstream
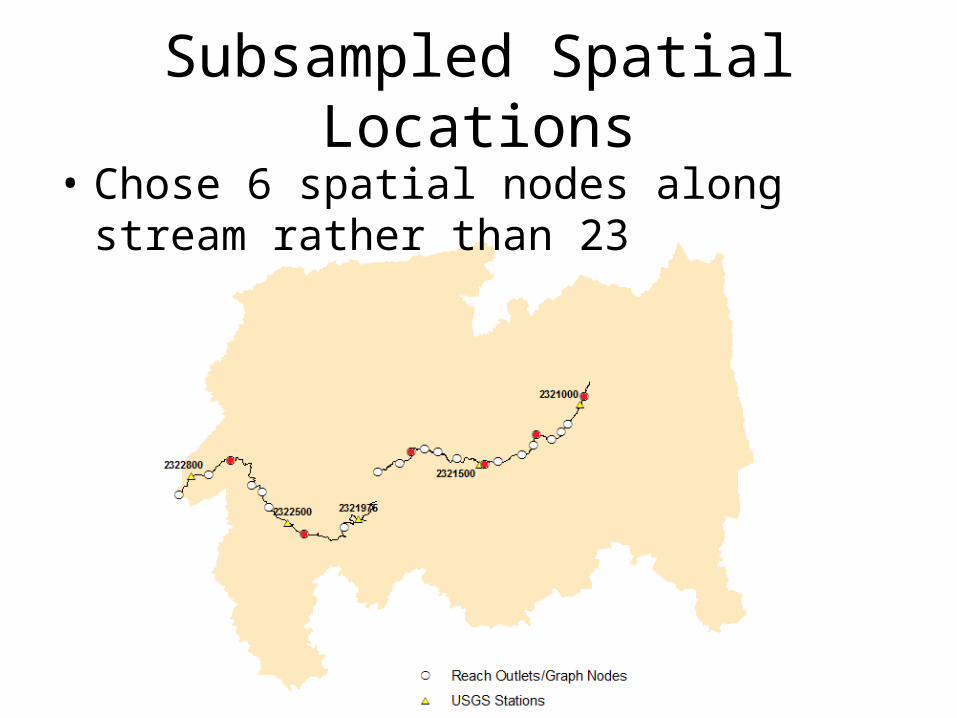
Subsampled Spatial Locations• Chose 6 spatial nodes along stream rather
than 23
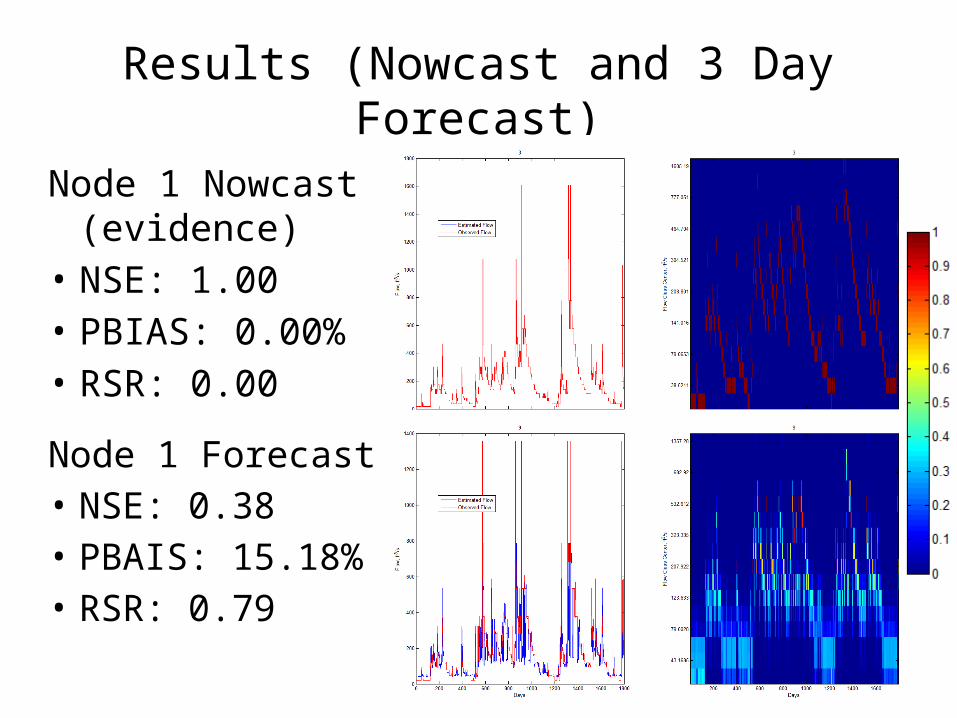
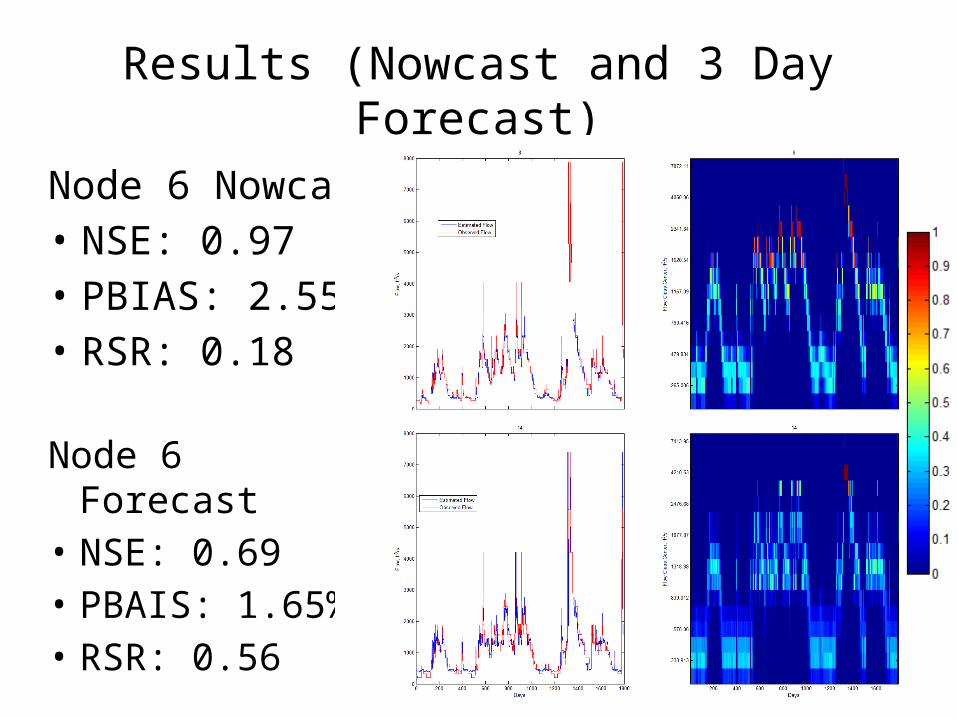
Results (Nowcast and 3 Day Forecast)
Node 1 Nowcast (evidence)
• NSE: 1.00• PBIAS: 0.00%• RSR: 0.00
Node 1 Forecast• NSE: 0.38• PBAIS: 15.18%• RSR: 0.79
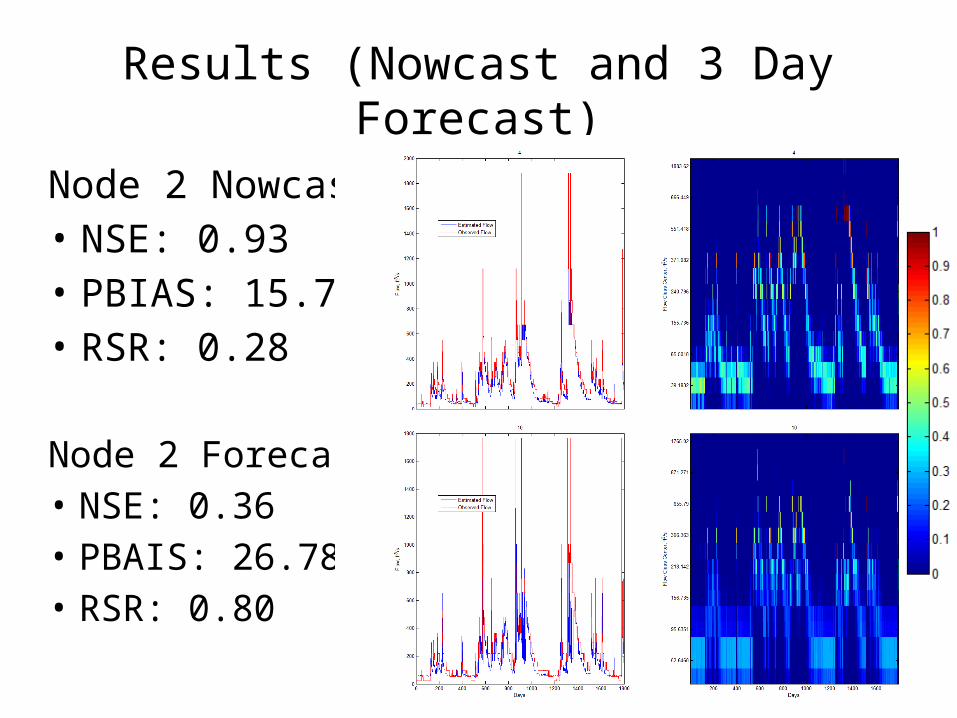
Results (Nowcast and 3 Day Forecast)
Node 2 Nowcast• NSE: 0.93• PBIAS: 15.70%• RSR: 0.28
Node 2 Forecast• NSE: 0.36• PBAIS: 26.78%• RSR: 0.80

Results (Nowcast and 3 Day Forecast)
Node 3 Nowcast• NSE: 0.81• PBIAS: 22.53%• RSR: 0.43
Node 3 Forecast• NSE: 0.33• PBAIS: 29.01%• RSR: 0.82

Results (Nowcast and 3 Day Forecast)
Node 4 Nowcast• NSE: 0.67• PBIAS: 26.41%• RSR: 0.57
Node 4 Forecast• NSE: 0.27• PBAIS: 24.89%• RSR: 0.85

Results (Nowcast and 3 Day Forecast)
Node 5 Nowcast (evidence)
• NSE: 1.00• PBIAS: 0.00%• RSR: 0.00
Node 5 Forecast• NSE: 0.55• PBAIS: -10.51%• RSR: 0.67
Results (Nowcast and 3 Day Forecast)
Node 6 Nowcast• NSE: 0.97• PBIAS: 2.55%• RSR: 0.18
Node 6 Forecast• NSE: 0.69• PBAIS: 1.65%• RSR: 0.56

Topology with Nexrad Data
• Summed Nexrad daily rain over contributing area for each node
• Accumulated summed Nexrad over 5 day period, as with point rain data
• Rain over last 5 days at the nowcast day used as evidence for forecasting flow
R
Nowcast Day
Forecast Day
R
R
R
R
R
Nexrad Data Issue
• Forecast flow shows similar issue as with pre-subsampled flow
• Flow highly resembles Nexrad rain, with limited contribution from nowcast flow
• Possible Solutions:– Subsample Network more to weaken relationship
between rain and nowcast flow– Use fewer rain classes– Increase smoothing factor (kernel overlap) when
forming pdfs of rain
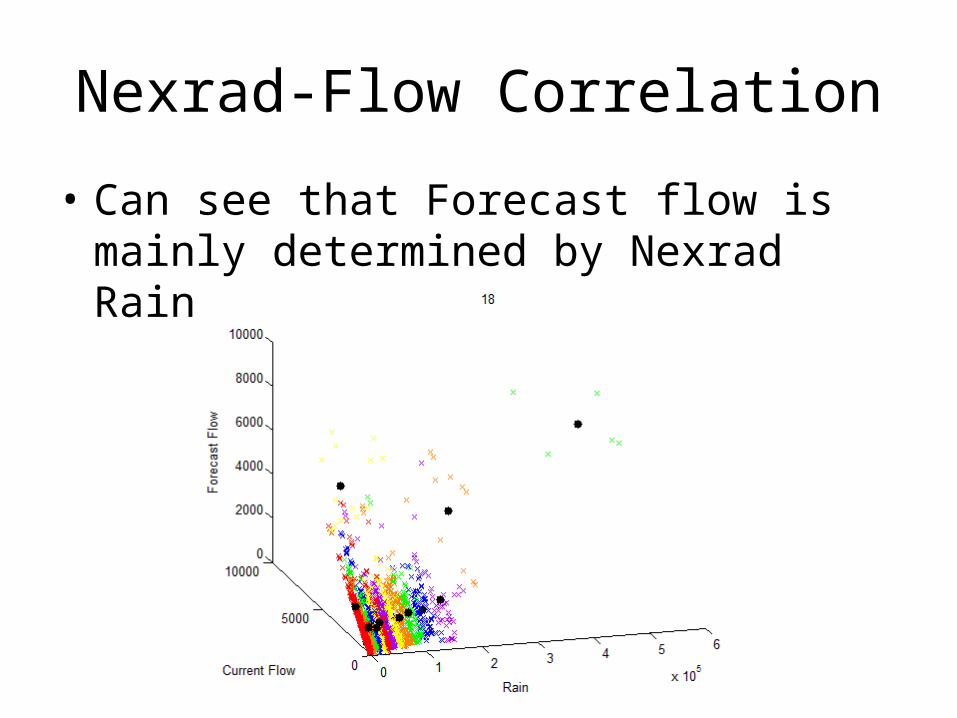
Nexrad-Flow Correlation
• Can see that Forecast flow is mainly determined by Nexrad Rain data
Nexrad Analysis
• To get somewhat meaningful forecast results, used class labels from nowcast days (not affected by rain), rather than those generated from clustering current flow, current rain, and future flow together
• Still get noisy forecast, but it at least follows the trend of flow rather than rain
• Will continue to use point rain data instead of Nexrad
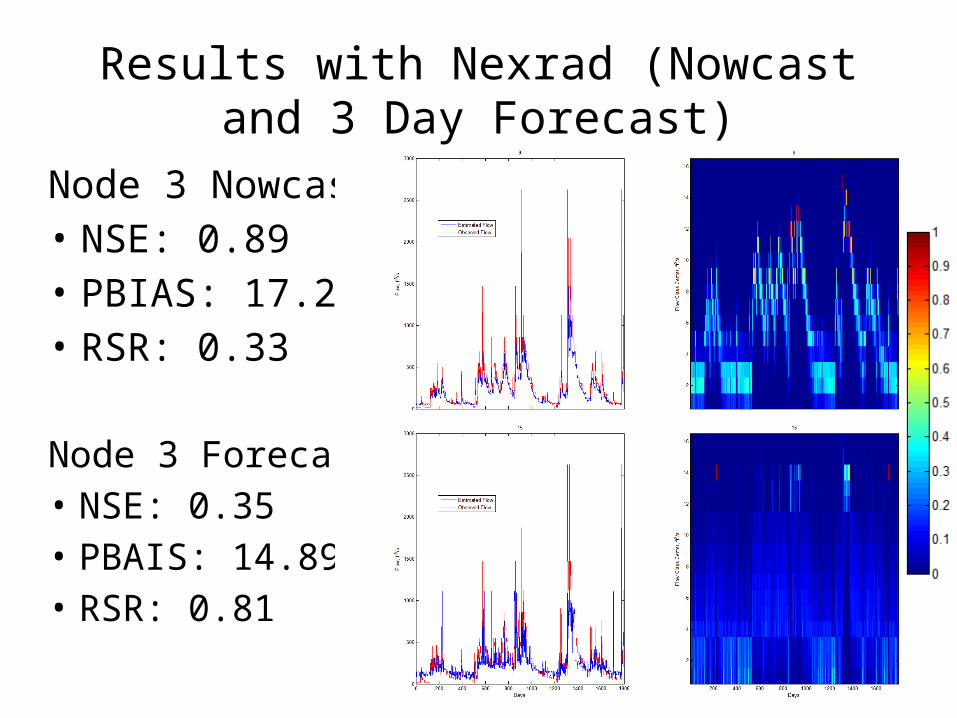
Node 3 Nowcast• NSE: 0.89• PBIAS: 17.24%• RSR: 0.33
Node 3 Forecast• NSE: 0.35• PBAIS: 14.89%• RSR: 0.81
Results with Nexrad (Nowcast and 3 Day Forecast)

The End
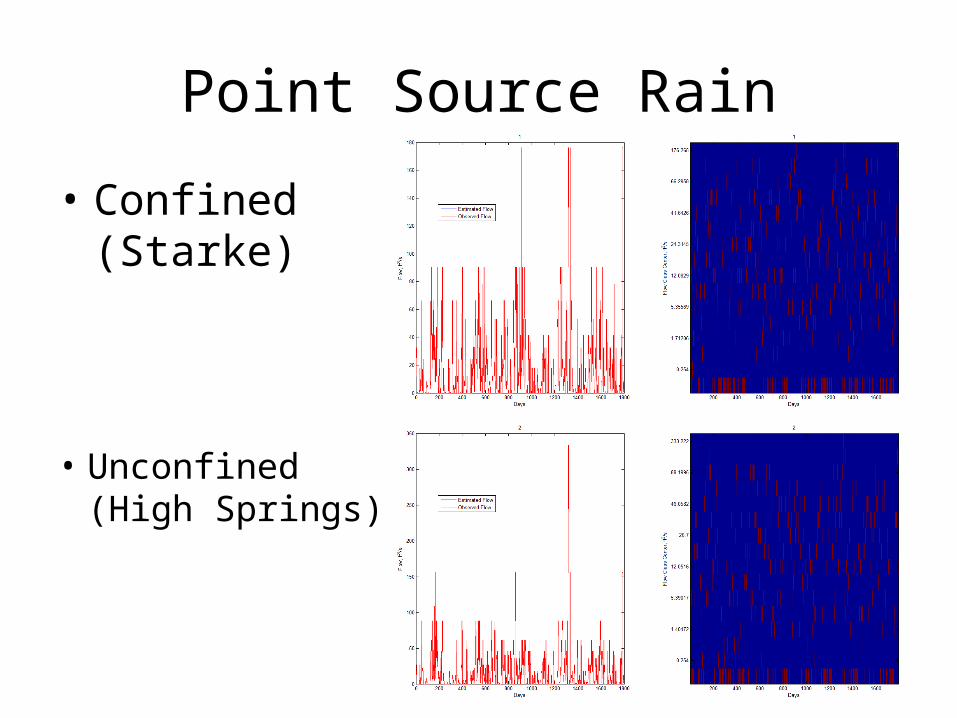
Point Source Rain
• Confined (Starke)
• Unconfined (High Springs)
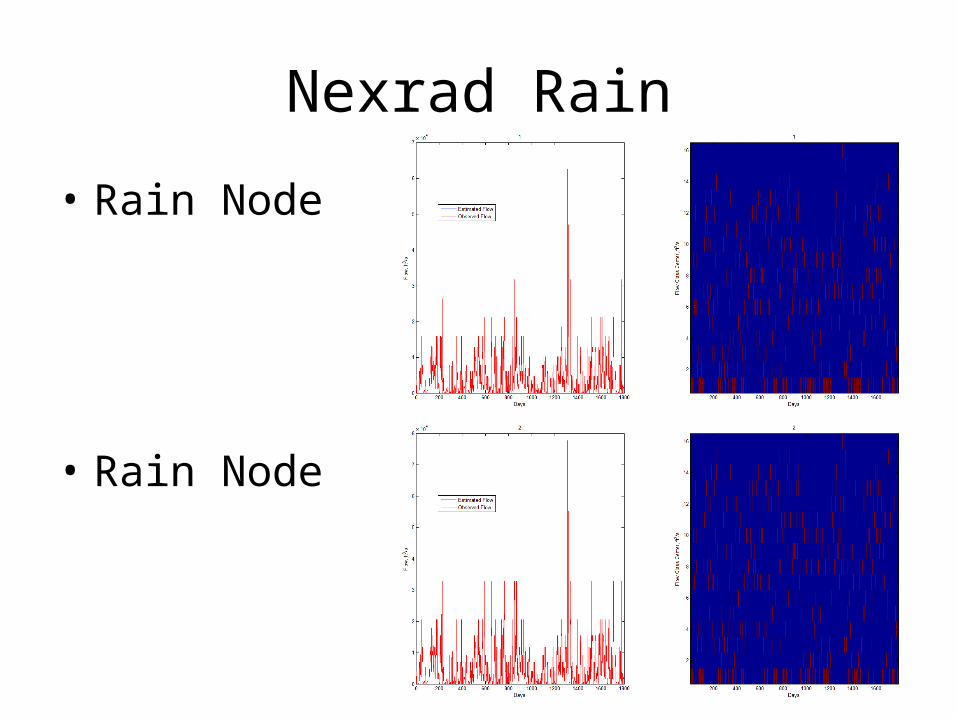
Nexrad Rain
• Rain Node 1
• Rain Node 2

Nexrad Rain
• Rain Node 3
• Rain Node 4

Nexrad Rain
• Rain Node 5
• Rain Node 6