Embed Size (px)
Citation preview
Bayesian inference and forecast ofCOVID-19Release 0.0.10
Apr 08, 2022


Contents
1 Installation 3
2 First Steps 5
3 Disclaimer 7
4 Models 9
5 Data Retrieval 13
6 Plotting 15
7 Indices and tables 17
Python Module Index 19
Index 21
i

ii
Bayesian inference and forecast of COVID-19, Release 0.0.10
Warning: Important: This is the documentation of code no longer in active development. This is the link to thecurrent docs: covid19-inference
Warning: Important: This is the documentation of code no longer in active development This is the link to thecurrent docs: covid19-inference
Contents 1

Bayesian inference and forecast of COVID-19, Release 0.0.10
2 Contents
CHAPTER 1
Installation
There exists three different possiblities to run the models:
1. Clone the repository:
git clone https://github.com/Priesemann-Group/covid19_inference_forecast
2. Install the module via pip
pip install git+https://github.com/Priesemann-Group/covid19_inference_forecast.git
3. Run the notebooks directly in Google Colab. At the top of the notebooks files there should be a symbol which opensthem directly in a Google Colab instance.
3
Bayesian inference and forecast of COVID-19, Release 0.0.10
4 Chapter 1. Installation
CHAPTER 2
First Steps
To get started, we recommend to look at one of the currently two example notebooks:
1. SIR model with changes points This model is extensively discussed in our paper: Inferring COVID-19spreading rates and potential change points for case number forecasts
2. SEIR-like model with extensions The second notebook runs a probably more realistic SEIR-like model. De-tails are found in the reference guide Models .
Warning: Important: This is the documentation of code no longer in active development. This is the link to thecurrent docs: covid19-inference
5

Bayesian inference and forecast of COVID-19, Release 0.0.10
6 Chapter 2. First Steps
CHAPTER 3
Disclaimer
We evaluate the data provided by the John Hopkins University link. We exclude any liability with regard to the qualityand accuracy of the data used, and also with regard to the correctness of the statistical analysis. The evaluation of thedifferent growth phases represents solely our personal opinion.
The number of cases reported may be significantly lower than the number of people actually infected. Also, wemust point out that week-ends and changes in the test system may lead to fluctuations in reported cases that have noequivalent in actual case numbers.
Certainly, at this stage all statistical predictions are subject to great uncertainty because the general trends of theepidemic are not yet clear. In any case, the statistical trends that we interpret from the data are only suitable forpredictions if the measures taken by the government and authorities to contain the pandemic remain in force and arebeing followed by the population. We must also point out that, even if the statistics indicate that the epidemic is undercontrol, we may at any time see a resurgence of infection figures until the disease is eradicated worldwide.
Warning: Important: This is the documentation of code no longer in active development. This is the link to thecurrent docs: covid19-inference
7

Bayesian inference and forecast of COVID-19, Release 0.0.10
8 Chapter 3. Disclaimer
CHAPTER 4
Models
covid19_inference.SIR_with_change_points(new_cases_obs, change_points_list,date_begin_simulation, num_days_sim,diff_data_sim, N, priors_dict=None,weekends_modulated=False, week-end_modulation_type=’step’)
Parameters
• new_cases_obs (list or array) – Timeseries (day over day) of newly reportedcases (not the total number)
• change_points_list (list of dicts) – List of dictionaries, each correspondingto one change point.
Each dict can have the following key-value pairs. If a pair is not provided, the respectivedefault is used.
– pr_mean_date_begin_transient : datetime.datetime, NO default
– pr_median_lambda : number, same as default priors, below
– pr_sigma_lambda : number, same as default priors, below
– pr_sigma_date_begin_transient : number, 3
– pr_median_transient_len : number, 3
– pr_sigma_transient_len : number, 0.3
• date_begin_simulation (datetime.datetime) – The begin of the simulationdata
• num_days_sim (integer) – Number of days to forecast into the future
• diff_data_sim (integer) – Number of days that the simulation-begin predates thefirst data point in new_cases_obs. This is necessary so the model can fit the reporting delay.Set this parameter to a value larger than what you expect to find for the reporting delay.
• N (number) – The population size. For Germany, we used 83e6
9
Bayesian inference and forecast of COVID-19, Release 0.0.10
• priors_dict (dict) – Dictionary of the prior assumptions
Possible key-value pairs (and default values) are:
– pr_beta_I_begin : number, default = 100
– pr_median_lambda_0 : number, default = 0.4
– pr_sigma_lambda_0 : number, default = 0.5
– pr_median_mu : number, default = 1/8
– pr_sigma_mu : number, default = 0.2
– pr_median_delay : number, default = 8
– pr_sigma_delay : number, default = 0.2
– pr_beta_sigma_obs : number, default = 10
– week_end_days : tuple, default = (6,7)
– pr_mean_weekend_factor : number, default = 0.7
– pr_sigma_weekend_factor :number, default = 0.17
• weekends_modulated (bool) – Whether to add the prior that cases are less reportedon week ends. Multiplies the new cases numbers on weekends by a number between0 and 1, given by a prior beta distribution. The beta distribution is parametrised bypr_mean_weekend_factor and pr_sigma_weekend_factor
• weekend_modulation_type ('step' or 'abs_sine':) – whether the week-ends are modulated by a step function, which only multiplies the days given byweek_end_days by the week_end_factor, or whether the whole week is modulated by anabs(sin(x)) function, with an offset with flat prior.
Returns pymc3.Model – Returns an instance of pymc3 model with the change points
covid19_inference.SEIR_with_extensions(new_cases_obs, change_points_list,date_begin_simulation, num_days_sim,diff_data_sim, N, priors_dict=None,with_random_walk=True, week-ends_modulated=False, week-end_modulation_type=’step’)
This model includes 3 extensions to the SIR_model_with_change_points:
1. The SIR model now includes a incubation period during which infected people are not infectious, inthe spirit of an SEIR model. In contrast to the SEIR model, the length of incubation period is notexponentially distributed but has a lognormal distribution.
2. People that are infectious are observed with a delay that is now lognormal distributed. In theSIR_model_with_change_points we assume a fixed delay between infection and observation.
3. lambda_t has an additive term given by a Gaussian random walk. Thereby, we want to fit any deviationin lambda_t that is not captured by the change points. If the change points are wisely chosen, and therest of the model captures the dynamics well, one would expect that the amplitude of the random walkis small. In this case, the posterior distribution of sigma_random_walk will be small.
Parameters
• new_cases_obs (list or array) – Timeseries (day over day) of newly reportedcases (not the total number)
10 Chapter 4. Models
Bayesian inference and forecast of COVID-19, Release 0.0.10
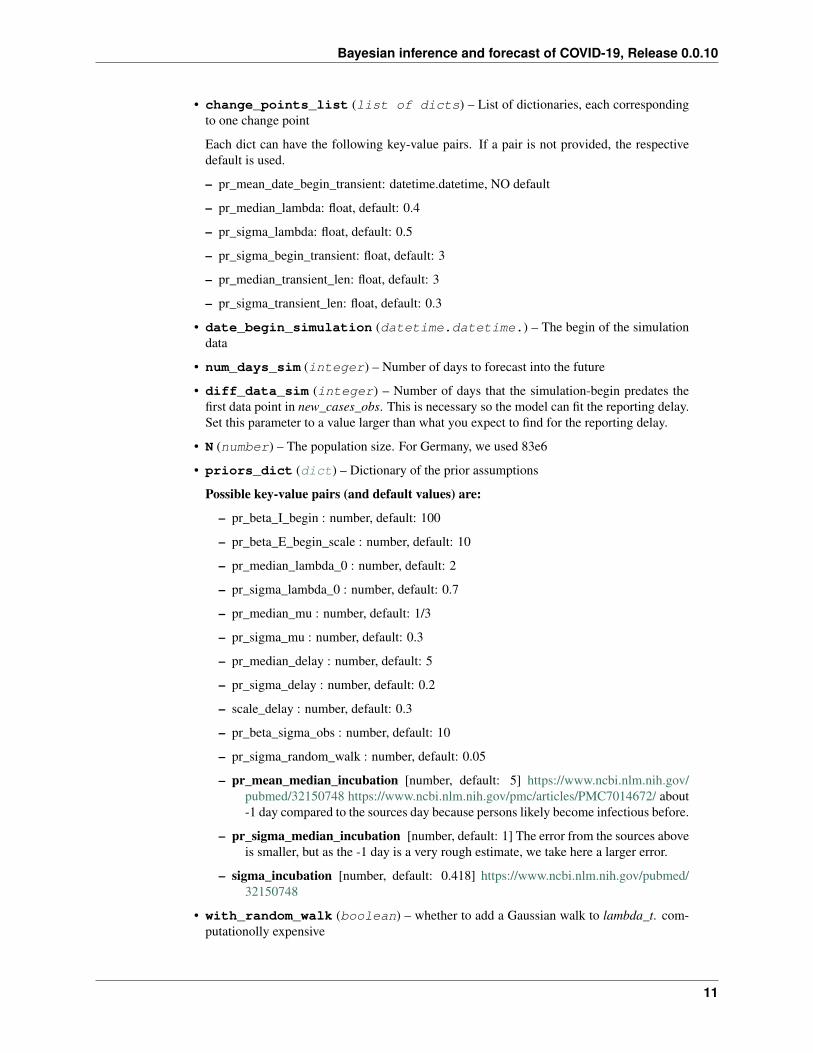
• change_points_list (list of dicts) – List of dictionaries, each correspondingto one change point
Each dict can have the following key-value pairs. If a pair is not provided, the respectivedefault is used.
– pr_mean_date_begin_transient: datetime.datetime, NO default
– pr_median_lambda: float, default: 0.4
– pr_sigma_lambda: float, default: 0.5
– pr_sigma_begin_transient: float, default: 3
– pr_median_transient_len: float, default: 3
– pr_sigma_transient_len: float, default: 0.3
• date_begin_simulation (datetime.datetime.) – The begin of the simulationdata
• num_days_sim (integer) – Number of days to forecast into the future
• diff_data_sim (integer) – Number of days that the simulation-begin predates thefirst data point in new_cases_obs. This is necessary so the model can fit the reporting delay.Set this parameter to a value larger than what you expect to find for the reporting delay.
• N (number) – The population size. For Germany, we used 83e6
• priors_dict (dict) – Dictionary of the prior assumptions
Possible key-value pairs (and default values) are:
– pr_beta_I_begin : number, default: 100
– pr_beta_E_begin_scale : number, default: 10
– pr_median_lambda_0 : number, default: 2
– pr_sigma_lambda_0 : number, default: 0.7
– pr_median_mu : number, default: 1/3
– pr_sigma_mu : number, default: 0.3
– pr_median_delay : number, default: 5
– pr_sigma_delay : number, default: 0.2
– scale_delay : number, default: 0.3
– pr_beta_sigma_obs : number, default: 10
– pr_sigma_random_walk : number, default: 0.05
– pr_mean_median_incubation [number, default: 5] https://www.ncbi.nlm.nih.gov/pubmed/32150748 https://www.ncbi.nlm.nih.gov/pmc/articles/PMC7014672/ about-1 day compared to the sources day because persons likely become infectious before.
– pr_sigma_median_incubation [number, default: 1] The error from the sources aboveis smaller, but as the -1 day is a very rough estimate, we take here a larger error.
– sigma_incubation [number, default: 0.418] https://www.ncbi.nlm.nih.gov/pubmed/32150748
• with_random_walk (boolean) – whether to add a Gaussian walk to lambda_t. com-putationolly expensive
11

Bayesian inference and forecast of COVID-19, Release 0.0.10
Returns pymc3.Model – Returns an instance of pymc3 model with the change points
Warning: Important: This is the documentation of code no longer in active development. This is the link to thecurrent docs: covid19-inference
12 Chapter 4. Models
CHAPTER 5
Data Retrieval
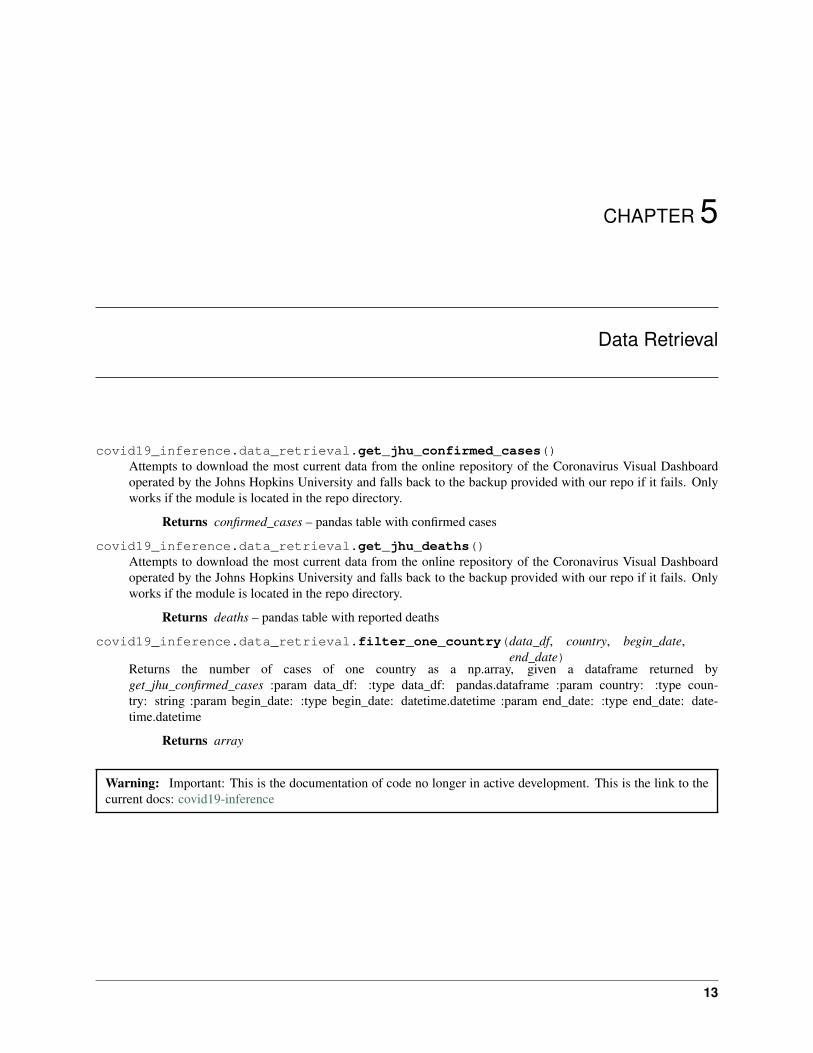
covid19_inference.data_retrieval.get_jhu_confirmed_cases()Attempts to download the most current data from the online repository of the Coronavirus Visual Dashboardoperated by the Johns Hopkins University and falls back to the backup provided with our repo if it fails. Onlyworks if the module is located in the repo directory.
Returns confirmed_cases – pandas table with confirmed cases
covid19_inference.data_retrieval.get_jhu_deaths()Attempts to download the most current data from the online repository of the Coronavirus Visual Dashboardoperated by the Johns Hopkins University and falls back to the backup provided with our repo if it fails. Onlyworks if the module is located in the repo directory.
Returns deaths – pandas table with reported deaths
covid19_inference.data_retrieval.filter_one_country(data_df, country, begin_date,end_date)
Returns the number of cases of one country as a np.array, given a dataframe returned byget_jhu_confirmed_cases :param data_df: :type data_df: pandas.dataframe :param country: :type coun-try: string :param begin_date: :type begin_date: datetime.datetime :param end_date: :type end_date: date-time.datetime
Returns array
Warning: Important: This is the documentation of code no longer in active development. This is the link to thecurrent docs: covid19-inference
13
Bayesian inference and forecast of COVID-19, Release 0.0.10
14 Chapter 5. Data Retrieval
CHAPTER 6
Plotting
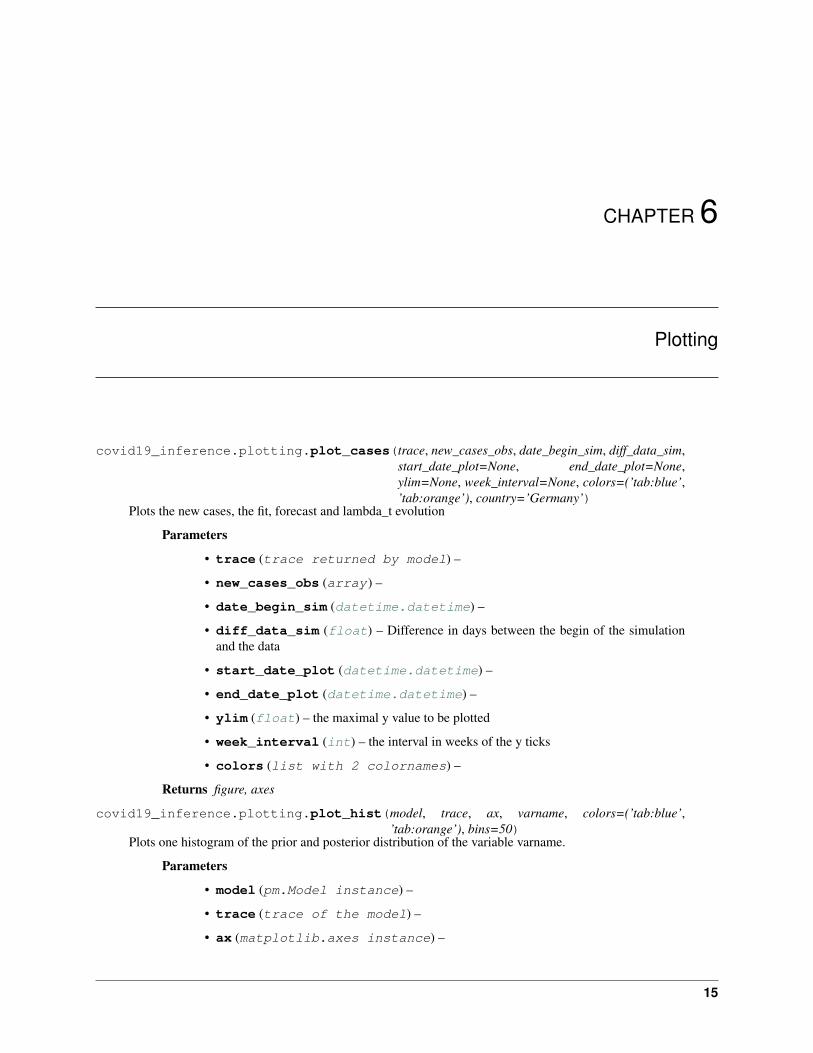
covid19_inference.plotting.plot_cases(trace, new_cases_obs, date_begin_sim, diff_data_sim,start_date_plot=None, end_date_plot=None,ylim=None, week_interval=None, colors=(’tab:blue’,’tab:orange’), country=’Germany’)
Plots the new cases, the fit, forecast and lambda_t evolution
Parameters
• trace (trace returned by model) –
• new_cases_obs (array) –
• date_begin_sim (datetime.datetime) –
• diff_data_sim (float) – Difference in days between the begin of the simulationand the data
• start_date_plot (datetime.datetime) –
• end_date_plot (datetime.datetime) –
• ylim (float) – the maximal y value to be plotted
• week_interval (int) – the interval in weeks of the y ticks
• colors (list with 2 colornames) –
Returns figure, axes
covid19_inference.plotting.plot_hist(model, trace, ax, varname, colors=(’tab:blue’,’tab:orange’), bins=50)
Plots one histogram of the prior and posterior distribution of the variable varname.
Parameters
• model (pm.Model instance) –
• trace (trace of the model) –
• ax (matplotlib.axes instance) –
15
Bayesian inference and forecast of COVID-19, Release 0.0.10
• varname (string) –
• colors (list with 2 colornames) –
• bins (number or array) – passed to np.hist
Returns None
covid19_inference.plotting.get_all_free_RVs_names(model)Returns the names of all free parameters of the model
Parameters model (pm.Model instance) –
Returns list of variable names
covid19_inference.plotting.get_prior_distribution(model, x, varname)Given a model and variable name, returns the prior distribution evaluated at x. :param model: :type model:pm.Model instance :param x: :type x: list or array :param varname: :type varname: string
Returns array
16 Chapter 6. Plotting

CHAPTER 7
Indices and tables
• genindex
• modindex
• search
17
Bayesian inference and forecast of COVID-19, Release 0.0.10
18 Chapter 7. Indices and tables
Python Module Index
ccovid19_inference, 9covid19_inference.data_retrieval, 13covid19_inference.plotting, 15
19

Bayesian inference and forecast of COVID-19, Release 0.0.10
20 Python Module Index
Index
Ccovid19_inference (module), 1, 9covid19_inference.data_retrieval (mod-
ule), 13covid19_inference.plotting (module), 15
Ffilter_one_country() (in module
covid19_inference.data_retrieval), 13
Gget_all_free_RVs_names() (in module
covid19_inference.plotting), 16get_jhu_confirmed_cases() (in module
covid19_inference.data_retrieval), 13get_jhu_deaths() (in module
covid19_inference.data_retrieval), 13get_prior_distribution() (in module
covid19_inference.plotting), 16
Pplot_cases() (in module
covid19_inference.plotting), 15plot_hist() (in module covid19_inference.plotting),
15
SSEIR_with_extensions() (in module
covid19_inference), 10SIR_with_change_points() (in module
covid19_inference), 9
21