Embed Size (px)
Citation preview
Bath Visitor Survey 2014
Presentation of Key Findings
Diane Goffey, DirectorThe South West Research Company Ltd.
Bath Tourism Members’ Forum - 10th March 2015
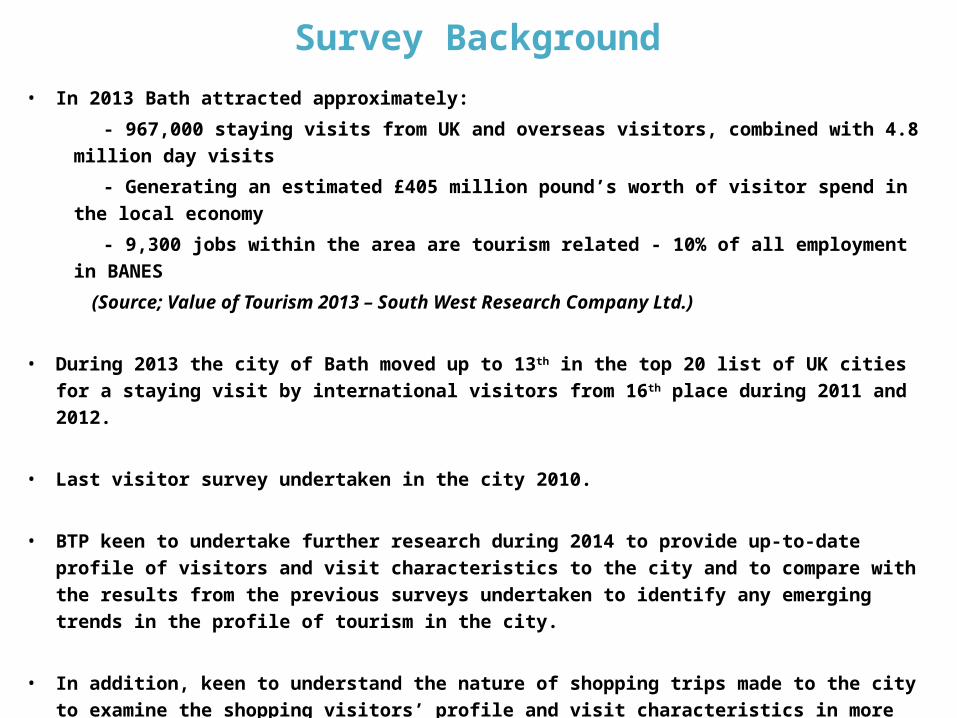
• In 2013 Bath attracted approximately:
- 967,000 staying visits from UK and overseas visitors, combined with 4.8 million day visits
- Generating an estimated £405 million pound’s worth of visitor spend in the local economy
- 9,300 jobs within the area are tourism related - 10% of all employment in BANES
(Source; Value of Tourism 2013 – South West Research Company Ltd.)
• During 2013 the city of Bath moved up to 13th in the top 20 list of UK cities for a staying visit by international visitors from 16th place during 2011 and 2012.
• Last visitor survey undertaken in the city 2010.
• BTP keen to undertake further research during 2014 to provide up-to-date profile of visitors and visit characteristics to the city and to compare with the results from the previous surveys undertaken to identify any emerging trends in the profile of tourism in the city.
• In addition, keen to understand the nature of shopping trips made to the city to examine the shopping visitors’ profile and visit characteristics in more detail.
• Important that the research also provided BTP with a clearer understanding of satisfaction levels with shopping in the city compared with other competitor destinations and the motivations behind shopping visits made to the city.
Survey Background
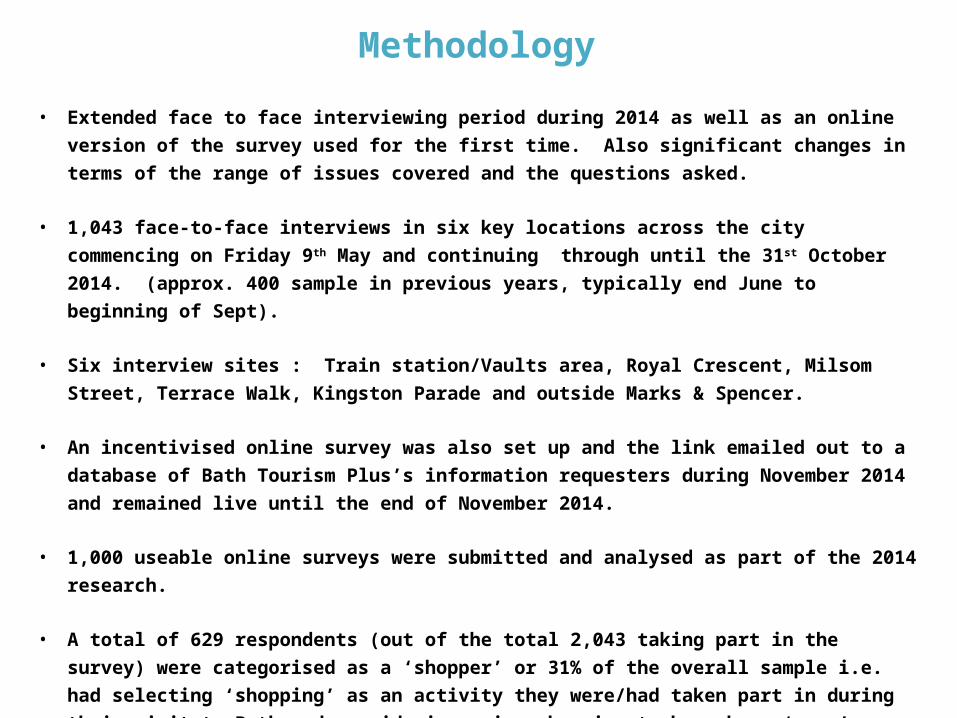
• Extended face to face interviewing period during 2014 as well as an online version of the survey used for the first time. Also significant changes in terms of the range of issues covered and the questions asked.
• 1,043 face-to-face interviews in six key locations across the city commencing on Friday 9th May and continuing through until the 31st October 2014. (approx. 400 sample in previous years, typically end June to beginning of Sept).
• Six interview sites : Train station/Vaults area, Royal Crescent, Milsom Street, Terrace Walk, Kingston Parade and outside Marks & Spencer.
• An incentivised online survey was also set up and the link emailed out to a database of Bath Tourism Plus’s information requesters during November 2014 and remained live until the end of November 2014.
• 1,000 useable online surveys were submitted and analysed as part of the 2014 research.
• A total of 629 respondents (out of the total 2,043 taking part in the survey) were categorised as a ‘shopper’ or 31% of the overall sample i.e. had selecting ‘shopping’ as an activity they were/had taken part in during their visit to Bath and considering going shopping to have been ‘very’ or ‘quite’ important in their decision to visit Bath.
• Not possible to cover all results today – snapshot only!
Methodology
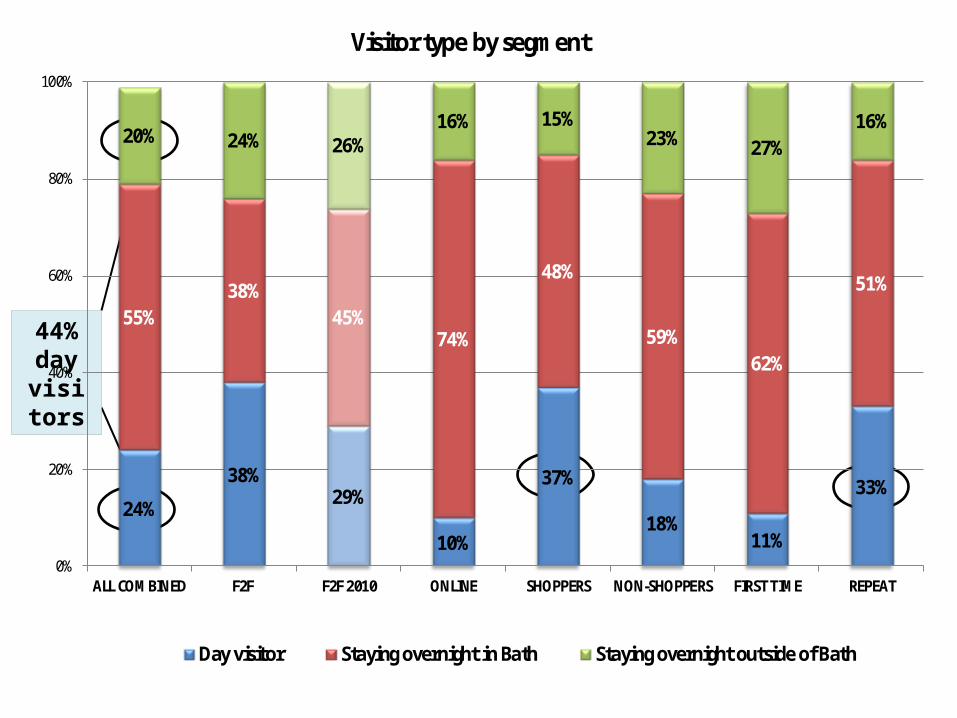
24%
38% 29%
10%
37%
18% 11%
33%
55% 38%
45% 74%
48%
59% 62%
51%
20% 24% 26% 16% 15%
23% 27% 16%
0%
20%
40%
60%
80%
100%
ALL COMBINED F2F F2F 2010 ONLINE SHOPPERS NON-SHOPPERS FIRST TIME REPEAT
Day visitor Staying overnight in Bath Staying overnight outside of Bath
Visitor type by segment
44% day
visitors
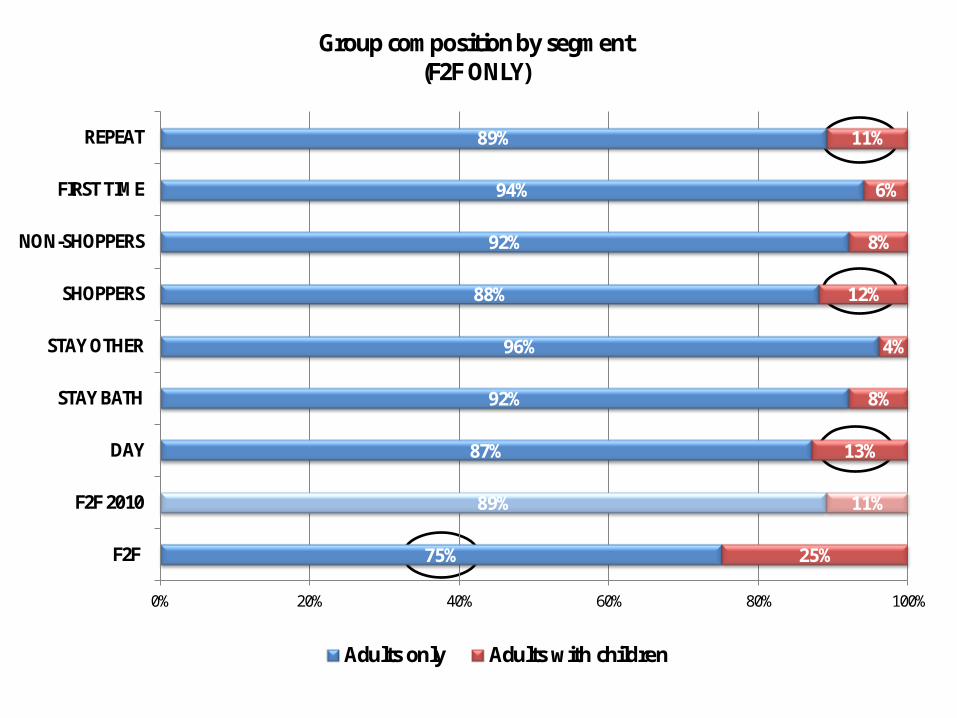
75%
89%
87%
92%
96%
88%
92%
94%
89%
25%
11%
13%
8%
4%
12%
8%
6%
11%
0% 20% 40% 60% 80% 100%
F2F
F2F 2010
DAY
STAY BATH
STAY OTHER
SHOPPERS
NON-SHOPPERS
FIRST TIME
REPEAT
Adults only Adults with children
Group composition by segment (F2F ONLY)
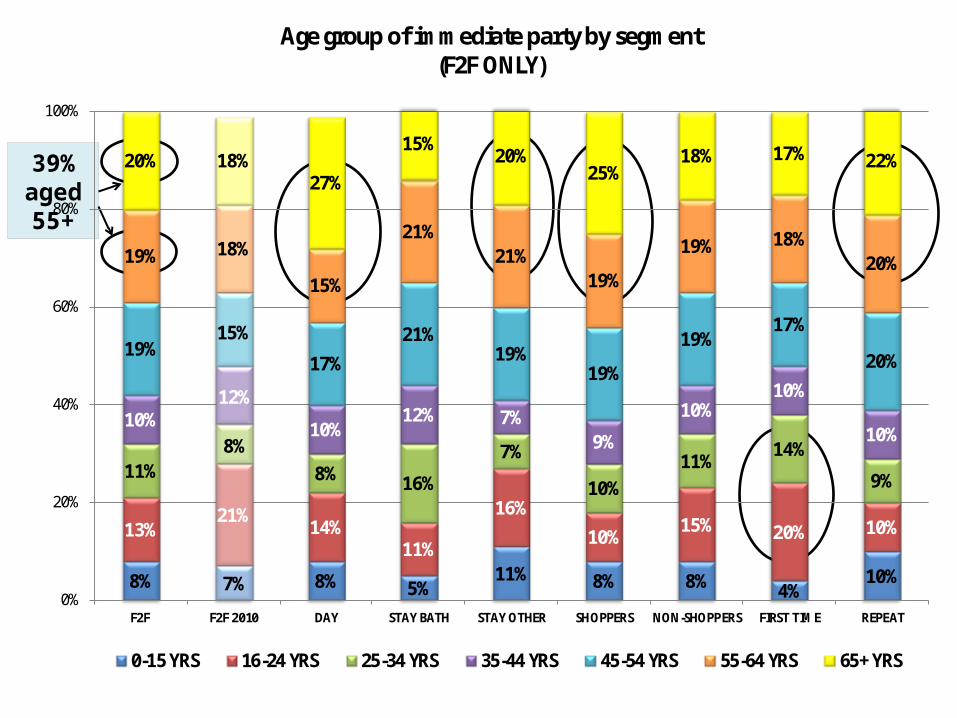
8% 7% 8% 5% 11% 8% 8% 4%
10%
13% 21%
14% 11%
16%
10% 15% 20% 10%
11% 8%
8% 16%
7%
10% 11%
14%
9%
10% 12%
10% 12% 7%
9%
10% 10%
10%
19% 15%
17%
21% 19%
19%
19% 17%
20%
19% 18%
15%
21% 21%
19%
19% 18% 20%
20% 18% 27%
15% 20%
25% 18% 17% 22%
0%
20%
40%
60%
80%
100%
F2F F2F 2010 DAY STAY BATH STAY OTHER SHOPPERS NON-SHOPPERS FIRST TIME REPEAT
0-15 YRS 16-24 YRS 25-34 YRS 35-44 YRS 45-54 YRS 55-64 YRS 65+ YRS
Age group of immediate party by segment (F2F ONLY)
39% aged 55+
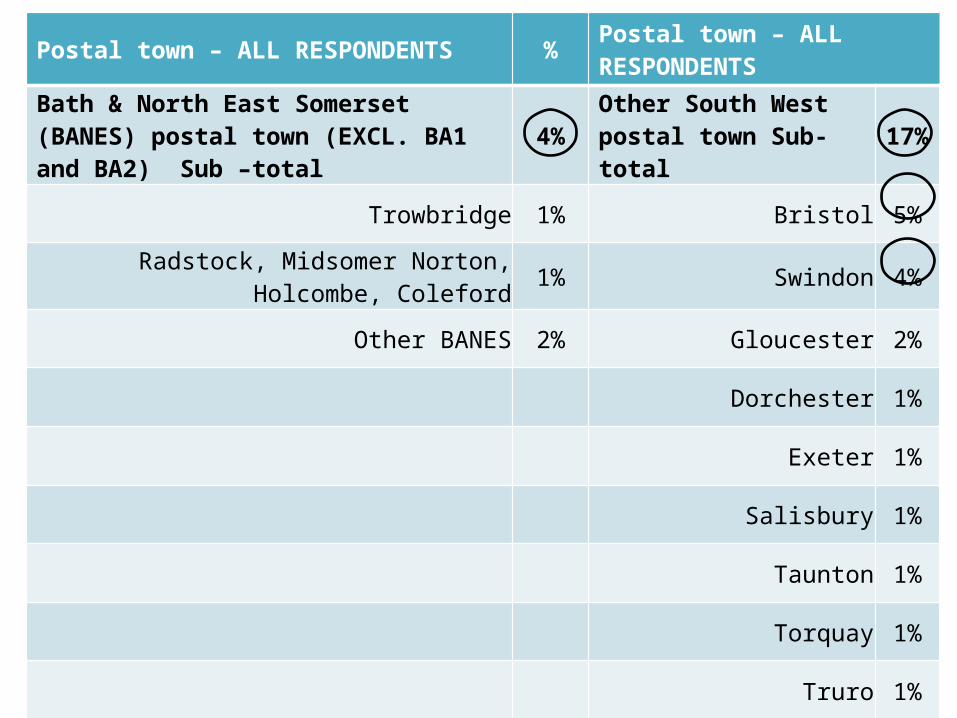
Postal town – ALL RESPONDENTS % Postal town – ALL RESPONDENTS
Bath & North East Somerset (BANES) postal town (EXCL. BA1 and BA2) Sub –total 4% Other South West postal
town Sub-total 17%
Trowbridge 1% Bristol 5%
Radstock, Midsomer Norton, Holcombe, Coleford 1% Swindon 4%
Other BANES 2% Gloucester 2%
Dorchester 1%
Exeter 1%
Salisbury 1%
Taunton 1%
Torquay 1%
Truro 1%
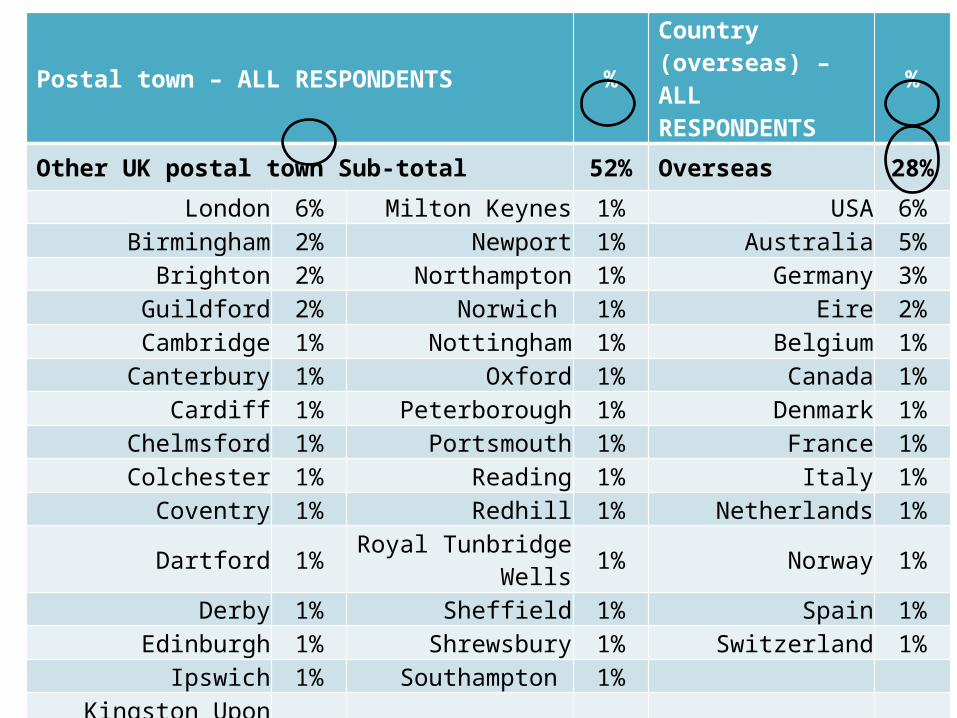
Postal town – ALL RESPONDENTS % Country (overseas) – ALL RESPONDENTS %
Other UK postal town Sub-total 52% Overseas 28%
London 6% Milton Keynes 1% USA 6%Birmingham 2% Newport 1% Australia 5%
Brighton 2% Northampton 1% Germany 3%Guildford 2% Norwich 1% Eire 2%
Cambridge 1% Nottingham 1% Belgium 1%Canterbury 1% Oxford 1% Canada 1%
Cardiff 1% Peterborough 1% Denmark 1%Chelmsford 1% Portsmouth 1% France 1%Colchester 1% Reading 1% Italy 1%
Coventry 1% Redhill 1% Netherlands 1%Dartford 1% Royal Tunbridge Wells 1% Norway 1%
Derby 1% Sheffield 1% Spain 1%Edinburgh 1% Shrewsbury 1% Switzerland 1%
Ipswich 1% Southampton 1%Kingston Upon Thames 1% Stevenage 1%
Leicester 1% Swansea 1%Manchester 1% Watford 1%
Medway 1% Worcester 1%Other UK 8%
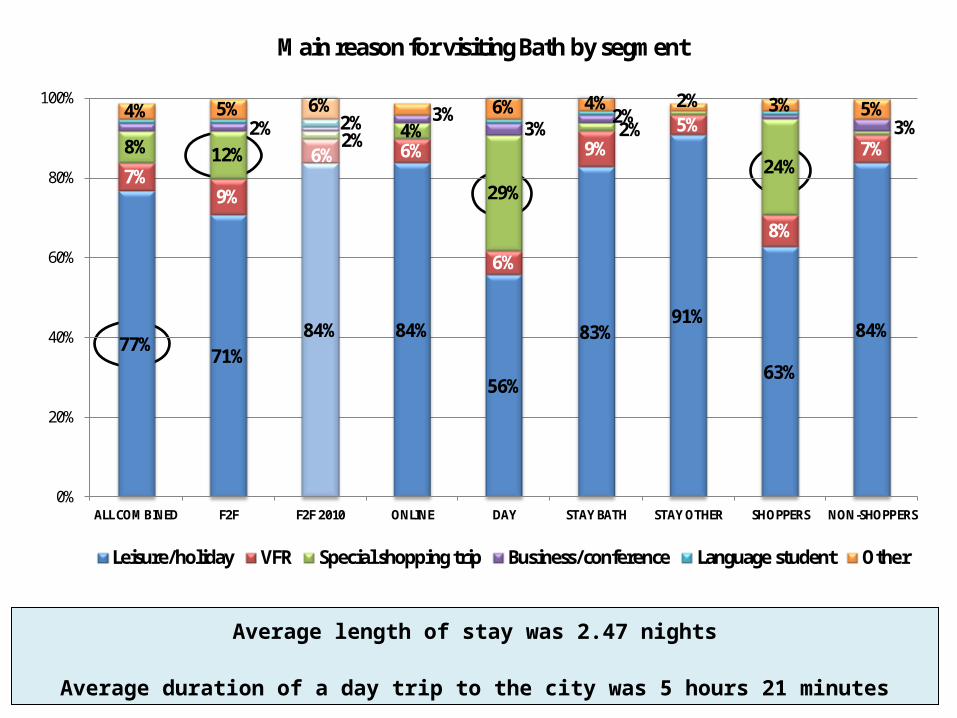
77% 71%
84% 84%
56%
83% 91%
63%
84%
7% 9%
6% 6%
6%
9% 5%
8%
7% 8% 12% 2% 4%
29%
2%
24%
2% 3% 2% 3%
4% 5% 6% 3% 6% 4% 2% 3% 5% 2%
0%
20%
40%
60%
80%
100%
ALL COMBINED F2F F2F 2010 ONLINE DAY STAY BATH STAY OTHER SHOPPERS NON-SHOPPERS
Leisure/holiday VFR Special shopping trip Business/conference Language student Other
Main reason for visiting Bath by segment
Average length of stay was 2.47 nights
Average duration of a day trip to the city was 5 hours 21 minutes
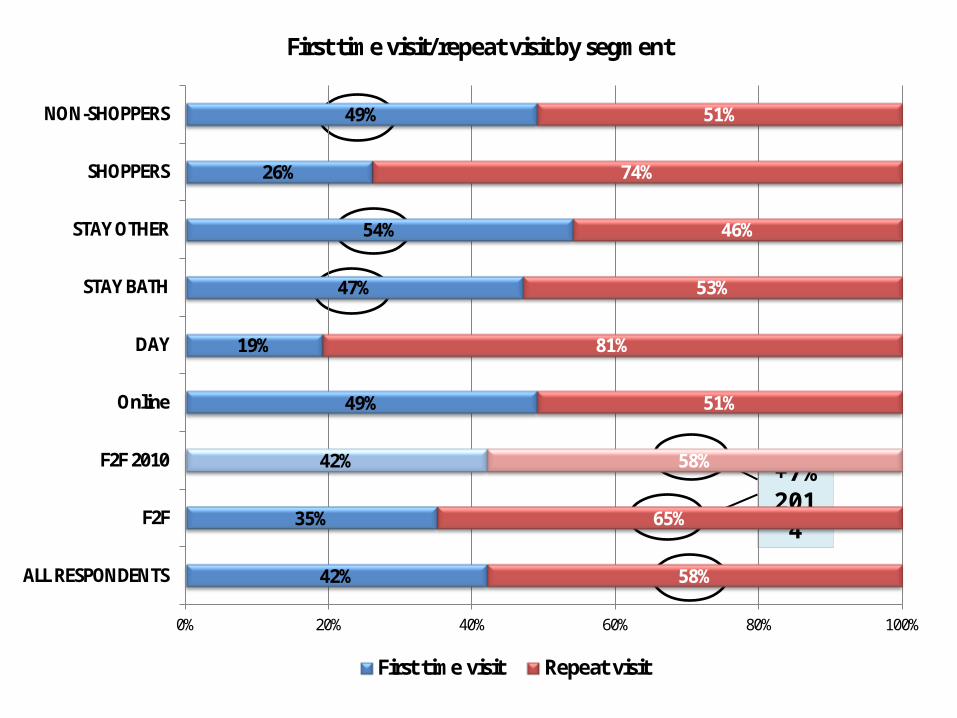
42%
35%
42%
49%
19%
47%
54%
26%
49%
58%
65%
58%
51%
81%
53%
46%
74%
51%
0% 20% 40% 60% 80% 100%
ALL RESPONDENTS
F2F
F2F 2010
Online
DAY
STAY BATH
STAY OTHER
SHOPPERS
NON-SHOPPERS
First time visit Repeat visit
First time visit/repeat visit by segment
+7% 2014
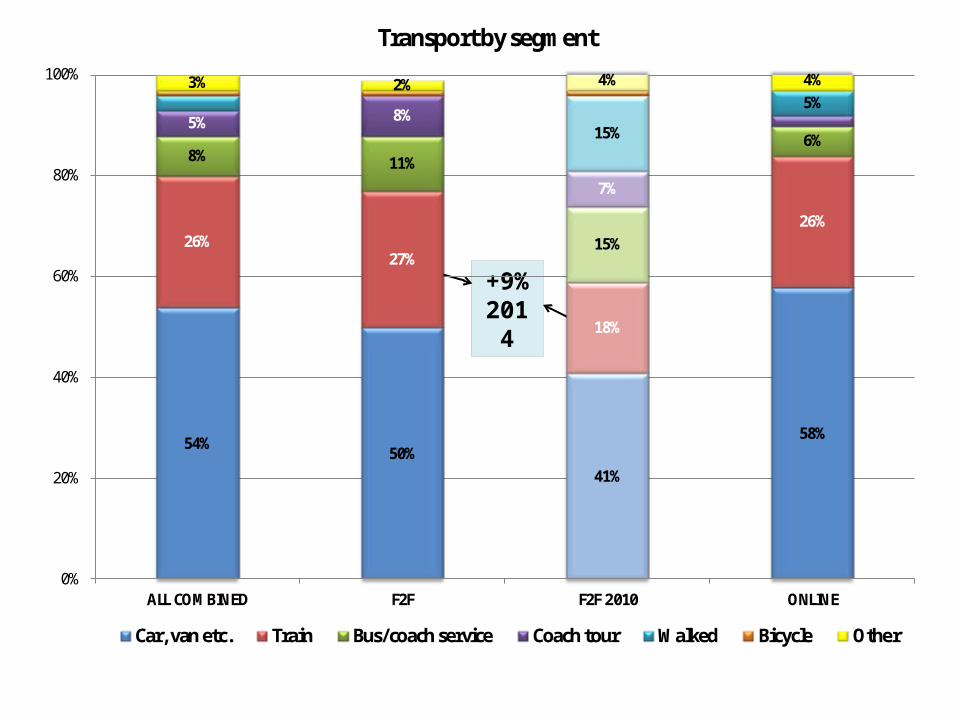
54% 50%
41%
58%
26% 27%
18%
26%
8% 11%
15%
6% 5% 8%
7%
15%
5% 3% 2% 4% 4%
0%
20%
40%
60%
80%
100%
ALL COMBINED F2F F2F 2010 ONLINE
Car, van etc. Train Bus/coach service Coach tour Walked Bicycle Other
Transport by segment
+9% 2014
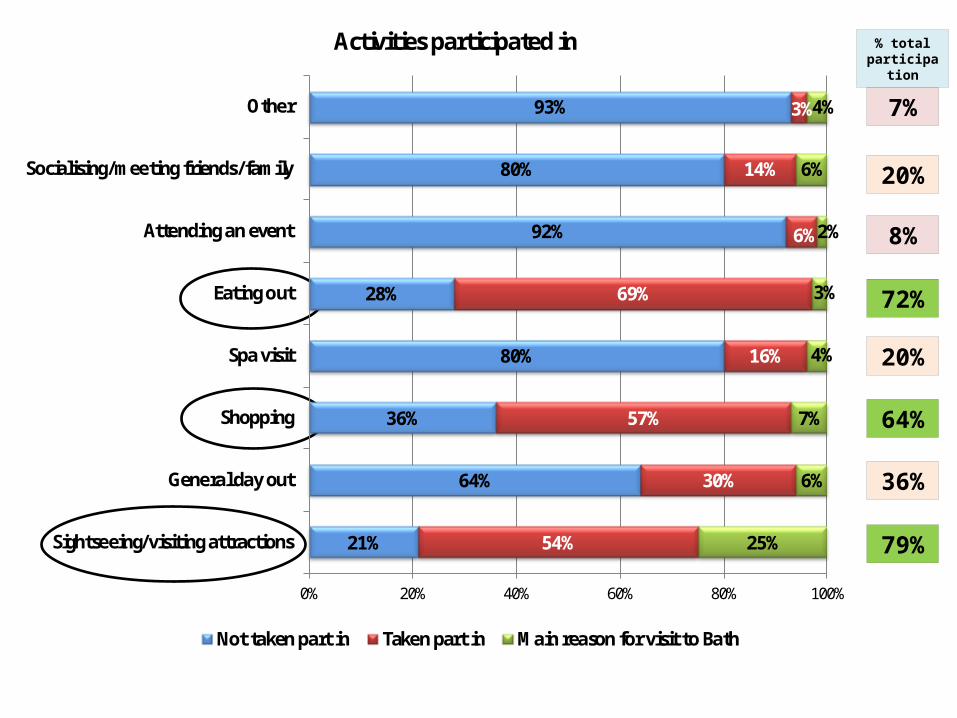
21%
64%
36%
80%
28%
92%
80%
93%
54%
30%
57%
16%
69%
6%
14%
3%
25%
6%
7%
4%
3%
2%
6%
4%
0% 20% 40% 60% 80% 100%
Sightseeing/visiting attractions
General day out
Shopping
Spa visit
Eating out
Attending an event
Socialising/meeting friends/family
Other
Activities participated in
Not taken part in Taken part in Main reason for visit to Bath
79%
72%
20%
64%
8%
20%
7%
36%
% total participation
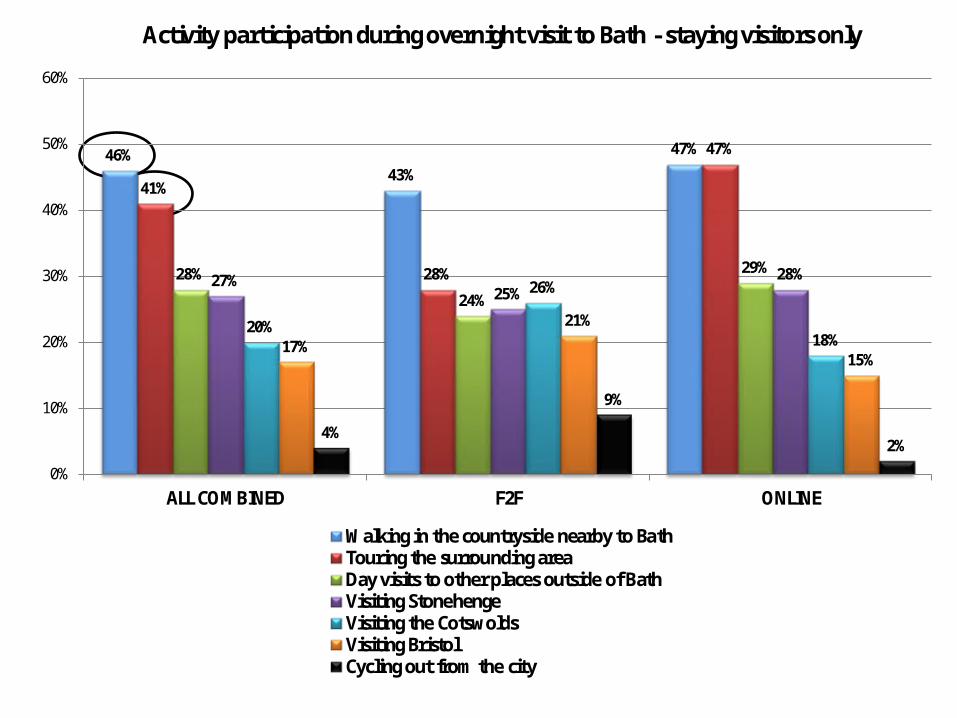
46% 43%
47%
41%
28%
47%
28%
24%
29% 27%
25% 28%
20%
26%
18% 17%
21%
15%
4%
9%
2%
0%
10%
20%
30%
40%
50%
60%
ALL COMBINED F2F ONLINE
Activity participation during overnight visit to Bath - staying visitors only
Walking in the countryside nearby to BathTouring the surrounding areaDay visits to other places outside of BathVisiting StonehengeVisiting the CotswoldsVisiting BristolCycling out from the city
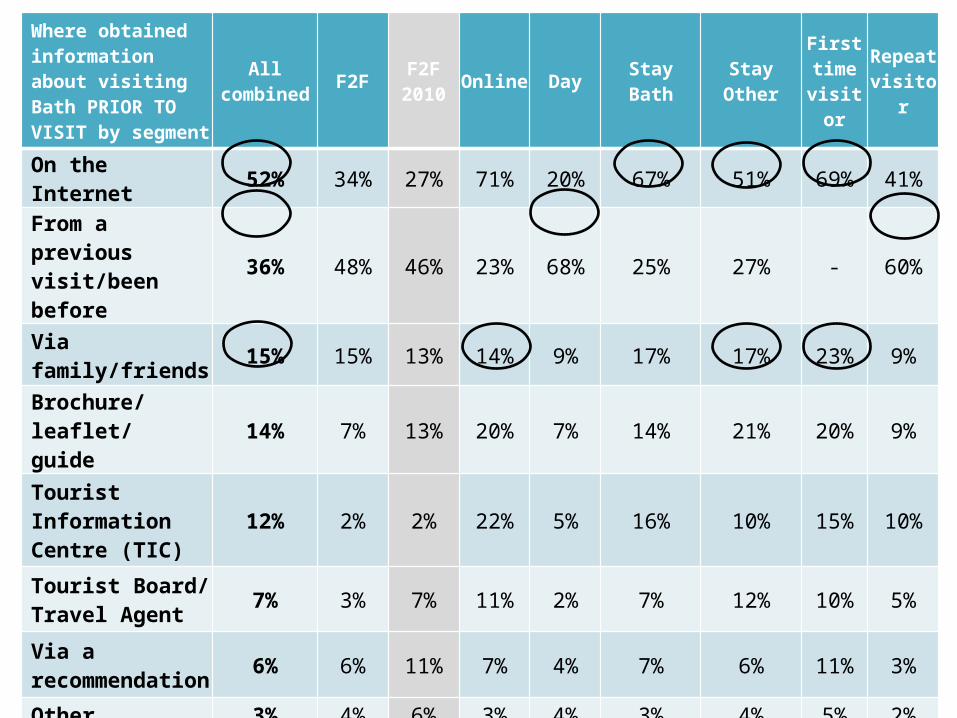
Where obtained information about visiting Bath PRIOR TO VISIT by segment
Allcombined F2F F2F 2010 Online Day Stay Bath Stay Other
First time
visitorRepeat visitor
On the Internet 52% 34% 27% 71% 20% 67% 51% 69% 41%
From a previous visit/been before 36% 48% 46% 23% 68% 25% 27% - 60%
Via family/friends 15% 15% 13% 14% 9% 17% 17% 23% 9%
Brochure/leaflet/guide 14% 7% 13% 20% 7% 14% 21% 20% 9%
Tourist Information Centre (TIC) 12% 2% 2% 22% 5% 16% 10% 15% 10%
Tourist Board/Travel Agent 7% 3% 7% 11% 2% 7% 12% 10% 5%
Via a recommendation 6% 6% 11% 7% 4% 7% 6% 11% 3%
Other 3% 4% 6% 3% 4% 3% 4% 5% 2%
Newspaper/magazine 2% 1% 1% 2% 1% 2% 1% 2% 1%
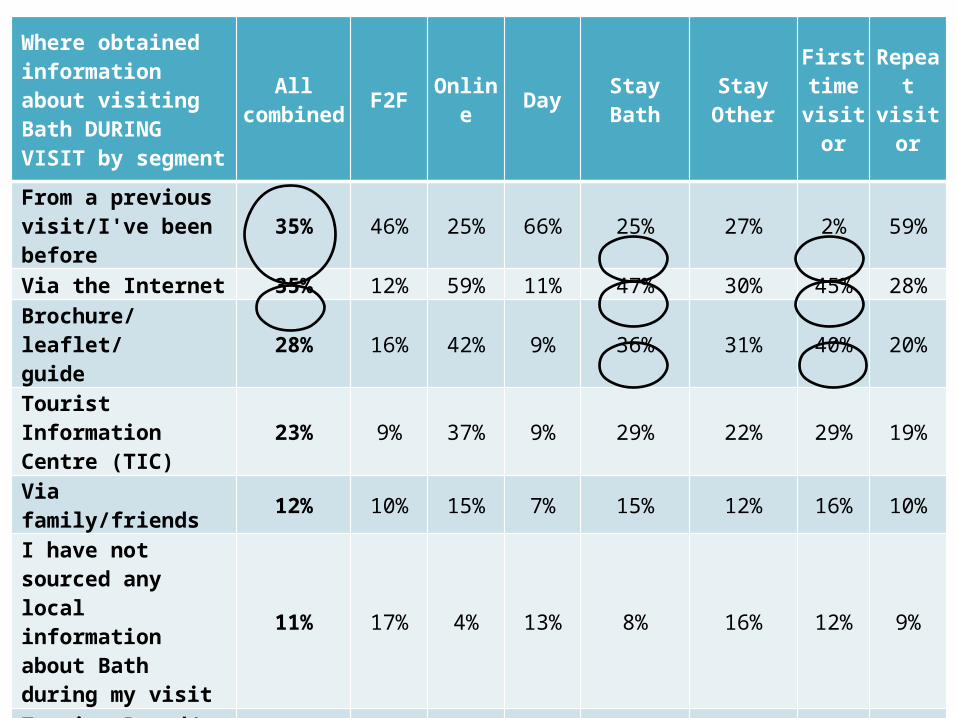
Where obtained information about visiting Bath DURING VISIT by segment
All combined F2F Online Day Stay Bath Stay Other
First time
visitorRepeat visitor
From a previous visit/I've been before 35% 46% 25% 66% 25% 27% 2% 59%
Via the Internet 35% 12% 59% 11% 47% 30% 45% 28%
Brochure/leaflet/guide 28% 16% 42% 9% 36% 31% 40% 20%
Tourist Information Centre (TIC) 23% 9% 37% 9% 29% 22% 29% 19%
Via family/friends 12% 10% 15% 7% 15% 12% 16% 10%
I have not sourced any local information about Bath during my visit
11% 17% 4% 13% 8% 16% 12% 9%
Tourist Board/Travel Agent 9% 3% 14% 3% 10% 10% 10% 7%
Via a recommendation 8% 6% 10% 5% 9% 8% 12% 5%Other 3% 4% 3% 2% 3% 5% 4% 3%
Newspaper/magazine 1% 1% 2% 1% 2% 1% 1% 2%
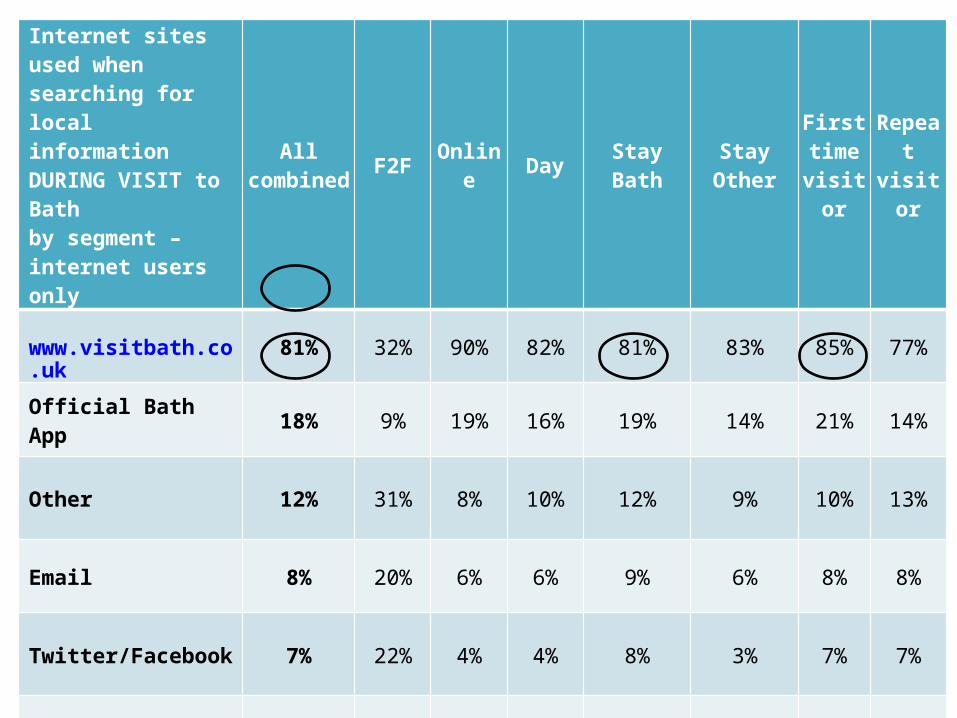
Internet sites used when searching for local information DURING VISIT to Bathby segment – internet users only
All combined F2F Online Day Stay Bath Stay Other
First time
visitorRepeat visitor
www.visitbath.co.uk 81% 32% 90% 82% 81% 83% 85% 77%
Official Bath App 18% 9% 19% 16% 19% 14% 21% 14%
Other 12% 31% 8% 10% 12% 9% 10% 13%
Email 8% 20% 6% 6% 9% 6% 8% 8%
Twitter/Facebook 7% 22% 4% 4% 8% 3% 7% 7%
Text 2% 13% 1% 4% 3% - 2% 2%
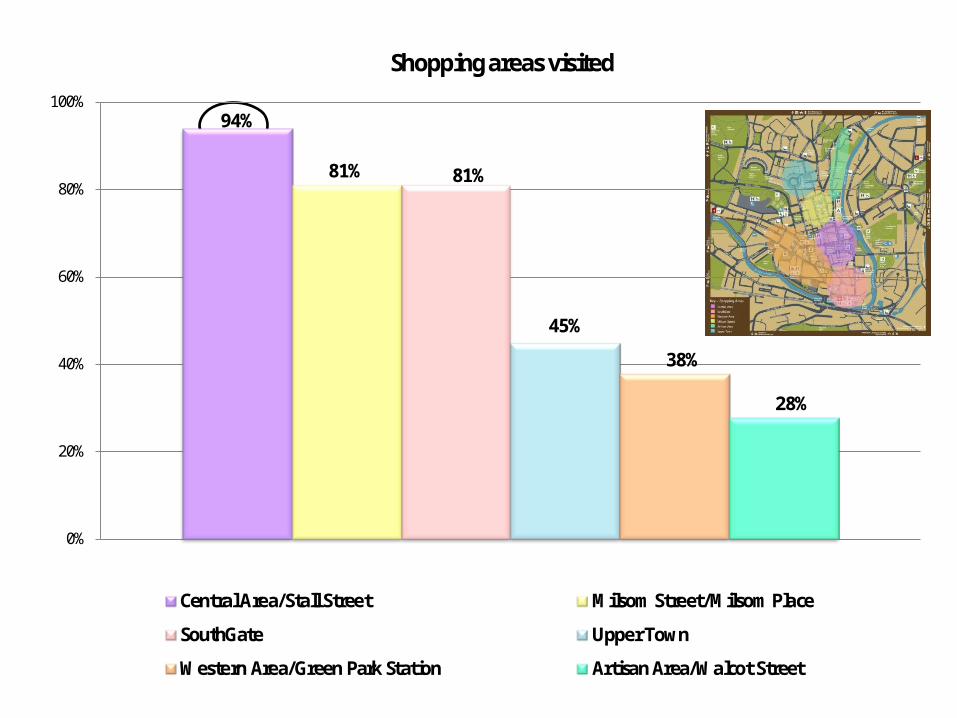
94%
81% 81%
45%
38%
28%
0%
20%
40%
60%
80%
100%
Central Area/Stall Street Milsom Street/Milsom Place
SouthGate Upper Town
Western Area/Green Park Station Artisan Area/Walcot Street
Shopping areas visited
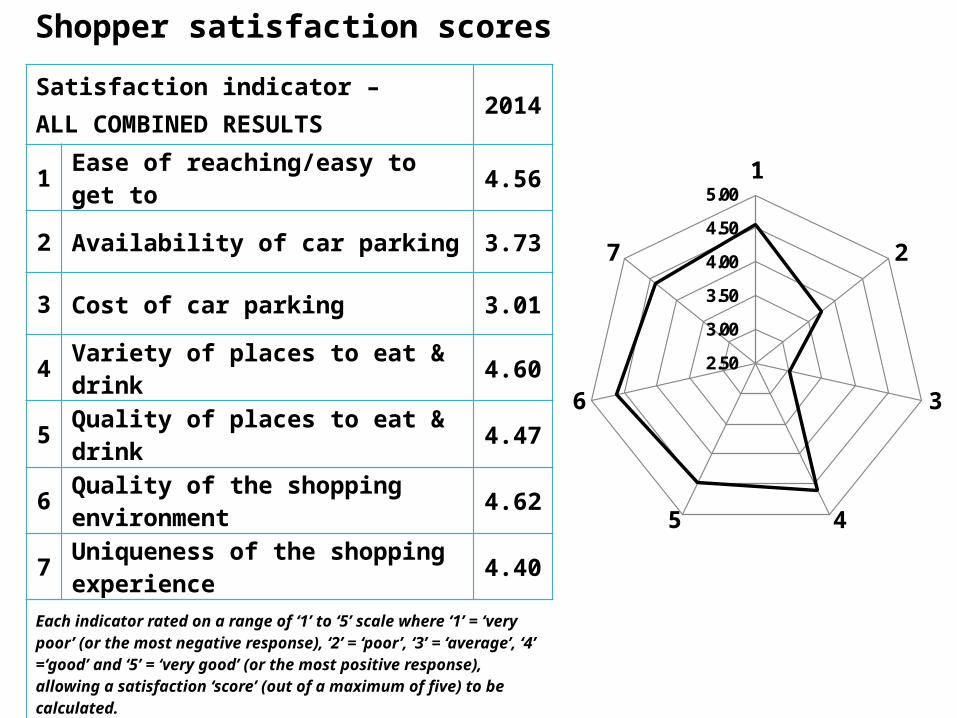
Satisfaction indicator –ALL COMBINED RESULTS 2014
1 Ease of reaching/easy to get to 4.56
2 Availability of car parking 3.73
3 Cost of car parking 3.01
4 Variety of places to eat & drink 4.60
5 Quality of places to eat & drink 4.47
6 Quality of the shopping environment 4.62
7 Uniqueness of the shopping experience 4.40
Each indicator rated on a range of ‘1’ to ‘5’ scale where ‘1’ = ‘very poor’ (or the most negative response), ‘2’ = ‘poor’, ‘3’ = ‘average’, ‘4’ =‘good’ and ‘5’ = ‘very good’ (or the most positive response), allowing a satisfaction ‘score’ (out of a maximum of five) to be calculated.
2.50
3.00
3.50
4.00
4.50
5.001
2
3
45
6
7
Shopper satisfaction scores
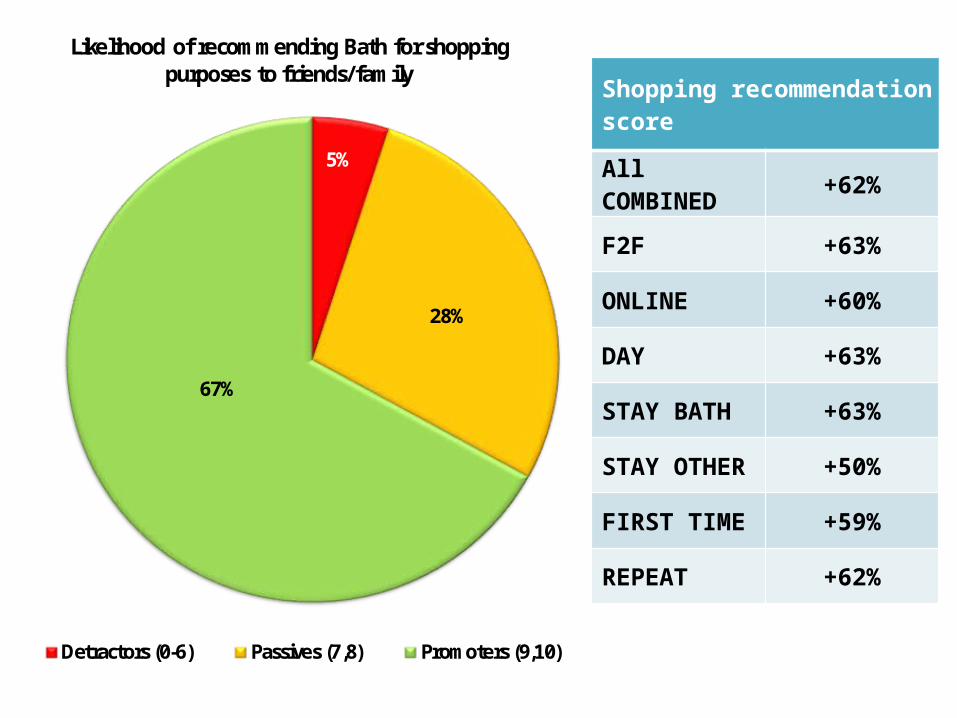
5%
28%
67%
Likelihood of recommending Bath for shopping purposes to friends/family
Detractors (0-6) Passives (7,8) Promoters (9,10)
Shopping recommendation score
All COMBINED +62%
F2F +63%
ONLINE +60%
DAY +63%
STAY BATH +63%
STAY OTHER +50%
FIRST TIME +59%
REPEAT +62%
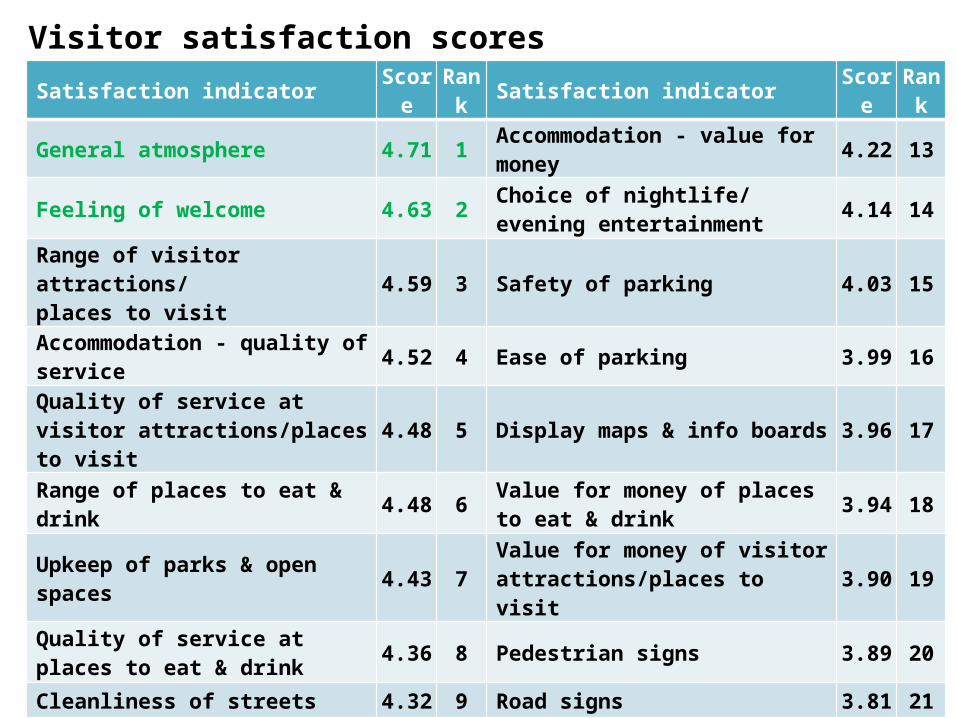
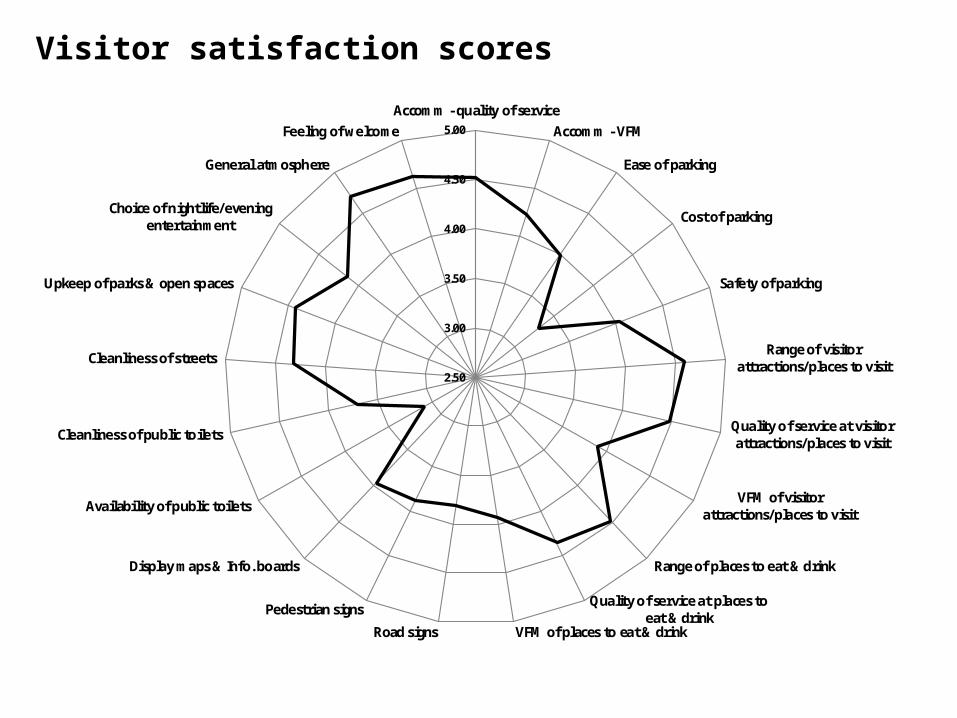
Satisfaction indicator Score Rank Satisfaction indicator Score Rank
General atmosphere 4.71 1 Accommodation - value for money 4.22 13
Feeling of welcome 4.63 2 Choice of nightlife/ evening entertainment 4.14 14
Range of visitor attractions/places to visit 4.59 3 Safety of parking 4.03 15
Accommodation - quality of service 4.52 4 Ease of parking 3.99 16
Quality of service at visitor attractions/places to visit 4.48 5 Display maps & info boards 3.96 17
Range of places to eat & drink 4.48 6 Value for money of places to eat & drink 3.94 18
Upkeep of parks & open spaces 4.43 7 Value for money of visitor attractions/places to visit 3.90 19
Quality of service at places to eat & drink 4.36 8 Pedestrian signs 3.89 20
Cleanliness of streets 4.32 9 Road signs 3.81 21
Ease of finding the TIC 4.31 10 Cleanliness of public toilets 3.71 22
Usefulness of information received at the TIC 4.31 11 Cost of parking 3.30 23
Quality of service at the TIC 4.29 12 Availability of public toilets 3.09 24
Visitor satisfaction scores
2.50
3.00
3.50
4.00
4.50
5.00
Accomm - quality of serviceAccomm - VFM
Ease of parking
Cost of parking
Safety of parking
Range of visitorattractions/places to visit
Quality of service at visitorattractions/places to visit
VFM of visitorattractions/places to visit
Range of places to eat & drink
Quality of service at places toeat & drink
VFM of places to eat & drinkRoad signs
Pedestrian signs
Display maps & Info. boards
Availability of public toilets
Cleanliness of public toilets
Cleanliness of streets
Upkeep of parks & open spaces
Choice of nightlife/eveningentertainment
General atmosphere
Feeling of welcome
Visitor satisfaction scores
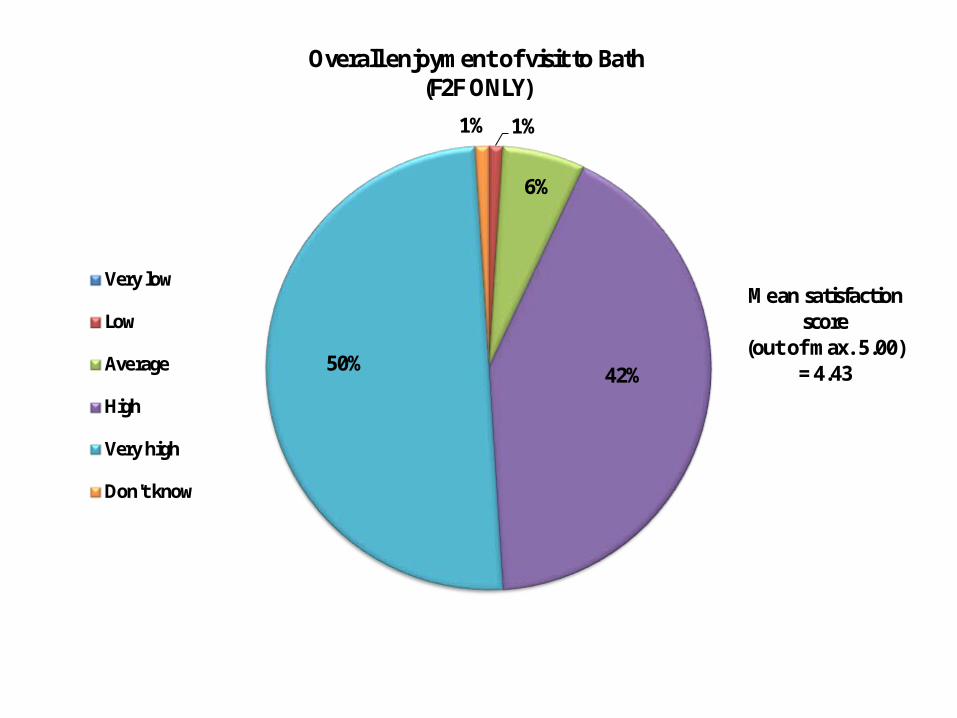
1%
6%
42% 50%
1%
Very low
Low
Average
High
Very high
Don't know
Overall enjoyment of visit to Bath (F2F ONLY)
Mean satisfaction score
(out of max. 5.00) = 4.43
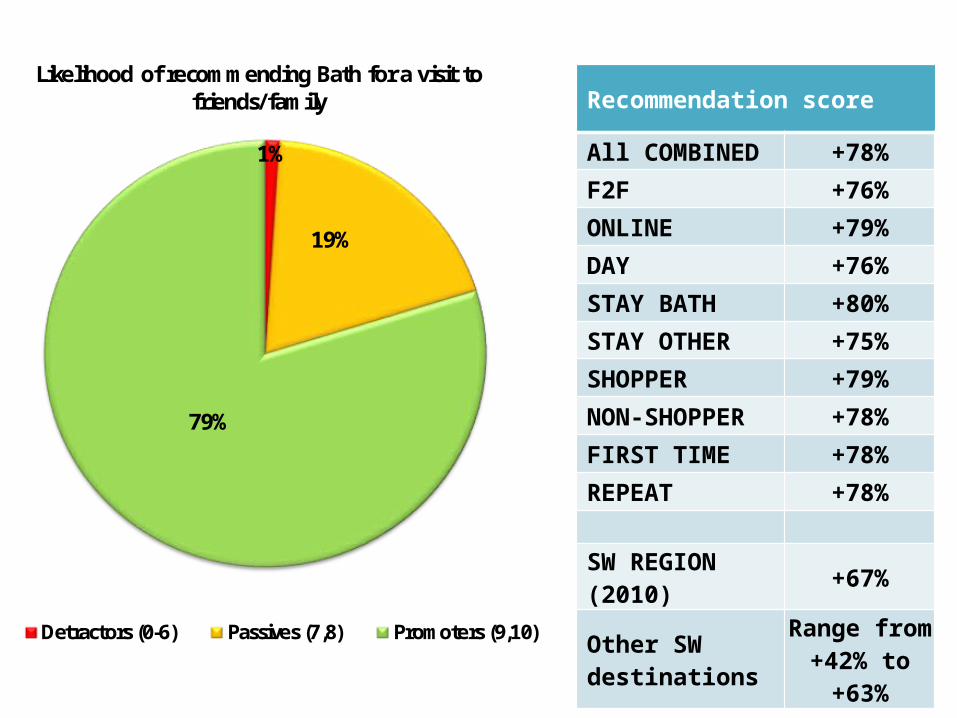
1%
19%
79%
Likelihood of recommending Bath for a visit to friends/family
Detractors (0-6) Passives (7,8) Promoters (9,10)
Recommendation score
All COMBINED +78%
F2F +76%
ONLINE +79%
DAY +76%
STAY BATH +80%
STAY OTHER +75%
SHOPPER +79%
NON-SHOPPER +78%
FIRST TIME +78%
REPEAT +78%
SW REGION (2010) +67%
Other SW destinations
Range from +42% to +63%
Bath Christmas Market 2014
Visitor Feedback SurveyHighlights
• Face to face survey conducted with 415 visitors throughout the duration of the market, along with 646 online survey responses from BCM information requesters.
• 390,000 people are estimated to have attended the Market over the 18 day period between Thursday 27th November and Sunday 14th December 2014.
- 74,000 on a staying trip (in Bath)- 35,000 on a staying trip (outside Bath)- 238,000 on a day trip- 43,000 local residents.
• Attracted a good spread of visitors across all age groups.
• 70% of visitors were ABC1’s.
• 94% of visitors were in adult only groups.
• 70% of visitors were on a day trip /19% staying overnight / 11% local residents.
• Three quarters of visitors indicated that it was their main reason for visiting Bath.
• 89% of visitors were on a repeat visit to Bath.
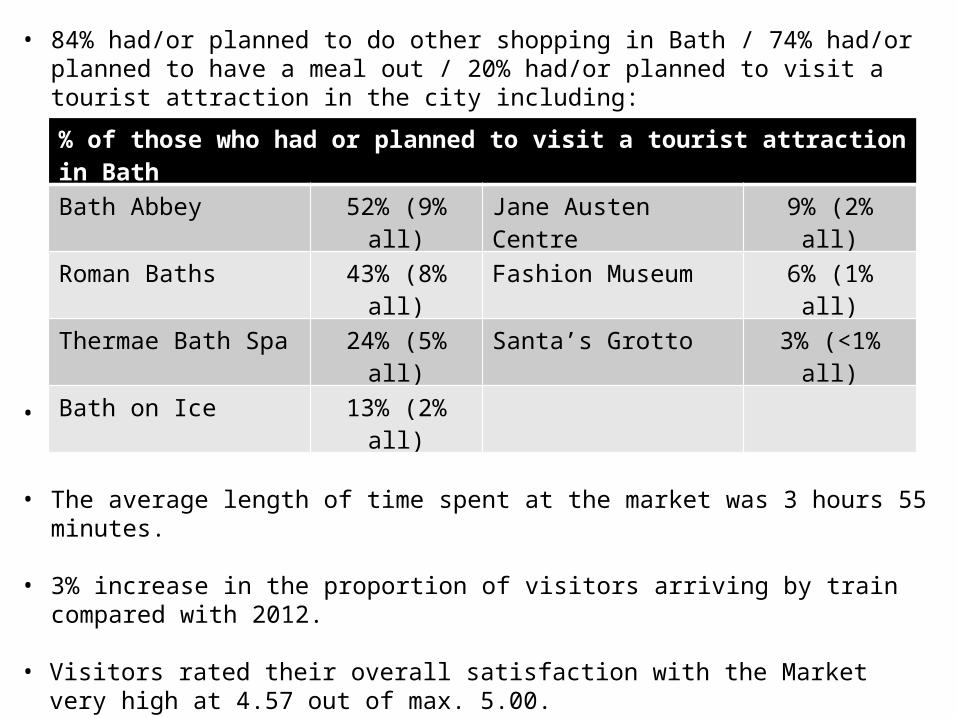
• 84% had/or planned to do other shopping in Bath / 74% had/or planned to have a meal out / 20% had/or planned to visit a tourist attraction in the city including:
• 82% of visitors had been to Milsom Street and 75% to SouthGate.
• The average length of time spent at the market was 3 hours 55 minutes.
• 3% increase in the proportion of visitors arriving by train compared with 2012.
• Visitors rated their overall satisfaction with the Market very high at 4.57 out of max. 5.00.
• Highest levels of satisfaction were with the quality of stalls (4.65) and range of stalls (4.57).
• Market achieved a high recommendation score of +66%.
% of those who had or planned to visit a tourist attraction in Bath
Bath Abbey 52% (9% all) Jane Austen Centre 9% (2% all)
Roman Baths 43% (8% all) Fashion Museum 6% (1% all)
Thermae Bath Spa 24% (5% all) Santa’s Grotto 3% (<1% all)
Bath on Ice 13% (2% all)
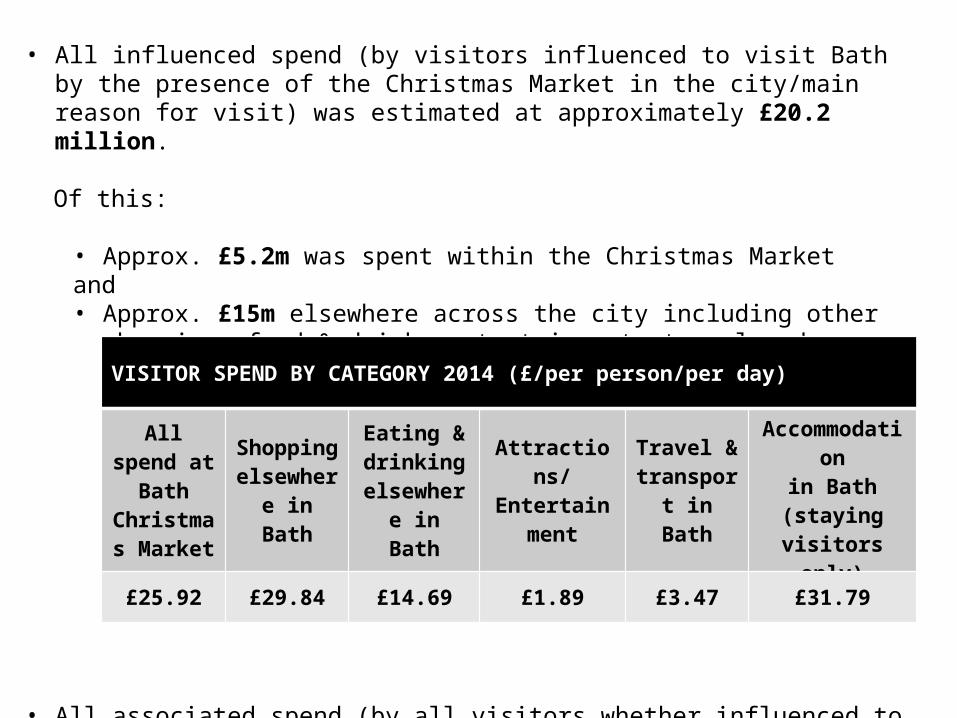
• All influenced spend (by visitors influenced to visit Bath by the presence of the Christmas Market in the city/main reason for visit) was estimated at approximately £20.2 million.
Of this:
• Approx. £5.2m was spent within the Christmas Market and• Approx. £15m elsewhere across the city including other shopping, food & drink,
entertainment, travel and accommodation (increase from approx. £11.5m in 2012).
• All associated spend (by all visitors whether influenced to visit by the presence of the market or not) was estimated at approximately £28.2 million.
VISITOR SPEND BY CATEGORY 2014 (£/per person/per day)
All spend at Bath
Christmas Market
Shopping elsewhere
in Bath
Eating & drinking
elsewhere in Bath
Attractions/Entertainmen
t
Travel & transport in
Bath
Accommodationin Bath (staying
visitors only)
£25.92 £29.84 £14.69 £1.89 £3.47 £31.79