Embed Size (px)
Citation preview
Basel III Pillar 3 Disclosures – President’s Choice Bank Page 1 of 17
President’s Choice Bank BASEL III PILLAR 3 DISCLOSURES
December 31, 2016
Basel III Pillar 3 Disclosures – President’s Choice Bank Page 2 of 17
Table of Contents
Table of Contents .................................................................................................................................................................................................. 2
TABLE 1 – OVERVIEW & SCOPE OF APPLICATION ............................................................................................................................... 3
TABLE 2/3 – CAPITAL STRUCTURE AND ADEQUACY ........................................................................................................................... 5
TABLE 4 – CREDIT RISK: GENERAL DISCLOSURES FOR ALL BANKS ............................................................................................. 7
TABLE 5 – CREDIT RISK: DISCLOSURES FOR PORTFOLIOS SUBJECT TO THE STANDARDIZED APPROACH ................ 11
TABLE 6 – CREDIT RISK: DISCLOSURES FOR PORTFOLIOS SUBJECT TO IRB APPROACHES .............................................. 11
TABLE 7 – CREDIT RISK MITIGATION ..................................................................................................................................................... 11
TABLE 8 – GENERAL DISCLOSURE FOR EXPOSURES RELATED TO COUNTERPARTY CREDIT RISK ............................... 11
TABLE 9 – SECURITIZATION: DISCLOSURE FOR STANDARDISED APPROACH ......................................................................... 12
TABLE 10 /11 – MARKET RISK ..................................................................................................................................................................... 13
TABLE 12 – OPERATIONAL RISK ............................................................................................................................................................... 13
TABLE 13 – EQUITIES: DISCLOSURES FOR BANKING BOOK POSITIONS ..................................................................................... 13
TABLE 14 – INTEREST RATE RISK ............................................................................................................................................................. 14
LIQUIDITY RISK .............................................................................................................................................................................................. 15
CURRENCY RISK ............................................................................................................................................................................................. 15
REMUNERATION ............................................................................................................................................................................................. 16
Basel III Pillar 3 Disclosures – President’s Choice Bank Page 3 of 17
TABLE 1 – OVERVIEW & SCOPE OF APPLICATION This document represents the Basel III Pillar 3 disclosures for President’s Choice Bank (“PC Bank” or the “the Bank”). These disclosures are made pursuant to OSFI’s Pillar 3 Disclosure Requirements issued in November 2007, and OSFI’s Basel III Pillar 3 requirements Advisory issued in July 2013. Basel III, issued in June 2011, is part of the Basel Committee's continuous effort to enhance the banking regulatory framework. It builds on the International Convergence of Capital Measurement and Capital Standards document (Basel II). Basel III is structured around 3 pillars:
Pillar 1: Minimum Capital Requirements
Pillar 2: The Supervisory Review Process
Pillar 3: Market Discipline Pillar 3 complements both Pillars 1 and 2, by setting disclosure requirements which will allow market participants to assess key pieces of information on the scope of application, capital, risk exposures, risk assessment processes, and hence the capital adequacy of PC Bank. OSFI requires all institutions to implement the Basel III framework, and the new composition of capital disclosure requirements. This document presents capital structure and adequacy calculations based on Basel III guidelines on both an “All-in” basis (after the transition period for the phasing-in of deductions ends on January 1, 2019) and a “Transitional” basis (before January 1, 2019) as per OSFI requirement. This report is unaudited and is reported in thousands of Canadian dollars, unless otherwise disclosed.
President’s Choice Bank Overview PC Bank is a Schedule I Canadian chartered bank governed by the Bank Act (Canada) and is a wholly owned subsidiary of Loblaw Companies Limited (“LCL”). In association with other financial institutions, PC Bank offers, under the President’s Choice Financial® brand, a complete line of retail financial services products to individuals who reside in Canada. The key business lines of PC Bank are as follows: Credit Card PC Bank launched its credit card program in 2001 and currently offers the President’s Choice Financial MasterCard (“PC MasterCard”) across Canada. The PC MasterCard product attributes include no annual fee and a competitive rewards program which allows customers to earn and redeem PC Points for free groceries at LCL stores. PC Bank records the credit card receivables and associated funding on its balance sheet. Core Banking PC Bank launched its core banking business in 1998 through a strategic partnership with a major Canadian Chartered Bank (“Strategic Partner”). Under the President’s Choice Financial brand, retail banking products are sold online and in LCL stores at banking pavilions operated by the Strategic Partner. All deposits, investments and lending products issued under the PC Financial brand are recorded by the Strategic Partner on its balance sheet. PC Bank earns income through this partnership.
Basel III Pillar 3 Disclosures – President’s Choice Bank Page 4 of 17
GIC’s PC Bank launched a broker originated GIC program in 2010. The GIC’s offered by PC Bank are insured by Canadian Deposit Insurance Corporation (“CDIC”). PC Bank sells nominee name GIC’s through a number of brokers in Canada.
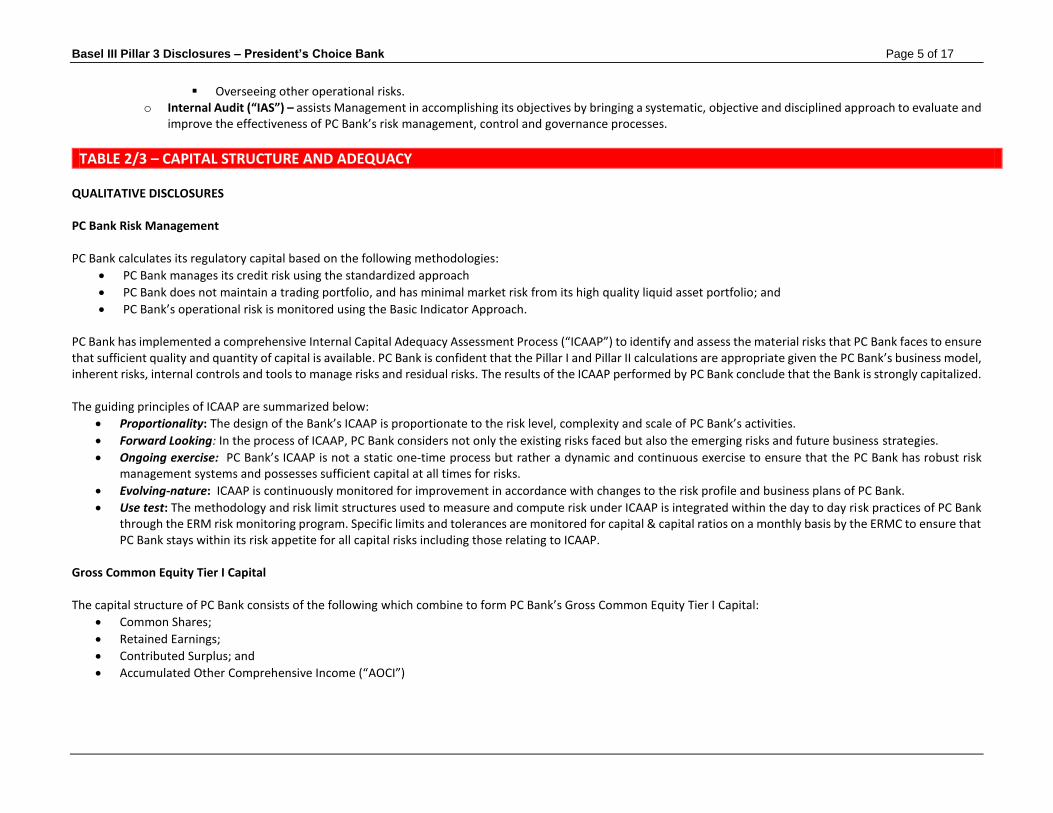
Corporate Governance The Bank maintains a rigorous corporate governance structure as follows:
Board of Director’s Oversight
o Risk Committee o Audit Committee o Conduct Review Committee o Governance Committee
Senior Management Oversight through the following:
o Enterprise Risk Management Committee (“ERMC”) – provides stewardship over the identification, definition, assessment, management, control, measurement, monitoring and reporting of PC Bank’s enterprise risks.
o Asset Liability Committee (“ALCO”) – assists the Risk Committee of the Board in Overseeing PC Bank’s risk management activities by providing strategic direction on the management of liquidity risk, interest rate risk,
investment risk, and other aspects of Asset Liability Management; Ensuring that PC Bank has the appropriate quantity and quality of capital, considering its strategic direction & business plans, its risk profile, its
emerging risks and stress tests; and Proactively assessing the balance sheet dynamics, having regard to economic data and forecasts, PC Bank’s legal structure, market
developments, accounting pronouncements, etc. o Credit Risk and Fraud Management Committee (“CRFMC”) – has the following key responsibilities:
Providing a governance structure that oversees the Credit Risk Management program, including the associated strategies, policies and procedures;
Ensuring that Credit Risk and Fraud Risk forecasts are appropriate giving consideration to PC Bank’s strategic directions, risk profile and appetite, emerging risks and stress tests;
Providing guidance on the methodology to continually identify, define, assess, manage, and report Credit Risk and Fraud Risk exposure. o Operational Risk Management Committee (“ORMC”) – is responsible for planning, directing, monitoring and controlling the impact of PC Bank’s risks
arising from its operations. Its key responsibilities include: Ensuring PC Bank’s compliance with operational mandates, policies and procedures, and governing legislation; Overseeing risk appetite, business continuity management, information security, internal control, outsourcing, social media, legal and
regulatory risks management; Overseeing the anti-money laundering and anti-terrorist program;
Basel III Pillar 3 Disclosures – President’s Choice Bank Page 5 of 17
Overseeing other operational risks. o Internal Audit (“IAS”) – assists Management in accomplishing its objectives by bringing a systematic, objective and disciplined approach to evaluate and
improve the effectiveness of PC Bank’s risk management, control and governance processes.
TABLE 2/3 – CAPITAL STRUCTURE AND ADEQUACY QUALITATIVE DISCLOSURES PC Bank Risk Management PC Bank calculates its regulatory capital based on the following methodologies:
PC Bank manages its credit risk using the standardized approach
PC Bank does not maintain a trading portfolio, and has minimal market risk from its high quality liquid asset portfolio; and
PC Bank’s operational risk is monitored using the Basic Indicator Approach. PC Bank has implemented a comprehensive Internal Capital Adequacy Assessment Process (“ICAAP”) to identify and assess the material risks that PC Bank faces to ensure that sufficient quality and quantity of capital is available. PC Bank is confident that the Pillar I and Pillar II calculations are appropriate given the PC Bank’s business model, inherent risks, internal controls and tools to manage risks and residual risks. The results of the ICAAP performed by PC Bank conclude that the Bank is strongly capitalized. The guiding principles of ICAAP are summarized below:
Proportionality: The design of the Bank’s ICAAP is proportionate to the risk level, complexity and scale of PC Bank’s activities.
Forward Looking: In the process of ICAAP, PC Bank considers not only the existing risks faced but also the emerging risks and future business strategies.
Ongoing exercise: PC Bank’s ICAAP is not a static one-time process but rather a dynamic and continuous exercise to ensure that the PC Bank has robust risk management systems and possesses sufficient capital at all times for risks.
Evolving-nature: ICAAP is continuously monitored for improvement in accordance with changes to the risk profile and business plans of PC Bank.
Use test: The methodology and risk limit structures used to measure and compute risk under ICAAP is integrated within the day to day risk practices of PC Bank through the ERM risk monitoring program. Specific limits and tolerances are monitored for capital & capital ratios on a monthly basis by the ERMC to ensure that PC Bank stays within its risk appetite for all capital risks including those relating to ICAAP.
Gross Common Equity Tier I Capital The capital structure of PC Bank consists of the following which combine to form PC Bank’s Gross Common Equity Tier I Capital:
Common Shares;
Retained Earnings;
Contributed Surplus; and
Accumulated Other Comprehensive Income (“AOCI”)
Basel III Pillar 3 Disclosures – President’s Choice Bank Page 6 of 17
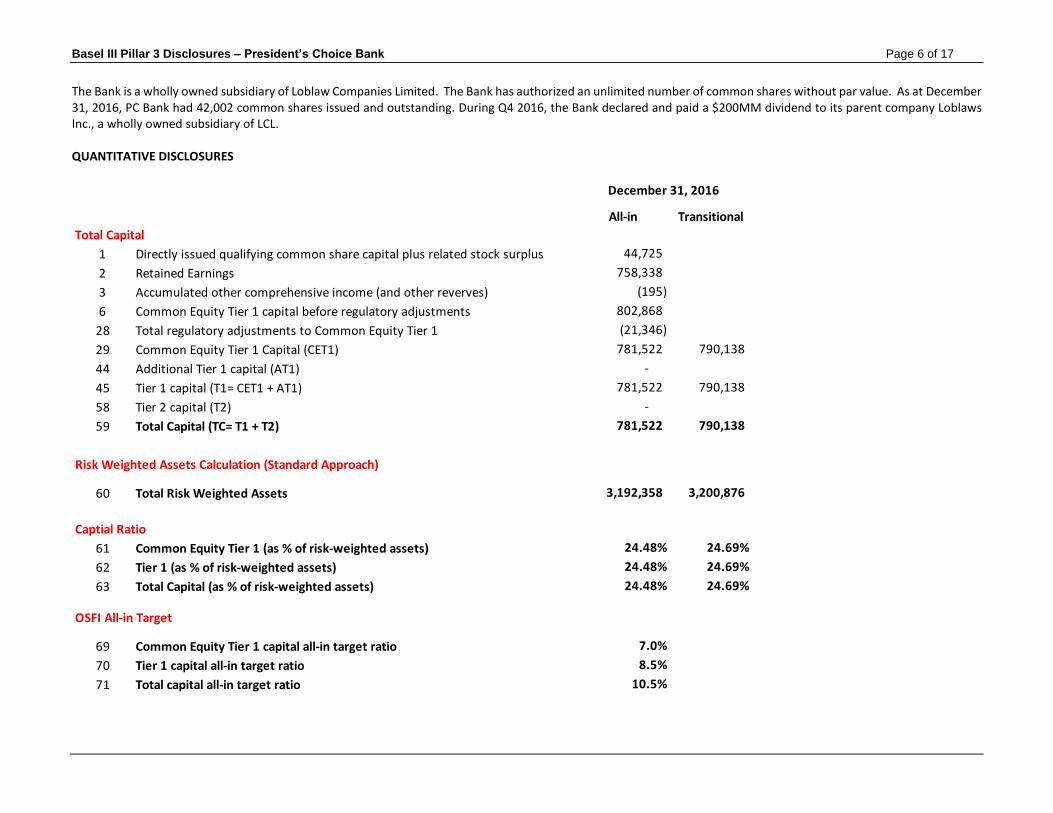
The Bank is a wholly owned subsidiary of Loblaw Companies Limited. The Bank has authorized an unlimited number of common shares without par value. As at December 31, 2016, PC Bank had 42,002 common shares issued and outstanding. During Q4 2016, the Bank declared and paid a $200MM dividend to its parent company Loblaws Inc., a wholly owned subsidiary of LCL. QUANTITATIVE DISCLOSURES
All-in Transitional
Total Capital
1 Directly issued qualifying common share capital plus related stock surplus 44,725
2 Retained Earnings 758,338
3 Accumulated other comprehensive income (and other reverves) (195)
6 Common Equity Tier 1 capital before regulatory adjustments 802,868
28 Total regulatory adjustments to Common Equity Tier 1 (21,346)
29 Common Equity Tier 1 Capital (CET1) 781,522 790,138
44 Additional Tier 1 capital (AT1) -
45 Tier 1 capital (T1= CET1 + AT1) 781,522 790,138
58 Tier 2 capital (T2) -
59 Total Capital (TC= T1 + T2) 781,522 790,138
Risk Weighted Assets Calculation (Standard Approach)
60 Total Risk Weighted Assets 3,192,358 3,200,876
Captial Ratio
61 Common Equity Tier 1 (as % of risk-weighted assets) 24.48% 24.69%
62 Tier 1 (as % of risk-weighted assets) 24.48% 24.69%
63 Total Capital (as % of risk-weighted assets) 24.48% 24.69%
OSFI All-in Target
69 Common Equity Tier 1 capital all-in target ratio 7.0%
70 Tier 1 capital all-in target ratio 8.5%
71 Total capital all-in target ratio 10.5%
December 31, 2016
Basel III Pillar 3 Disclosures – President’s Choice Bank Page 7 of 17
TABLE 4 – CREDIT RISK: GENERAL DISCLOSURES FOR ALL BANKS QUALITATIVE DISCLOSURES The credit risk associated with PC Bank’s credit card portfolio is defined as the risk of financial loss resulting from the failure of a debtor, for any reason, to fully honour its financial or contractual obligations. PC Bank is exposed to credit risk through:
Acquisition strategies that grant credit to new clients; and
Account management strategies that grant additional credit to existing clients.
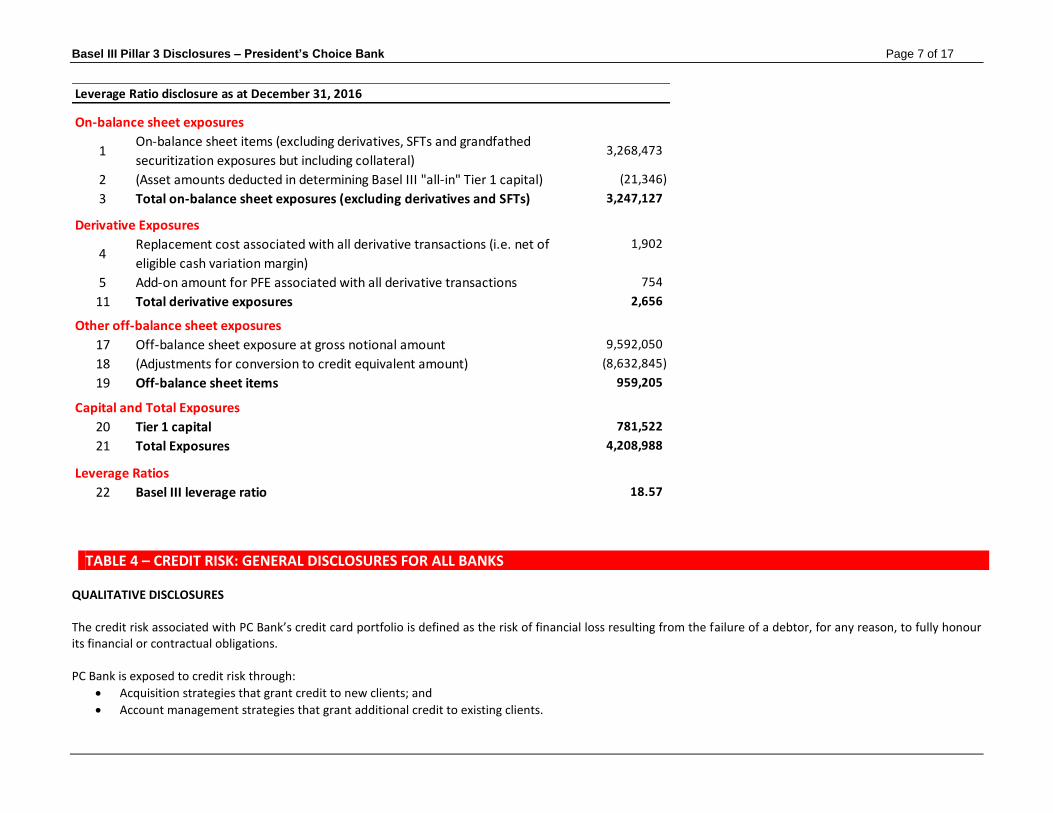
On-balance sheet exposures
1On-balance sheet items (excluding derivatives, SFTs and grandfathed
securitization exposures but including collateral)3,268,473
2 (Asset amounts deducted in determining Basel III "all-in" Tier 1 capital) (21,346)
3 Total on-balance sheet exposures (excluding derivatives and SFTs) 3,247,127
Derivative Exposures
4Replacement cost associated with all derivative transactions (i.e. net of
eligible cash variation margin)
1,902
5 Add-on amount for PFE associated with all derivative transactions 754
11 Total derivative exposures 2,656
Other off-balance sheet exposures
17 Off-balance sheet exposure at gross notional amount 9,592,050
18 (Adjustments for conversion to credit equivalent amount) (8,632,845)
19 Off-balance sheet items 959,205
Capital and Total Exposures
20 Tier 1 capital 781,522
21 Total Exposures 4,208,988
Leverage Ratios
22 Basel III leverage ratio 18.57
Leverage Ratio disclosure as at December 31, 2016
Basel III Pillar 3 Disclosures – President’s Choice Bank Page 8 of 17
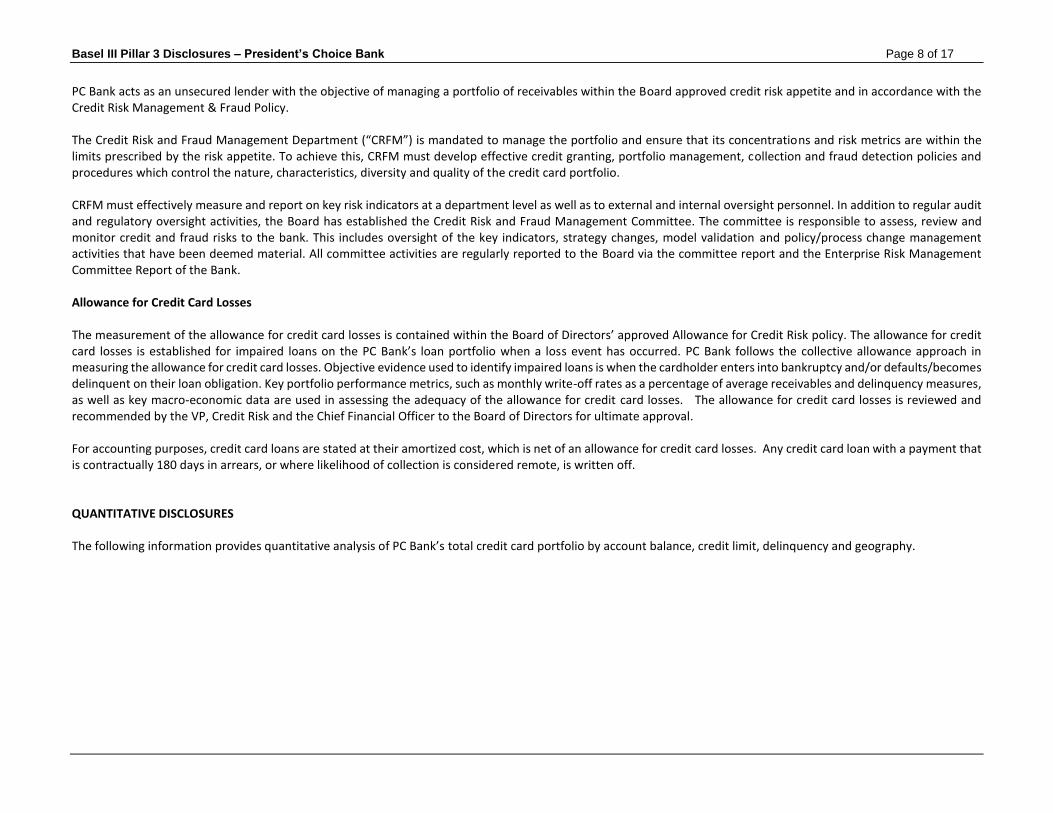
PC Bank acts as an unsecured lender with the objective of managing a portfolio of receivables within the Board approved credit risk appetite and in accordance with the Credit Risk Management & Fraud Policy. The Credit Risk and Fraud Management Department (“CRFM”) is mandated to manage the portfolio and ensure that its concentrations and risk metrics are within the limits prescribed by the risk appetite. To achieve this, CRFM must develop effective credit granting, portfolio management, collection and fraud detection policies and procedures which control the nature, characteristics, diversity and quality of the credit card portfolio. CRFM must effectively measure and report on key risk indicators at a department level as well as to external and internal oversight personnel. In addition to regular audit and regulatory oversight activities, the Board has established the Credit Risk and Fraud Management Committee. The committee is responsible to assess, review and monitor credit and fraud risks to the bank. This includes oversight of the key indicators, strategy changes, model validation and policy/process change management activities that have been deemed material. All committee activities are regularly reported to the Board via the committee report and the Enterprise Risk Management Committee Report of the Bank. Allowance for Credit Card Losses The measurement of the allowance for credit card losses is contained within the Board of Directors’ approved Allowance for Credit Risk policy. The allowance for credit card losses is established for impaired loans on the PC Bank’s loan portfolio when a loss event has occurred. PC Bank follows the collective allowance approach in measuring the allowance for credit card losses. Objective evidence used to identify impaired loans is when the cardholder enters into bankruptcy and/or defaults/becomes delinquent on their loan obligation. Key portfolio performance metrics, such as monthly write-off rates as a percentage of average receivables and delinquency measures, as well as key macro-economic data are used in assessing the adequacy of the allowance for credit card losses. The allowance for credit card losses is reviewed and recommended by the VP, Credit Risk and the Chief Financial Officer to the Board of Directors for ultimate approval. For accounting purposes, credit card loans are stated at their amortized cost, which is net of an allowance for credit card losses. Any credit card loan with a payment that is contractually 180 days in arrears, or where likelihood of collection is considered remote, is written off. QUANTITATIVE DISCLOSURES The following information provides quantitative analysis of PC Bank’s total credit card portfolio by account balance, credit limit, delinquency and geography.
Basel III Pillar 3 Disclosures – President’s Choice Bank Page 9 of 17
Number of Percentage of Receivables Percentage of
Account Balances Accounts Total Accounts Outstanding (in $) Total Receivables
Credit Balance 177,355 4.39% (20,110,321)$ -0.68%
No Balance 2,246,703 55.58% -$ 0.00%
LT or equal $500.00 543,469 13.45% 113,239,013$ 3.83%
$500.01 to $1000.00 286,369 7.08% 213,785,626$ 7.23%
$1,000.01 to $3,000.00 477,015 11.80% 866,769,953$ 29.31%
$3,000.01 to $5,000.00 166,593 4.12% 644,629,441$ 21.80%
$5,000.01 to $10,000.00 120,394 2.98% 816,983,189$ 27.63%
GT $10,000.00 24,212 0.60% 321,667,404$ 10.88%
Totals 4,042,110 100.00% 2,956,964,305$ 100.00%
Number of Percentage of Receivables Percentage of
Credit Limits Accounts Total Accounts Outstanding (in $) Total Receivables
LT or equal $500 286,167 7.08% 12,861,356$ 0.43%
$500.01 to $1000.00 488,336 12.08% 87,697,587$ 2.97%
$1,000.01 to $3,000.00 941,107 23.28% 425,201,227$ 14.38%
$3,000.01 to $5,000.00 689,067 17.05% 469,678,070$ 15.88%
$5,000.01 to $10,000.00 932,059 23.06% 965,341,814$ 32.65%
GT $10,000.00 705,374 17.45% 996,184,251$ 33.69%
Totals 4,042,110 100.00% 2,956,964,305$ 100.00%
Total Accounts as at December 31 2016
Total Accounts as at December 31 2016
Basel III Pillar 3 Disclosures – President’s Choice Bank Page 10 of 17
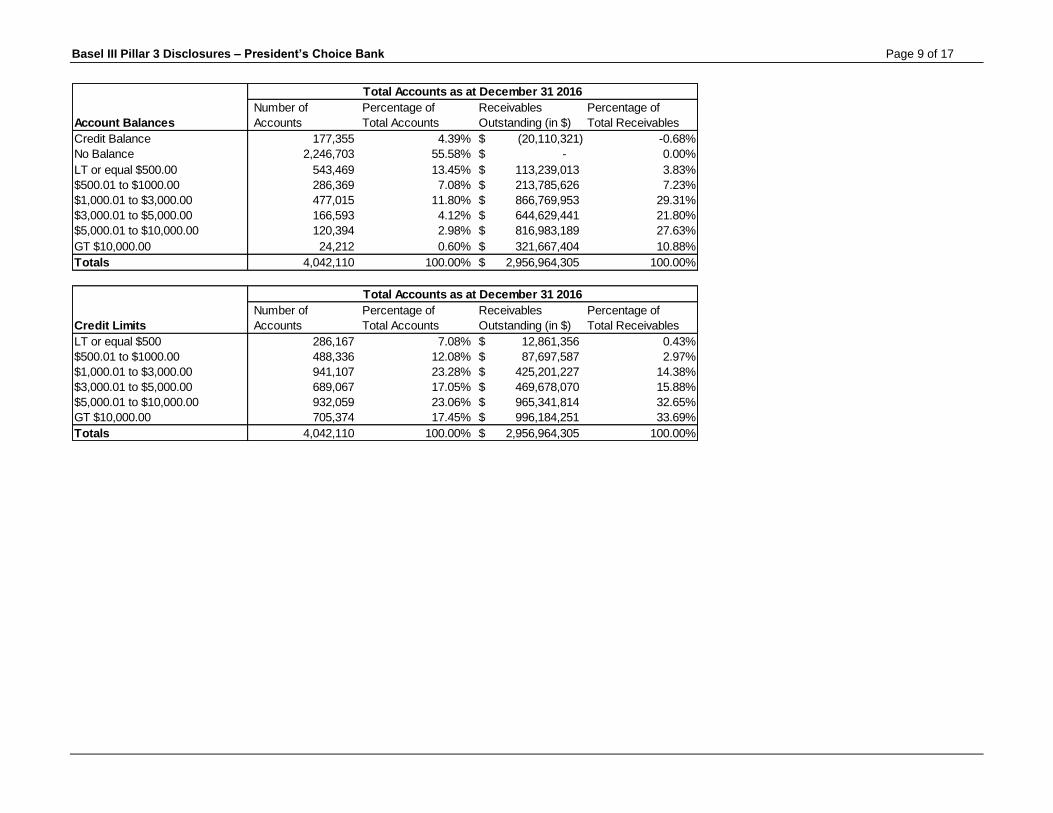
Number of Percentage of Receivables Percentage of
Days Delinquent Accounts Total Accounts Outstanding (in $) Total Receivables
Current (1)3,947,937 97.67% 2,770,359,674$ 93.69%
1 day to 29 days 60,486 1.50% 118,660,583$ 4.01%
30 days to 59 days 12,941 0.32% 23,323,466$ 0.79%
60 days to 89 days 6,972 0.17% 13,978,718$ 0.47%
90 days + 13,774 0.34% 30,641,864$ 1.04%
Totals 4,042,110 100.00% 2,956,964,305$ 100.00%
Note 1: Current category includes zero balance, credit balance, and transfers accounts.
Number of Percentage of Receivables Percentage of
Province Accounts Total Accounts Outstanding (in $) Total Receivables
Alberta 506,427 12.53% 391,580,646$ 13.24%
British Columbia 577,519 14.29% 388,101,539$ 13.12%
Manitoba 174,378 4.31% 149,232,561$ 5.05%
New Brunswick 65,133 1.61% 44,724,282$ 1.51%
Newfoundland & Labrador 21,692 0.54% 17,562,392$ 0.59%
Nova Scotia 119,634 2.96% 83,766,597$ 2.83%
Northwest Territories 2,333 0.06% 1,706,718$ 0.06%
Nunavut 383 0.01% 217,415$ 0.01%
Ontario 2,086,176 51.60% 1,584,176,392$ 53.58%
Prince Edward Island 15,183 0.38% 10,693,052$ 0.36%
Quebec 364,558 9.02% 196,355,773$ 6.64%
Saskatchewan 100,008 2.47% 84,454,695$ 2.86%
Yukon 4,735 0.12% 3,718,578$ 0.13%
Other 3,951 0.10% 673,665$ 0.02%
Totals 4,042,110 100.00% 2,956,964,305$ 100.00%
Total Accounts as at December 31 2016
Total Accounts as at December 31 2016
Basel III Pillar 3 Disclosures – President’s Choice Bank Page 11 of 17
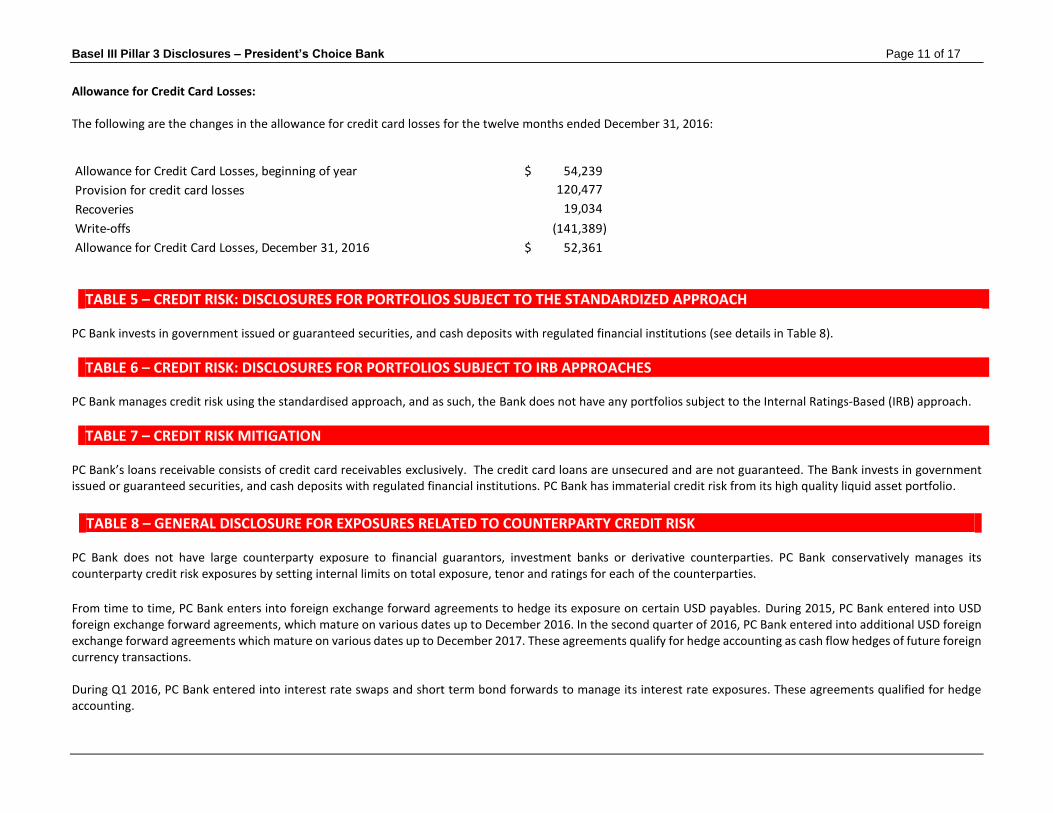
Allowance for Credit Card Losses: The following are the changes in the allowance for credit card losses for the twelve months ended December 31, 2016:
TABLE 5 – CREDIT RISK: DISCLOSURES FOR PORTFOLIOS SUBJECT TO THE STANDARDIZED APPROACH PC Bank invests in government issued or guaranteed securities, and cash deposits with regulated financial institutions (see details in Table 8).
TABLE 6 – CREDIT RISK: DISCLOSURES FOR PORTFOLIOS SUBJECT TO IRB APPROACHES PC Bank manages credit risk using the standardised approach, and as such, the Bank does not have any portfolios subject to the Internal Ratings-Based (IRB) approach.
TABLE 7 – CREDIT RISK MITIGATION PC Bank’s loans receivable consists of credit card receivables exclusively. The credit card loans are unsecured and are not guaranteed. The Bank invests in government issued or guaranteed securities, and cash deposits with regulated financial institutions. PC Bank has immaterial credit risk from its high quality liquid asset portfolio.
TABLE 8 – GENERAL DISCLOSURE FOR EXPOSURES RELATED TO COUNTERPARTY CREDIT RISK
PC Bank does not have large counterparty exposure to financial guarantors, investment banks or derivative counterparties. PC Bank conservatively manages its counterparty credit risk exposures by setting internal limits on total exposure, tenor and ratings for each of the counterparties.
From time to time, PC Bank enters into foreign exchange forward agreements to hedge its exposure on certain USD payables. During 2015, PC Bank entered into USD foreign exchange forward agreements, which mature on various dates up to December 2016. In the second quarter of 2016, PC Bank entered into additional USD foreign exchange forward agreements which mature on various dates up to December 2017. These agreements qualify for hedge accounting as cash flow hedges of future foreign currency transactions. During Q1 2016, PC Bank entered into interest rate swaps and short term bond forwards to manage its interest rate exposures. These agreements qualified for hedge accounting.
Allowance for Credit Card Losses, beginning of year 54,239$
Provision for credit card losses 120,477
Recoveries 19,034
Write-offs (141,389)
Allowance for Credit Card Losses, December 31, 2016 52,361$
Basel III Pillar 3 Disclosures – President’s Choice Bank Page 12 of 17
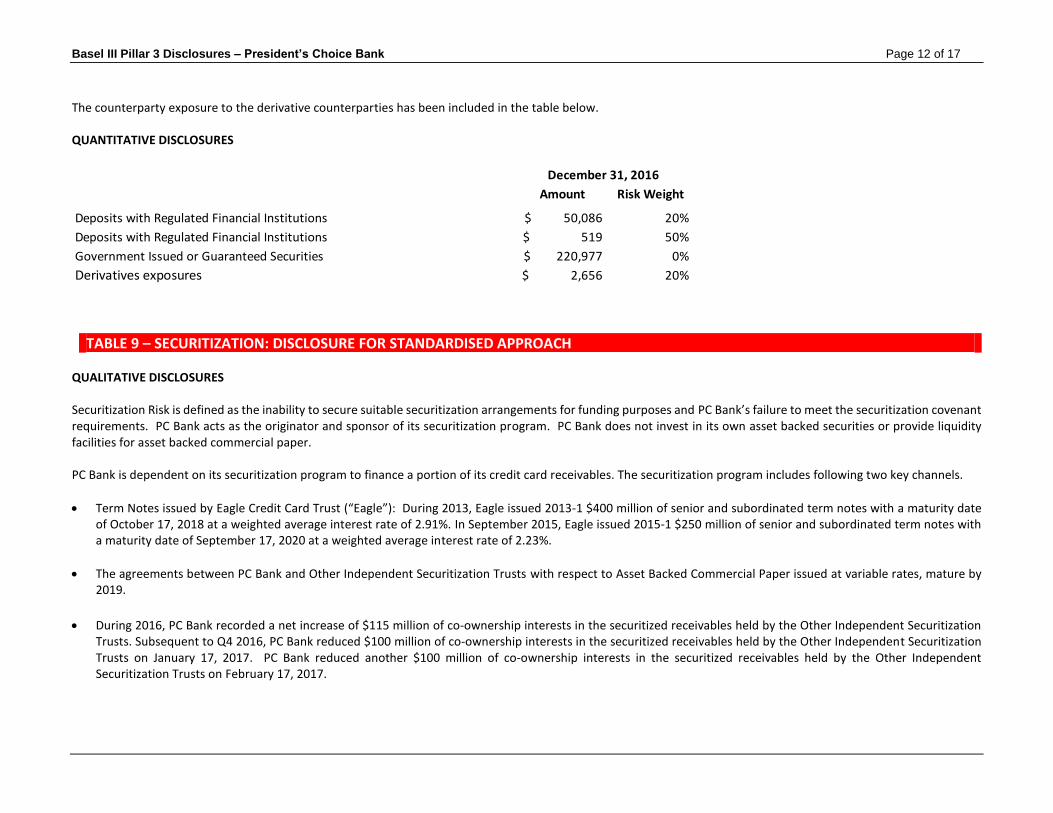
The counterparty exposure to the derivative counterparties has been included in the table below. QUANTITATIVE DISCLOSURES
TABLE 9 – SECURITIZATION: DISCLOSURE FOR STANDARDISED APPROACH QUALITATIVE DISCLOSURES Securitization Risk is defined as the inability to secure suitable securitization arrangements for funding purposes and PC Bank’s failure to meet the securitization covenant requirements. PC Bank acts as the originator and sponsor of its securitization program. PC Bank does not invest in its own asset backed securities or provide liquidity facilities for asset backed commercial paper. PC Bank is dependent on its securitization program to finance a portion of its credit card receivables. The securitization program includes following two key channels.
Term Notes issued by Eagle Credit Card Trust (“Eagle”): During 2013, Eagle issued 2013-1 $400 million of senior and subordinated term notes with a maturity date of October 17, 2018 at a weighted average interest rate of 2.91%. In September 2015, Eagle issued 2015-1 $250 million of senior and subordinated term notes with a maturity date of September 17, 2020 at a weighted average interest rate of 2.23%.
The agreements between PC Bank and Other Independent Securitization Trusts with respect to Asset Backed Commercial Paper issued at variable rates, mature by 2019.
During 2016, PC Bank recorded a net increase of $115 million of co-ownership interests in the securitized receivables held by the Other Independent Securitization
Trusts. Subsequent to Q4 2016, PC Bank reduced $100 million of co-ownership interests in the securitized receivables held by the Other Independent Securitization Trusts on January 17, 2017. PC Bank reduced another $100 million of co-ownership interests in the securitized receivables held by the Other Independent Securitization Trusts on February 17, 2017.
Amount Risk Weight
Deposits with Regulated Financial Institutions 50,086$ 20%
Deposits with Regulated Financial Institutions 519$ 50%
Government Issued or Guaranteed Securities 220,977$ 0%
Derivatives exposures 2,656$ 20%
December 31, 2016
Basel III Pillar 3 Disclosures – President’s Choice Bank Page 13 of 17
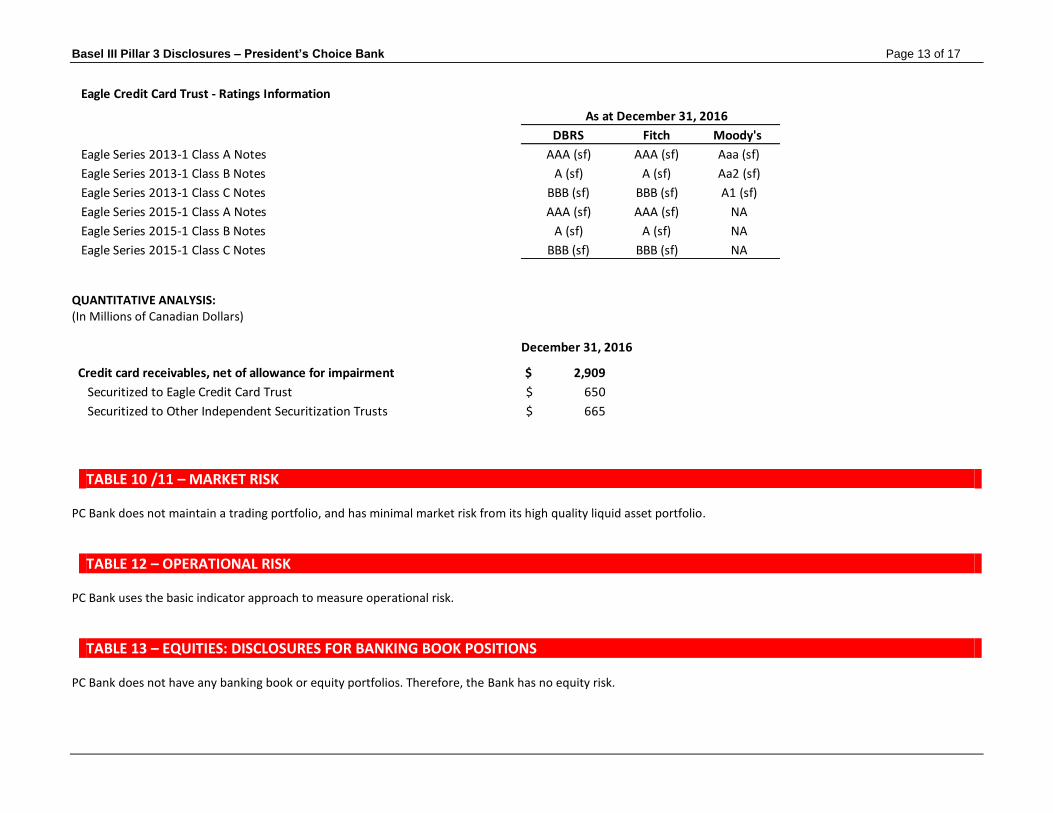
QUANTITATIVE ANALYSIS: (In Millions of Canadian Dollars)
TABLE 10 /11 – MARKET RISK PC Bank does not maintain a trading portfolio, and has minimal market risk from its high quality liquid asset portfolio.
TABLE 12 – OPERATIONAL RISK PC Bank uses the basic indicator approach to measure operational risk.
TABLE 13 – EQUITIES: DISCLOSURES FOR BANKING BOOK POSITIONS PC Bank does not have any banking book or equity portfolios. Therefore, the Bank has no equity risk.
Eagle Credit Card Trust - Ratings Information
As at December 31, 2016
DBRS Fitch Moody's
Eagle Series 2013-1 Class A Notes AAA (sf) AAA (sf) Aaa (sf)
Eagle Series 2013-1 Class B Notes A (sf) A (sf) Aa2 (sf)
Eagle Series 2013-1 Class C Notes BBB (sf) BBB (sf) A1 (sf)
Eagle Series 2015-1 Class A Notes AAA (sf) AAA (sf) NA
Eagle Series 2015-1 Class B Notes A (sf) A (sf) NA
Eagle Series 2015-1 Class C Notes BBB (sf) BBB (sf) NA
Credit card receivables, net of allowance for impairment 2,909$
Securitized to Eagle Credit Card Trust 650$
Securitized to Other Independent Securitization Trusts 665$
December 31, 2016
Basel III Pillar 3 Disclosures – President’s Choice Bank Page 14 of 17
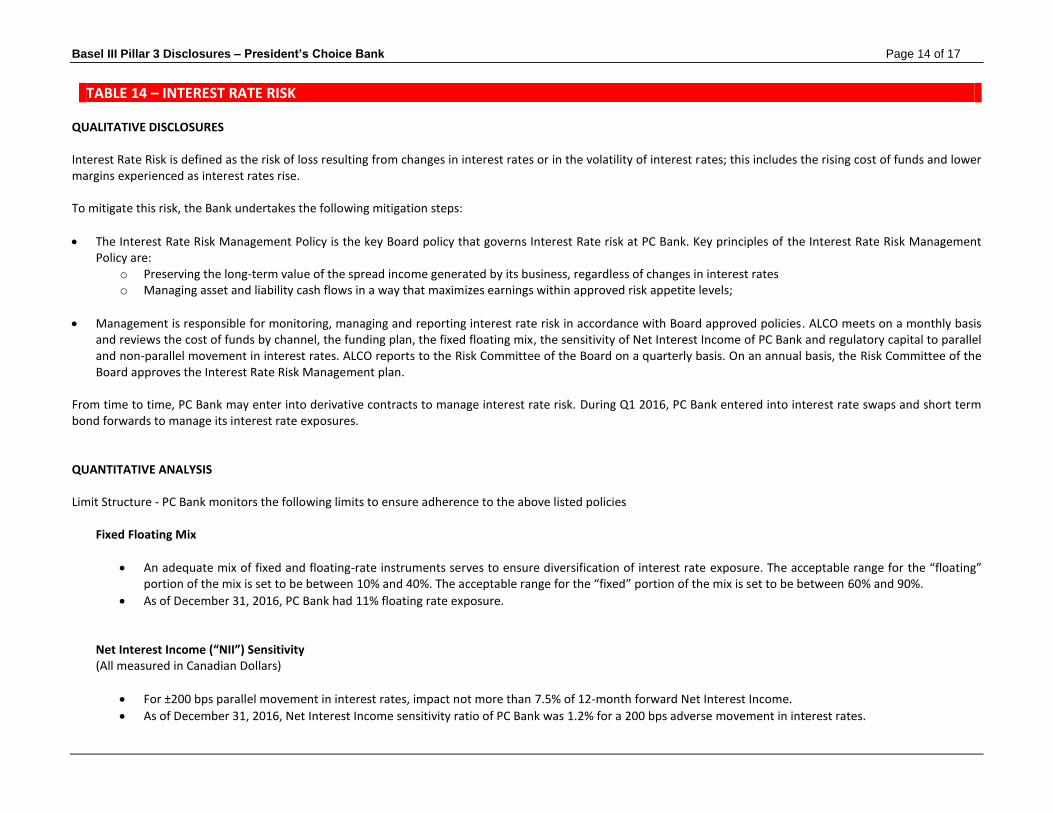
TABLE 14 – INTEREST RATE RISK QUALITATIVE DISCLOSURES Interest Rate Risk is defined as the risk of loss resulting from changes in interest rates or in the volatility of interest rates; this includes the rising cost of funds and lower margins experienced as interest rates rise. To mitigate this risk, the Bank undertakes the following mitigation steps:
The Interest Rate Risk Management Policy is the key Board policy that governs Interest Rate risk at PC Bank. Key principles of the Interest Rate Risk Management Policy are:
o Preserving the long-term value of the spread income generated by its business, regardless of changes in interest rates o Managing asset and liability cash flows in a way that maximizes earnings within approved risk appetite levels;
Management is responsible for monitoring, managing and reporting interest rate risk in accordance with Board approved policies. ALCO meets on a monthly basis and reviews the cost of funds by channel, the funding plan, the fixed floating mix, the sensitivity of Net Interest Income of PC Bank and regulatory capital to parallel and non-parallel movement in interest rates. ALCO reports to the Risk Committee of the Board on a quarterly basis. On an annual basis, the Risk Committee of the Board approves the Interest Rate Risk Management plan.
From time to time, PC Bank may enter into derivative contracts to manage interest rate risk. During Q1 2016, PC Bank entered into interest rate swaps and short term bond forwards to manage its interest rate exposures. QUANTITATIVE ANALYSIS Limit Structure - PC Bank monitors the following limits to ensure adherence to the above listed policies
Fixed Floating Mix
An adequate mix of fixed and floating-rate instruments serves to ensure diversification of interest rate exposure. The acceptable range for the “floating” portion of the mix is set to be between 10% and 40%. The acceptable range for the “fixed” portion of the mix is set to be between 60% and 90%.
As of December 31, 2016, PC Bank had 11% floating rate exposure. Net Interest Income (“NII”) Sensitivity (All measured in Canadian Dollars)
For ±200 bps parallel movement in interest rates, impact not more than 7.5% of 12-month forward Net Interest Income.
As of December 31, 2016, Net Interest Income sensitivity ratio of PC Bank was 1.2% for a 200 bps adverse movement in interest rates.
Basel III Pillar 3 Disclosures – President’s Choice Bank Page 15 of 17
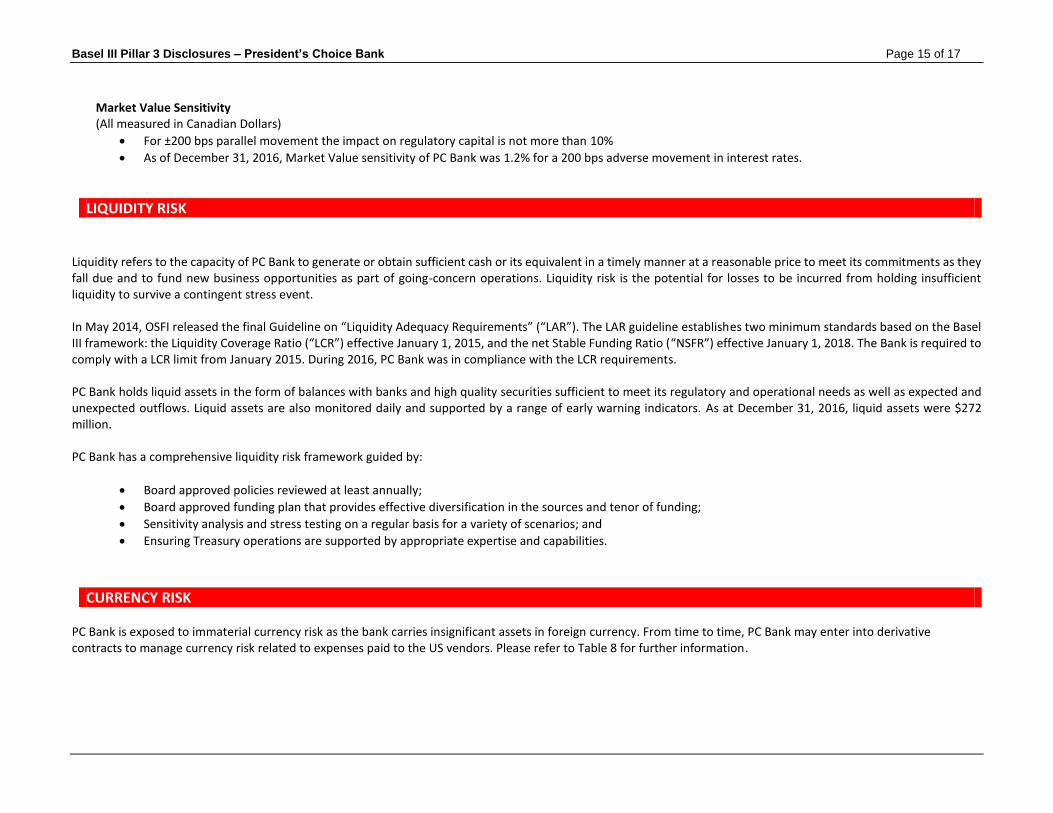
Market Value Sensitivity (All measured in Canadian Dollars)
For ±200 bps parallel movement the impact on regulatory capital is not more than 10%
As of December 31, 2016, Market Value sensitivity of PC Bank was 1.2% for a 200 bps adverse movement in interest rates.
LIQUIDITY RISK Liquidity refers to the capacity of PC Bank to generate or obtain sufficient cash or its equivalent in a timely manner at a reasonable price to meet its commitments as they fall due and to fund new business opportunities as part of going-concern operations. Liquidity risk is the potential for losses to be incurred from holding insufficient liquidity to survive a contingent stress event. In May 2014, OSFI released the final Guideline on “Liquidity Adequacy Requirements” (“LAR”). The LAR guideline establishes two minimum standards based on the Basel III framework: the Liquidity Coverage Ratio (“LCR”) effective January 1, 2015, and the net Stable Funding Ratio (“NSFR”) effective January 1, 2018. The Bank is required to comply with a LCR limit from January 2015. During 2016, PC Bank was in compliance with the LCR requirements. PC Bank holds liquid assets in the form of balances with banks and high quality securities sufficient to meet its regulatory and operational needs as well as expected and unexpected outflows. Liquid assets are also monitored daily and supported by a range of early warning indicators. As at December 31, 2016, liquid assets were $272 million. PC Bank has a comprehensive liquidity risk framework guided by:
Board approved policies reviewed at least annually;
Board approved funding plan that provides effective diversification in the sources and tenor of funding;
Sensitivity analysis and stress testing on a regular basis for a variety of scenarios; and
Ensuring Treasury operations are supported by appropriate expertise and capabilities.
CURRENCY RISK PC Bank is exposed to immaterial currency risk as the bank carries insignificant assets in foreign currency. From time to time, PC Bank may enter into derivative contracts to manage currency risk related to expenses paid to the US vendors. Please refer to Table 8 for further information.
Basel III Pillar 3 Disclosures – President’s Choice Bank Page 16 of 17
REMUNERATION QUALITATIVE DISCLOSURES Overall Components of Compensation The framework of PC Bank compensation program for senior executives is comprised of base salary, short-term cash incentives and a long term incentive plan. Base salary reflects the senior executives’: (a) level of responsibility (b) skill and experience, (c) market value of the position and (d) overall performance both individually and in their business unit. Roles reviewed against market, internal comparators and external comparators. Base salary is reviewed annually and as required by market conditions. Short Term Incentive Plan PC Bank’s short term incentive plan (“STIP”) is designed to motivate the senior executives to meet the corporation’s annual business and financial objectives. Every fiscal year, the performance of each individual is measured against the achievement of specific financial and performance goals which vary from year to the next. The STIP program is based on performance against various different performance measures that are designed to focus both executive and colleagues on key drivers of the business as well as value creation over both the short and long term. The STIP is a self-funded program with minimum financial threshold goals must be achieved in order to be eligible for a payout. Short-term incentive award targets are determined based on specific factors including role complexity, scope and impact of a role over a 12 month period. All participating colleagues have a short term cash incentive target that is expressed as a percentage of base salary determined by position and level within the organization. Depending on actual performance relative to set performance targets, cash payouts range from zero to the maximum target within each range. The STIP targets range from 40-100% for senior executives. Long Term Incentive Plans Loblaw Companies Limited (“LCL”)’s equity-based Long Term Incentive Plan (LTIP) is designed to motivate senior executives and increase shareholder value. PC Bank executives participate in the LCL’s LTIP program which awards long term incentives in the form of LCL stock options, restricted share units (“RSUs”), and Performance Share Units (“PSUs”). The value of the stock options and RSUs are directly linked to the change in value of LCL Common Shares. Executive are eligible for LTIP grants generally on an annual basis. The size of the annual award of grants that an executive is eligible to receive is determined as part of the executive’s total LTIP award. PSUs are a form of at-risk long-term compensation intended to motivate executives to deliver on business objectives. The target number of PSUs granted each year takes into account the scope of the executive’s role, his/her impact on the business and the competitive market practice. The Stock Option plan, RSU and PSU plans are managed by LCL and administered by a LCL Governance Committee - who approve participants, make grants of options and establish limitations, restrictions and conditions upon any grants of options. Full details regarding the 2016 LCL Stock Option, RSU and PSU plans are included in the May 2016 Loblaw Management Proxy Circular, available on www.sedar.com.
Basel III Pillar 3 Disclosures – President’s Choice Bank Page 17 of 17
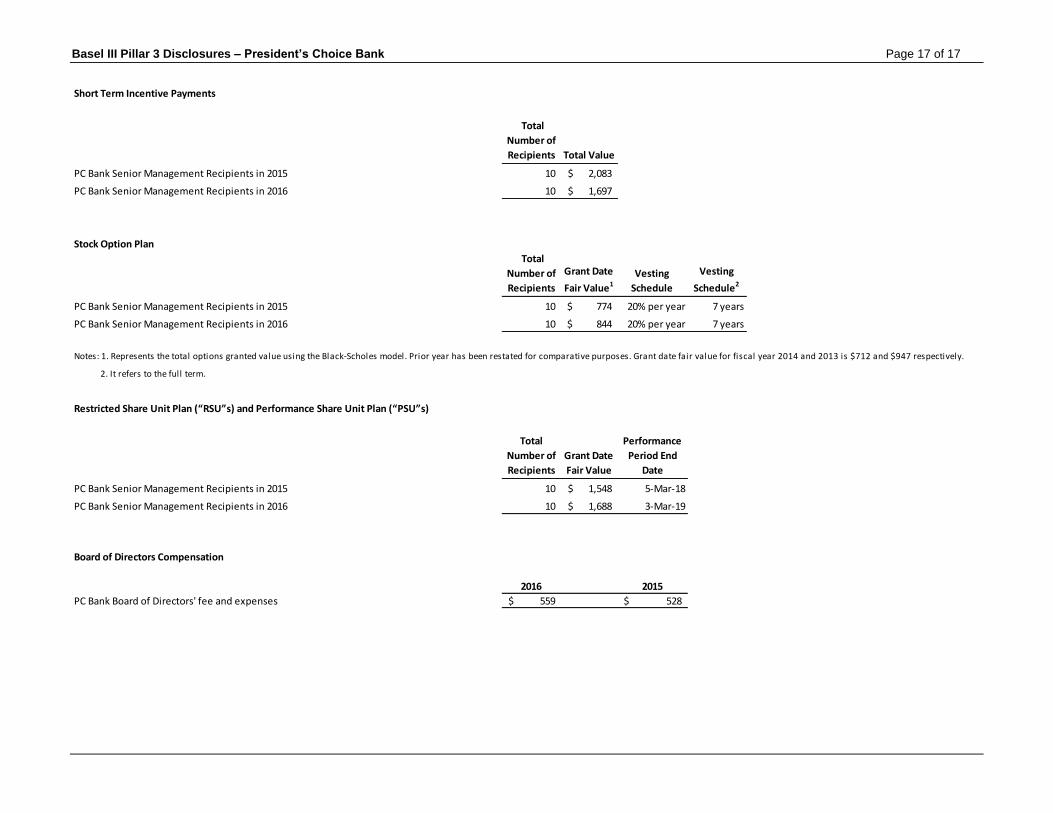
Short Term Incentive Payments
Total
Number of
Recipients Total Value
PC Bank Senior Management Recipients in 2015 10 2,083$
PC Bank Senior Management Recipients in 2016 10 1,697$
Stock Option Plan
Total
Number of
Recipients
Grant Date
Fair Value1
Vesting
Schedule
Vesting
Schedule2
PC Bank Senior Management Recipients in 2015 10 774$ 20% per year 7 years
PC Bank Senior Management Recipients in 2016 10 844$ 20% per year 7 years
Notes: 1. Represents the total options granted value using the Black-Scholes model. Prior year has been restated for comparative purposes. Grant date fair value for fiscal year 2014 and 2013 is $712 and $947 respectively.
2. It refers to the full term.
Restricted Share Unit Plan (“RSU”s) and Performance Share Unit Plan (“PSU”s)
Total
Number of
Recipients
Grant Date
Fair Value
Performance
Period End
Date
PC Bank Senior Management Recipients in 2015 10 1,548$ 5-Mar-18
PC Bank Senior Management Recipients in 2016 10 1,688$ 3-Mar-19
Board of Directors Compensation
2016 2015
PC Bank Board of Directors' fee and expenses 559$ 528$