Embed Size (px)
Citation preview

BASEL III PILLAR 3 DISCLOSURES
June 30, 2020
2
Table of Contents
HomeEquity Bank Basel III Pillar 3 Disclosures June 30, 2020
3
Table 1. Scope of application
HomeEquity Bank (the Bank) is a federally regulated Schedule I bank, incorporated and domiciled in Canada. The Bank’s main business is to originate and administer reverse mortgages. The Bank also issues guaranteed investment certificates and through its principal subsidiary, medium-term debt to fund its mortgage portfolio. The Bank is a wholly owned subsidiary of HOMEQ Corporation (HOMEQ), a private company. HOMEQ is wholly owned by Birch Hill Equity Partners Management Inc., which is the ultimate parent of the Bank. The Bank’s principal subsidiary is CHIP Mortgage Trust. All of the Bank’s subsidiaries are directly or indirectly wholly owned.
Basis of preparation
This document represents the Basel III Pillar 3 disclosures for the Bank. These disclosures are made pursuant to the Office of the Superintendent of Financial Institutions (OSFI) requirements, which are based on global standards established by the Bank of International Settlements, Basel Committee on Banking Supervision (BCBS).
The amounts disclosed in this document are based on the Bank’s annual and interim consolidated financial statements, which reflect the financial position and results of operations of the Bank consolidated with the financial position and results of operations of its subsidiaries. The interim consolidated financial statements have been prepared in accordance with International Financial Reporting Standards (IFRS) as issued by the International Accounting Standards Board (IASB), including the accounting requirements specified by OSFI, and reflect, where necessary, management’s best estimates and judgments. This report is unaudited.
Risk Management
The Board of Directors (Board) has developed and approved a Capital Management Policy (CMP) in accordance with the Board-approved Risk Appetite Framework (RAF). The Policy addresses minimum regulatory capital requirements as prescribed by regulators and internal capital targets as per the Board-approved RAF, which allows for the appropriate allocation of capital to meet the Bank’s strategic goals. The CMP dictates that capital be adequately maintained by the Bank.
Adherence to the CMP ensures that the Bank has sufficient capital to maintain its operations based on current activities, expected future business developments and the possibility of various disruptive or adverse scenarios based on the Bank’s stress testing program. Such stress testing scenarios include periods of economic downturn and/or asset re-pricing. In addition, in accordance with the Bank’s annual strategic planning, a 3-year forecast is prepared and provides guidance as to the type and extent of capital that will be required over this period of time.
The Bank’s Asset Liability Committee (ALCO) ensures adherence to the policy on at least a monthly basis and the Conduct Review and Risk Management Committee (CRRMC) of the Board ensures capital management in accordance with the Policy. The CRRMC meets at least three times a year.
HomeEquity Bank Basel III Pillar 3 Disclosures June 30, 2020
4
Table 1. Scope of application (continued)
The Bank uses the annual Internal Capital Adequacy Assessment Process (ICAAP) to determine the quantity and quality of capital to conduct its business activities. In preparing the ICAAP, the high-risk areas established in the Enterprise Risk Management Framework (ERMF) are subject to stress testing which incorporates assumptions established in the annual strategic planning process. The results of the stress tests help to determine the quantum of capital required to enable management and the Board to set capital levels consistent with the Board-approved RAF.
The Bank’s CRRMC is responsible for overseeing the types of risk to which the Bank may be exposed, and the techniques and systems used to identify, measure, monitor, report on and mitigate those risks. It is also responsible for reviewing capital management plans recommended by Management. The Bank’s stress testing program is reviewed with the CRRMC by Management at least three times a year. The ICAAP is reviewed by the CRRMC and approved by the Board based on the timeframe set by OSFI. Corporate Governance The Bank maintains a rigorous corporate governance structure as follows:
• Board of Directors’ Oversight • Conduct Review and Risk Management Committee • Audit Committee • Corporate Governance and Compensation Committee
The Bank also has independent oversight functions which include a Chief Risk Officer, a Chief Compliance Officer and a Chief Anti-Money Laundering Officer that report directly to the CEO and the CRRMC. The Board seeks to achieve long-term sustainable risk adjusted growth in order to ensure the health of the Bank and the stability of earnings while protecting the Bank’s well-respected brand name and reputation and the interests of its depositors, customers and investors. Auditor Assessment At least annually, the Audit Committee evaluates the performance, qualifications, skills, resources, and independence of the external auditor, including the lead partner, in order to support the Board of Directors in reaching its recommendation to appoint the external auditor. This evaluation includes an assessment of audit quality and service considerations such as: auditor independence, objectivity and professional skepticism; quality of the engagement team; and, quality of the communication and service provided by the external auditor. In the evaluation, the Audit Committee considers the nature and extent of communications received from the external auditor during the year and the responses from management and the Audit Committee to a questionnaire regarding the performance of, and interactions with, the external auditor. KPMG LLP has been appointed as the independent external auditor for the year ended December 31, 2020, in accordance with the recommendation by the Audit Committee.
HomeEquity Bank Basel III Pillar 3 Disclosures June 30, 2020
5
Table 1. Scope of application (continued)
Business risks
As a result of the Bank’s business model and the terms and conditions of a reverse mortgage, the most material risks faced by the Bank are described below:
Funding and Liquidity Risk Funding and liquidity risk can occur as a result of the uncertain timing of reverse mortgage cash flows and the Bank’s reliance on raising funds by the issuance of guaranteed investment certificates and medium-term notes. The Bank has a diversified range of funding sources and has created policies and procedures to ensure that cash flows are accurately predicted and monitored. It also maintains a sufficient amount of liquid assets to fund its anticipated loan commitments, operations, deposit maturities and interest payments should a shortfall arise. In addition, the Bank has a line of credit facility in place with a syndicate of Canadian Banks which may be used as additional liquidity if the Bank is unable to meet its obligations when they become due. In 2019 the Bank sold a portfolio of its reverse mortgages to a third-party investor and this represents a new cash flow source to the Bank for managing funding and liquidity risk. In July 2020, the Bank arranged another source of liquidity under the Bank of Canada’s Standing Term Liquidity Facility which the Bank of Canada recently made available to support the financial sector. Interest Rate Risk The Bank’s operating margin is primarily derived from the spread between interest earned on the mortgage portfolio, and the interest paid on the debt and deposits used to fund the portfolio. Risk arises from the Bank’s assets and liabilities having mismatched re-pricing dates or being referenced to different underlying instruments. The Bank has adopted hedging practices to maintain a relatively stable spread between interest earned on the mortgages and interest paid on the highly rated debt used to fund them. Operational Risk Operational risk is the risk of loss resulting from inadequate or failed internal processes, people and systems or from external events. It is the chance of unexpected income losses or increased costs that may emerge as a consequence of human, process or system failure and due to external developments. Risks included in this category include but are not limited to legal risk, fraud, security risk, process risk, business disruption and system failures, cybersecurity risk and loss of key personnel. Regulatory Compliance Risk Regulatory compliance risk arises from a financial institution’s non-compliance with applicable laws, rules, regulations and prescribed standards in any jurisdiction in which the institution operates. The Bank addresses regulatory requirements in a timely manner to ensure it is compliant with new applicable regulations. The Compliance Department keeps the Management team and the Board of Directors or its committees informed of new regulations, guidelines and changes to existing regulatory requirements.
HomeEquity Bank Basel III Pillar 3 Disclosures June 30, 2020
6
Table 1. Scope of application (continued)
Reputational Risk Management is aware of the potential negative effects of reputational risk exposure. The Bank has implemented complaint and incident resolution processes to mitigate these potential risks. Strategic Risk The Bank is Canada’s only national underwriter of reverse mortgages; however, there are companies in Canada that offer other alternative products that may compete with the Bank, including a bank that started offering reverse mortgage in January 2019. It is also possible that at some time in the future, banks, other financial services companies or foreign held reverse mortgage providers may decide to enter the market in direct competition to the Bank. The Bank believes that it has established a defensible competitive advantage as a result of its low-cost funding, proprietary data, internally developed systems and its established brand recognition and marketing network.
Underwriting Risk
Provided the homeowner is not in default, the right of the Bank to receive principal and interest when due under the reverse mortgage is limited to the realized value of the property. Underwriting risk is the potential for financial loss if the assets as currently reflected on the Bank’s balance sheet become impaired and not fully recoverable. In particular, this can result from a significant and persistent drop in real estate values and/or customers choosing not to repay their mortgages for an extended period of time. The Bank has developed reverse mortgage underwriting criteria, which provide reasonable loan to value ratios for the homeowner while seeking to provide assurance that the value of the related property upon maturity will be sufficient to repay the reverse mortgage.
COVID-19
In March 2020, the World Health Organization declared the outbreak of a novel coronavirus (COVID-19) as a pandemic. Governments worldwide, including Canadian federal and provincial governments, enacted emergency measures to combat the spread of this virus. These measures have caused material disruption to businesses globally and the extent of economic downturn remains uncertain. The Canadian government and central bank introduced significant monetary and fiscal interventions to stabilize economic conditions; however, the success of these interventions is not currently determinable. This challenging economic environment may have a direct impact on the Bank’s operating results and financial position in the future. This situation is dynamic and the magnitude of the potential impact on the economy and the operating results and financial position of the Bank is not fully known.
HomeEquity Bank Basel III Pillar 3 Disclosures June 30, 2020
7
Table 1. Scope of application (continued)
Below is an analysis of the financial risks arising from the COVID-19 outbreak on the Bank’s financial statements:
Credit risk and Impairment under IFRS 9 The Bank has considered macro-economic information and potential impacts of COVID-19 in its assessment of a) forecasts of key macro-economic variables, b) weighting of the three macro-economic scenarios, c) whether there has been a significant increase in credit risk in the mortgage portfolio when measuring expected credit losses (ECL), and d) measurement of the aggregate amount of ECL. Certain economists, whose projections the Bank has referred to, have differing opinions on the impact of COVID-19 on the Canadian real estate market from market values declining through 2020 to the market potentially rebounding in late 2020. The Bank’s reverse mortgage portfolio is comprised of long-term loans and Management has taken into account the known and expected effects of the pandemic in arriving at the forecasts for economic variables under different ECL scenarios and the weighting for these scenarios for purpose of determining ECL. Management believes that, based on information known as of the reporting date, there may be an increase of ECL over the term of the portfolio. As such, the assumptions used in the ECL calculation have been shifted to be more weighted to the pessimistic scenario. If the actual economic activity and projections are significantly stronger or weaker than the Bank’s current projections, the ECL estimate may be materially impacted. Liquidity risk The Bank has not experienced any disruption in its cash inflow from operations and its ability to raise financing from the Guaranteed Investment Certificate (GIC) broker deposit market. In July 2020, as a prudent liquidity and risk management measure, the Bank arranged for liquidity under the Bank of Canada’s Standing Term Liquidity Facility. Management believes that it has adequate liquidity and contingency plans to continue normal business operations and to mitigate risks associated with COVID-19 for the foreseeable future. Interest rate risk In an effort to mitigate the economic impact of COVID-19, the Bank of Canada significantly eased its monetary policy, reducing its key benchmark interest rate to 25bps, a rate last seen during the global financial crisis, and other market and administered rates have experienced similar declines. These reductions impact the interest earned on the Bank’s assets as well as the interest costs of funding raised to support those assets. Since the Bank has more assets than liabilities repricing in the short-term, these rate reductions are likely to reduce net interest income since the interest expense on liabilities will not decrease as much as the reduction in interest income on assets. The Bank has attempted to mitigate this risk through pricing actions taken to preserve its net interest margin. The Bank is continuing to manage interest rate risk and believes that it has sufficient tools to manage spread in the current interest rate environment.
HomeEquity Bank Basel III Pillar 3 Disclosures June 30, 2020
8
Table 2/3. Capital Structure and Capital Adequacy
Objectives, policies and processes
The overall objective of capital management is to ensure that the Bank has sufficient capital to maintain its operations based on current activities and expected business developments in the future and to provide a return to its shareholder commensurate with the risk of the business. The Bank’s capital resources consist of equity and unsecured subordinated debt.
The Bank’s regulatory capital requirements are specified by OSFI guidelines. These requirements are consistent with the framework of risk- based capital standards developed by the BCBS and are referred to as Basel III.
The Bank has implemented policies and procedures to monitor compliance with regulatory capital requirements. The Bank has implemented an ICAAP which is based on the Bank’s assessment of the business risks of the Bank. The Bank’s capital structure, risk-weighted assets, capital and leverage ratios are detailed in the tables below.
Capital structure
The Bank’s internal capital consists of Common Equity Tier 1 and Tier 2 capital. Common Equity Tier 1 capital consists of common shares, contributed surplus, accumulated other comprehensive losses and retained earnings reduced by regulatory adjustments. Tier 2 capital consists of subordinated debt in compliance with OSFI Guideline A requirements for Tier 2B limited life instruments. The Bank has authorized an unlimited number of common shares. As at June 30, 2020, the Bank had 135,501 common shares issued and outstanding.
(in thousands of Canadian dollars) Jun 30 2019
Sept 30 2019
Dec 31 2019
Mar 31 2020
Jun 30 2020
Common shares 165,901 165,901 165,901 165,901 165,901 Contributed surplus 1,079 1,096 1,113 1,126 1,136
Retained earnings 72,034 83,675 97,341 107,923 120,588
Accumulated other comprehensive loss (122) (77) (33) 12 23
Regulatory adjustments (1,399) (1,341) (1,210) (808) (437)
Common Equity Tier 1 capital 237,493 249,254 263,112 273,154 287,211 Book value of unsecured subordinated debt 16,000 16,000 16,000 16,000 16,000
Eligible Stage 1 and Stage 2 allowance 6,694 7,006 6,952 7,340 7,922
Tier 2 capital 22,694 23,006 22,952 23,340 23,922 Tier 1 capital and Total regulatory capital 260,187 272,260 286,064 297,494 311,133
HomeEquity Bank Basel III Pillar 3 Disclosures June 30, 2020
9
Table 2/3. Capital structure and Capital Adequacy (continued)
Capital Structure (continued)
The Bank at the end of the baseline period (Q4 2019) had $6,952 of stage 1 and 2 allowances allocated to its standardized portfolios and included as part of its Tier 2 capital. The Stage 1 and 2 allowances allocated to its standardized portfolios increases by $1,996 as of Q2 2020. The incremental $1,996 is subject to this transition. Assuming a 26.58% tax rate, and after applying a 70% factor, $1,026 would be included in CET1 capital. The balance of $970 would be added to Tier 2 capital. This results in the total allowances included in Total capital during the period ended June 30, 2020 of $8,948: $6,952 in Tier 2 as of the baseline plus $1,026 added to CET1 and $970 added to Tier 2.
Risk-weighted assets
The Bank’s risk-weighted assets include all on-balance sheet assets weighted for the risk inherent in each type of asset, an operational risk component based on a percentage of average risk-weighted revenues and a market risk component for off-balance sheet derivative financial instruments. The Bank uses the standardized approach for credit risk for all on-balance sheet assets, basic indicator approach for operational risk and the standardized approach for market risk. The Bank’s investment securities may consist of bank debt securities, government and provincial debt securities and corporate debt securities with ratings ranging from R1-low to R1-high and their equivalents. The Bank uses DBRS Limited for determining credit ratings. Investment securities have risk-weightings ranging from 0% to 50% based on their credit rating. Loans receivable, consisting of residential reverse mortgages have a risk-weighting of 35% to 100% with an average risk-weighting of 44.0% at June 30, 2020. All other assets are risk-weighted at 100%.
Risk-weighted assets (in thousands of Canadian dollars)
Jun 30 2019
Sept 30 2019
Dec 31 2019
Mar 31
2020 Jun 30 2020
Corporate debt securities 2,345 Deposits with regulated financial institutions 11,657 11,375 14,613 37,139 29,404 Residential reverse mortgages 1,604,042 1,690,302 1,745,083 1,835,774 1,916,691 Other assets 78,003 76,489 76,147 76,100 76,156 1,696,047 1,778,166 1,835,843 1,949,013 2,022,251 Off-balance sheet exposure 21,124 21,813 22,645 24,691 24,631 Credit risk 1,717,171 1,799,979 1,858,488 1,973,704 2,046,882 Operational risk (average three-year gross income) 133,025 142,413 154,888 164,938 174,888 Total risk-weighted assets 1,850,196 1,942,392 2,013,376 2,138,642 2,221,770
HomeEquity Bank Basel III Pillar 3 Disclosures June 30, 2020
10
Table 2/3. Capital structure and Capital Adequacy (continued)
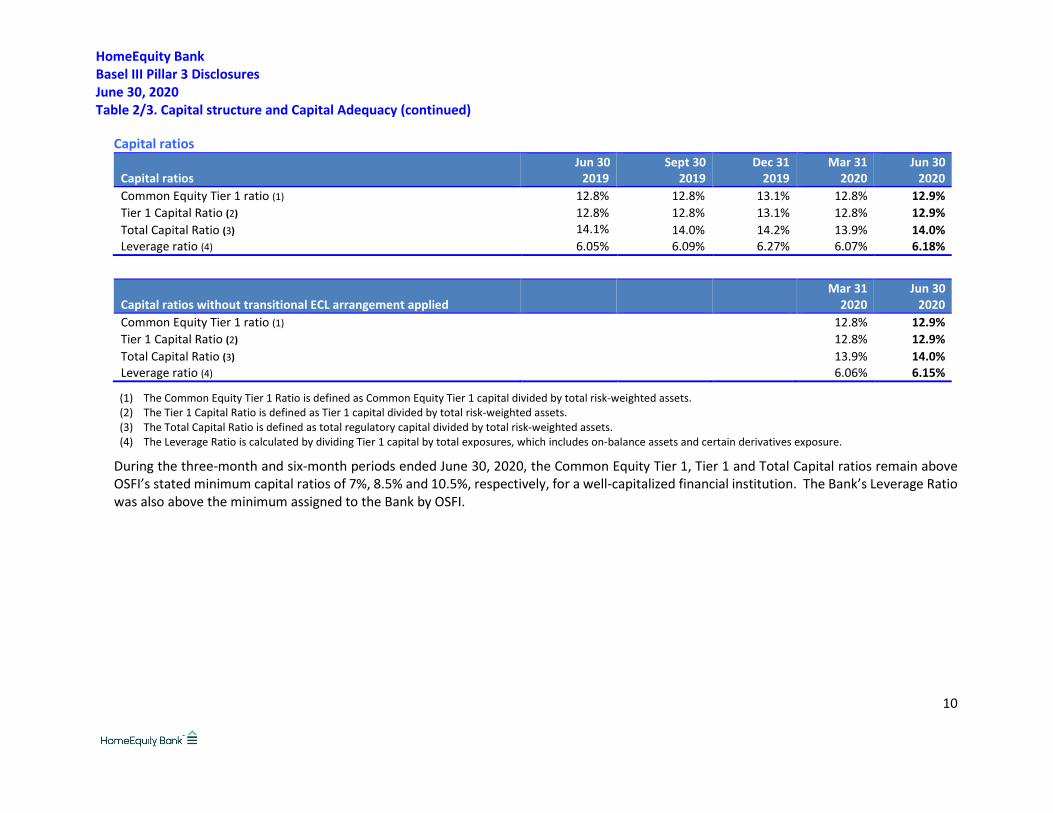
Capital ratios
Capital ratios Jun 30
2019 Sept 30
2019 Dec 31
2019 Mar 31
2020 Jun 30
2020 Common Equity Tier 1 ratio (1) 12.8% 12.8% 13.1% 12.8% 12.9% Tier 1 Capital Ratio (2) 12.8% 12.8% 13.1% 12.8% 12.9% Total Capital Ratio (3) 14.1%
14.0% 14.2% 13.9% 14.0%
Leverage ratio (4) 6.05% 6.09% 6.27% 6.07% 6.18%
Capital ratios without transitional ECL arrangement applied
Mar 31
2020 Jun 30
2020 Common Equity Tier 1 ratio (1) 12.8% 12.9% Tier 1 Capital Ratio (2) 12.8% 12.9% Total Capital Ratio (3) 13.9% 14.0% Leverage ratio (4) 6.06% 6.15%
(1) The Common Equity Tier 1 Ratio is defined as Common Equity Tier 1 capital divided by total risk-weighted assets. (2) The Tier 1 Capital Ratio is defined as Tier 1 capital divided by total risk-weighted assets. (3) The Total Capital Ratio is defined as total regulatory capital divided by total risk-weighted assets. (4) The Leverage Ratio is calculated by dividing Tier 1 capital by total exposures, which includes on-balance assets and certain derivatives exposure.
During the three-month and six-month periods ended June 30, 2020, the Common Equity Tier 1, Tier 1 and Total Capital ratios remain above OSFI’s stated minimum capital ratios of 7%, 8.5% and 10.5%, respectively, for a well-capitalized financial institution. The Bank’s Leverage Ratio was also above the minimum assigned to the Bank by OSFI.
HomeEquity Bank Basel III Pillar 3 Disclosures June 30, 2020
11
Table 4/5. Credit risk – general disclosures for all banks
The Bank performs regular monitoring of its risks, assessments, and related action plans. Senior management and the Board of Directors obtain information that allows them to keep informed regarding the effectiveness of their risk management process and activities. The Bank has a CRRMC to assist the Board in fulfilling its responsibilities.
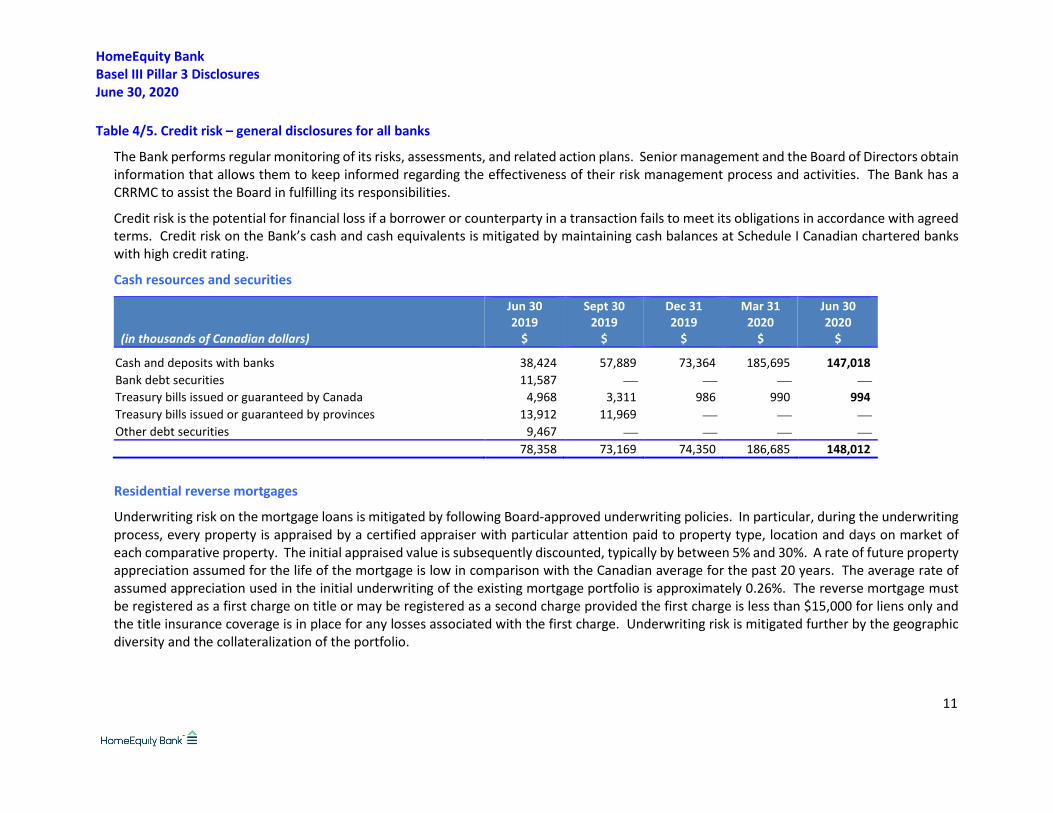
Credit risk is the potential for financial loss if a borrower or counterparty in a transaction fails to meet its obligations in accordance with agreed terms. Credit risk on the Bank’s cash and cash equivalents is mitigated by maintaining cash balances at Schedule I Canadian chartered banks with high credit rating.
Cash resources and securities
(in thousands of Canadian dollars)
Jun 30 2019
$
Sept 30 2019
$
Dec 31 2019
$
Mar 31 2020
$
Jun 30 2020
$
Cash and deposits with banks 38,424 57,889 73,364 185,695 147,018 Bank debt securities 11,587 Treasury bills issued or guaranteed by Canada 4,968 3,311 986 990 994 Treasury bills issued or guaranteed by provinces 13,912 11,969 Other debt securities 9,467 78,358 73,169 74,350 186,685 148,012
Residential reverse mortgages
Underwriting risk on the mortgage loans is mitigated by following Board-approved underwriting policies. In particular, during the underwriting process, every property is appraised by a certified appraiser with particular attention paid to property type, location and days on market of each comparative property. The initial appraised value is subsequently discounted, typically by between 5% and 30%. A rate of future property appreciation assumed for the life of the mortgage is low in comparison with the Canadian average for the past 20 years. The average rate of assumed appreciation used in the initial underwriting of the existing mortgage portfolio is approximately 0.26%. The reverse mortgage must be registered as a first charge on title or may be registered as a second charge provided the first charge is less than $15,000 for liens only and the title insurance coverage is in place for any losses associated with the first charge. Underwriting risk is mitigated further by the geographic diversity and the collateralization of the portfolio.
HomeEquity Bank Basel III Pillar 3 Disclosures June 30, 2020
12
Table 4/5. Credit risk – general disclosures for all banks (continued)
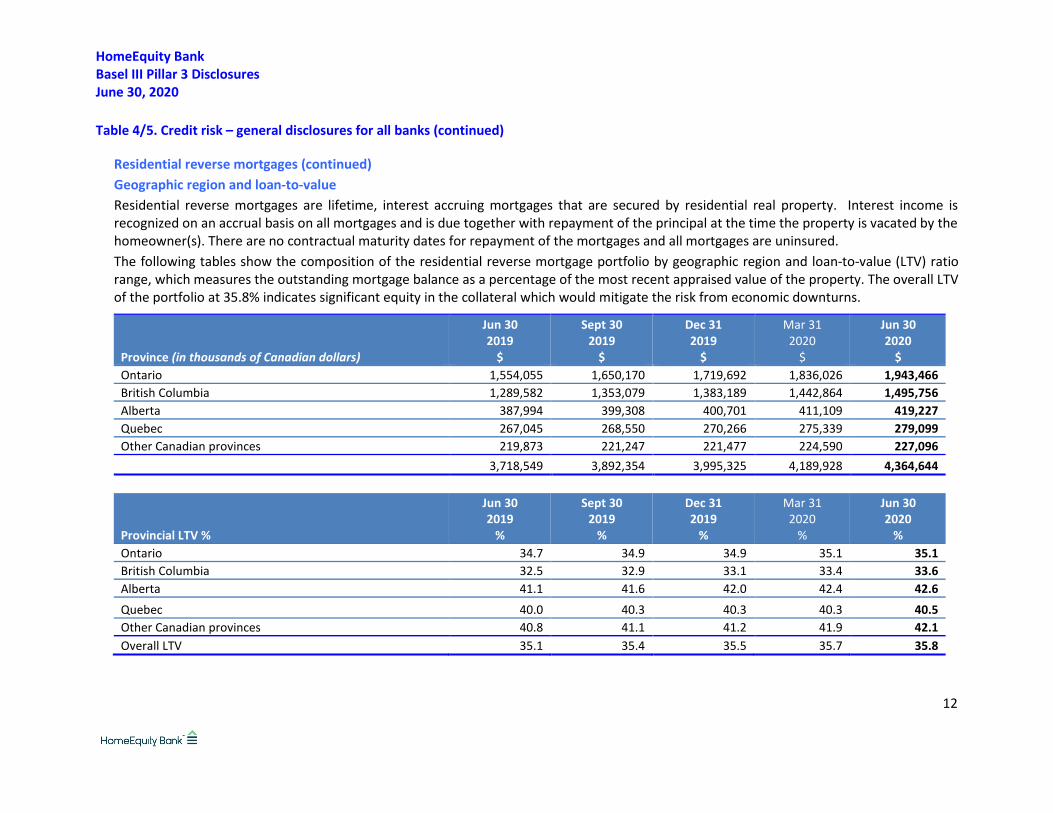
Residential reverse mortgages (continued) Geographic region and loan-to-value Residential reverse mortgages are lifetime, interest accruing mortgages that are secured by residential real property. Interest income is recognized on an accrual basis on all mortgages and is due together with repayment of the principal at the time the property is vacated by the homeowner(s). There are no contractual maturity dates for repayment of the mortgages and all mortgages are uninsured. The following tables show the composition of the residential reverse mortgage portfolio by geographic region and loan-to-value (LTV) ratio range, which measures the outstanding mortgage balance as a percentage of the most recent appraised value of the property. The overall LTV of the portfolio at 35.8% indicates significant equity in the collateral which would mitigate the risk from economic downturns.
Province (in thousands of Canadian dollars)
Jun 30 2019
$
Sept 30 2019
$
Dec 31 2019
$
Mar 31 2020
$
Jun 30 2020
$ Ontario 1,554,055 1,650,170 1,719,692 1,836,026 1,943,466 British Columbia 1,289,582 1,353,079 1,383,189 1,442,864 1,495,756 Alberta 387,994 399,308 400,701 411,109 419,227 Quebec 267,045 268,550 270,266 275,339 279,099 Other Canadian provinces 219,873 221,247 221,477 224,590 227,096 3,718,549 3,892,354 3,995,325 4,189,928 4,364,644
Provincial LTV %
Jun 30 2019
%
Sept 30 2019
%
Dec 31 2019
%
Mar 31 2020
%
Jun 30 2020
% Ontario 34.7 34.9 34.9 35.1 35.1 British Columbia 32.5 32.9 33.1 33.4 33.6 Alberta 41.1 41.6 42.0 42.4 42.6 Quebec 40.0 40.3 40.3 40.3 40.5 Other Canadian provinces 40.8 41.1 41.2 41.9 42.1 Overall LTV 35.1 35.4 35.5 35.7 35.8
HomeEquity Bank Basel III Pillar 3 Disclosures June 30, 2020
13
Table 4/5. Credit risk – general disclosures for all banks (continued)
Residential reverse mortgages (continued)
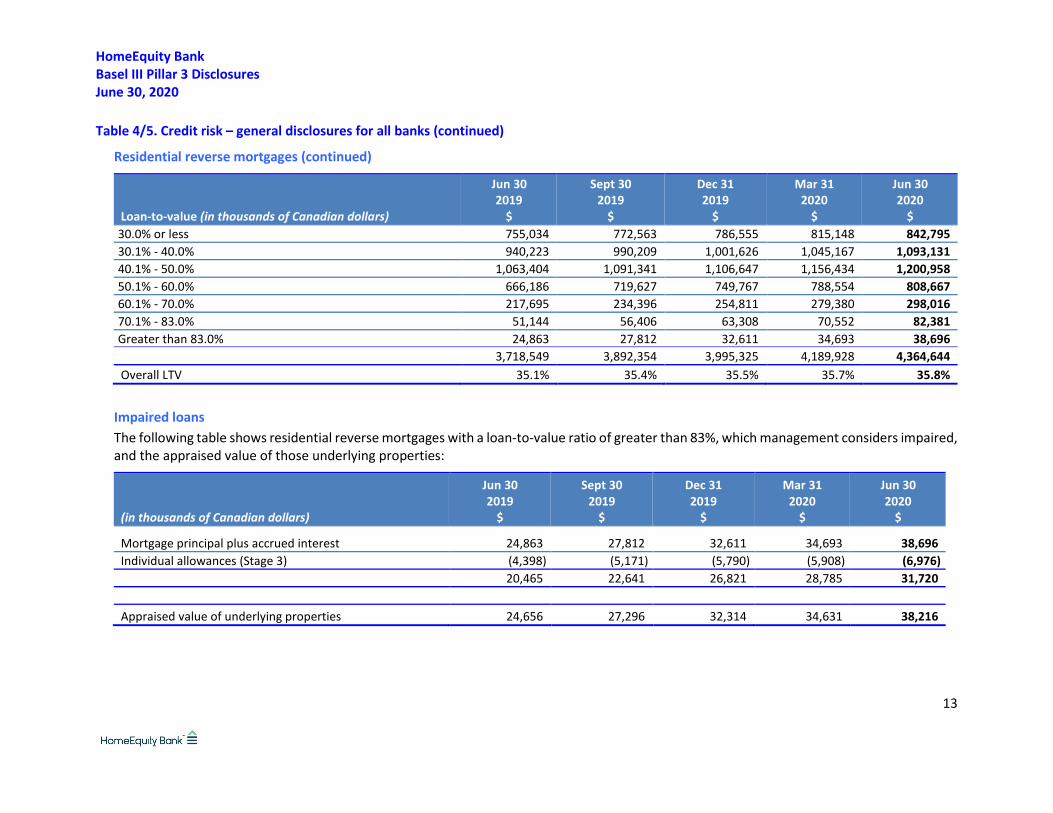
Loan-to-value (in thousands of Canadian dollars)
Jun 30 2019
$
Sept 30 2019
$
Dec 31 2019
$
Mar 31 2020
$
Jun 30 2020
$ 30.0% or less 755,034 772,563 786,555 815,148 842,795 30.1% - 40.0% 940,223 990,209 1,001,626 1,045,167 1,093,131 40.1% - 50.0% 1,063,404 1,091,341 1,106,647 1,156,434 1,200,958 50.1% - 60.0% 666,186 719,627 749,767 788,554 808,667 60.1% - 70.0% 217,695 234,396 254,811 279,380 298,016 70.1% - 83.0% 51,144 56,406 63,308 70,552 82,381 Greater than 83.0% 24,863 27,812 32,611 34,693 38,696 3,718,549 3,892,354 3,995,325 4,189,928 4,364,644 Overall LTV 35.1% 35.4% 35.5% 35.7% 35.8%
Impaired loans The following table shows residential reverse mortgages with a loan-to-value ratio of greater than 83%, which management considers impaired, and the appraised value of those underlying properties:
(in thousands of Canadian dollars)
Jun 30 2019
$
Sept 30 2019
$
Dec 31 2019
$
Mar 31 2020
$
Jun 30 2020
$
Mortgage principal plus accrued interest 24,863 27,812 32,611 34,693 38,696 Individual allowances (Stage 3) (4,398) (5,171) (5,790) (5,908) (6,976) 20,465 22,641 26,821 28,785 31,720 Appraised value of underlying properties 24,656 27,296 32,314 34,631 38,216
HomeEquity Bank Basel III Pillar 3 Disclosures June 30, 2020
14
Table 4/5. Credit risk – general disclosures for all banks (continued)
Residential reverse mortgages (continued)
Expected credit losses
The Bank’s Loan Provisioning Policy follows requirements under IFRS 9, Financial Instruments. The Loan Provisioning Policy utilizes an expected credit loss (ECL) impairment model for all financial assets not measured at fair value through profit and loss (FVTPL). The ECL model contains a three-stage approach which is based on the change in credit quality of financial assets since initial recognition. Through its staging process, the model calculates the expected credit loss within the portfolio, which is the present value of projected future cash flow shortfalls. The Bank evaluates and monitors the underwriting performance indicators of mortgages as well as changes in the characteristics of the portfolio. These indicators include a review of general real estate conditions and trends and their potential impact on the portfolio, the expected occupancy term and interest rates experienced over the life of a mortgage compared to initial underwriting assumptions.
As reverse mortgages do not have similar credit risk as conventional mortgages, the risk of loss is based on the underlying collateral and the performance of the loan relative to the date of initial advance which is measured by the mortgage loan-to-value (LTV). The Bank has determined that a significant increase in credit risk is based on the relative change in LTV. As LTV increases, the possibility of incurring a loss increase. The Bank uses the movement of LTV as a factor in determining the movement of loans between Stage 1 and Stage 2. The ECL allowance on the mortgage portfolio is calculated on a mortgage by mortgage basis. The risk assessment staging determines the level of ECL that is to be recognized. If the mortgage balance exceeds the property value at any point in the future, the excess is considered the lifetime loss. For Stage 3 loans, the Bank provides a reserve on any mortgage where the LTV exceeds 83%.
HomeEquity Bank Basel III Pillar 3 Disclosures June 30, 2020
15
Table 4/5. Credit risk – general disclosures for all banks (continued)
Residential reverse mortgages (continued)
Expected credit losses (continued)
(in thousands of Canadian dollars)
Jun 30 2019
$
Sept 30 2019
$
Dec 31 2019
$
Mar 31 2020
$
Jun 30 2020
$ Individual allowances (Stage 3) Balance, beginning of period (4,132) (4,398) (5,171) (5,790) (5,908) Provision for credit losses (786) (1,029) (937) (766) (1,269) Realized losses net of recoveries 520 256 318 648 201 Balance, end of period (4,398) (5,171) (5,790) (5,908) (6,976) Expected credit losses (Stage 1 and Stage 2) Balance, beginning of period (6,334) (6,694) (7,006) (6,952) (7,751) Provision for credit losses (396) (293) (20) (791) (1,196) Realized gains /(losses) net of recoveries 36 (19) 74 (8) (1) Balance, end of period (6,694) (7,006) (6,952) (7,751) (8,948) Total expected credit losses (11,092) (12,177) (12,742) (13,659) (15,924)
As a % of total mortgages outstanding 0.30% 0.31% 0.32% 0.33% 0.36%
HomeEquity Bank Basel III Pillar 3 Disclosures June 30, 2020
16
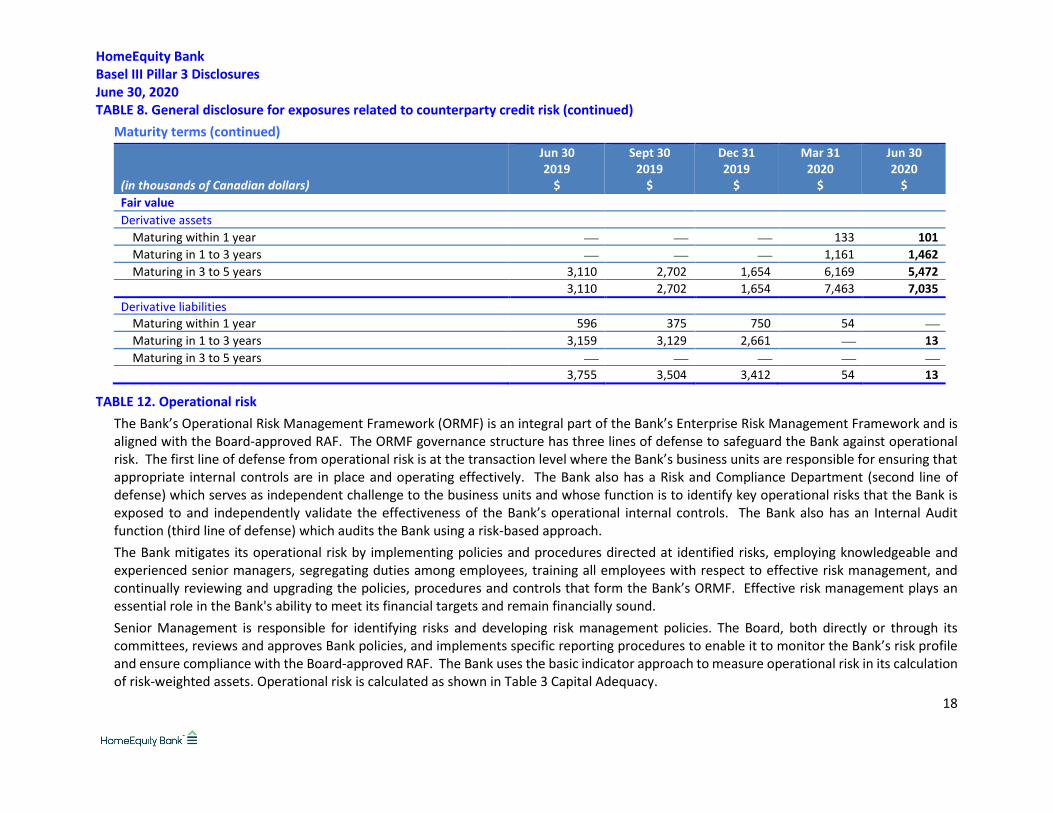
TABLE 8. General disclosure for exposures related to counterparty credit risk
Derivative instruments
In the normal course of business, the Bank enters into interest rate derivative contracts to manage interest rate risk, following internal interest rate risk management policies. Derivative financial instruments are financial contracts that derive their value from underlying changes in interest rates or other financial measures.
Interest rate swaps are contracts in which two counterparties agree to exchange cash flows over a period of time based on rates applied to a specified notional principal amount. A typical interest rate swap would require one counterparty to pay interest based on a fixed rate and receive interest based on a variable market interest rate determined from time to time with both calculated on a specified notional principal amount. No exchange of principal amount takes place at inception.
A bond forward is a contractual obligation for the contract holder to purchase or sell a bond on a specified date at a predetermined price. The Bank uses bond forwards to hedge changes in future cash flows attributable to interest rate fluctuations arising on highly probable forecasted issuances of fixed-rate medium-term debt. No exchange of principal amount takes place at inception.
The Bank’s International Swaps and Derivatives Association agreements require a credit support obligation in the form of government issued securities under certain circumstances. As at June 30, 2020, the Bank has posted $1.0M as collateral.
Market risk
Derivative financial instruments have either no or an insignificant market value at inception. Their value changes in response to relevant interest rates, foreign exchange rate or credit price changes, such that the previously contracted terms of the derivative transactions have become more or less favourable than what can be negotiated under current market conditions for contracts with the same terms and the same remaining period to expiry. The potential for derivatives to increase or decrease in value as a result of the foregoing factors is generally referred to as market risk. This market risk exposure to earnings is mitigated as the Bank does not hold or use any derivative contracts for speculative trading purposes.
Credit risk
Credit risk on derivative financial instruments is the risk of a financial loss occurring as a result of a default of a counterparty on its obligation to the Bank. Credit risk is limited by dealing only with Schedule I Canadian chartered banks with high credit rating as counterparties. The maximum derivative credit exposure to the Bank is the fair value of derivative contracts presented in the summary table below.
HomeEquity Bank Basel III Pillar 3 Disclosures June 30, 2020
17
TABLE 8. General disclosure for exposures related to counterparty credit risk (continued)
(in thousands of Canadian dollars)
Jun 30 2019
$
Sept 30 2019
$
Dec 31 2019
$
Mar 31 2020
$
Jun 30 2020
$ Derivative financial instrument assets
Notional principal 110,000 100,000 100,000 320,000 370,000 Replacement cost 3,110 2,702 1,654 7,463 8,118 Credit risk equivalent 3,610 3,202 2,154 2,019 9,418 Risk-weighted assets 722 640 431 404 1,884 Fair value 3,110 2,702 1,654 7,463 8,118
Maturity terms
The following tables summarize the notional principal and fair value by term to maturity of derivative financial instruments outstanding as at June 30, 2020. Maturity dates range from within 1 year to within five years of June 30, 2020.
(in thousands of Canadian dollars)
Jun 30 2019
$
Sept 30 2019
$
Dec 31 2019
$
Mar 31 2020
$
Jun 30 2020
$ Notional principal Derivative assets
Maturing within 1 year 10,000 50,000 80,000 Maturing in 1 to 3 years 145,000 165,000 Maturing in 3 to 5 years 100,000 100,000 100,000 125,000 100,000
110,000 100,000 100,000 320,000 345,000 Derivative liabilities
Maturing within 1 year 175,000 125,000 135,000 135,000 35,000 Maturing in 1 to 3 years 245,000 245,000 195,000 Maturing in 3 to 5 years
420,000 370,000 330,000 135,000 35,000
HomeEquity Bank Basel III Pillar 3 Disclosures June 30, 2020
18
TABLE 8. General disclosure for exposures related to counterparty credit risk (continued) Maturity terms (continued)
(in thousands of Canadian dollars)
Jun 30 2019
$
Sept 30 2019
$
Dec 31 2019
$
Mar 31 2020
$
Jun 30 2020
$ Fair value Derivative assets
Maturing within 1 year 133 101 Maturing in 1 to 3 years 1,161 1,462 Maturing in 3 to 5 years 3,110 2,702 1,654 6,169 5,472
3,110 2,702 1,654 7,463 7,035 Derivative liabilities
Maturing within 1 year 596 375 750 54 Maturing in 1 to 3 years 3,159 3,129 2,661 13 Maturing in 3 to 5 years
3,755 3,504 3,412 54 13
TABLE 12. Operational risk The Bank’s Operational Risk Management Framework (ORMF) is an integral part of the Bank’s Enterprise Risk Management Framework and is aligned with the Board-approved RAF. The ORMF governance structure has three lines of defense to safeguard the Bank against operational risk. The first line of defense from operational risk is at the transaction level where the Bank’s business units are responsible for ensuring that appropriate internal controls are in place and operating effectively. The Bank also has a Risk and Compliance Department (second line of defense) which serves as independent challenge to the business units and whose function is to identify key operational risks that the Bank is exposed to and independently validate the effectiveness of the Bank’s operational internal controls. The Bank also has an Internal Audit function (third line of defense) which audits the Bank using a risk-based approach. The Bank mitigates its operational risk by implementing policies and procedures directed at identified risks, employing knowledgeable and experienced senior managers, segregating duties among employees, training all employees with respect to effective risk management, and continually reviewing and upgrading the policies, procedures and controls that form the Bank’s ORMF. Effective risk management plays an essential role in the Bank's ability to meet its financial targets and remain financially sound. Senior Management is responsible for identifying risks and developing risk management policies. The Board, both directly or through its committees, reviews and approves Bank policies, and implements specific reporting procedures to enable it to monitor the Bank’s risk profile and ensure compliance with the Board-approved RAF. The Bank uses the basic indicator approach to measure operational risk in its calculation of risk-weighted assets. Operational risk is calculated as shown in Table 3 Capital Adequacy.
HomeEquity Bank Basel III Pillar 3 Disclosures June 30, 2020
19
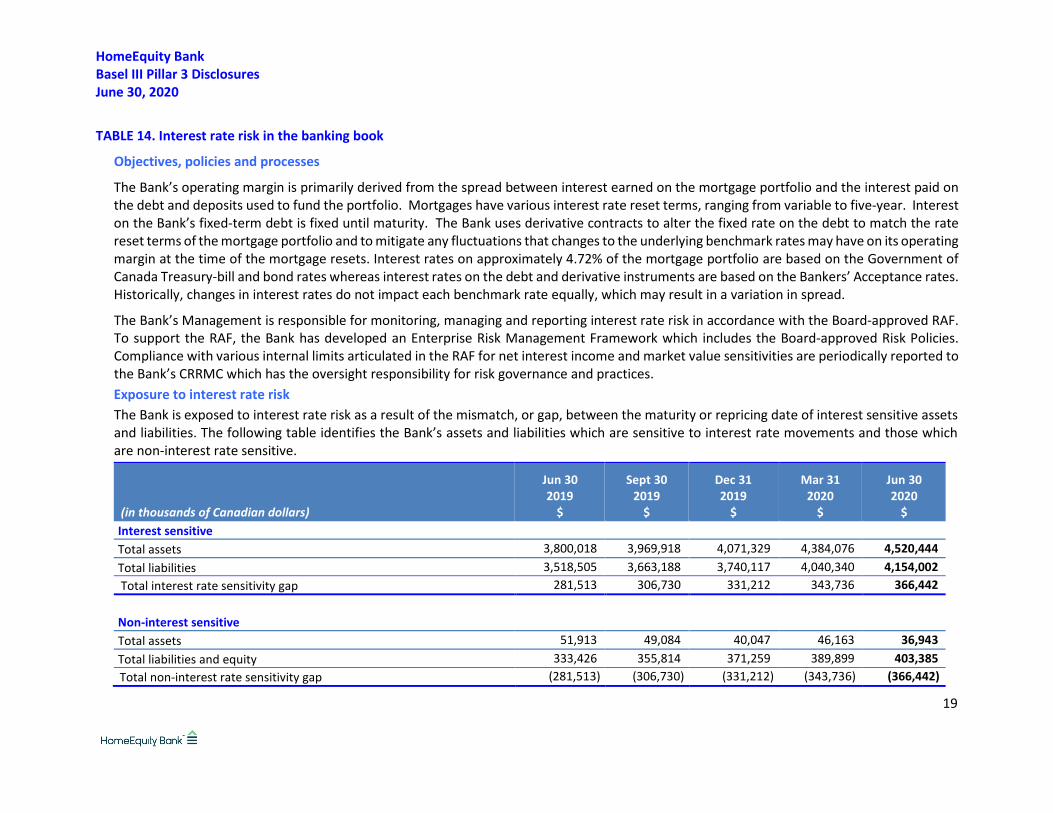
TABLE 14. Interest rate risk in the banking book
Objectives, policies and processes
The Bank’s operating margin is primarily derived from the spread between interest earned on the mortgage portfolio and the interest paid on the debt and deposits used to fund the portfolio. Mortgages have various interest rate reset terms, ranging from variable to five-year. Interest on the Bank’s fixed-term debt is fixed until maturity. The Bank uses derivative contracts to alter the fixed rate on the debt to match the rate reset terms of the mortgage portfolio and to mitigate any fluctuations that changes to the underlying benchmark rates may have on its operating margin at the time of the mortgage resets. Interest rates on approximately 4.72% of the mortgage portfolio are based on the Government of Canada Treasury-bill and bond rates whereas interest rates on the debt and derivative instruments are based on the Bankers’ Acceptance rates. Historically, changes in interest rates do not impact each benchmark rate equally, which may result in a variation in spread.
The Bank’s Management is responsible for monitoring, managing and reporting interest rate risk in accordance with the Board-approved RAF. To support the RAF, the Bank has developed an Enterprise Risk Management Framework which includes the Board-approved Risk Policies. Compliance with various internal limits articulated in the RAF for net interest income and market value sensitivities are periodically reported to the Bank’s CRRMC which has the oversight responsibility for risk governance and practices. Exposure to interest rate risk The Bank is exposed to interest rate risk as a result of the mismatch, or gap, between the maturity or repricing date of interest sensitive assets and liabilities. The following table identifies the Bank’s assets and liabilities which are sensitive to interest rate movements and those which are non-interest rate sensitive.
(in thousands of Canadian dollars)
Jun 30 2019
$
Sept 30 2019
$
Dec 31 2019
$
Mar 31 2020
$
Jun 30 2020
$ Interest sensitive Total assets 3,800,018 3,969,918 4,071,329 4,384,076 4,520,444 Total liabilities 3,518,505 3,663,188 3,740,117 4,040,340 4,154,002 Total interest rate sensitivity gap 281,513 306,730 331,212 343,736 366,442 Non-interest sensitive Total assets 51,913 49,084 40,047 46,163 36,943 Total liabilities and equity 333,426 355,814 371,259 389,899 403,385 Total non-interest rate sensitivity gap (281,513) (306,730) (331,212) (343,736) (366,442)
HomeEquity Bank Basel III Pillar 3 Disclosures June 30, 2020
20
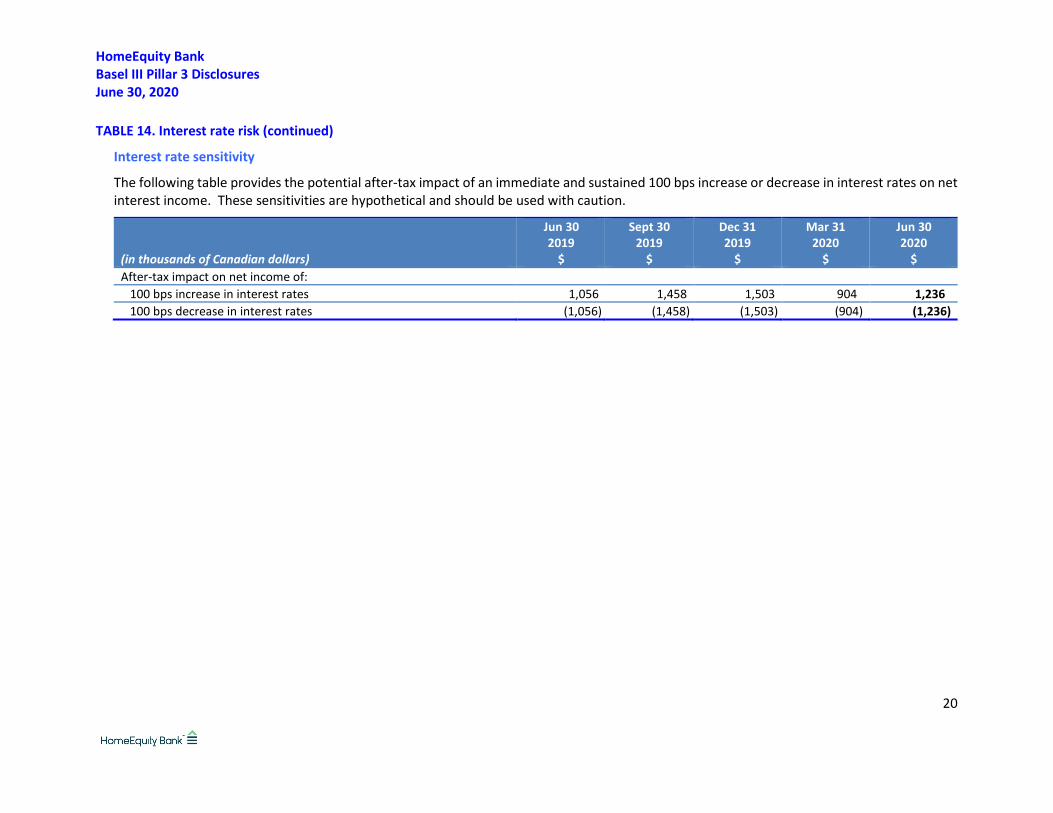
TABLE 14. Interest rate risk (continued)
Interest rate sensitivity
The following table provides the potential after-tax impact of an immediate and sustained 100 bps increase or decrease in interest rates on net interest income. These sensitivities are hypothetical and should be used with caution.
(in thousands of Canadian dollars)
Jun 30 2019
$
Sept 30 2019
$
Dec 31 2019
$
Mar 31 2020
$
Jun 30 2020
$ After-tax impact on net income of: 100 bps increase in interest rates 1,056 1,458 1,503 904 1,236 100 bps decrease in interest rates (1,056) (1,458) (1,503) (904) (1,236)
HomeEquity Bank Basel III Pillar 3 Disclosures June 30, 2020
21
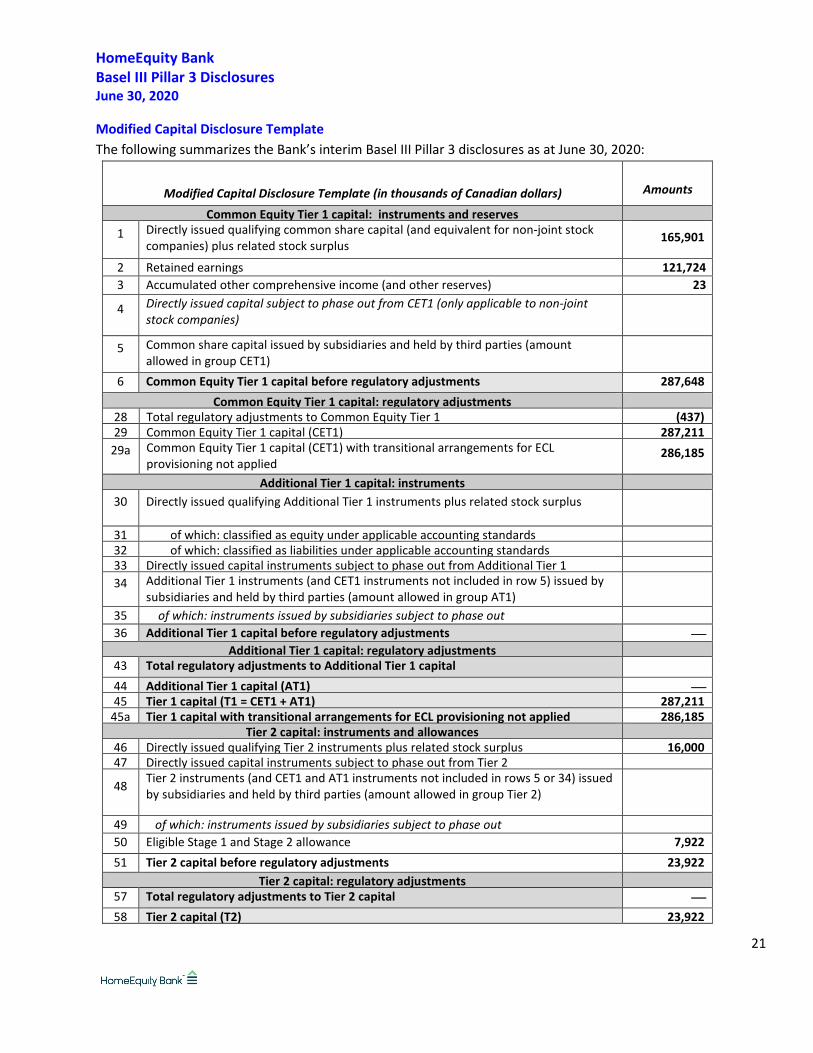
Modified Capital Disclosure Template The following summarizes the Bank’s interim Basel III Pillar 3 disclosures as at June 30, 2020:
Modified Capital Disclosure Template (in thousands of Canadian dollars) Amounts
Common Equity Tier 1 capital: instruments and reserves 1 Directly issued qualifying common share capital (and equivalent for non-joint stock
companies) plus related stock surplus 165,901
2 Retained earnings 121,724 3 Accumulated other comprehensive income (and other reserves) 23
4 Directly issued capital subject to phase out from CET1 (only applicable to non-joint stock companies)
5 Common share capital issued by subsidiaries and held by third parties (amount allowed in group CET1)
6 Common Equity Tier 1 capital before regulatory adjustments 287,648 Common Equity Tier 1 capital: regulatory adjustments
28 Total regulatory adjustments to Common Equity Tier 1 (437) 29 Common Equity Tier 1 capital (CET1) 287,211
29a Common Equity Tier 1 capital (CET1) with transitional arrangements for ECL provisioning not applied
286,185
Additional Tier 1 capital: instruments 30 Directly issued qualifying Additional Tier 1 instruments plus related stock surplus
31 of which: classified as equity under applicable accounting standards 32 of which: classified as liabilities under applicable accounting standards 33 Directly issued capital instruments subject to phase out from Additional Tier 1 34 Additional Tier 1 instruments (and CET1 instruments not included in row 5) issued by
subsidiaries and held by third parties (amount allowed in group AT1)
35 of which: instruments issued by subsidiaries subject to phase out 36 Additional Tier 1 capital before regulatory adjustments
Additional Tier 1 capital: regulatory adjustments 43 Total regulatory adjustments to Additional Tier 1 capital 44 Additional Tier 1 capital (AT1) 45 Tier 1 capital (T1 = CET1 + AT1) 287,211
45a Tier 1 capital with transitional arrangements for ECL provisioning not applied 286,185 Tier 2 capital: instruments and allowances
46 Directly issued qualifying Tier 2 instruments plus related stock surplus 16,000 47 Directly issued capital instruments subject to phase out from Tier 2
48 Tier 2 instruments (and CET1 and AT1 instruments not included in rows 5 or 34) issued by subsidiaries and held by third parties (amount allowed in group Tier 2)
49 of which: instruments issued by subsidiaries subject to phase out 50 Eligible Stage 1 and Stage 2 allowance 7,922 51 Tier 2 capital before regulatory adjustments 23,922
Tier 2 capital: regulatory adjustments 57 Total regulatory adjustments to Tier 2 capital 58 Tier 2 capital (T2) 23,922
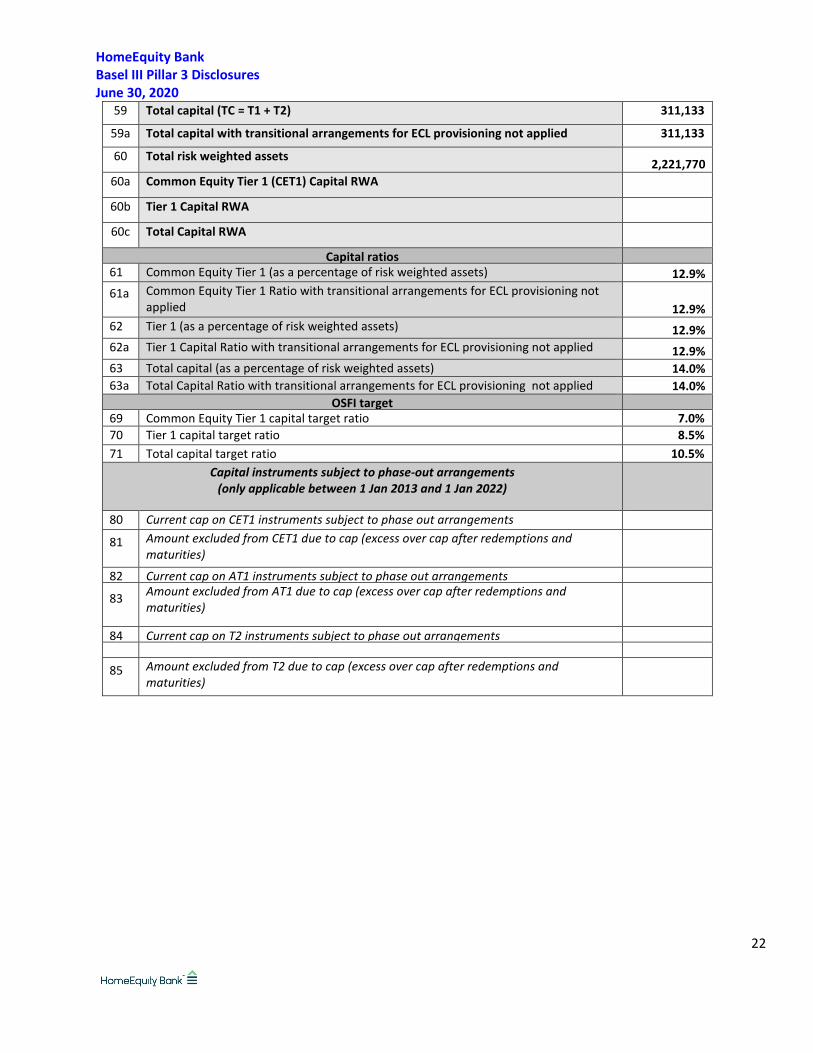
HomeEquity Bank Basel III Pillar 3 Disclosures June 30, 2020
22
59 Total capital (TC = T1 + T2) 311,133
59a Total capital with transitional arrangements for ECL provisioning not applied 311,133
60 Total risk weighted assets 2,221,770 60a Common Equity Tier 1 (CET1) Capital RWA
60b
Tier 1 Capital RWA 60c Total Capital RWA
Capital ratios 61 Common Equity Tier 1 (as a percentage of risk weighted assets) 12.9% 61a Common Equity Tier 1 Ratio with transitional arrangements for ECL provisioning not
applied 12.9% 62 Tier 1 (as a percentage of risk weighted assets) 12.9% 62a Tier 1 Capital Ratio with transitional arrangements for ECL provisioning not applied 12.9% 63 Total capital (as a percentage of risk weighted assets) 14.0% 63a Total Capital Ratio with transitional arrangements for ECL provisioning not applied 14.0%
OSFI target 69 Common Equity Tier 1 capital target ratio 7.0% 70 Tier 1 capital target ratio 8.5% 71 Total capital target ratio 10.5%
Capital instruments subject to phase-out arrangements (only applicable between 1 Jan 2013 and 1 Jan 2022)
80 Current cap on CET1 instruments subject to phase out arrangements
81 Amount excluded from CET1 due to cap (excess over cap after redemptions and maturities)
82 Current cap on AT1 instruments subject to phase out arrangements
83 Amount excluded from AT1 due to cap (excess over cap after redemptions and maturities)
84 Current cap on T2 instruments subject to phase out arrangements 85 Amount excluded from T2 due to cap (excess over cap after redemptions and
maturities)
HomeEquity Bank Basel III Pillar 3 Disclosures June 30, 2020
23
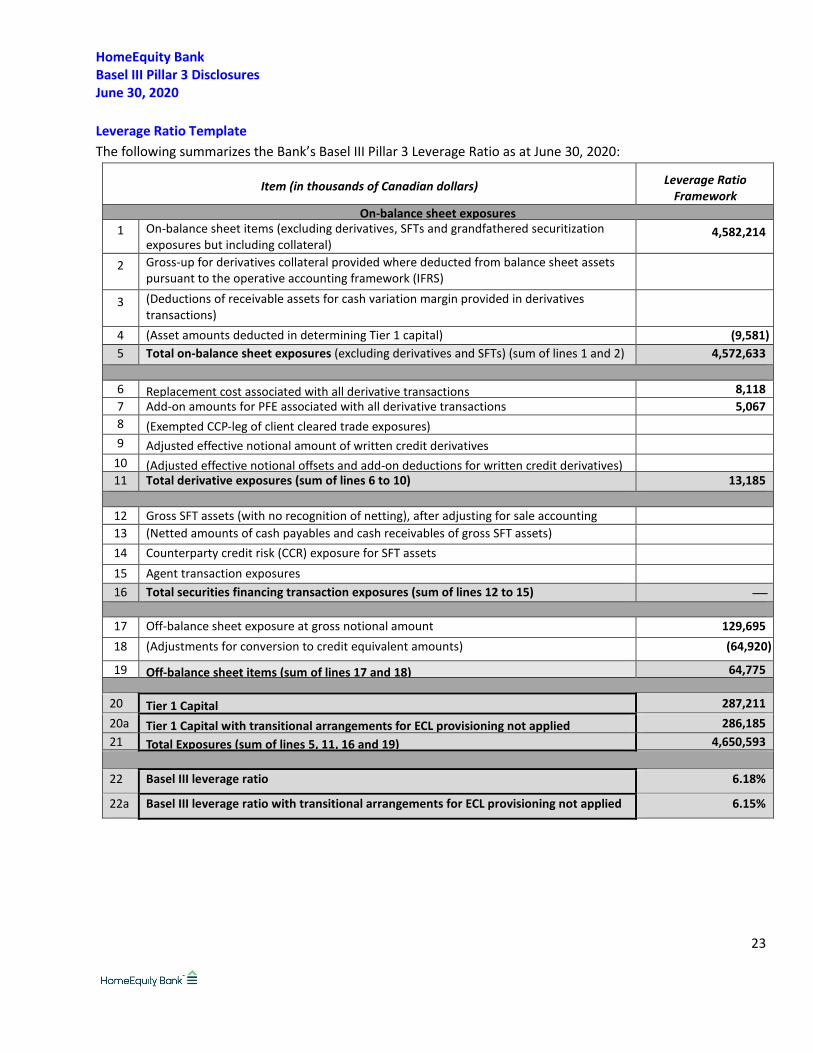
Leverage Ratio Template The following summarizes the Bank’s Basel III Pillar 3 Leverage Ratio as at June 30, 2020:
Item (in thousands of Canadian dollars) Leverage Ratio Framework
On-balance sheet exposures 1 On-balance sheet items (excluding derivatives, SFTs and grandfathered securitization
exposures but including collateral) 4,582,214
2 Gross-up for derivatives collateral provided where deducted from balance sheet assets pursuant to the operative accounting framework (IFRS)
3 (Deductions of receivable assets for cash variation margin provided in derivatives transactions)
4 (Asset amounts deducted in determining Tier 1 capital)
(9,581) 5 Total on-balance sheet exposures (excluding derivatives and SFTs) (sum of lines 1 and 2) 4,572,633
6 Replacement cost associated with all derivative transactions 8,118 7 Add-on amounts for PFE associated with all derivative transactions 5,067 8 (Exempted CCP-leg of client cleared trade exposures) 9
Adjusted effective notional amount of written credit derivatives 10 (Adjusted effective notional offsets and add-on deductions for written credit derivatives) 11 Total derivative exposures (sum of lines 6 to 10) 13,185
12 Gross SFT assets (with no recognition of netting), after adjusting for sale accounting
13 (Netted amounts of cash payables and cash receivables of gross SFT assets) 14 Counterparty credit risk (CCR) exposure for SFT assets 15 Agent transaction exposures 16 Total securities financing transaction exposures (sum of lines 12 to 15)
17 Off-balance sheet exposure at gross notional amount 129,695 18 (Adjustments for conversion to credit equivalent amounts) (64,920)
19 Off-balance sheet items (sum of lines 17 and 18) 64,775
20 Tier 1 Capital 287,211 20a Tier 1 Capital with transitional arrangements for ECL provisioning not applied 286,185 21 Total Exposures (sum of lines 5, 11, 16 and 19) 4,650,593
22 Basel III leverage ratio 6.18%
22a Basel III leverage ratio with transitional arrangements for ECL provisioning not applied 6.15%