Embed Size (px)
Citation preview

BASEL III PILLAR 3 DISCLOSURES
December 31, 2018
2
Table of Contents
HomeEquity Bank Basel III Pillar 3 Disclosures December 31, 2018
3
Table 1. Scope of application
HomeEquity Bank (the Bank) is a federally regulated Schedule I bank, incorporated and domiciled in Canada. The Bank’s main business is to originate and administer reverse mortgages. The Bank also issues guaranteed investment certificates and through its principal subsidiary, medium-term debt to fund its mortgage portfolio. The Bank is a wholly owned subsidiary of HOMEQ Corporation (HOMEQ), a private company. HOMEQ is wholly owned by Birch Hill Equity Partners Management Inc., which is the ultimate parent of the Bank. The Bank’s principal subsidiary is CHIP Mortgage Trust. All of the Bank’s subsidiaries are directly or indirectly wholly owned.
Basis of preparation
This document represents the Basel III Pillar 3 disclosure for the Bank. These disclosures are made pursuant to the Office of the Superintendent of Financial Institutions (OSFI) requirements, which are based on global standards established by the Bank of International Settlements, Basel Committee on Banking Supervision (BCBS).
The amounts disclosed in this document are based on the Bank’s annual and interim consolidated financial statements, which reflect the financial position and results of operations of the Bank consolidated with the financial position and results of operations of its subsidiaries. The annual consolidated financial statements have been prepared in accordance with International Financial Reporting Standards (IFRS) as issued by the International Accounting Standards Board (IASB), including the accounting requirements specified by OSFI, and reflect, where necessary, management’s best estimates and judgments. This report is unaudited.
Risk Management
The Board of Directors (Board) has developed and approved a Capital Management Policy (CMP) in accordance with the Board-approved Risk Appetite Framework (RAF). The Policy addresses minimum regulatory capital requirements as prescribed by regulators and internal capital targets as per the Board-approved RAF, which allows for the appropriate allocation of capital to meet the Bank’s strategic goals. The CMP dictates that capital be adequately maintained by the Bank.
Adherence to the CMP ensures that the Bank has sufficient capital to maintain its operations based on current activities, expected future business developments and the possibility of various disruptive or adverse scenarios based on the Bank’s stress testing program. Such stress testing scenarios include periods of economic downturn and/or asset re-pricing. In addition, in accordance with the Bank’s annual strategic planning, a 3-year forecast is prepared and provides guidance as to the type and extent of capital that will be required over this period of time. The Bank’s Asset Liability Committee (ALCO) ensures adherence to the policy on at least a monthly basis and the Conduct Review and Risk Management Committee (CRRMC) of the Board ensures capital management in accordance with the Policy. The CRRMC meets at least three times a year.
HomeEquity Bank Basel III Pillar 3 Disclosures December 31, 2018
4
Table 1. Scope of application (continued) The Bank uses the annual Internal Capital Adequacy Assessment Process (ICAAP) to determine the quantity and quality of capital to conduct its business activities. In preparing the ICAAP, the high-risk areas established in the Enterprise Risk Management Framework (ERMF) are subject to stress testing which incorporates assumptions established in the annual strategic planning process. The results of the stress tests help to determine the quantum of capital required to enable management and the Board to set capital levels appropriate with the Board-approved RAF. The Bank’s CRRMC is responsible for overseeing the types of risk to which the Bank may be exposed and the techniques and systems used to identify, measure, monitor, report on and mitigate those risks. It is also responsible for reviewing capital management plans recommended by Management. The Bank’s stress testing program is reviewed with the CRRMC by Management at least three times a year. The ICAAP is reviewed by the CRRMC and approved by the Board based on the timeframe set by OSFI. Corporate Governance The Bank maintains a rigorous corporate governance structure as follows:
• Board of Directors’ Oversight • Conduct Review and Risk Management Committee • Audit Committee • Corporate Governance and Compensation Committee
The Bank also has independent oversight functions which include a Chief Risk Officer, a Chief Compliance Officer and a Chief Anti-Money Laundering Officer that report directly to the CEO and the CRRMC. The Board seeks to achieve long-term sustainable risk adjusted growth in order to ensure the health of the Bank and the stability of earnings while protecting the Bank’s well-respected brand name and reputation and the interests of its depositors, customers and investors. Auditor Assessment At least annually, the Audit Committee evaluates the performance, qualifications, skills, resources, and independence of the external auditor, including the lead partner, in order to support the Board of Directors in reaching its recommendation to appoint the external auditor. This evaluation includes an assessment of audit quality and service considerations such as: auditor independence, objectivity and professional skepticism; quality of the engagement team; and, quality of the communication and service provided by the external auditor. In the evaluation, the Audit Committee considers the nature and extent of communications received from the external auditor during the year and the responses from management and the Audit Committee to a questionnaire regarding the performance of, and interactions with, the external auditor. KPMG LLP has been appointed as the independent external auditor for the year ended December 31, 2018, in accordance with the recommendation by the Audit Committee.
HomeEquity Bank Basel III Pillar 3 Disclosures December 31, 2018
5
Table 1. Scope of application (continued)
Business risks
As a result of the Bank’s business model and the terms and conditions of a reverse mortgage, the most material risks faced by the Bank are described below:
Funding and Liquidity Risk Funding and liquidity risk can occur as a result of the uncertain timing of reverse mortgage cash flows and the Bank’s reliance on raising funds by the issuance of guaranteed investment certificates and medium-term notes. The Bank has a diversified range of funding sources and has created policies and procedures to ensure that cash flows are accurately predicted and monitored. It also maintains a sufficient amount of liquid assets to fund its anticipated loan commitments, operations, deposit maturities and interest payments should a shortfall arise. Interest Rate Risk The Bank’s operating margin is primarily derived from the spread between interest earned on the mortgage portfolio, and the interest paid on the debt and deposits used to fund the portfolio. Risk arises from the Bank’s assets and liabilities having mismatched re-pricing dates or being referenced to different underlying instruments. The Bank has adopted hedging practices to maintain a relatively stable spread between interest earned on the mortgages and interest paid on the highly rated debt used to fund them. Operational Risk Operational risk is the risk of loss resulting from inadequate or failed internal processes, people and systems or from external events. It is the chance of unexpected income losses or increased costs that may emerge as a consequence of human, process or system failure and due to external developments. Operational risk includes legal risk and information technology risk, including cybersecurity risk. Regulatory Compliance Risk Regulatory risk arises from a financial institution’s non-compliance with applicable laws, rules, regulations and prescribed standards in any jurisdiction in which the institution operates. The Bank addresses regulatory requirements in a timely manner to ensure it is compliant with new applicable regulations. The Compliance Department keep the Management team and the Board of Directors (the Board) informed of new regulations, guidelines and changes to existing regulatory requirements.
HomeEquity Bank Basel III Pillar 3 Disclosures December 31, 2018
6
Table 1. Scope of application (continued)
Reputational Risk Management is aware of the potential negative effects of media and reputation risk exposure. The Bank has implemented complaint and incident resolution processes to mitigate these potential risks. Strategic Risk The Bank is Canada’s only national underwriter of reverse mortgages, however there are companies in Canada that offer other alternative products that may compete with the Bank, including a bank that started offering reverse mortgage in January 2018. It is also possible that at some time in the future, banks, other financial services companies or foreign held reverse mortgage providers may decide to enter the market in direct competition to the Bank. The Bank believes that it has established a defensible competitive advantage as a result of its low-cost funding, proprietary data, internally developed systems and its established brand recognition and marketing network.
Underwriting risk
Provided the homeowner is not in default, the right of the Bank to receive principal and interest when due under the reverse mortgage is limited to the realized value of the property. Underwriting risk is the potential for financial loss if the assets as currently reflected on the Bank’s balance sheet become impaired and not fully recoverable. In particular, this can result from a significant and persistent drop in real estate values and/or customers choosing not to repay their mortgages for an extended period of time. The Bank has developed reverse mortgage underwriting criteria which provide reasonable loan to value ratios for the homeowner while seeking to provide assurance that the value of the related property upon maturity will be sufficient to repay the reverse mortgage.
HomeEquity Bank Basel III Pillar 3 Disclosures December 31, 2018
7
Table 2/3. Capital Structure and Capital Adequacy
Objectives, policies and processes
The overall objective of capital management is to ensure that the Bank has sufficient capital to maintain its operations based on current activities and expected business developments in the future and to provide a return to its shareholder commensurate with the risk of the business. The Bank’s capital resources consist of equity and unsecured subordinated debt.
The Bank’s regulatory capital requirements are specified by OSFI guidelines. These requirements are consistent with the framework of risk- based capital standards developed by the BCBS and are referred to as Basel III. The Bank adopted certain Basel III capital requirements, as required by OSFI, beginning January 1, 2013. The transitional basis allows for the transition of certain capital deductions over a period ending January 1, 2018, whereas the all-in basis includes all applicable deductions immediately. Amounts not yet deducted from capital under OSFI’s transitional rules are risk weighted, creating a difference between risk-weighted assets on a transitional and on an all-in basis.
The primary impact of adoption was the deduction from Common Equity Tier 1 capital on an all-in basis at December 31, 2018 of $1,202 (December 31, 2017 - $893) related to intangible assets which included bank license costs and software, net of deferred taxes. The remaining regulatory adjustment relates to excess mortgage allowances which are applicable to both the all-in and transitional basis.
The Bank has implemented policies and procedures to monitor compliance with regulatory capital requirements. The Bank has implemented an Internal Capital Adequacy Assessment Process which is based on the Bank’s assessment of the business risks of the Bank. The Bank’s capital structure, risk-weighted assets, capital and leverage ratios, on the all-in and transitional basis are detailed in the tables below:
HomeEquity Bank Basel III Pillar 3 Disclosures December 31, 2018
8
Table 2/3. Capital structure and Capital Adequacy (continued)
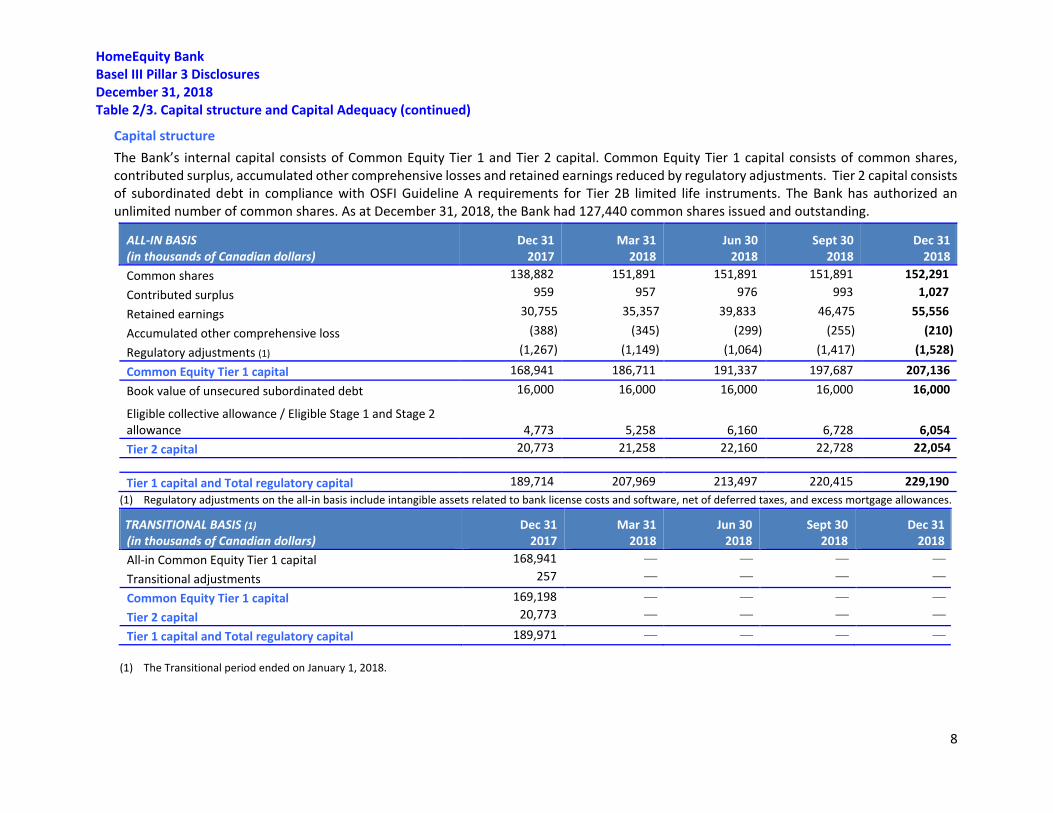
Capital structure The Bank’s internal capital consists of Common Equity Tier 1 and Tier 2 capital. Common Equity Tier 1 capital consists of common shares, contributed surplus, accumulated other comprehensive losses and retained earnings reduced by regulatory adjustments. Tier 2 capital consists of subordinated debt in compliance with OSFI Guideline A requirements for Tier 2B limited life instruments. The Bank has authorized an unlimited number of common shares. As at December 31, 2018, the Bank had 127,440 common shares issued and outstanding.
(1) Regulatory adjustments on the all-in basis include intangible assets related to bank license costs and software, net of deferred taxes, and excess mortgage allowances.
(1) The Transitional period ended on January 1, 2018.
ALL-IN BASIS (in thousands of Canadian dollars)
Dec 31 2017
Mar 31 2018
Jun 30 2018
Sept 30 2018
Dec 31 2018
Common shares 138,882 151,891 151,891 151,891 152,291 Contributed surplus 959 957 976 993 1,027
Retained earnings 30,755 35,357 39,833 46,475 55,556
Accumulated other comprehensive loss (388) (345) (299) (255) (210)
Regulatory adjustments (1) (1,267) (1,149) (1,064) (1,417) (1,528)
Common Equity Tier 1 capital 168,941 186,711 191,337 197,687 207,136 Book value of unsecured subordinated debt 16,000 16,000 16,000 16,000 16,000
Eligible collective allowance / Eligible Stage 1 and Stage 2 allowance 4,773 5,258 6,160 6,728 6,054 Tier 2 capital 20,773 21,258 22,160 22,728 22,054 Tier 1 capital and Total regulatory capital 189,714 207,969 213,497 220,415 229,190
TRANSITIONAL BASIS (1) (in thousands of Canadian dollars)
Dec 31 2017
Mar 31 2018
Jun 30 2018
Sept 30 2018
Dec 31 2018
All-in Common Equity Tier 1 capital 168,941
Transitional adjustments 257
Common Equity Tier 1 capital 169,198
Tier 2 capital 20,773
Tier 1 capital and Total regulatory capital 189,971
HomeEquity Bank Basel III Pillar 3 Disclosures December 31, 2018
9
Table 2/3. Capital structure and Capital Adequacy (continued)
Risk-weighted assets
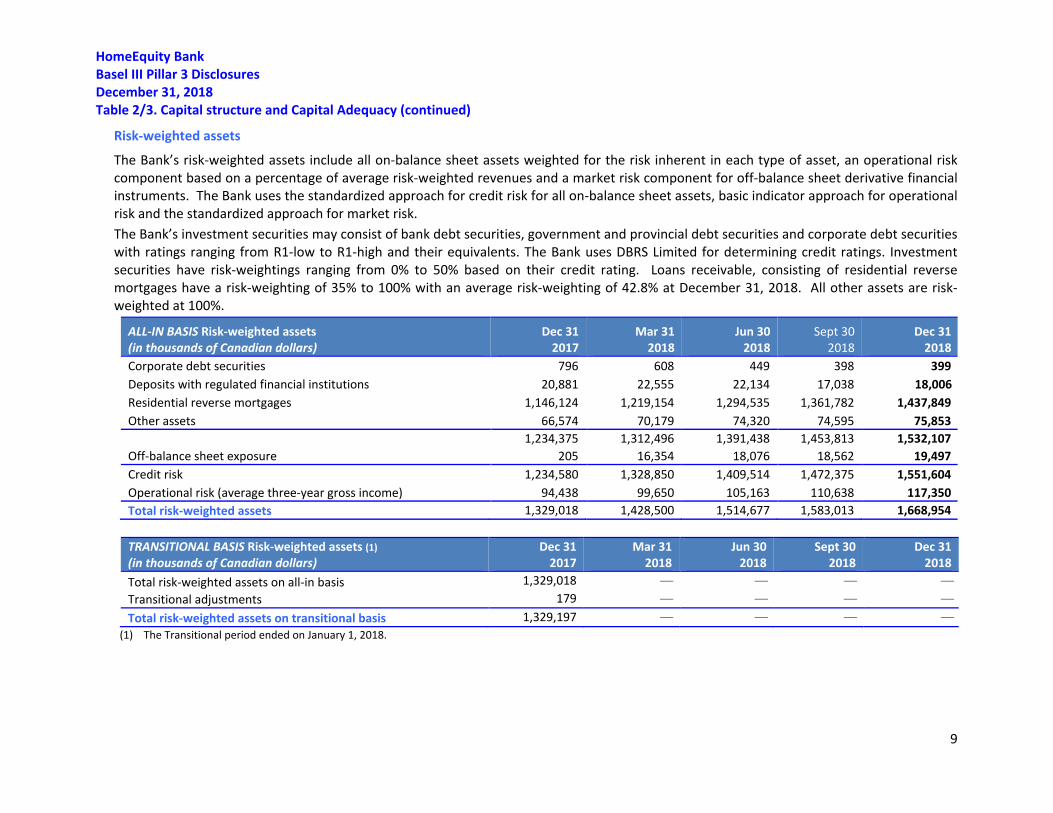
The Bank’s risk-weighted assets include all on-balance sheet assets weighted for the risk inherent in each type of asset, an operational risk component based on a percentage of average risk-weighted revenues and a market risk component for off-balance sheet derivative financial instruments. The Bank uses the standardized approach for credit risk for all on-balance sheet assets, basic indicator approach for operational risk and the standardized approach for market risk. The Bank’s investment securities may consist of bank debt securities, government and provincial debt securities and corporate debt securities with ratings ranging from R1-low to R1-high and their equivalents. The Bank uses DBRS Limited for determining credit ratings. Investment securities have risk-weightings ranging from 0% to 50% based on their credit rating. Loans receivable, consisting of residential reverse mortgages have a risk-weighting of 35% to 100% with an average risk-weighting of 42.8% at December 31, 2018. All other assets are risk-weighted at 100%.
ALL-IN BASIS Risk-weighted assets (in thousands of Canadian dollars)
Dec 31 2017
Mar 31 2018
Jun 30 2018
Sept 30 2018
Dec 31 2018
Corporate debt securities 796 608 449 398 399 Deposits with regulated financial institutions 20,881 22,555 22,134 17,038 18,006 Residential reverse mortgages 1,146,124 1,219,154 1,294,535 1,361,782 1,437,849 Other assets 66,574 70,179 74,320 74,595 75,853 1,234,375 1,312,496 1,391,438 1,453,813 1,532,107 Off-balance sheet exposure 205 16,354 18,076 18,562 19,497 Credit risk 1,234,580 1,328,850 1,409,514 1,472,375 1,551,604 Operational risk (average three-year gross income) 94,438 99,650 105,163 110,638 117,350 Total risk-weighted assets 1,329,018 1,428,500 1,514,677 1,583,013 1,668,954
(1) The Transitional period ended on January 1, 2018.
TRANSITIONAL BASIS Risk-weighted assets (1) (in thousands of Canadian dollars)
Dec 31 2017
Mar 31 2018
Jun 30 2018
Sept 30 2018
Dec 31 2018
Total risk-weighted assets on all-in basis 1,329,018 Transitional adjustments 179 Total risk-weighted assets on transitional basis 1,329,197
HomeEquity Bank Basel III Pillar 3 Disclosures December 31, 2018
10
Table 2/3. Capital structure and Capital Adequacy (continued)
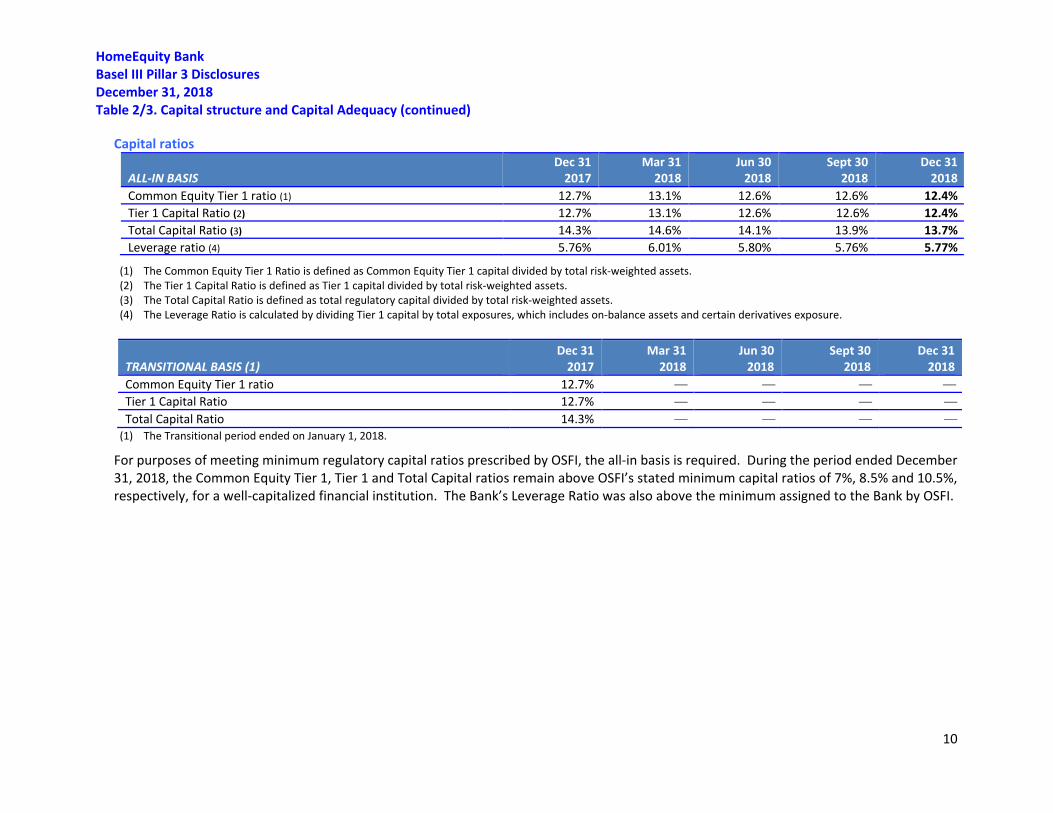
Capital ratios
ALL-IN BASIS Dec 31
2017 Mar 31
2018 Jun 30
2018 Sept 30
2018 Dec 31
2018 Common Equity Tier 1 ratio (1) 12.7% 13.1% 12.6% 12.6% 12.4% Tier 1 Capital Ratio (2) 12.7% 13.1% 12.6% 12.6%
12.4%
Total Capital Ratio (3) 14.3% 14.6% 14.1% 13.9% 13.7% Leverage ratio (4) 5.76% 6.01% 5.80% 5.76% 5.77%
(1) The Common Equity Tier 1 Ratio is defined as Common Equity Tier 1 capital divided by total risk-weighted assets. (2) The Tier 1 Capital Ratio is defined as Tier 1 capital divided by total risk-weighted assets. (3) The Total Capital Ratio is defined as total regulatory capital divided by total risk-weighted assets. (4) The Leverage Ratio is calculated by dividing Tier 1 capital by total exposures, which includes on-balance assets and certain derivatives exposure.
(1) The Transitional period ended on January 1, 2018.
For purposes of meeting minimum regulatory capital ratios prescribed by OSFI, the all-in basis is required. During the period ended December 31, 2018, the Common Equity Tier 1, Tier 1 and Total Capital ratios remain above OSFI’s stated minimum capital ratios of 7%, 8.5% and 10.5%, respectively, for a well-capitalized financial institution. The Bank’s Leverage Ratio was also above the minimum assigned to the Bank by OSFI.
TRANSITIONAL BASIS (1) Dec 31
2017 Mar 31
2018 Jun 30
2018 Sept 30
2018 Dec 31
2018 Common Equity Tier 1 ratio 12.7% Tier 1 Capital Ratio 12.7% Total Capital Ratio 14.3%
HomeEquity Bank Basel III Pillar 3 Disclosures December 31, 2018
11
Table 4/5. Credit risk – general disclosures for all banks
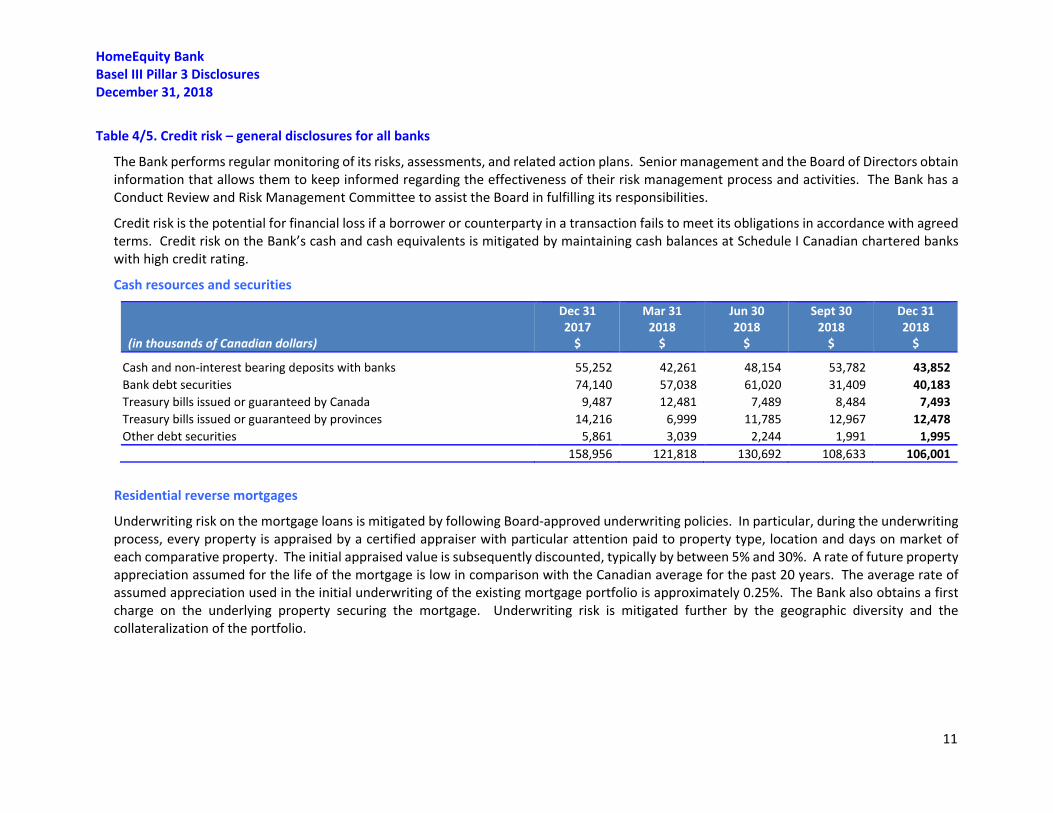
The Bank performs regular monitoring of its risks, assessments, and related action plans. Senior management and the Board of Directors obtain information that allows them to keep informed regarding the effectiveness of their risk management process and activities. The Bank has a Conduct Review and Risk Management Committee to assist the Board in fulfilling its responsibilities.
Credit risk is the potential for financial loss if a borrower or counterparty in a transaction fails to meet its obligations in accordance with agreed terms. Credit risk on the Bank’s cash and cash equivalents is mitigated by maintaining cash balances at Schedule I Canadian chartered banks with high credit rating.
Cash resources and securities
(in thousands of Canadian dollars)
Dec 31 2017
$
Mar 31 2018
$
Jun 30 2018
$
Sept 30 2018
$
Dec 31 2018
$
Cash and non-interest bearing deposits with banks 55,252 42,261 48,154 53,782 43,852 Bank debt securities 74,140 57,038 61,020 31,409 40,183 Treasury bills issued or guaranteed by Canada 9,487 12,481 7,489 8,484 7,493 Treasury bills issued or guaranteed by provinces 14,216 6,999 11,785 12,967 12,478 Other debt securities 5,861 3,039 2,244 1,991 1,995 158,956 121,818 130,692 108,633 106,001
Residential reverse mortgages
Underwriting risk on the mortgage loans is mitigated by following Board-approved underwriting policies. In particular, during the underwriting process, every property is appraised by a certified appraiser with particular attention paid to property type, location and days on market of each comparative property. The initial appraised value is subsequently discounted, typically by between 5% and 30%. A rate of future property appreciation assumed for the life of the mortgage is low in comparison with the Canadian average for the past 20 years. The average rate of assumed appreciation used in the initial underwriting of the existing mortgage portfolio is approximately 0.25%. The Bank also obtains a first charge on the underlying property securing the mortgage. Underwriting risk is mitigated further by the geographic diversity and the collateralization of the portfolio.
HomeEquity Bank Basel III Pillar 3 Disclosures December 31, 2018
12
Table 4/5. Credit risk – general disclosures for all banks (continued)
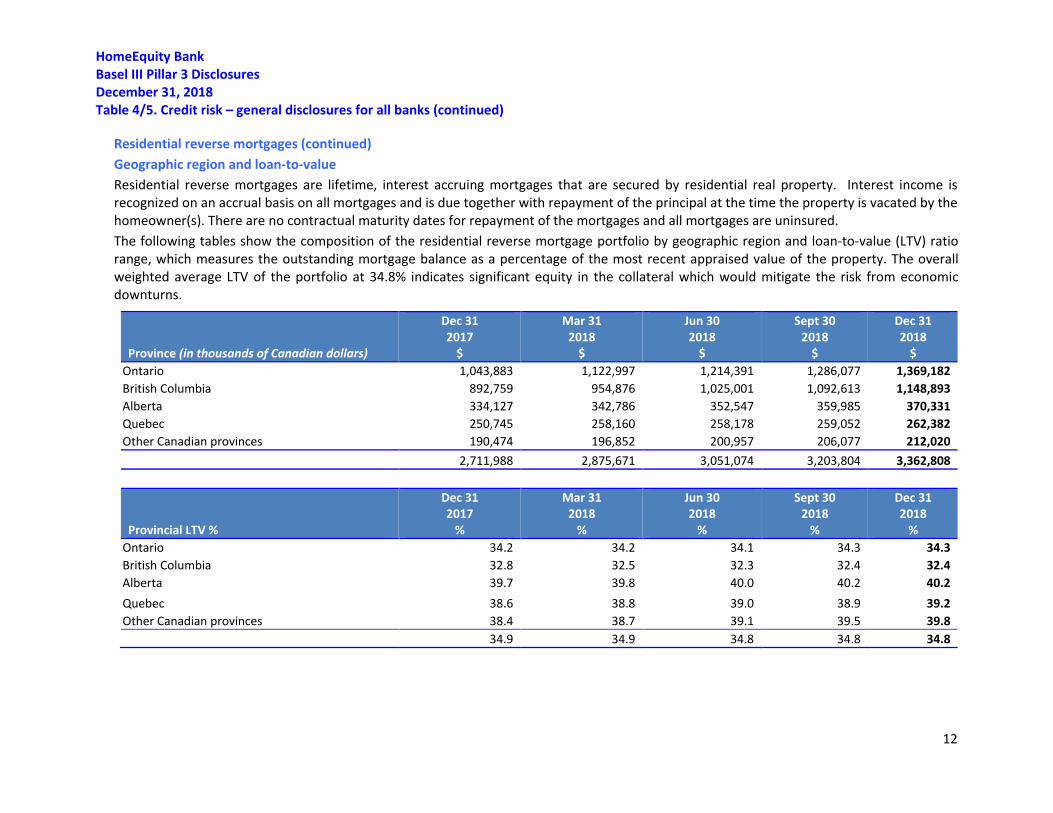
Residential reverse mortgages (continued) Geographic region and loan-to-value Residential reverse mortgages are lifetime, interest accruing mortgages that are secured by residential real property. Interest income is recognized on an accrual basis on all mortgages and is due together with repayment of the principal at the time the property is vacated by the homeowner(s). There are no contractual maturity dates for repayment of the mortgages and all mortgages are uninsured. The following tables show the composition of the residential reverse mortgage portfolio by geographic region and loan-to-value (LTV) ratio range, which measures the outstanding mortgage balance as a percentage of the most recent appraised value of the property. The overall weighted average LTV of the portfolio at 34.8% indicates significant equity in the collateral which would mitigate the risk from economic downturns.
Province (in thousands of Canadian dollars)
Dec 31 2017
$
Mar 31 2018
$
Jun 30 2018
$
Sept 30 2018
$
Dec 31 2018
$ Ontario 1,043,883 1,122,997 1,214,391 1,286,077 1,369,182 British Columbia 892,759 954,876 1,025,001 1,092,613 1,148,893 Alberta 334,127 342,786 352,547 359,985 370,331 Quebec 250,745 258,160 258,178 259,052 262,382 Other Canadian provinces 190,474 196,852 200,957 206,077 212,020 2,711,988 2,875,671 3,051,074 3,203,804 3,362,808
Provincial LTV %
Dec 31 2017
%
Mar 31 2018
%
Jun 30 2018
%
Sept 30 2018
%
Dec 31 2018
% Ontario 34.2 34.2 34.1 34.3 34.3 British Columbia 32.8 32.5 32.3 32.4 32.4 Alberta 39.7 39.8 40.0 40.2 40.2 Quebec 38.6 38.8 39.0 38.9 39.2 Other Canadian provinces 38.4 38.7 39.1 39.5 39.8 34.9 34.9 34.8 34.8 34.8
HomeEquity Bank Basel III Pillar 3 Disclosures December 31, 2018
13
Table 4/5. Credit risk – general disclosures for all banks (continued)
Residential reverse mortgages (continued)
Loan-to-value (in thousands of Canadian dollars)
Dec 31 2017
$
Mar 31 2018
$
Jun 30 2018
$
Sept 30 2018
$
Dec 31 2018
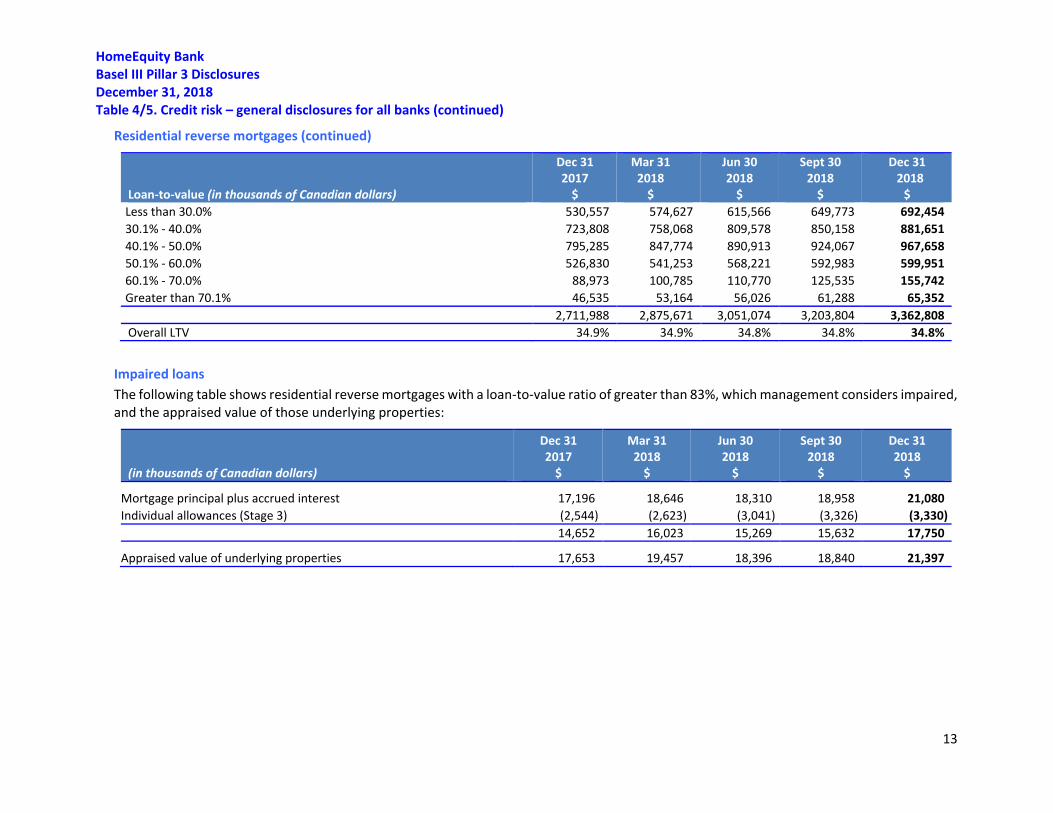
$ Less than 30.0% 530,557 574,627 615,566 649,773 692,454 30.1% - 40.0% 723,808 758,068 809,578 850,158 881,651 40.1% - 50.0% 795,285 847,774 890,913 924,067 967,658 50.1% - 60.0% 526,830 541,253 568,221 592,983 599,951 60.1% - 70.0% 88,973 100,785 110,770 125,535 155,742 Greater than 70.1% 46,535 53,164 56,026 61,288 65,352 2,711,988 2,875,671 3,051,074 3,203,804 3,362,808 Overall LTV 34.9% 34.9% 34.8% 34.8% 34.8%
Impaired loans The following table shows residential reverse mortgages with a loan-to-value ratio of greater than 83%, which management considers impaired, and the appraised value of those underlying properties:
(in thousands of Canadian dollars)
Dec 31 2017
$
Mar 31 2018
$
Jun 30 2018
$
Sept 30 2018
$
Dec 31 2018
$
Mortgage principal plus accrued interest 17,196 18,646 18,310 18,958 21,080 Individual allowances (Stage 3) (2,544) (2,623) (3,041) (3,326) (3,330)
14,652 16,023 15,269 15,632 17,750
Appraised value of underlying properties 17,653 19,457 18,396 18,840 21,397
HomeEquity Bank Basel III Pillar 3 Disclosures December 31, 2018
14
Table 4/5. Credit risk – general disclosures for all banks (continued)
Residential reverse mortgages (continued)
Expected Credit losses
Effective January 1, 2018, the Bank adopted IFRS 9, Financial Instruments which replaces the guidance in IAS 39, Financial Instruments: Recognition and Measurement (IAS 39). The impairment section of IFRS 9 introduces an expected credit loss (ECL) impairment model for all financial assets not measured at fair value through profit and loss (FVTPL). This replaces collective allowances under IAS 39. The ECL model contains a three-stage approach which is based on the change in credit quality of financial assets since initial recognition. Through its staging process, the model calculates the expected credit loss within the portfolio, which is the present value of projected future cash flow shortfalls. The Bank evaluates and monitors the underwriting performance indicators of mortgages as well as changes in the characteristics of the portfolio. These indicators include a review of general real estate conditions and trends and their potential impact on the portfolio, the expected occupancy term and interest rates experienced over the life of a mortgage compared to initial underwriting assumptions.
As reverse mortgages do not have similar credit risk as conventional mortgages, the risk of loss is based on the underlying collateral and the performance of the loan relative to the date of initial advance is measured by the mortgage loan-to-value (LTV). The Bank has determined that a significant increase in credit risk is based on the relative change in LTV. As LTV increases, the possibility of incurring a loss increases. The Bank will use the movement of LTV as a factor in determining the movement of stages between Stage 1 and Stage 2. The ECL allowance on the mortgage portfolio will be calculated on a mortgage by mortgage basis. The risk assessment staging determines the level of ECL that is to be recognized. If the mortgage balance exceeds the property value at any point in the future the excess is considered the lifetime loss. For Stage 3 loans, the Bank will continue to provide a reserve on any mortgage where the LTV exceeds 83%, similar to the previous methodology for individual allowances.
On IFRS 9 transition date, the Bank has an overall decrease to shareholders’ equity of $143 thousand attributable to the adoption of expected credit loss methodology
HomeEquity Bank Basel III Pillar 3 Disclosures December 31, 2018
15
Table 4/5. Credit risk – general disclosures for all banks (continued)
Residential reverse mortgages (continued)
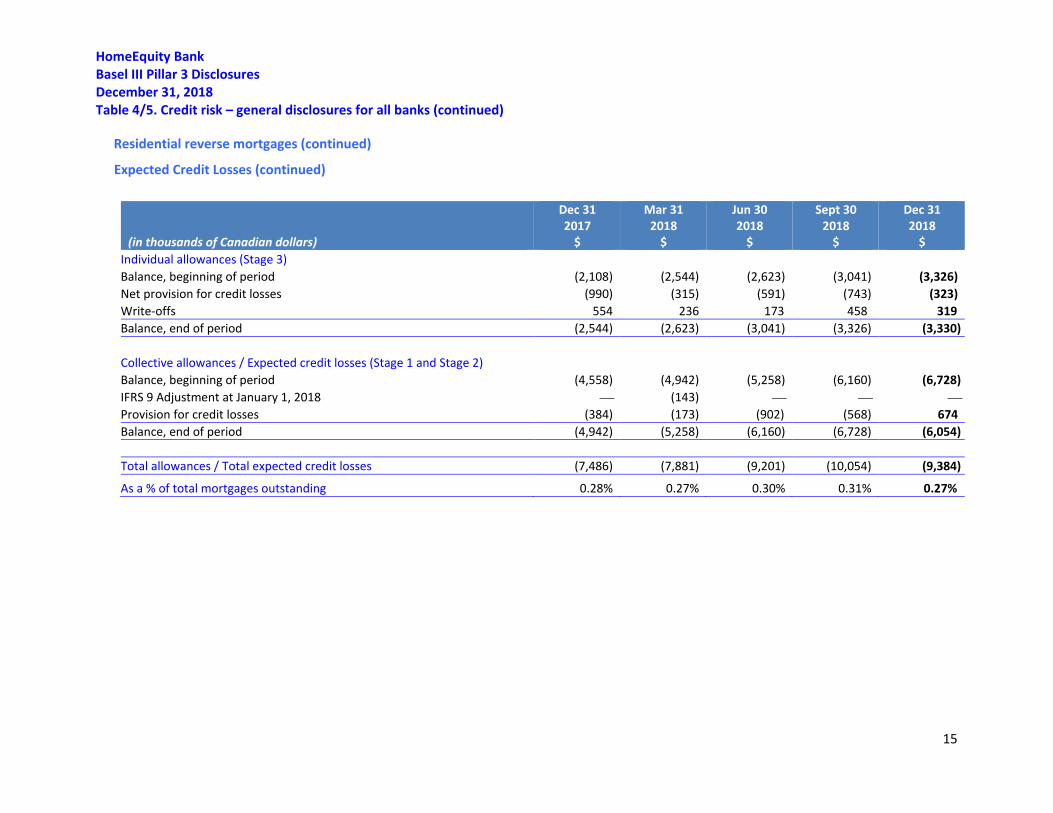
Expected Credit Losses (continued)
(in thousands of Canadian dollars)
Dec 31 2017
$
Mar 31 2018
$
Jun 30 2018
$
Sept 30 2018
$
Dec 31 2018
$ Individual allowances (Stage 3) Balance, beginning of period (2,108) (2,544) (2,623) (3,041) (3,326) Net provision for credit losses (990) (315) (591) (743) (323) Write-offs 554 236 173 458 319 Balance, end of period (2,544) (2,623) (3,041) (3,326) (3,330) Collective allowances / Expected credit losses (Stage 1 and Stage 2) Balance, beginning of period (4,558) (4,942) (5,258) (6,160) (6,728) IFRS 9 Adjustment at January 1, 2018 (143) Provision for credit losses (384) (173) (902) (568) 674 Balance, end of period (4,942) (5,258) (6,160) (6,728) (6,054)
Total allowances / Total expected credit losses (7,486) (7,881) (9,201) (10,054) (9,384)
As a % of total mortgages outstanding 0.28% 0.27% 0.30% 0.31% 0.27%

HomeEquity Bank Basel III Pillar 3 Disclosures December 31, 2018
16
TABLE 8. General disclosure for exposures related to counterparty credit risk
Derivative instruments
In the normal course of business, the Bank enters into interest rate derivative contracts to manage interest rate risk, following internal interest rate risk management policies. Derivative financial instruments are financial contracts that derive their value from underlying changes in interest rates or other financial measures.
Interest rate swaps are contracts in which two counterparties agree to exchange cash flows over a period of time based on rates applied to a specified notional principal amount. A typical interest rate swap would require one counterparty to pay interest based on a fixed rate and receive interest based on a variable market interest rate determined from time to time with both calculated on a specified notional principal amount. No exchange of principal amount takes place at inception.
A bond forward is a contractual obligation for the contract holder to purchase or sell a bond on a specified date at a predetermined price. The Bank uses bond forwards to hedge changes in future cash flows attributable to interest rate fluctuations arising on highly probable forecasted issuances of fixed-rate medium-term debt. No exchange of principal amount takes place at inception.
The Bank’s International Swaps and Derivatives Association agreements require a credit support obligation in the form of government issued securities under certain circumstances. As at December 31, 2018, the Bank has posted $3.5M as collateral.
Market risk
Derivative financial instruments have either no or an insignificant market value at inception. Their value changes in response to relevant interest rate, foreign exchange rate or credit price changes, such that the previously contracted terms of the derivative transactions have become more or less favourable than what can be negotiated under current market conditions for contracts with the same terms and the same remaining period to expiry. The potential for derivatives to increase or decrease in value as a result of the foregoing factors is generally referred to as market risk. This market risk exposure to earnings is mitigated as the Bank does not hold or use any derivative contracts for speculative trading purposes.
Credit risk
Credit risk on derivative financial instruments is the risk of a financial loss occurring as a result of a default of a counterparty on its obligation to the Bank. Credit risk is limited by dealing only with Schedule I Canadian chartered banks with high credit rating as counterparties. The maximum derivative credit exposure to the Bank is the fair value of derivative contracts presented in the summary table below.
HomeEquity Bank Basel III Pillar 3 Disclosures December 31, 2018
17
TABLE 8. General disclosure for exposures related to counterparty credit risk (continued)
(in thousands of Canadian dollars)
Dec 31 2017
$
Mar 31 2018
$
Jun 30 2018
$
Sept 30 2018
$
Dec 31 2018
$ Derivative financial instrument assets
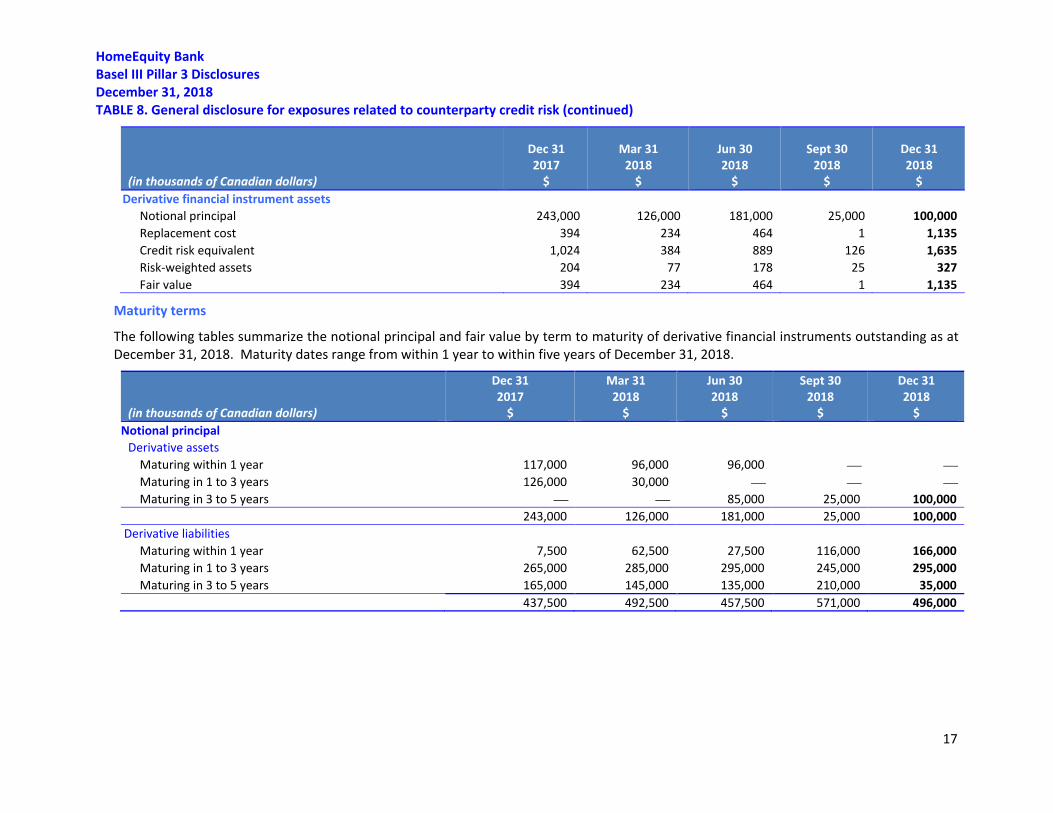
Notional principal 243,000 126,000 181,000 25,000 100,000 Replacement cost 394 234 464 1 1,135 Credit risk equivalent 1,024 384 889 126 1,635 Risk-weighted assets 204 77 178 25 327 Fair value 394 234 464 1 1,135
Maturity terms
The following tables summarize the notional principal and fair value by term to maturity of derivative financial instruments outstanding as at December 31, 2018. Maturity dates range from within 1 year to within five years of December 31, 2018.
(in thousands of Canadian dollars)
Dec 31 2017
$
Mar 31 2018
$
Jun 30 2018
$
Sept 30 2018
$
Dec 31 2018
$ Notional principal
Derivative assets Maturing within 1 year 117,000 96,000 96,000 Maturing in 1 to 3 years 126,000 30,000 Maturing in 3 to 5 years 85,000 25,000 100,000
243,000 126,000 181,000 25,000 100,000 Derivative liabilities
Maturing within 1 year 7,500 62,500 27,500 116,000 166,000 Maturing in 1 to 3 years 265,000 285,000 295,000 245,000 295,000 Maturing in 3 to 5 years 165,000 145,000 135,000 210,000 35,000
437,500 492,500 457,500 571,000 496,000
HomeEquity Bank Basel III Pillar 3 Disclosures December 31, 2018
18
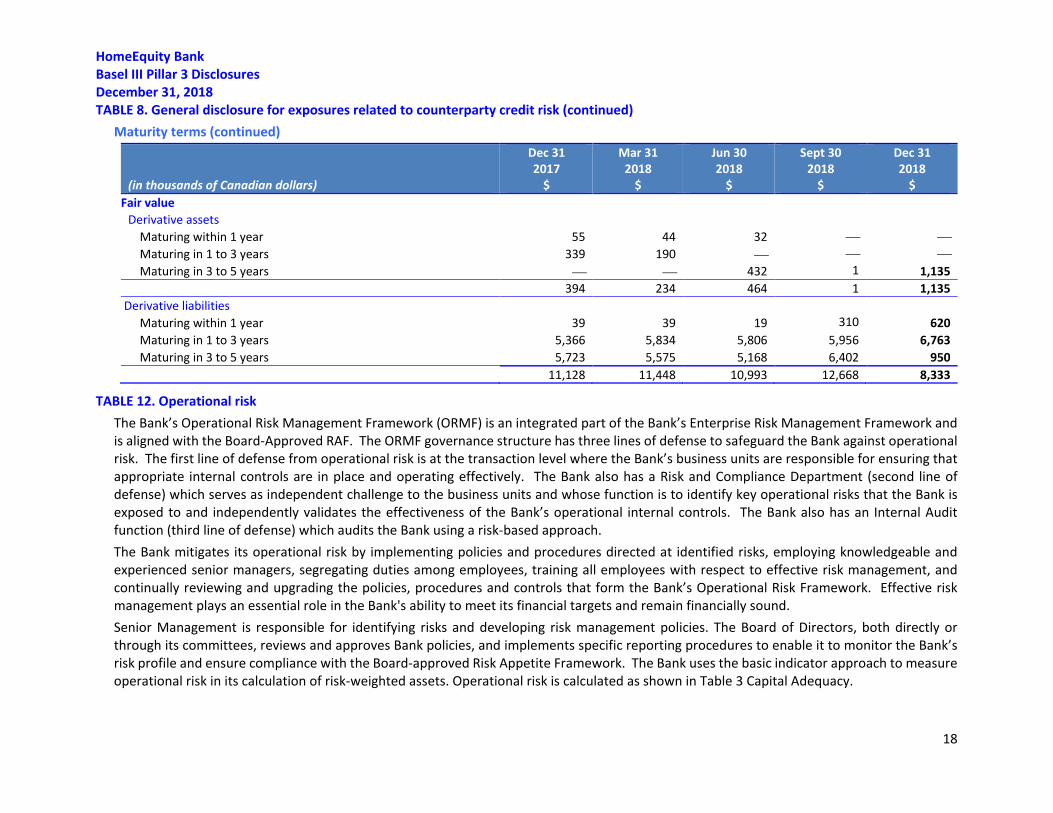
TABLE 8. General disclosure for exposures related to counterparty credit risk (continued) Maturity terms (continued)
(in thousands of Canadian dollars)
Dec 31 2017
$
Mar 31 2018
$
Jun 30 2018
$
Sept 30 2018
$
Dec 31 2018
$ Fair value
Derivative assets Maturing within 1 year 55 44 32 Maturing in 1 to 3 years 339 190 Maturing in 3 to 5 years 432 1
1,135
394 234 464 1 1,135 Derivative liabilities
Maturing within 1 year 39 39 19 310
620 Maturing in 1 to 3 years 5,366 5,834 5,806 5,956 6,763 Maturing in 3 to 5 years 5,723 5,575 5,168 6,402 950
11,128 11,448 10,993 12,668 8,333
TABLE 12. Operational risk The Bank’s Operational Risk Management Framework (ORMF) is an integrated part of the Bank’s Enterprise Risk Management Framework and is aligned with the Board-Approved RAF. The ORMF governance structure has three lines of defense to safeguard the Bank against operational risk. The first line of defense from operational risk is at the transaction level where the Bank’s business units are responsible for ensuring that appropriate internal controls are in place and operating effectively. The Bank also has a Risk and Compliance Department (second line of defense) which serves as independent challenge to the business units and whose function is to identify key operational risks that the Bank is exposed to and independently validates the effectiveness of the Bank’s operational internal controls. The Bank also has an Internal Audit function (third line of defense) which audits the Bank using a risk-based approach. The Bank mitigates its operational risk by implementing policies and procedures directed at identified risks, employing knowledgeable and experienced senior managers, segregating duties among employees, training all employees with respect to effective risk management, and continually reviewing and upgrading the policies, procedures and controls that form the Bank’s Operational Risk Framework. Effective risk management plays an essential role in the Bank's ability to meet its financial targets and remain financially sound. Senior Management is responsible for identifying risks and developing risk management policies. The Board of Directors, both directly or through its committees, reviews and approves Bank policies, and implements specific reporting procedures to enable it to monitor the Bank’s risk profile and ensure compliance with the Board-approved Risk Appetite Framework. The Bank uses the basic indicator approach to measure operational risk in its calculation of risk-weighted assets. Operational risk is calculated as shown in Table 3 Capital Adequacy.
HomeEquity Bank Basel III Pillar 3 Disclosures December 31, 2018
19
TABLE 14. Interest rate risk
Objectives, policies and processes
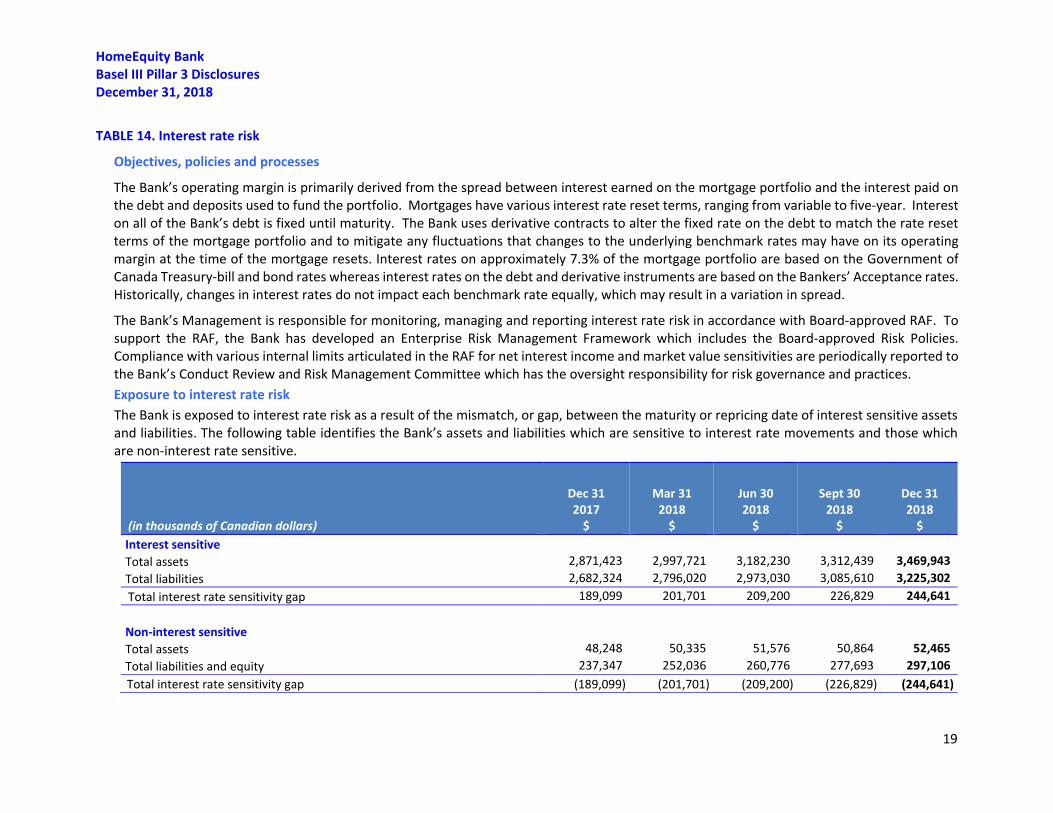
The Bank’s operating margin is primarily derived from the spread between interest earned on the mortgage portfolio and the interest paid on the debt and deposits used to fund the portfolio. Mortgages have various interest rate reset terms, ranging from variable to five-year. Interest on all of the Bank’s debt is fixed until maturity. The Bank uses derivative contracts to alter the fixed rate on the debt to match the rate reset terms of the mortgage portfolio and to mitigate any fluctuations that changes to the underlying benchmark rates may have on its operating margin at the time of the mortgage resets. Interest rates on approximately 7.3% of the mortgage portfolio are based on the Government of Canada Treasury-bill and bond rates whereas interest rates on the debt and derivative instruments are based on the Bankers’ Acceptance rates. Historically, changes in interest rates do not impact each benchmark rate equally, which may result in a variation in spread.
The Bank’s Management is responsible for monitoring, managing and reporting interest rate risk in accordance with Board-approved RAF. To support the RAF, the Bank has developed an Enterprise Risk Management Framework which includes the Board-approved Risk Policies. Compliance with various internal limits articulated in the RAF for net interest income and market value sensitivities are periodically reported to the Bank’s Conduct Review and Risk Management Committee which has the oversight responsibility for risk governance and practices. Exposure to interest rate risk The Bank is exposed to interest rate risk as a result of the mismatch, or gap, between the maturity or repricing date of interest sensitive assets and liabilities. The following table identifies the Bank’s assets and liabilities which are sensitive to interest rate movements and those which are non-interest rate sensitive.
(in thousands of Canadian dollars)
Dec 31 2017
$
Mar 31 2018
$
Jun 30 2018
$
Sept 30 2018
$
Dec 31 2018
$ Interest sensitive Total assets 2,871,423 2,997,721 3,182,230 3,312,439 3,469,943 Total liabilities 2,682,324 2,796,020 2,973,030 3,085,610 3,225,302 Total interest rate sensitivity gap 189,099 201,701 209,200 226,829 244,641 Non-interest sensitive Total assets 48,248 50,335 51,576 50,864 52,465 Total liabilities and equity 237,347 252,036 260,776 277,693 297,106 Total interest rate sensitivity gap (189,099) (201,701) (209,200) (226,829) (244,641)
HomeEquity Bank Basel III Pillar 3 Disclosures December 31, 2018
20
TABLE 14. Interest rate risk (continued)
Interest rate sensitivity
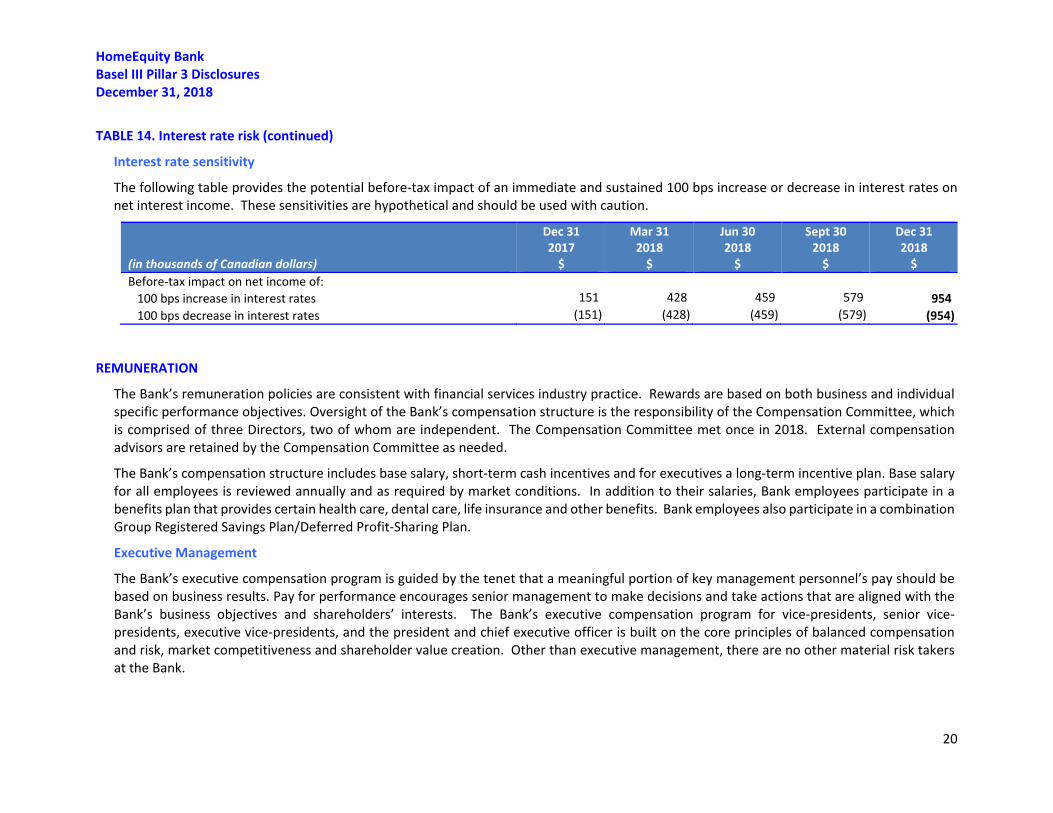
The following table provides the potential before-tax impact of an immediate and sustained 100 bps increase or decrease in interest rates on net interest income. These sensitivities are hypothetical and should be used with caution.
(in thousands of Canadian dollars)
Dec 31 2017
$
Mar 31 2018
$
Jun 30 2018
$
Sept 30 2018
$
Dec 31 2018
$ Before-tax impact on net income of: 100 bps increase in interest rates 151 428 459 579 954 100 bps decrease in interest rates (151) (428) (459) (579) (954)
REMUNERATION
The Bank’s remuneration policies are consistent with financial services industry practice. Rewards are based on both business and individual specific performance objectives. Oversight of the Bank’s compensation structure is the responsibility of the Compensation Committee, which is comprised of three Directors, two of whom are independent. The Compensation Committee met once in 2018. External compensation advisors are retained by the Compensation Committee as needed.
The Bank’s compensation structure includes base salary, short-term cash incentives and for executives a long-term incentive plan. Base salary for all employees is reviewed annually and as required by market conditions. In addition to their salaries, Bank employees participate in a benefits plan that provides certain health care, dental care, life insurance and other benefits. Bank employees also participate in a combination Group Registered Savings Plan/Deferred Profit-Sharing Plan.
Executive Management
The Bank’s executive compensation program is guided by the tenet that a meaningful portion of key management personnel’s pay should be based on business results. Pay for performance encourages senior management to make decisions and take actions that are aligned with the Bank’s business objectives and shareholders’ interests. The Bank’s executive compensation program for vice-presidents, senior vice-presidents, executive vice-presidents, and the president and chief executive officer is built on the core principles of balanced compensation and risk, market competitiveness and shareholder value creation. Other than executive management, there are no other material risk takers at the Bank.
HomeEquity Bank Basel III Pillar 3 Disclosures December 31, 2018
21
REMUNERATION (continued)
A measured approach to compensation is required. Incentives must drive the right behaviours within the Bank’s risk appetite. Incentive compensation plans must factor in risk, rewarding results that are achieved only within a defined risk tolerance. In order for the Bank to achieve its strategic goals it needs to attract, motivate and retain experienced talent and leadership. Compensation opportunities are to be competitive with similarly sized Canadian financial institutions. There must be a strong link between incentive compensation and long-term shareholder value creation. Management’s compensation opportunity must be tied to the achievement of objectives that create sustainable growth and long-term shareholder value. The salaries are set in reference to the executive’s level of responsibility, competitive market data, internal pay relationships and the individual’s proven capabilities. Every year the CEO makes a recommendation to the Compensation Committee for each executive’s base salary.
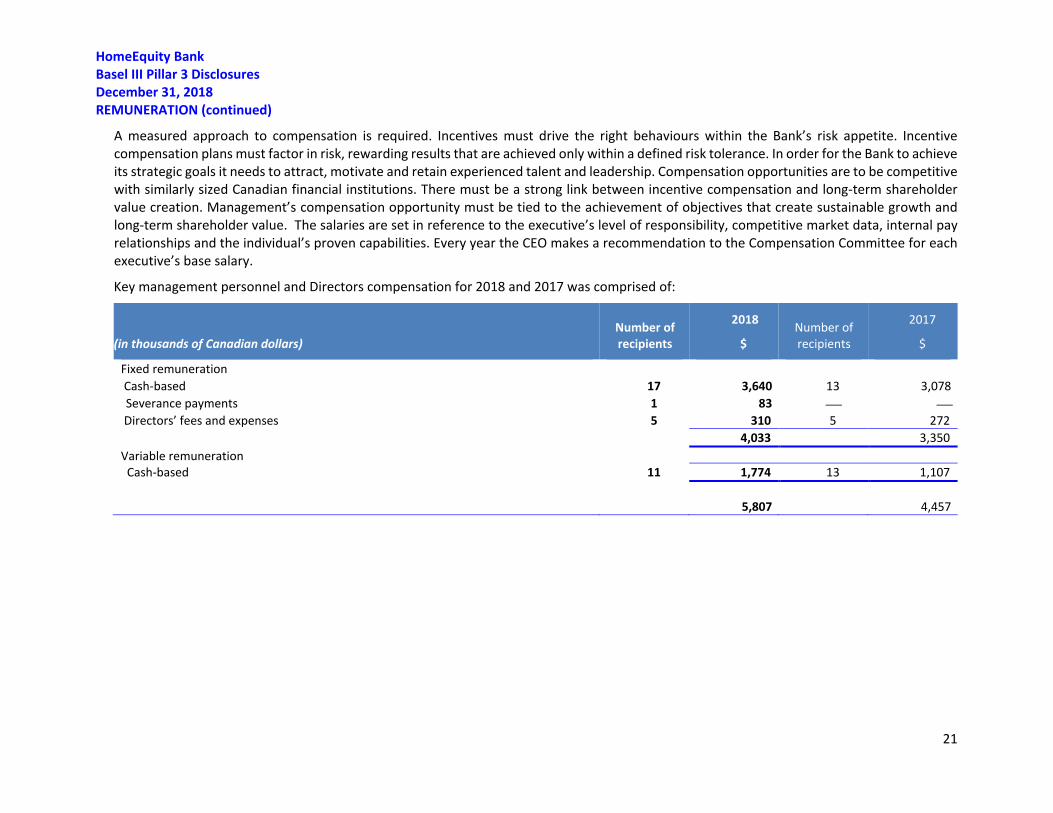
Key management personnel and Directors compensation for 2018 and 2017 was comprised of:
(in thousands of Canadian dollars) Number of recipients
2018
$ Number of recipients
2017
$
Fixed remuneration Cash-based 17 3,640 13 3,078 Severance payments 1 83
Directors’ fees and expenses 5 310 5 272 4,033 3,350
Variable remuneration Cash-based 11 1,774 13 1,107
5,807 4,457
HomeEquity Bank Basel III Pillar 3 Disclosures December 31, 2018
22
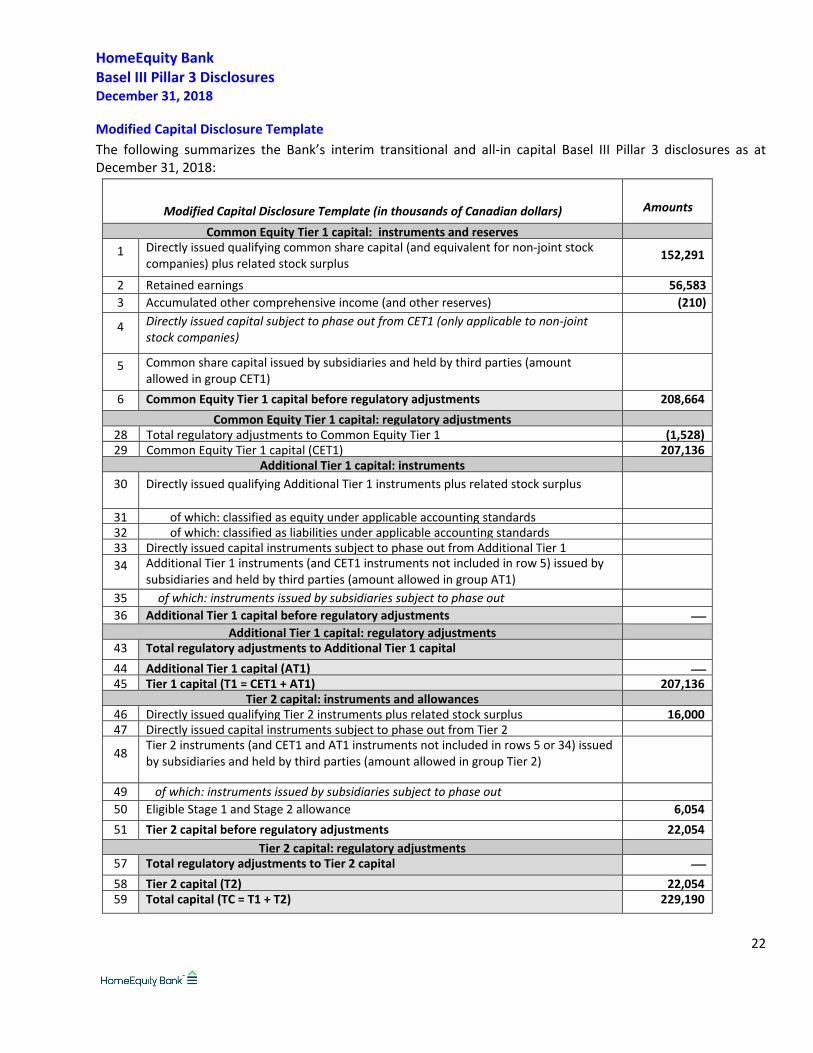
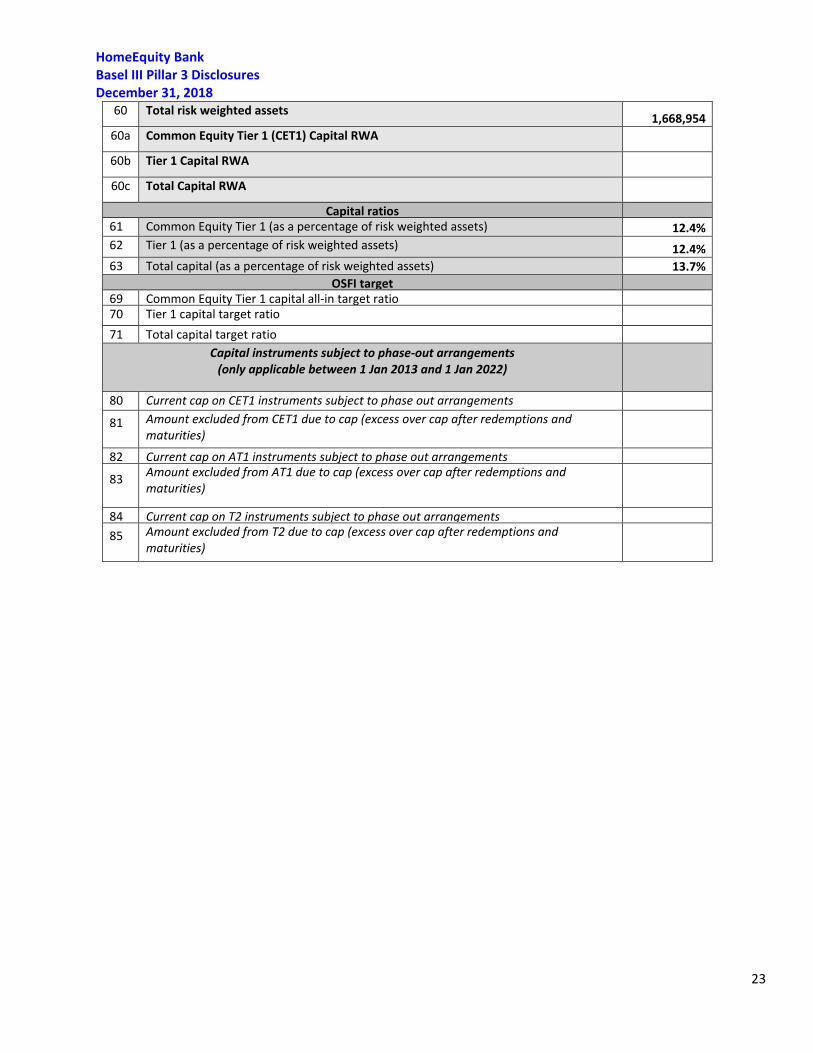
Modified Capital Disclosure Template The following summarizes the Bank’s interim transitional and all-in capital Basel III Pillar 3 disclosures as at December 31, 2018:
Modified Capital Disclosure Template (in thousands of Canadian dollars) Amounts
Common Equity Tier 1 capital: instruments and reserves 1 Directly issued qualifying common share capital (and equivalent for non-joint stock
companies) plus related stock surplus 152,291
2 Retained earnings 56,583 3 Accumulated other comprehensive income (and other reserves) (210)
4 Directly issued capital subject to phase out from CET1 (only applicable to non-joint stock companies)
5 Common share capital issued by subsidiaries and held by third parties (amount allowed in group CET1)
6 Common Equity Tier 1 capital before regulatory adjustments 208,664 Common Equity Tier 1 capital: regulatory adjustments
28 Total regulatory adjustments to Common Equity Tier 1 (1,528) 29 Common Equity Tier 1 capital (CET1) 207,136
Additional Tier 1 capital: instruments 30 Directly issued qualifying Additional Tier 1 instruments plus related stock surplus
31 of which: classified as equity under applicable accounting standards 32 of which: classified as liabilities under applicable accounting standards 33 Directly issued capital instruments subject to phase out from Additional Tier 1 34 Additional Tier 1 instruments (and CET1 instruments not included in row 5) issued by
subsidiaries and held by third parties (amount allowed in group AT1)
35 of which: instruments issued by subsidiaries subject to phase out 36 Additional Tier 1 capital before regulatory adjustments
Additional Tier 1 capital: regulatory adjustments 43 Total regulatory adjustments to Additional Tier 1 capital 44 Additional Tier 1 capital (AT1) 45 Tier 1 capital (T1 = CET1 + AT1) 207,136
Tier 2 capital: instruments and allowances 46 Directly issued qualifying Tier 2 instruments plus related stock surplus 16,000 47 Directly issued capital instruments subject to phase out from Tier 2
48 Tier 2 instruments (and CET1 and AT1 instruments not included in rows 5 or 34) issued by subsidiaries and held by third parties (amount allowed in group Tier 2)
49 of which: instruments issued by subsidiaries subject to phase out 50 Eligible Stage 1 and Stage 2 allowance 6,054 51 Tier 2 capital before regulatory adjustments 22,054
Tier 2 capital: regulatory adjustments 57 Total regulatory adjustments to Tier 2 capital 58 Tier 2 capital (T2) 22,054 59 Total capital (TC = T1 + T2) 229,190
HomeEquity Bank Basel III Pillar 3 Disclosures December 31, 2018
23
60 Total risk weighted assets 1,668,954 60a Common Equity Tier 1 (CET1) Capital RWA
60b
Tier 1 Capital RWA 60c Total Capital RWA
Capital ratios 61 Common Equity Tier 1 (as a percentage of risk weighted assets) 12.4% 62 Tier 1 (as a percentage of risk weighted assets) 12.4% 63 Total capital (as a percentage of risk weighted assets) 13.7%
OSFI target 69 Common Equity Tier 1 capital all-in target ratio 70 Tier 1 capital target ratio 71 Total capital target ratio
Capital instruments subject to phase-out arrangements (only applicable between 1 Jan 2013 and 1 Jan 2022)
80 Current cap on CET1 instruments subject to phase out arrangements
81 Amount excluded from CET1 due to cap (excess over cap after redemptions and maturities)
82 Current cap on AT1 instruments subject to phase out arrangements
83 Amount excluded from AT1 due to cap (excess over cap after redemptions and maturities)
84 Current cap on T2 instruments subject to phase out arrangements 85 Amount excluded from T2 due to cap (excess over cap after redemptions and
maturities)
HomeEquity Bank Basel III Pillar 3 Disclosures December 31, 2018
24
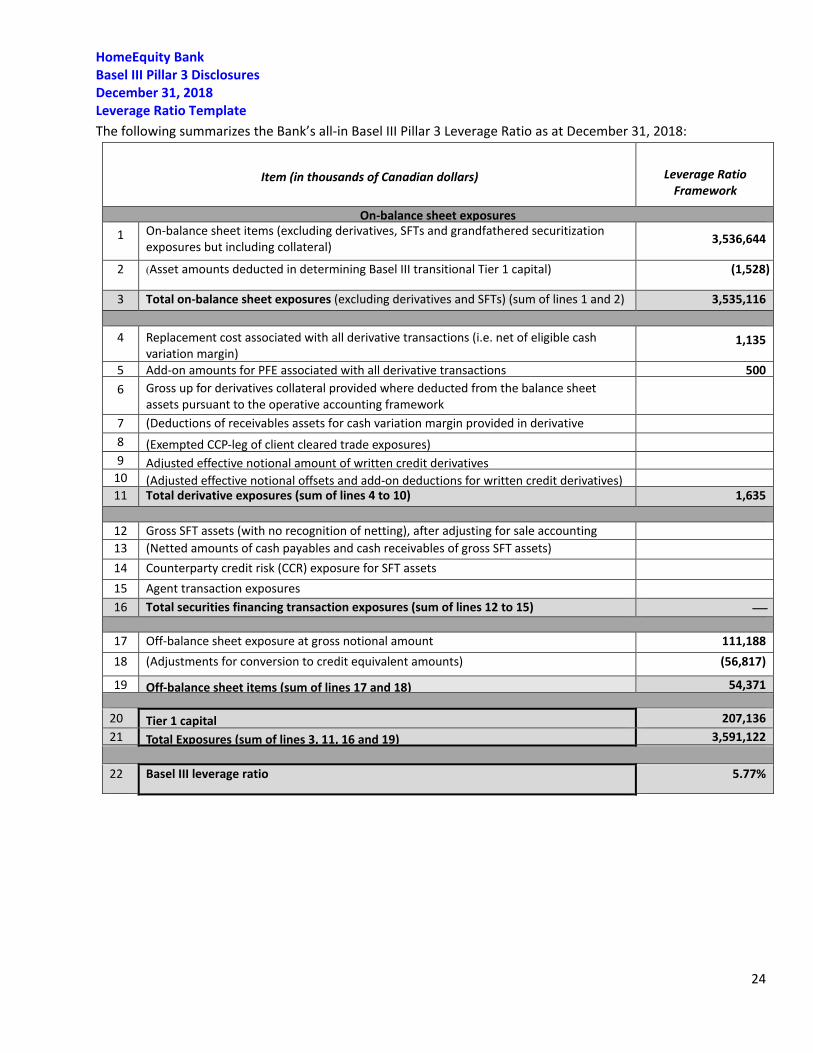
Leverage Ratio Template The following summarizes the Bank’s all-in Basel III Pillar 3 Leverage Ratio as at December 31, 2018:
Item (in thousands of Canadian dollars) Leverage Ratio Framework
On-balance sheet exposures 1 On-balance sheet items (excluding derivatives, SFTs and grandfathered securitization
exposures but including collateral) 3,536,644
2 (Asset amounts deducted in determining Basel III transitional Tier 1 capital) (1,528)
3 Total on-balance sheet exposures (excluding derivatives and SFTs) (sum of lines 1 and 2) 3,535,116
4 Replacement cost associated with all derivative transactions (i.e. net of eligible cash variation margin)
1,135
5 Add-on amounts for PFE associated with all derivative transactions 500 6 Gross up for derivatives collateral provided where deducted from the balance sheet
assets pursuant to the operative accounting framework
7 (Deductions of receivables assets for cash variation margin provided in derivative
8 (Exempted CCP-leg of client cleared trade exposures) 9
Adjusted effective notional amount of written credit derivatives 10 (Adjusted effective notional offsets and add-on deductions for written credit derivatives) 11 Total derivative exposures (sum of lines 4 to 10) 1,635
12 Gross SFT assets (with no recognition of netting), after adjusting for sale accounting
13 (Netted amounts of cash payables and cash receivables of gross SFT assets) 14 Counterparty credit risk (CCR) exposure for SFT assets 15 Agent transaction exposures 16 Total securities financing transaction exposures (sum of lines 12 to 15)
17 Off-balance sheet exposure at gross notional amount 111,188 18 (Adjustments for conversion to credit equivalent amounts) (56,817)
19 Off-balance sheet items (sum of lines 17 and 18) 54,371
20 Tier 1 capital 207,136 21 Total Exposures (sum of lines 3, 11, 16 and 19) 3,591,122
22 Basel III leverage ratio 5.77%