Embed Size (px)
Citation preview

Basel IIIPillar 3Capital Adequacy and RiskDisclosures as at 31 March 2019

Commonwealth Bank of Australia | ACN 123 123 124 | 13 May 2019

Commonwealth Bank of Australia – Pillar 3 Report 1
Table of Contents
1 Introduction 2
2 Risk Weighted Assets 3
3 Credit Risk 4
3.1 Credit Risk Exposures 4
3.2 Past Due and Impaired Exposures, Provisions and Reserves 6
3.3 Securitisation 8
4 Leverage Ratio 9
5 Liquidity Risk 10
6 Glossary 11
For further information contact:
Investor Relations
Melanie Kirk
Phone: 02 9118 7113
Email: [email protected]

Introduction
2 Commonwealth Bank of Australia – Pillar 3 Report
1. Introduction
The Commonwealth Bank of Australia (the Group) is an
Authorised Deposit-taking Institution (ADI) regulated by the
Australian Prudential Regulation Authority (APRA) under
the authority of the Banking Act 1959.
This document is prepared in accordance with Board
approved policy and quarterly reporting requirements set
out in APRA’s prudential standard APS 330 “Public
Disclosure”. It presents information on the Group’s capital
adequacy and Risk Weighted Assets (RWA) calculations
for credit risk including securitisation, market risk, Interest
Rate Risk in the Banking Book (IRRBB) and operational
risk.
This document also presents information on the Group’s
leverage and liquidity ratios in accordance with prescribed
methodologies.
The Group is required to report its assessment of capital
adequacy on a Level 2 basis. Level 2 is defined as the
consolidated banking group excluding the insurance and
funds management businesses and entities through which
securitisation of Group assets are conducted.
The Group is predominantly accredited to use the
Advanced Internal Ratings Based (AIRB) approach for
credit risk and Advanced Measurement Approach (AMA)
for operational risk. The Group is also required to assess its
traded market risk and IRRBB requirement under Pillar 1 of
the Basel capital framework.
This document is unaudited, however, it has been prepared
consistent with information that has been subject to review
by an external auditor and published elsewhere or has
been supplied to APRA.
The external auditor (PwC) performed certain procedures
over the Pillar 3 report for the half year ended December
2018, including verifying disclosures are consistent with
information contained in the Group’s Profit Announcement,
returns provided to APRA and source systems. PwC have
provided recommendations to enhance the internal controls
related to the calculation of RWA and the Group has an
action plan in place to implement these recommendations.
The Group’s Pillar 3 documents are available on the
Group’s corporate website:
www.commbank.com.au/investors
Group Capital Ratios
As at 31 March 2019, the Group’s Basel III Common Equity
Tier 1 (CET1), Tier 1 and Total Capital ratios, as measured
on an APRA basis, were 10.3%, 12.4% and 15.3%
respectively.
The Group’s Basel III internationally comparable CET1 ratio
as at 31 March 2019 was 15.8%, compared to 16.5% at
31 December 2018.
After allowing for the 80 basis points impact of the 2019
interim dividend (which included the on-market purchase of
shares in respect of the dividend reinvestment plan (DRP)),
CET1 increased 30 basis points in the quarter with capital
generated from earnings partially offset by higher total
RWA. Full details on the movement in RWA are provided
on page 3.
Capital Initiatives
During the quarter the DRP in respect of the 2019 interim
dividend was satisfied in full by the on-market purchase of
shares. The participation rate for the DRP was 16.7%.
Leverage Ratio
The Group’s Leverage Ratio, which is defined as Tier 1
Capital as a percentage of total exposures was 5.4% at
31 March 2019 on an APRA basis and 6.2% on an
internationally comparable basis.
Liquidity Coverage Ratio
The Liquidity Coverage Ratio (LCR) requires Australian
ADIs to hold sufficient liquid assets to meet 30 day net cash
outflows projected under an APRA-prescribed stress
scenario. The Group maintained an average LCR of 134%
in the March 2019 quarter.
31 Mar 19 31 Dec 18
Summary Group Capital Adequacy Ratios (Level 2) % %
Common Equity Tier 1 10. 3 10. 8
Tier 1 12. 4 12. 9
Tier 2 2. 9 2. 9
Total Capital (APRA) 15. 3 15. 8
Common Equity Tier 1 (Internationally Comparable) (1) 15. 8 16. 5
(1) Analysis aligns with the 13 July 2015 APRA study titled “International capital comparison study”.
Risk Weighted Assets
Commonwealth Bank of Australia – Pillar 3 Report 3
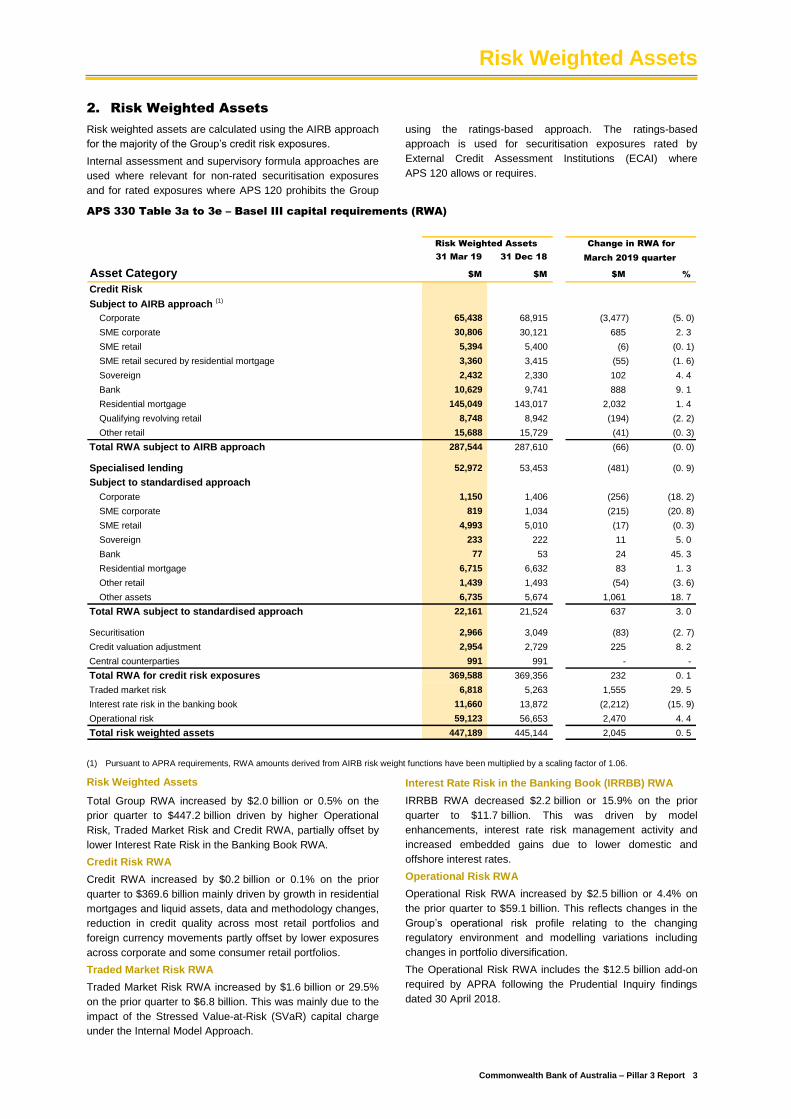
2. Risk Weighted Assets
Risk weighted assets are calculated using the AIRB approach
for the majority of the Group’s credit risk exposures.
Internal assessment and supervisory formula approaches are
used where relevant for non-rated securitisation exposures
and for rated exposures where APS 120 prohibits the Group
using the ratings-based approach. The ratings-based
approach is used for securitisation exposures rated by
External Credit Assessment Institutions (ECAI) where
APS 120 allows or requires.
APS 330 Table 3a to 3e – Basel III capital requirements (RWA)
31 Mar 19 31 Dec 18
Asset Category $M $M $M %
Credit Risk
Subject to AIRB approach (1)
Corporate 65,438 68,915 (3,477) (5. 0)
SME corporate 30,806 30,121 685 2. 3
SME retail 5,394 5,400 (6) (0. 1)
SME retail secured by residential mortgage 3,360 3,415 (55) (1. 6)
Sovereign 2,432 2,330 102 4. 4
Bank 10,629 9,741 888 9. 1
Residential mortgage 145,049 143,017 2,032 1. 4
Qualifying revolving retail 8,748 8,942 (194) (2. 2)
Other retail 15,688 15,729 (41) (0. 3)
Total RWA subject to AIRB approach 287,544 287,610 (66) (0. 0)
Specialised lending 52,972 53,453 (481) (0. 9)
Subject to standardised approach
Corporate 1,150 1,406 (256) (18. 2)
SME corporate 819 1,034 (215) (20. 8)
SME retail 4,993 5,010 (17) (0. 3)
Sovereign 233 222 11 5. 0
Bank 77 53 24 45. 3
Residential mortgage 6,715 6,632 83 1. 3
Other retail 1,439 1,493 (54) (3. 6)
Other assets 6,735 5,674 1,061 18. 7
Total RWA subject to standardised approach 22,161 21,524 637 3. 0
Securitisation 2,966 3,049 (83) (2. 7)
Credit valuation adjustment 2,954 2,729 225 8. 2
Central counterparties 991 991 - -
Total RWA for credit risk exposures 369,588 369,356 232 0. 1
Traded market risk 6,818 5,263 1,555 29. 5
Interest rate risk in the banking book 11,660 13,872 (2,212) (15. 9)
Operational risk 59,123 56,653 2,470 4. 4
Total risk weighted assets 447,189 445,144 2,045 0. 5
March 2019 quarter
Change in RWA forRisk Weighted Assets
(1) Pursuant to APRA requirements, RWA amounts derived from AIRB risk weight functions have been multiplied by a scaling factor of 1.06.
Risk Weighted Assets
Total Group RWA increased by $2.0 billion or 0.5% on the
prior quarter to $447.2 billion driven by higher Operational
Risk, Traded Market Risk and Credit RWA, partially offset by
lower Interest Rate Risk in the Banking Book RWA.
Credit Risk RWA
Credit RWA increased by $0.2 billion or 0.1% on the prior
quarter to $369.6 billion mainly driven by growth in residential
mortgages and liquid assets, data and methodology changes,
reduction in credit quality across most retail portfolios and
foreign currency movements partly offset by lower exposures
across corporate and some consumer retail portfolios.
Traded Market Risk RWA
Traded Market Risk RWA increased by $1.6 billion or 29.5%
on the prior quarter to $6.8 billion. This was mainly due to the
impact of the Stressed Value-at-Risk (SVaR) capital charge
under the Internal Model Approach.
Interest Rate Risk in the Banking Book (IRRBB) RWA
IRRBB RWA decreased $2.2 billion or 15.9% on the prior
quarter to $11.7 billion. This was driven by model
enhancements, interest rate risk management activity and
increased embedded gains due to lower domestic and
offshore interest rates.
Operational Risk RWA
Operational Risk RWA increased by $2.5 billion or 4.4% on
the prior quarter to $59.1 billion. This reflects changes in the
Group’s operational risk profile relating to the changing
regulatory environment and modelling variations including
changes in portfolio diversification.
The Operational Risk RWA includes the $12.5 billion add-on
required by APRA following the Prudential Inquiry findings
dated 30 April 2018.

Credit Risk
4 Commonwealth Bank of Australia – Pillar 3 Report
3. Credit Risk
3.1 Credit Risk Exposures
The following tables detail credit risk exposures subject to AIRB and Standardised approaches.
APS 330 Table 4a – Credit risk exposures by portfolio type and modelling approach
Average
On Non- exposure Change in exposure
balance market Market for March for March
sheet related related Total 2019 quarter (1)
2019 quarter (2)
Portfolio Type $M $M $M $M $M $M %
Subject to AIRB approach
Corporate 69,620 42,914 6,618 119,152 122,026 (5,749) (4. 6)
SME corporate 43,128 8,558 348 52,034 51,715 639 1. 2
SME retail 7,468 3,540 - 11,008 11,124 (233) (2. 1)
SME retail secured by residential mortgage 4,339 1,482 - 5,821 5,866 (89) (1. 5)
Sovereign 90,745 1,080 2,166 93,991 92,398 3,184 3. 5
Bank 26,932 1,398 9,010 37,340 35,750 3,181 9. 3
Residential mortgage 500,020 71,360 - 571,380 569,367 4,026 0. 7
Qualifying revolving retail 10,404 17,480 - 27,884 28,092 (415) (1. 5)
Other retail 8,094 3,102 - 11,196 11,228 (64) (0. 6)
Total AIRB approach 760,750 150,914 18,142 929,806 927,566 4,480 0. 5
Specialised lending 51,778 8,014 720 60,512 60,726 (429) (0. 7)
Subject to standardised approach
Corporate 961 147 39 1,147 1,285 (276) (19. 4)
SME corporate 650 168 - 818 926 (216) (20. 9)
SME retail 4,272 674 37 4,983 4,992 (17) (0. 3)
Sovereign 498 11 - 509 500 18 3. 7
Bank 333 2 1 336 295 82 32. 3
Residential mortgage 12,688 2,008 - 14,696 14,608 175 1. 2
Other retail 1,339 100 - 1,439 1,466 (53) (3. 6)
Other assets 12,925 - - 12,925 12,151 1,547 13. 6
Central counterparties - - 7,242 7,242 7,255 (25) (0. 3)
Total standardised approach 33,666 3,110 7,319 44,095 43,478 1,235 2. 9
Total credit exposures (3) 846,194 162,038 26,181 1,034,413 1,031,770 5,286 0. 5
Off balance sheet
31 March 2019
(1) The simple average of exposures as at 31 March 2019 and 31 December 2018.
(2) The difference between exposures as at 31 March 2019 and 31 December 2018.
(3) Total credit risk exposures (calculated as EAD) do not include equities or securitisation exposures.

Credit Risk
Commonwealth Bank of Australia – Pillar 3 Report 5
3.1 Credit Risk Exposures (continued)
APS 330 Table 4a – Credit risk exposures by portfolio type and modelling approach (continued)
Average
On Non- exposure
balance market Market for December for December
sheet related related Total 2018 quarter (1)
2018 quarter (2)
Portfolio Type $M $M $M $M $M $M %
Subject to AIRB approach
Corporate 73,335 44,040 7,526 124,901 124,268 1,266 1. 0
SME corporate 42,768 8,382 245 51,395 52,453 (2,115) (4. 0)
SME retail 7,669 3,572 - 11,241 10,741 1,001 9. 8
SME retail secured by residential mortgage 4,390 1,520 - 5,910 5,661 498 9. 2
Sovereign 87,303 1,324 2,180 90,807 89,147 3,320 3. 8
Bank 23,909 1,413 8,837 34,159 36,589 (4,861) (12. 5)
Residential mortgage 496,270 71,084 - 567,354 564,313 6,080 1. 1
Qualifying revolving retail 10,533 17,766 - 28,299 28,450 (301) (1. 1)
Other retail 8,152 3,108 - 11,260 11,237 46 0. 4
Total AIRB approach 754,329 152,209 18,788 925,326 922,859 4,934 0. 5
Specialised lending 51,743 8,597 601 60,941 61,187 (492) (0. 8)
Subject to standardised approach
Corporate 1,073 308 42 1,423 1,327 193 15. 7
SME corporate 756 278 - 1,034 690 689 199. 7
SME retail 4,223 742 35 5,000 5,426 (854) (14. 6)
Sovereign 491 - - 491 493 (3) (0. 6)
Bank 251 2 1 254 217 75 41. 9
Residential mortgage 12,453 2,068 - 14,521 13,940 1,160 8. 7
Other retail 1,388 104 - 1,492 1,504 (24) (1. 6)
Other assets 11,378 - - 11,378 11,168 421 3. 8
Central counterparties - - 7,267 7,267 7,191 152 2. 1
Total standardised approach 32,013 3,502 7,345 42,860 41,956 1,809 4.4
Total credit exposures (3) 838,085 164,308 26,734 1,029,127 1,026,002 6,251 0.6
Change in exposure
31 December 2018
Off balance sheet
(1) The simple average of exposures as at 31 December 2018 and 30 September 2018.
(2) The difference between exposures as at 31 December 2018 and 30 September 2018.
(3) Total credit risk exposures (calculated as EAD) do not include equities or securitisation exposures.

Credit Risk
Commonwealth Bank of Australia – Pillar 3 Report
3.2 Past Due and Impaired Exposures, Provisions and Reserves
All provisions for impairment assessed on an individual basis in accordance with the Australian Accounting Standards are
classified as specific provisions in accordance with APS 220 “Credit Quality”. Most of the collective provisions raised under the
Australian Accounting Standards are included in the General Reserve for Credit Losses (GRCL), however, certain collective
provisions not eligible for inclusion in the GRCL are classified as specific provisions. This includes, for example, collective
provisions on retail products that are in default.
Reconciliation of Australian Accounting Standards, APS 220 based credit provisions and APS 330 Table
4c – General reserve for credit losses
General
reserve for Specific Total
credit losses(1)
provision(1)
provisions
$M $M $M
Collective provision (2) 3,468 400 3,868
Individual provisions (2) - 962 962
Total provisions 3,468 1,362 4,830
Additional GRCL requirement (3) 518 - 518
Total regulatory provisions 3,986 1,362 5,348
31 March 2019
(1) Provisions classified according to APS 220 “Credit Quality”.
(2) Provisions according to the Australian Accounting Standards.
(3) The Group has recognised a deduction from CET1 of $518 million in order to maintain the required minimum GRCL.
31 December 2018
General
reserve for Specific Total
credit losses(1)
provision(1)
provisions
$M $M $M
Collective provision (2) 3,453 361 3,814
Individual provisions (2) - 920 920
Total provisions 3,453 1,281 4,734
Additional GRCL requirement (3) 539 - 539
Total regulatory provisions 3,992 1,281 5,273
(1) Provisions classified according to APS 220 “Credit Quality”.
(2) Provisions according to the Australian Accounting Standards.
(3) The Group has recognised a deduction from CET1 of $539 million in order to maintain the required minimum GRCL.
6
Credit Risk
Commonwealth Bank of Australia – Pillar 3 Report 7
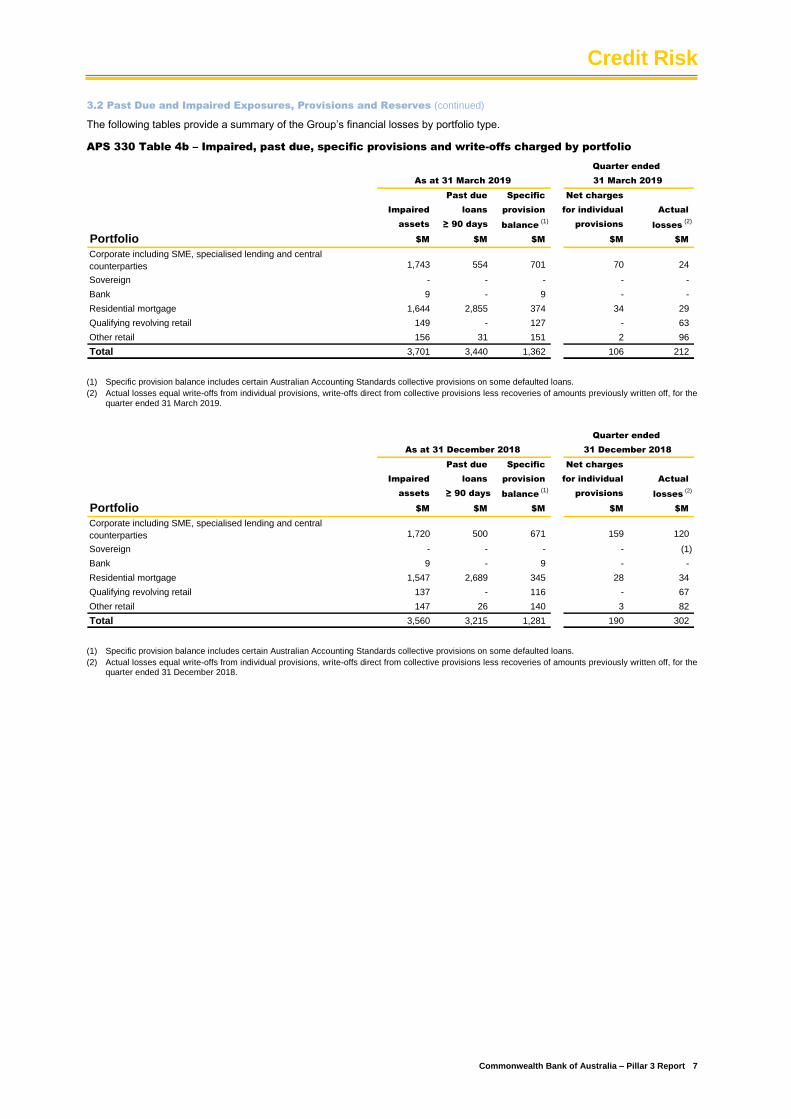
3.2 Past Due and Impaired Exposures, Provisions and Reserves (continued)
The following tables provide a summary of the Group’s financial losses by portfolio type.
APS 330 Table 4b – Impaired, past due, specific provisions and write-offs charged by portfolio
Past due Specific Net charges
Impaired loans provision for individual Actual
assets ≥ 90 days balance (1)
provisions losses(2)
Portfolio $M $M $M $M $M
Corporate including SME, specialised lending and central
counterparties 1,743 554 701 70 24
Sovereign - - - - -
Bank 9 - 9 - -
Residential mortgage 1,644 2,855 374 34 29
Qualifying revolving retail 149 - 127 - 63
Other retail 156 31 151 2 96
Total 3,701 3,440 1,362 106 212
Quarter ended
As at 31 March 2019 31 March 2019
(1) Specific provision balance includes certain Australian Accounting Standards collective provisions on some defaulted loans.
(2) Actual losses equal write-offs from individual provisions, write-offs direct from collective provisions less recoveries of amounts previously written off, for thequarter ended 31 March 2019.
Past due Specific Net charges
Impaired loans provision for individual Actual
assets ≥ 90 days balance (1)
provisions losses (2)
Portfolio $M $M $M $M $M
Corporate including SME, specialised lending and central
counterparties 1,720 500 671 159 120
Sovereign - - - - (1)
Bank 9 - 9 - -
Residential mortgage 1,547 2,689 345 28 34
Qualifying revolving retail 137 - 116 - 67
Other retail 147 26 140 3 82
Total 3,560 3,215 1,281 190 302
As at 31 December 2018
Quarter ended
31 December 2018
(1) Specific provision balance includes certain Australian Accounting Standards collective provisions on some defaulted loans.
(2) Actual losses equal write-offs from individual provisions, write-offs direct from collective provisions less recoveries of amounts previously written off, for thequarter ended 31 December 2018.

Credit Risk
Commonwealth Bank of Australia – Pillar 3 Report
3.3 Securitisation
APS 330 Table 5a – Total securitisation activity for the reporting period
Total exposures Recognised gain or loss
securitised on sale
Underlying Asset Type $M $M
Residential mortgage 131 -
Credit cards and other personal loans 18 -
Auto and equipment finance - -
Commercial loans - -
Other - -
Total 149 -
For the 3 months to 31 March 2019
Total exposures Recognised gain or loss
securitised on sale
Underlying Asset Type $M $M
Residential mortgage 340 -
Credit cards and other personal loans - -
Auto and equipment finance 150 -
Commercial loans 9 -
Other - -
Total 499 -
For the 3 months to 31 December 2018
APS 330 Table 5b – Summary of total securitisation exposures retained or purchased
Total
On Balance Sheet Off Balance Sheet exposures
Securitisation Facility Type $M $M $M
Liquidity support facilities - 248 248
Warehouse facilities 4,523 3,098 7,621
Derivative facilities 116 22 138
Holdings of securities 7,543 - 7,543
Other - 5 5
Total securitisation exposures 12,182 3,373 15,555
As at 31 March 2019
Total
On Balance Sheet Off Balance Sheet exposures
Securitisation Facility Type $M $M $M
Liquidity support facilities - 260 260
Warehouse facilities 4,253 3,425 7,678
Derivative facilities 84 24 108
Holdings of securities 7,853 - 7,853
Other - 5 5
Total securitisation exposures 12,190 3,714 15,904
As at 31 December 2018
8

Leverage Ratio
Commonwealth Bank of Australia – Pillar 3 Report 9
4. Leverage Ratio
The Group’s leverage ratio, defined as Tier 1 Capital as a percentage of total exposures, was 5.4% at 31 March 2019 on an
APRA basis and 6.2% on an internationally comparable basis.
In December 2017, as part of the final calibration of the leverage ratio, the BCBS announced:
Confirmation that the leverage ratio will have a minimum regulatory requirement of 3%, effective from 1 January 2018; and
Changes in the definition of exposures related to derivatives and off balance sheet items, effective from 1 January 2022.
In November 2018, APRA released draft prudential reporting standards that are broadly in line with BCBS guidance including a
minimum leverage ratio requirement of 3.5% for IRB banks. These changes are subject to consultation and are proposed to apply
from 1 January 2022.
Summary Group Leverage Ratio 31 Mar 19 31 Dec 18 30 Sep 18 30 Jun 18
Tier 1 Capital ($M) 55,381 57,518 56,055 56,365
Total Exposures ($M) (1) 1,023,593 1,026,240 1,024,774 1,018,555
Leverage Ratio (APRA) (%) 5. 4 5. 6 5. 5 5. 5
Leverage Ratio (Internationally Comparable) (%) (2) 6. 2 6. 4 6. 2 6. 3
(1) Total exposures is the sum of on Balance Sheet exposures, derivatives, Securities Financing Transactions (SFTs), and off Balance Sheet exposures, netof any Tier 1 regulatory deductions, as outlined in APS 110 “Capital Adequacy”.
(2) The Tier 1 Capital included in the calculation of the internationally comparable leverage ratio aligns with the 13 July 2015 APRA study titled “Internationalcapital comparison study”, and includes Basel III non-compliant Tier 1 instruments that are currently subject to transitional rules.
Liquidity Risk
Commonwealth Bank of Australia – Pillar 3 Report
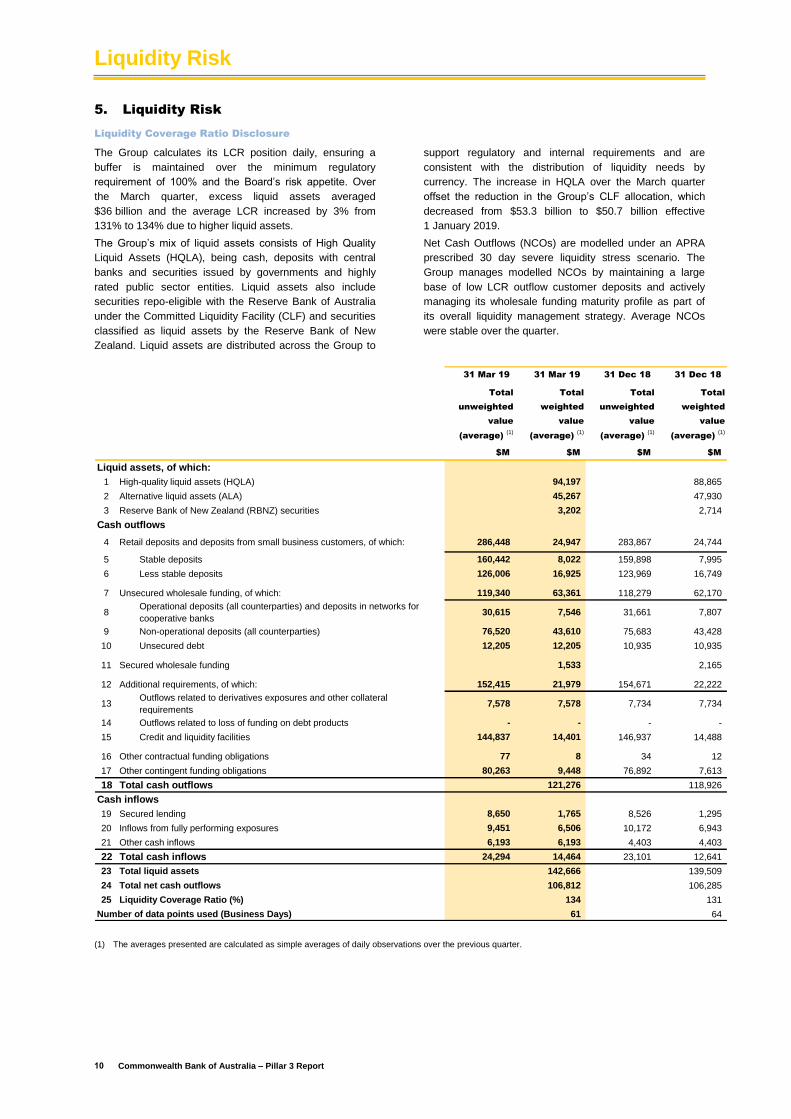
5. Liquidity Risk
Liquidity Coverage Ratio Disclosure
The Group calculates its LCR position daily, ensuring a
buffer is maintained over the minimum regulatory
requirement of 100% and the Board’s risk appetite. Over
the March quarter, excess liquid assets averaged
$36 billion and the average LCR increased by 3% from
131% to 134% due to higher liquid assets.
The Group’s mix of liquid assets consists of High Quality
Liquid Assets (HQLA), being cash, deposits with central
banks and securities issued by governments and highly
rated public sector entities. Liquid assets also include
securities repo-eligible with the Reserve Bank of Australia
under the Committed Liquidity Facility (CLF) and securities
classified as liquid assets by the Reserve Bank of New
Zealand. Liquid assets are distributed across the Group to
support regulatory and internal requirements and are
consistent with the distribution of liquidity needs by
currency. The increase in HQLA over the March quarter
offset the reduction in the Group’s CLF allocation, which
decreased from $53.3 billion to $50.7 billion effective
1 January 2019.
Net Cash Outflows (NCOs) are modelled under an APRA
prescribed 30 day severe liquidity stress scenario. The
Group manages modelled NCOs by maintaining a large
base of low LCR outflow customer deposits and actively
managing its wholesale funding maturity profile as part of
its overall liquidity management strategy. Average NCOs
were stable over the quarter.
31 Mar 19 31 Mar 19 31 Dec 18 31 Dec 18
Total
unweighted
value
(average) (1)
Total
weighted
value
(average) (1)
Total
unweighted
value
(average) (1)
Total
weighted
value
(average) (1)
$M $M $M $M
Liquid assets, of which:
1 High-quality liquid assets (HQLA) 94,197 88,865
2 Alternative liquid assets (ALA) 45,267 47,930
3 Reserve Bank of New Zealand (RBNZ) securities 3,202 2,714
Cash outflows
4 Retail deposits and deposits from small business customers, of which: 286,448 24,947 283,867 24,744
5 Stable deposits 160,442 8,022 159,898 7,995
6 Less stable deposits 126,006 16,925 123,969 16,749
7 Unsecured wholesale funding, of which: 119,340 63,361 118,279 62,170
8Operational deposits (all counterparties) and deposits in networks for
cooperative banks30,615 7,546 31,661 7,807
9 Non-operational deposits (all counterparties) 76,520 43,610 75,683 43,428
10 Unsecured debt 12,205 12,205 10,935 10,935
11 Secured wholesale funding 1,533 2,165
12 Additional requirements, of which: 152,415 21,979 154,671 22,222
13Outflows related to derivatives exposures and other collateral
requirements7,578 7,578 7,734 7,734
14 Outflows related to loss of funding on debt products - - - -
15 Credit and liquidity facilities 144,837 14,401 146,937 14,488
16 Other contractual funding obligations 77 8 34 12
17 Other contingent funding obligations 80,263 9,448 76,892 7,613
18 Total cash outflows 121,276 118,926
Cash inflows
19 Secured lending 8,650 1,765 8,526 1,295
20 Inflows from fully performing exposures 9,451 6,506 10,172 6,943
21 Other cash inflows 6,193 6,193 4,403 4,403
22 Total cash inflows 24,294 14,464 23,101 12,641
23 Total liquid assets 142,666 139,509
24 Total net cash outflows 106,812 106,285
25 Liquidity Coverage Ratio (%) 134 131
Number of data points used (Business Days) 61 64
(1) The averages presented are calculated as simple averages of daily observations over the previous quarter.
10

Glossary
Commonwealth Bank of Australia – Pillar 3 Report 11
Term Definition
Additional Tier 1 Capital Additional Tier 1 Capital is a Basel III defined concept and consists of high quality capital that essentially
includes providing a permanent and unrestricted commitment of funds, is freely available to absorb
losses, ranks behind the claims of depositors and other more senior creditors in the event of a wind-up,
and provides for fully discretionary capital distributions.
Advanced Internal Ratings
Based (AIRB) Approach
Used to measure credit risk in accordance with the Group’s Basel III accreditation that allows the Group
to use internal estimates of PD, LGD and EAD for the purposes of calculating regulatory capital.
Advanced Measurement
Approach (AMA)
Used to measure operational risk in accordance with the Group’s Basel III accreditation that allows the
Group to use its own internal model for the purposes of calculating regulatory capital.
Australian Accounting
Standards
The Australian Accounting Standards as issued by the Australian Accounting Standards Board (AASB).
Australian Prudential
Regulation Authority (APRA)
The regulator of banks, insurance companies and superannuation funds, credit unions, building societies
and friendly societies in Australia.
Authorised Deposit-taking
Institution (ADI)
ADI Prudential Standards
(APS)
ASB
Bank
Basel II
Basel III
CBA
Central counterparty (CCP)
Collective Provision
Committed Liquidity Facility
(CLF)
Common Equity Tier 1
(CET1) Capital
Corporate
Includes banks, building societies and credit unions which are authorised by APRA to take deposits from
customers.
APRA’s ADI Prudential Standards. For more information, refer to the APRA website.
ASB Bank Limited – a subsidiary of the Commonwealth Bank of Australia that is directly regulated by the
Reserve Bank of New Zealand.
Basel asset class – includes claims on ADIs and overseas banks.
Refers to the Basel Committee on Banking Supervision’s Revised Framework for International
Convergence of Capital Measurement and Capital Standards issued in June 2006 and as subsequently
amended.
Refers to the Basel Committee on Banking Supervision’s framework for more resilient banks and
banking systems issued December 2010 (revised June 2011) and Capital requirements for bank
exposures to central counterparties (July 2012).
Commonwealth Bank of Australia – the head entity of the Group.
A clearing house that interposes itself between counterparties to contracts traded in one or more
financial markets, thereby ensuring the future performance of open contracts.
All loans and receivables that do not have an individually assessed provision are assessed collectively
for impairment. The collective provision is maintained to reduce the carrying value of the portfolio of
loans to their estimated recoverable amounts. These provisions are as reported in the Group’s Financial
Statements in accordance with the Australian Accounting Standards (AASB 9 Financial Instruments)
which was adopted by the Group on 1 July 2018.
The Reserve Bank of Australia (RBA) provides the CLF to participating ADIs under the LCR, as a
shortfall in Commonwealth government and semi-government securities exists in Australia. ADIs can
draw under the CLF in a liquidity crisis against qualifying securities pledged to the RBA. The amount of
the CLF for each ADI is set by APRA annually.
The highest quality of capital available to the Group reflecting the permanent and unrestricted
commitment of funds that are freely available to absorb losses. It comprises ordinary share capital,
retained earnings and reserves less prescribed deductions.
Basel asset class – includes commercial credit risk where annual revenues exceed $50 million.

Glossary
12 Commonwealth Bank of Australia – Pillar 3 Report
Term Definition
Credit Valuation Adjustment
(CVA) Risk
The risk of mark-to-market losses related to deterioration in the credit quality of a derivative
counterparty.
Exposure at Default (EAD) The extent to which a bank may be exposed upon default of an obligor.
Extended Licensed Entity
(ELE)
APRA may deem an entity of an ADI to be part of the ADI itself for the purposes of measuring the ADIs
exposures to related entities.
External Credit Assessment
Institution (ECAI)
For example Moody’s Investor Services, S&P Global Ratings or Fitch Ratings.
General Reserve for Credit
Losses (GRCL)
Group
Impaired Assets
Individual Provisions
Interest Rate Risk in the
Banking Book (IRRBB)
Level 1
Level 2
Level 3
Leverage Ratio
Liquidity Coverage Ratio
(LCR)
Loss Given Default (LGD)
Net Cash Outflows
Net Stable Funding Ratio
(NSFR)
APS 220 requires the Group to establish a reserve that covers credit losses prudently estimated, but not
certain to arise, over the full life of all individual facilities making up the business of the ADI. Most of the
Group’s collective provisions are included in the GRCL. An excess of required GRCL over the Group’s
collective provisions is recognised as a deduction from CET1.
Commonwealth Bank of Australia and its subsidiaries including ASB.
Facilities are classified as impaired where there is doubt as to whether the full amounts due, including
interest and other payments due, will be achieved in a timely manner.
Provisions made against individual facilities in the credit-rated managed segment where there is
objective evidence of impairment and full recovery of principal and interest is considered doubtful. These
provisions are as reported in the Group’s Financial Statements in accordance with the Australian
Accounting Standards (AASB 9 Financial Instruments) which was adopted by the Group on 1 July 2018.
Also known as individually assessed provisions or IAP.
The risk that the Bank’s profit derived from Net Interest Income (interest earned less interest paid), in
current and future periods, is adversely impacted from changes in interest rates. This is measured from
two perspectives; firstly by quantifying the change in the net present value of the balance sheet’s future
earnings potential and secondly, as the anticipated change to the Net Interest Income earned over 12
months. The APS117 IRRBB regulatory capital requirement is calculated using the net present value
approach.
Represents the ADI and each entity of the ADI that has been approved as an ELE by APRA.
The level at which the Group reports its capital adequacy to APRA being the consolidated banking group
comprising the ADI and all of its subsidiary entities other than the insurance and funds management
entities and entities through which securitisation of Group assets is conducted. This is the basis on
which this report has been produced.
The conglomerate group including the Group’s insurance and wealth management business.
Tier 1 Capital divided by Total Exposures, with this ratio expressed as a percentage.
The LCR is a quantitative liquidity measure that is part of the Basel III reforms. It was implemented by
APRA in Australia on 1 January 2015. It requires Australian ADIs to hold sufficient liquid assets to meet
30 day net cash outflows projected under an APRA-prescribed stress scenario.
The fraction of EAD that is not expected to be recovered following default.
Net cash outflows in the LCR are calculated by applying prescribed run-off factors on liabilities and
various Off Balance Sheet exposures that can generate a cash outflow in the next 30 days.
The NSFR is the ratio of the amount of available stable funding (ASF) to the amount of required stable
funding (RSF). ASF is the portion of an ADI’s capital and liabilities expected to be a reliable source of
funds over a one year time horizon. RSF is a function of the liquidity characteristics and residual
maturities of an ADI’s assets and off-balance sheet activities.

Glossary
Commonwealth Bank of Australia – Pillar 3 Report 13
Term Definition
Other Assets Basel asset class – primarily includes Cash, Investments in Related Entities, Fixed Assets and Margin
Lending.
Other Retail Basel asset class – primarily includes retail credit exposures not otherwise classed as a residential
mortgage, SME retail or a qualifying revolving retail asset.
Past due Facilities are past due when a contracted amount, including principal or interest, has not been met when
due or it is otherwise outside contracted arrangements.
Probability of Default (PD) The likelihood that a debtor fails to meet an obligation or contractual commitment.
Qualifying Revolving Retail
(QRR)
Basel asset class – represents revolving exposures to individuals less than $0.1m, unsecured and
unconditionally cancellable by the Group. Only Australian retail credit cards qualify for this AIRB asset
class.
RBA Reserve Bank of Australia.
RBNZ Reserve Bank of New Zealand.
Residential Mortgage Basel asset class – retail exposures secured by residential mortgage property.
Risk Weighted Assets (RWA) The value of the Group’s On and Off Balance Sheet assets are adjusted by risk weights calculated
according to various APRA prudential standards. For more information, refer to the APRA website.
Scaling Factor In order to broadly maintain the aggregate level of capital in the global financial system post
implementation of Basel II, the Basel Committee on Banking Supervision applies a scaling factor to the
risk weighted asset amounts for credit risk under the AIRB approach of 1.06.
Securitisation Basel asset class – Group-originated securitised exposures and the provision of facilities to customers in
relation to securitisation activities.
SME Corporate Basel asset class – Small and Medium Enterprise (SME) commercial credit risk where annual revenues
are less than $50 million and exposures are greater than $1 million.
SME Retail Basel asset class – Small and Medium Enterprise (SME) exposures up to $1 million that are not secured
by residential mortgage property.
SME Retail Secured by
Residential Mortgage
Basel asset class – Small and Medium Enterprise (SME) exposures up to $1 million that are partly or
fully secured by residential mortgage property.
Sovereign Basel asset class – primarily includes claims on Australian and foreign governments, central banks
(including Reserve Bank of Australia), international banking agencies and regional development banks.
Specialised Lending Basel asset classes subject to the supervisory slotting approach and which include Income Producing
Real Estate (IPRE), object finance, project finance and commodity finance.
Specific Provisions APS 220 requires ADIs to report as specific provisions all provisions for impairment assessed by an ADI
on an individual basis in accordance with the Australian Accounting Standards and that portion of
provisions assessed on a collective basis which are deemed ineligible to be included in the General
Reserve for Credit Losses (which are primarily collective provisions on some defaulted assets).
Stressed VaR (SVaR) Stressed Value at Risk uses the same methodology as Value at Risk (VaR) except that the historical
data used is taken from a one year observation period of significant market volatility as seen during the
Global Financial Crisis.
Tier 1 Capital Comprises CET1 and Additional Tier 1 Capital.
Tier 2 Capital Capital items that fall short of the necessary conditions to qualify as Tier 1 Capital.
Total Exposures (as used in
the Leverage Ratio)
The sum of On Balance Sheet items, derivatives, securities financing transactions (SFTs), and Off
Balance Sheet items, net of any Tier 1 regulatory deductions that are already included in these items, as
outlined in APS 110 “Capital Adequacy” (APS 110) Attachment D.