Embed Size (px)
Citation preview
dnbnor.no
4
Capital adequacy regulationsBasel II / Pillar 3Fourth quarter 2010
Page 1 of 40
Contents Introduction..................................................................... 2
Basel II and the IRB system............................................... 3
Capital adequacy calculations ............................................. 5
Risk management and control, capitalisation .......................14
Information about risk categories ......................................17
General information about credit risk ......................................................... 17 Credit risk – standardised approach........................................................... 23 Credit risk – IRB approach ....................................................................... 24 Cyclicality in the IRB method .................................................................... 27 Credit risk – collateral.............................................................................. 30 Credit risk – counterparty risk for derivatives.............................................. 31 Credit risk – investment in securitisation .................................................... 32 Equity positions outside the trading portfolio............................................... 33 Interest rate risk outside the trading portfolio ............................................. 34
Changes in the regulatory framework .................................35
Basel III ................................................................................................ 35 Important IFRS amendments.................................................................... 38 Regulation of remunerations in the financial services industry ....................... 39 Report from the Financial Crisis Commission ............................................... 39

Page 2 of 40
Introduction Monitoring and managing risk is an integral part of financial operations. In DnB NOR, sound risk management is a strategic tool to enhance value generation. The Basel II capital requirements entered into force on 1 January 2007. This document has been prepared on the basis of specific requirements in the capital adequacy regulations regarding the disclosure of financial information (Pillar 3) in order to contribute to the understanding of the institution's risk level, risk management and control as well as capitalisation. This document is updated annually, except for information on primary capital and minimum capital requirements, which is updated quarterly.
Page 3 of 40
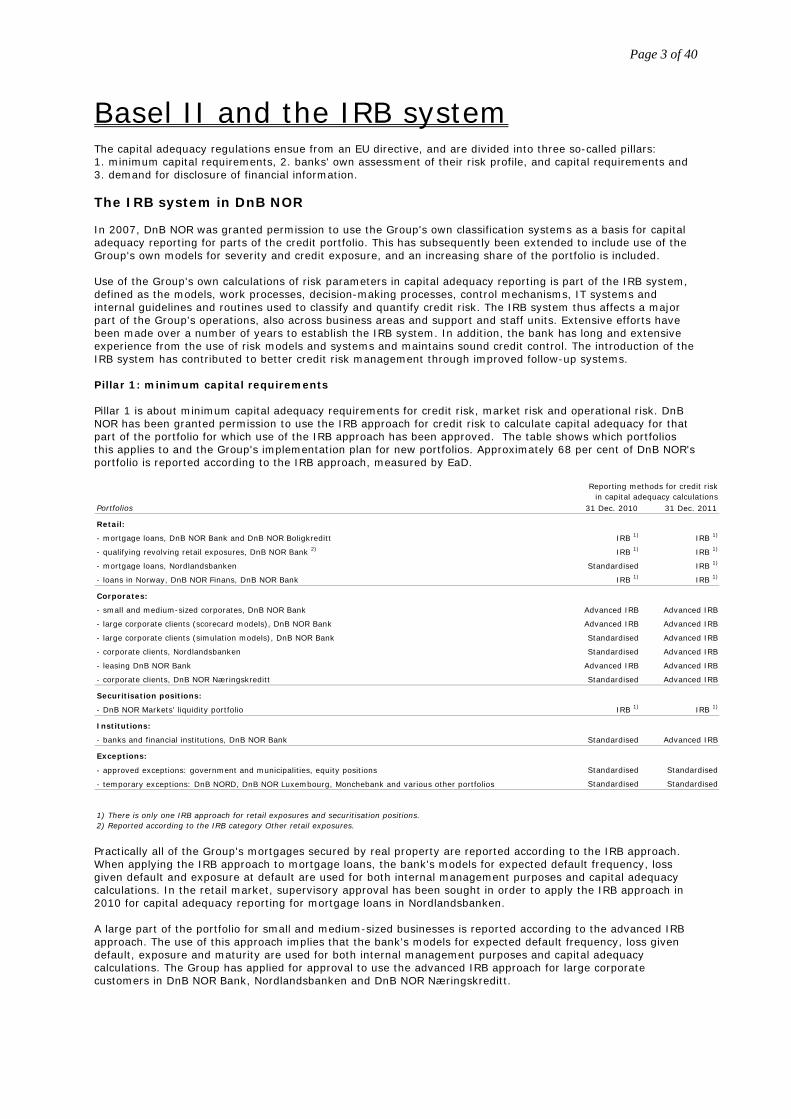
Basel II and the IRB system The capital adequacy regulations ensue from an EU directive, and are divided into three so-called pillars: 1. minimum capital requirements, 2. banks' own assessment of their risk profile, and capital requirements and 3. demand for disclosure of financial information. The IRB system in DnB NOR In 2007, DnB NOR was granted permission to use the Group's own classification systems as a basis for capital adequacy reporting for parts of the credit portfolio. This has subsequently been extended to include use of the Group's own models for severity and credit exposure, and an increasing share of the portfolio is included. Use of the Group's own calculations of risk parameters in capital adequacy reporting is part of the IRB system, defined as the models, work processes, decision-making processes, control mechanisms, IT systems and internal guidelines and routines used to classify and quantify credit risk. The IRB system thus affects a major part of the Group's operations, also across business areas and support and staff units. Extensive efforts have been made over a number of years to establish the IRB system. In addition, the bank has long and extensive experience from the use of risk models and systems and maintains sound credit control. The introduction of the IRB system has contributed to better credit risk management through improved follow-up systems. Pillar 1: minimum capital requirements Pillar 1 is about minimum capital adequacy requirements for credit risk, market risk and operational risk. DnB NOR has been granted permission to use the IRB approach for credit risk to calculate capital adequacy for that part of the portfolio for which use of the IRB approach has been approved. The table shows which portfolios this applies to and the Group's implementation plan for new portfolios. Approximately 68 per cent of DnB NOR's portfolio is reported according to the IRB approach, measured by EaD.
Practically all of the Group's mortgages secured by real property are reported according to the IRB approach. When applying the IRB approach to mortgage loans, the bank's models for expected default frequency, loss given default and exposure at default are used for both internal management purposes and capital adequacy calculations. In the retail market, supervisory approval has been sought in order to apply the IRB approach in 2010 for capital adequacy reporting for mortgage loans in Nordlandsbanken. A large part of the portfolio for small and medium-sized businesses is reported according to the advanced IRB approach. The use of this approach implies that the bank's models for expected default frequency, loss given default, exposure and maturity are used for both internal management purposes and capital adequacy calculations. The Group has applied for approval to use the advanced IRB approach for large corporate customers in DnB NOR Bank, Nordlandsbanken and DnB NOR Næringskreditt.
Portfolios 31 Dec. 2010 31 Dec. 2011
Retail:
- mortgage loans, DnB NOR Bank and DnB NOR Boligkreditt IRB 1) IRB 1)
- qualifying revolving retail exposures, DnB NOR Bank 2) IRB 1) IRB 1)
- mortgage loans, Nordlandsbanken Standardised IRB 1)
- loans in Norway, DnB NOR Finans, DnB NOR Bank IRB 1) IRB 1)
Corporates:
- small and medium-sized corporates, DnB NOR Bank Advanced IRB Advanced IRB
- large corporate clients (scorecard models), DnB NOR Bank Advanced IRB Advanced IRB
- large corporate clients (simulation models), DnB NOR Bank Standardised Advanced IRB
- corporate clients, Nordlandsbanken Standardised Advanced IRB
- leasing DnB NOR Bank Advanced IRB Advanced IRB
- corporate clients, DnB NOR Næringskreditt Standardised Advanced IRB
Securitisation positions:
- DnB NOR Markets' liquidity portfolio IRB 1) IRB 1)
Institutions:
- banks and financial institutions, DnB NOR Bank Standardised Advanced IRB
Exceptions:
- approved exceptions: government and municipalities, equity positions Standardised Standardised
- temporary exceptions: DnB NORD, DnB NOR Luxembourg, Monchebank and various other portfolios Standardised Standardised
1) There is only one IRB approach for retail exposures and securitisation positions.2) Reported according to the IRB category Other retail exposures.
Reporting methods for credit riskin capital adequacy calculations
Page 4 of 40
The basic indicator approach, the standardised approach and the advanced approach can all be used to measure operational risk under Basel II. DnB NOR Bank ASA reports according to the standardised approach, while some subsidiaries use the basic indicator approach. A shift to the most advanced reporting standard, Advanced Measurement Approaches, AMA, will be considered at a later date. The use of the most advanced approach is subject to approval by Finanstilsynet. Market risk can be reported according to the standardised approach or based on internal models, the Internal Model Method, IMM. DnB NOR reports according to the standardised approach. Pillar 2: banks' own assessment of their risk profile, and capital requirements Pillar 2 requires the Group to have a process to assess its overall capital requirements relative to its risk profile as well as a strategy for maintaining the level of capital. Pillar 2 also describes Finanstilsynet's (the Financial Supervisory Authority of Norway) review and evaluation process. Pursuant to the Norwegian Public Limited Liability Companies Act, all companies must at all times have an equity which is sound, based on the extent of the company’s activities and the risk they involve. The capital adequacy regulations set a minimum primary capital requirement, encompassing credit risk, market risk and operational risk. In addition, financial institutions are required to complete an Internal Capital Adequacy Assessment Process, ICAAP. Finanstilsynet has established guidelines for what such a process should include. The capital adequacy assessment process should encompass risks which are not included in the calculation of the minimum requirement. In addition, it should reflect the fact that risk quantification and capital requirements are based on methods and data which entail uncertainty. Capital requirement assessments should be forward-looking and take account of business plans, growth and access to capital markets. The capital base should be adequate to get through a recession characterised by negative results and difficulties in obtaining new capital. The ICAAP should be reported to Finanstilsynet. As part of its supervisory process, Finanstilsynet prepares an annual overall risk assessment for the Group, including feedback on the capitalisation of the Group. Processes have been established in DnB NOR to assess capital requirements relative to the Group's risk profile and the quality of established risk management and control systems. The Group's risk and capital situation is assessed and summarised in a separate risk report to the Board of Directors of DnB NOR ASA each quarter in connection with the presentation of the accounts. The Group's capitalisation target is an important element in the budget and strategy process. The capitalisation policy is reviewed annually. A process for assessing the risk profiles and capital requirements of the parent company DnB NOR ASA, Vital Forsikring ASA and other major subsidiaries is completed each year. Risk is quantified by calculating risk-adjusted capital. Qualitative assessments are also used. Stress tests for credit and market risk are other important references. The Boards of Directors of the subsidiaries make independent assessments of capital levels and future capital requirements based on guidelines in the Group's capitalisation policy. The results are verified with the specialist units in the respective subsidiaries and in DnB NOR ASA and considered by the Asset and Liability Committee, ALCO, before being presented to the respective Boards of Directors. The process and the result thereof are documented in writing in an ICAAP report. DnB NOR's ICAAP report was sent to Finanstilsynet in April 2010. The Group's CFO is responsible for ensuring that the ICAAP process is completed. Pillar 3: demand for disclosure of financial information As mentioned above, this document has been prepared on the basis of specific requirements in the capital adequacy regulations concerning the disclosure of financial information. Information is required to be made accessible on the Internet. The information must cover DnB NOR's adaptation to and compliance with the capital adequacy regulations and include specifications of risk-weighted assets and primary capital, methods for calculating risk-weighted assets and a description of guidelines and routines for the management and control of various risks. The process of assessing the overall capital requirement should also be described. Role of the Group Audit Group Audit will regularly perform audits of the IRB system and monitor how it is used, including verifying compliance with the capital adequacy regulations. The IRB system will be audited at least once a year. Group Audit will also assess the ICAAP process and consider whether there is adequate capital relative to the risk profile of the Group and major subsidiaries.
Page 5 of 40
Capital adequacy calculations
The consolidated accounts for DnB NOR ASA ("DnB NOR") include DnB NOR Bank ASA, Vital Forsikring ASA, DnB NOR Kapitalforvaltning Holding AS and DnB NOR Skadeforsikring AS, all including subsidiaries and associated companies.
Valuation rules used in the statutory accounts form the basis for the consolidation. Norwegian regulations on the use of IFRS have been implemented in statutory accounts of the companies in the Group. When preparing consolidated accounts, intra-group transactions and balances along with unrealised gains or losses on these transactions between group units are eliminated.
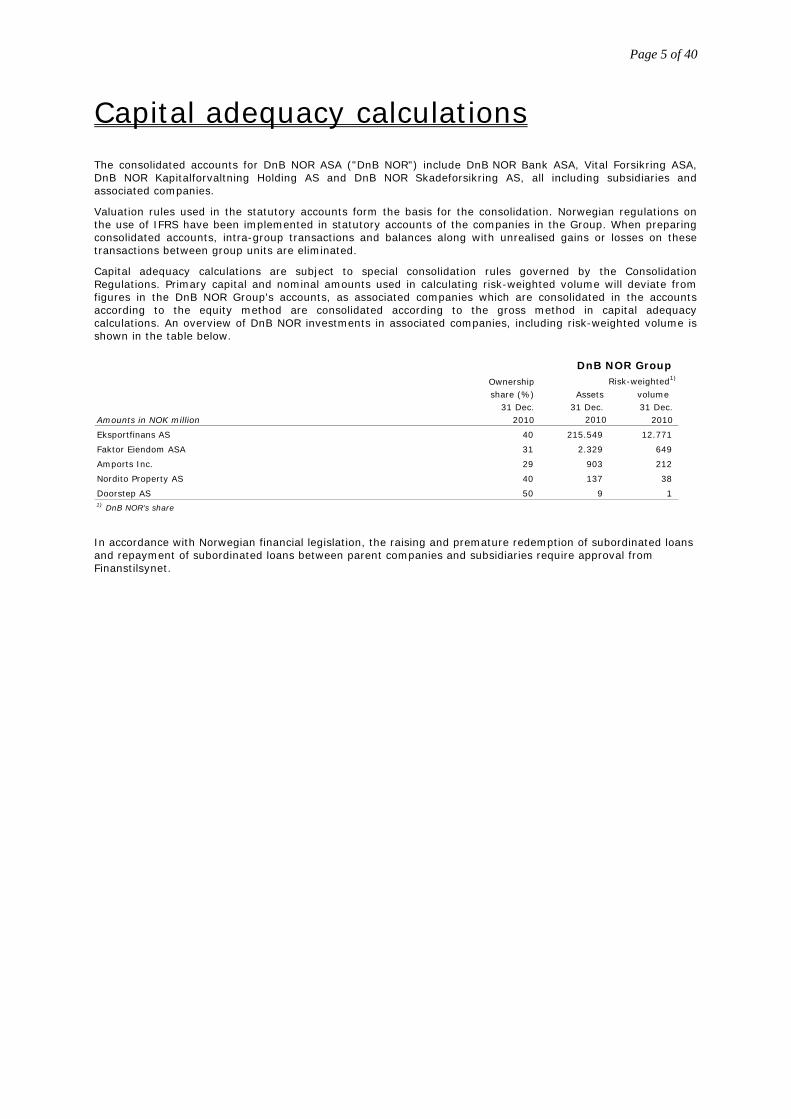
Capital adequacy calculations are subject to special consolidation rules governed by the Consolidation Regulations. Primary capital and nominal amounts used in calculating risk-weighted volume will deviate from figures in the DnB NOR Group's accounts, as associated companies which are consolidated in the accounts according to the equity method are consolidated according to the gross method in capital adequacy calculations. An overview of DnB NOR investments in associated companies, including risk-weighted volume is shown in the table below.
In accordance with Norwegian financial legislation, the raising and premature redemption of subordinated loans and repayment of subordinated loans between parent companies and subsidiaries require approval from Finanstilsynet.
DnB NOR Group Ownership Risk-weighted1)
share (%) Assets volume 31 Dec. 31 Dec. 31 Dec.
Amounts in NOK million 2010 2010 2010
Eksportfinans AS 40 215.549 12.771
Faktor Eiendom ASA 31 2.329 649
Amports Inc. 29 903 212
Nordito Property AS 40 137 38
Doorstep AS 50 9 1 1) DnB NOR's share
Page 6 of 40
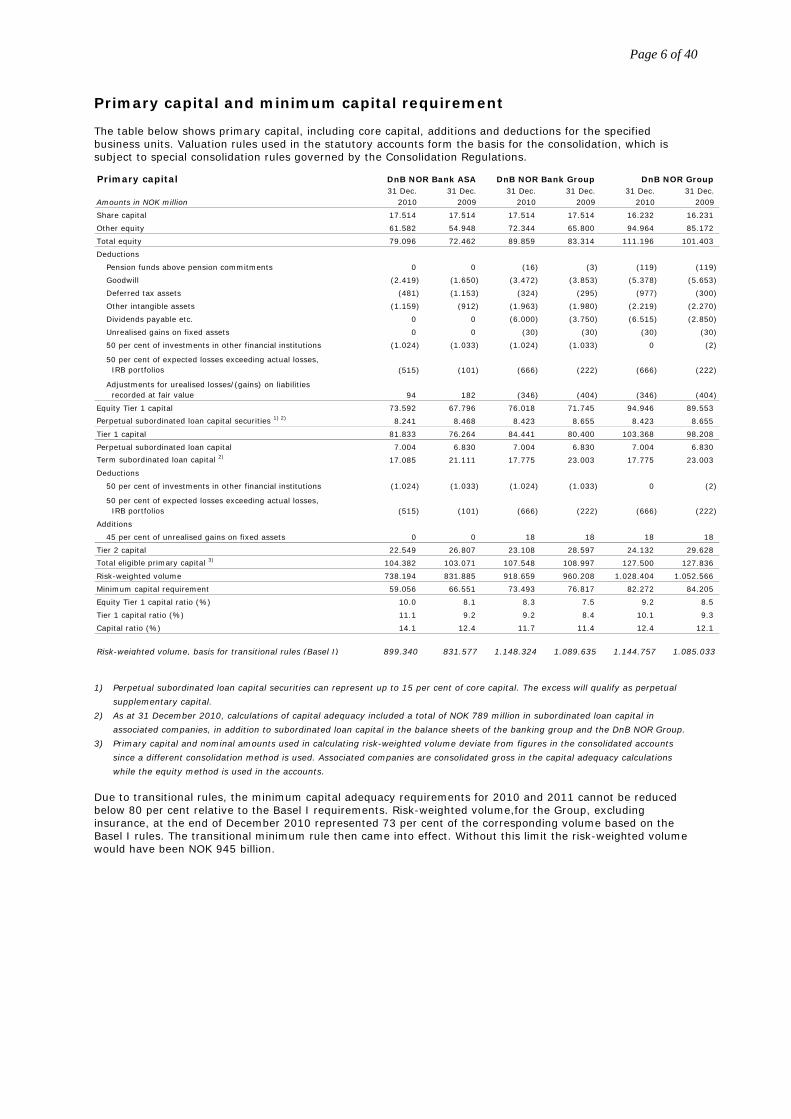
Primary capital and minimum capital requirement The table below shows primary capital, including core capital, additions and deductions for the specified business units. Valuation rules used in the statutory accounts form the basis for the consolidation, which is subject to special consolidation rules governed by the Consolidation Regulations.
1) Perpetual subordinated loan capital securities can represent up to 15 per cent of core capital. The excess will qualify as perpetual
supplementary capital.
2) As at 31 December 2010, calculations of capital adequacy included a total of NOK 789 million in subordinated loan capital in
associated companies, in addition to subordinated loan capital in the balance sheets of the banking group and the DnB NOR Group.
3) Primary capital and nominal amounts used in calculating risk-weighted volume deviate from figures in the consolidated accounts
since a different consolidation method is used. Associated companies are consolidated gross in the capital adequacy calculations
while the equity method is used in the accounts.
Due to transitional rules, the minimum capital adequacy requirements for 2010 and 2011 cannot be reduced below 80 per cent relative to the Basel I requirements. Risk-weighted volume,for the Group, excluding insurance, at the end of December 2010 represented 73 per cent of the corresponding volume based on the Basel I rules. The transitional minimum rule then came into effect. Without this limit the risk-weighted volume would have been NOK 945 billion.
Primary capital DnB NOR Bank ASA DnB NOR Bank Group DnB NOR Group 31 Dec. 31 Dec. 31 Dec. 31 Dec. 31 Dec. 31 Dec.
Amounts in NOK million 2010 2009 2010 2009 2010 2009
Share capital 17.514 17.514 17.514 17.514 16.232 16.231
Other equity 61.582 54.948 72.344 65.800 94.964 85.172
Total equity 79.096 72.462 89.859 83.314 111.196 101.403
Deductions
Pension funds above pension commitments 0 0 (16) (3) (119) (119)
Goodwill (2.419) (1.650) (3.472) (3.853) (5.378) (5.653)
Deferred tax assets (481) (1.153) (324) (295) (977) (300)
Other intangible assets (1.159) (912) (1.963) (1.980) (2.219) (2.270)
Dividends payable etc. 0 0 (6.000) (3.750) (6.515) (2.850)
Unrealised gains on fixed assets 0 0 (30) (30) (30) (30)
50 per cent of investments in other financial institutions (1.024) (1.033) (1.024) (1.033) 0 (2)
50 per cent of expected losses exceeding actual losses, IRB portfolios (515) (101) (666) (222) (666) (222)
Adjustments for urealised losses/(gains) on liabilities recorded at fair value 94 182 (346) (404) (346) (404)
Equity Tier 1 capital 73.592 67.796 76.018 71.745 94.946 89.553
Perpetual subordinated loan capital securities 1) 2) 8.241 8.468 8.423 8.655 8.423 8.655
Tier 1 capital 81.833 76.264 84.441 80.400 103.368 98.208
Perpetual subordinated loan capital 7.004 6.830 7.004 6.830 7.004 6.830
Term subordinated loan capital 2) 17.085 21.111 17.775 23.003 17.775 23.003
Deductions
50 per cent of investments in other financial institutions (1.024) (1.033) (1.024) (1.033) 0 (2)
50 per cent of expected losses exceeding actual losses, IRB portfolios (515) (101) (666) (222) (666) (222)
Additions
45 per cent of unrealised gains on fixed assets 0 0 18 18 18 18
Tier 2 capital 22.549 26.807 23.108 28.597 24.132 29.628
Total eligible primary capital 3) 104.382 103.071 107.548 108.997 127.500 127.836
Risk-weighted volume 738.194 831.885 918.659 960.208 1.028.404 1.052.566
Minimum capital requirement 59.056 66.551 73.493 76.817 82.272 84.205
Equity Tier 1 capital ratio (%) 10.0 8.1 8.3 7.5 9.2 8.5
Tier 1 capital ratio (%) 11.1 9.2 9.2 8.4 10.1 9.3
Capital ratio (%) 14.1 12.4 11.7 11.4 12.4 12.1
Risk-weighted volume, basis for transitional rules (Basel I) 899.340 831.577 1.148.324 1.089.635 1.144.757 1.085.033
Page 7 of 40
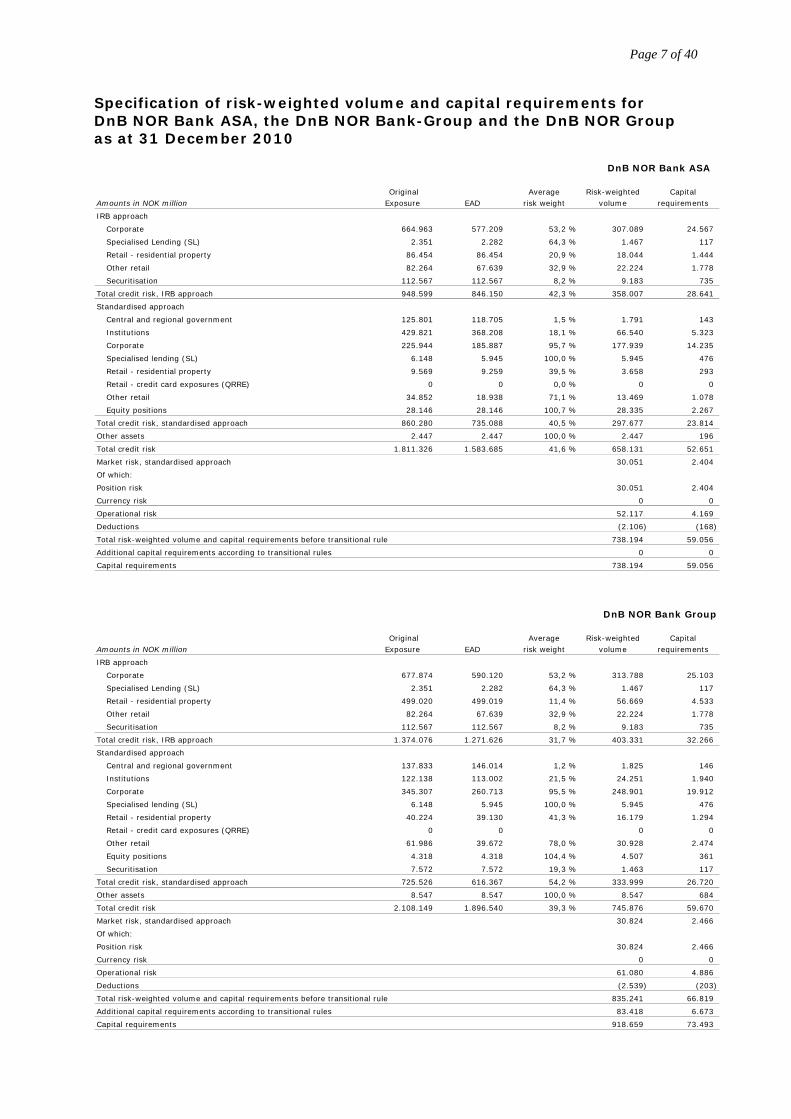
Specification of risk-weighted volume and capital requirements for DnB NOR Bank ASA, the DnB NOR Bank-Group and the DnB NOR Group as at 31 December 2010
DnB NOR Bank Group
Original Average Risk-weighted Capital Amounts in NOK million Exposure EAD risk weight volume requirements
IRB approach
Corporate 677.874 590.120 53,2 % 313.788 25.103
Specialised Lending (SL) 2.351 2.282 64,3 % 1.467 117
Retail - residential property 499.020 499.019 11,4 % 56.669 4.533
Other retail 82.264 67.639 32,9 % 22.224 1.778
Securitisation 112.567 112.567 8,2 % 9.183 735
Total credit risk, IRB approach 1.374.076 1.271.626 31,7 % 403.331 32.266
Standardised approach
Central and regional government 137.833 146.014 1,2 % 1.825 146
Institutions 122.138 113.002 21,5 % 24.251 1.940
Corporate 345.307 260.713 95,5 % 248.901 19.912
Specialised lending (SL) 6.148 5.945 100,0 % 5.945 476
Retail - residential property 40.224 39.130 41,3 % 16.179 1.294
Retail - credit card exposures (QRRE) 0 0 0 0
Other retail 61.986 39.672 78,0 % 30.928 2.474
Equity positions 4.318 4.318 104,4 % 4.507 361
Securitisation 7.572 7.572 19,3 % 1.463 117
Total credit risk, standardised approach 725.526 616.367 54,2 % 333.999 26.720
Other assets 8.547 8.547 100,0 % 8.547 684
Total credit risk 2.108.149 1.896.540 39,3 % 745.876 59.670
Market risk, standardised approach 30.824 2.466
Of which:
Position risk 30.824 2.466
Currency risk 0 0
Operational risk 61.080 4.886
Deductions (2.539) (203)
Total risk-weighted volume and capital requirements before transitional rule 835.241 66.819
Additional capital requirements according to transitional rules 83.418 6.673
Capital requirements 918.659 73.493
DnB NOR Bank ASA
Original Average Risk-weighted Capital Amounts in NOK million Exposure EAD risk weight volume requirements
IRB approach
Corporate 664.963 577.209 53,2 % 307.089 24.567
Specialised Lending (SL) 2.351 2.282 64,3 % 1.467 117
Retail - residential property 86.454 86.454 20,9 % 18.044 1.444
Other retail 82.264 67.639 32,9 % 22.224 1.778
Securitisation 112.567 112.567 8,2 % 9.183 735
Total credit risk, IRB approach 948.599 846.150 42,3 % 358.007 28.641
Standardised approach
Central and regional government 125.801 118.705 1,5 % 1.791 143
Institutions 429.821 368.208 18,1 % 66.540 5.323
Corporate 225.944 185.887 95,7 % 177.939 14.235
Specialised lending (SL) 6.148 5.945 100,0 % 5.945 476
Retail - residential property 9.569 9.259 39,5 % 3.658 293
Retail - credit card exposures (QRRE) 0 0 0,0 % 0 0
Other retail 34.852 18.938 71,1 % 13.469 1.078
Equity positions 28.146 28.146 100,7 % 28.335 2.267
Total credit risk, standardised approach 860.280 735.088 40,5 % 297.677 23.814
Other assets 2.447 2.447 100,0 % 2.447 196
Total credit risk 1.811.326 1.583.685 41,6 % 658.131 52.651
Market risk, standardised approach 30.051 2.404
Of which:
Position risk 30.051 2.404
Currency risk 0 0
Operational risk 52.117 4.169
Deductions (2.106) (168)
Total risk-weighted volume and capital requirements before transitional rule 738.194 59.056
Additional capital requirements according to transitional rules 0 0
Capital requirements 738.194 59.056
Page 8 of 40
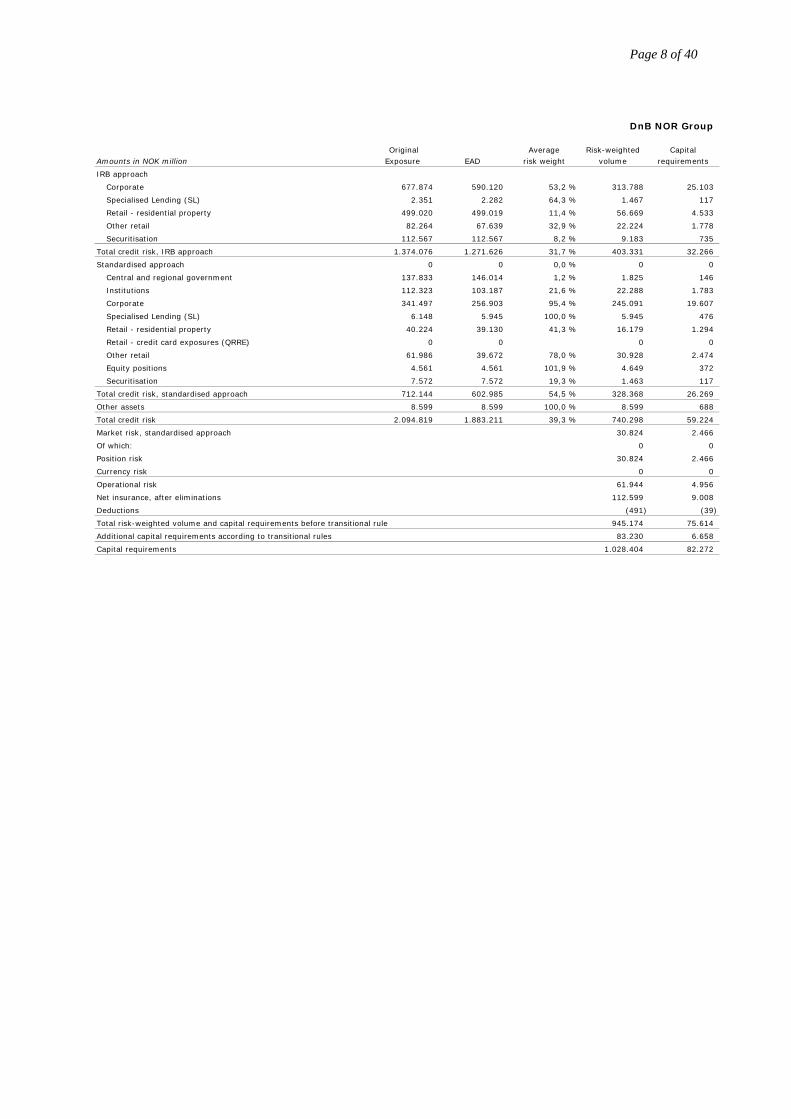
DnB NOR Group
Original Average Risk-weighted Capital Amounts in NOK million Exposure EAD risk weight volume requirements
IRB approach
Corporate 677.874 590.120 53,2 % 313.788 25.103
Specialised Lending (SL) 2.351 2.282 64,3 % 1.467 117
Retail - residential property 499.020 499.019 11,4 % 56.669 4.533
Other retail 82.264 67.639 32,9 % 22.224 1.778
Securitisation 112.567 112.567 8,2 % 9.183 735
Total credit risk, IRB approach 1.374.076 1.271.626 31,7 % 403.331 32.266
Standardised approach 0 0 0,0 % 0 0
Central and regional government 137.833 146.014 1,2 % 1.825 146
Institutions 112.323 103.187 21,6 % 22.288 1.783
Corporate 341.497 256.903 95,4 % 245.091 19.607
Specialised Lending (SL) 6.148 5.945 100,0 % 5.945 476
Retail - residential property 40.224 39.130 41,3 % 16.179 1.294
Retail - credit card exposures (QRRE) 0 0 0 0
Other retail 61.986 39.672 78,0 % 30.928 2.474
Equity positions 4.561 4.561 101,9 % 4.649 372
Securitisation 7.572 7.572 19,3 % 1.463 117
Total credit risk, standardised approach 712.144 602.985 54,5 % 328.368 26.269
Other assets 8.599 8.599 100,0 % 8.599 688
Total credit risk 2.094.819 1.883.211 39,3 % 740.298 59.224
Market risk, standardised approach 30.824 2.466
Of which: 0 0
Position risk 30.824 2.466
Currency risk 0 0
Operational risk 61.944 4.956
Net insurance, after eliminations 112.599 9.008
Deductions (491) (39)
Total risk-weighted volume and capital requirements before transitional rule 945.174 75.614
Additional capital requirements according to transitional rules 83.230 6.658
Capital requirements 1.028.404 82.272
Page 9 of 40
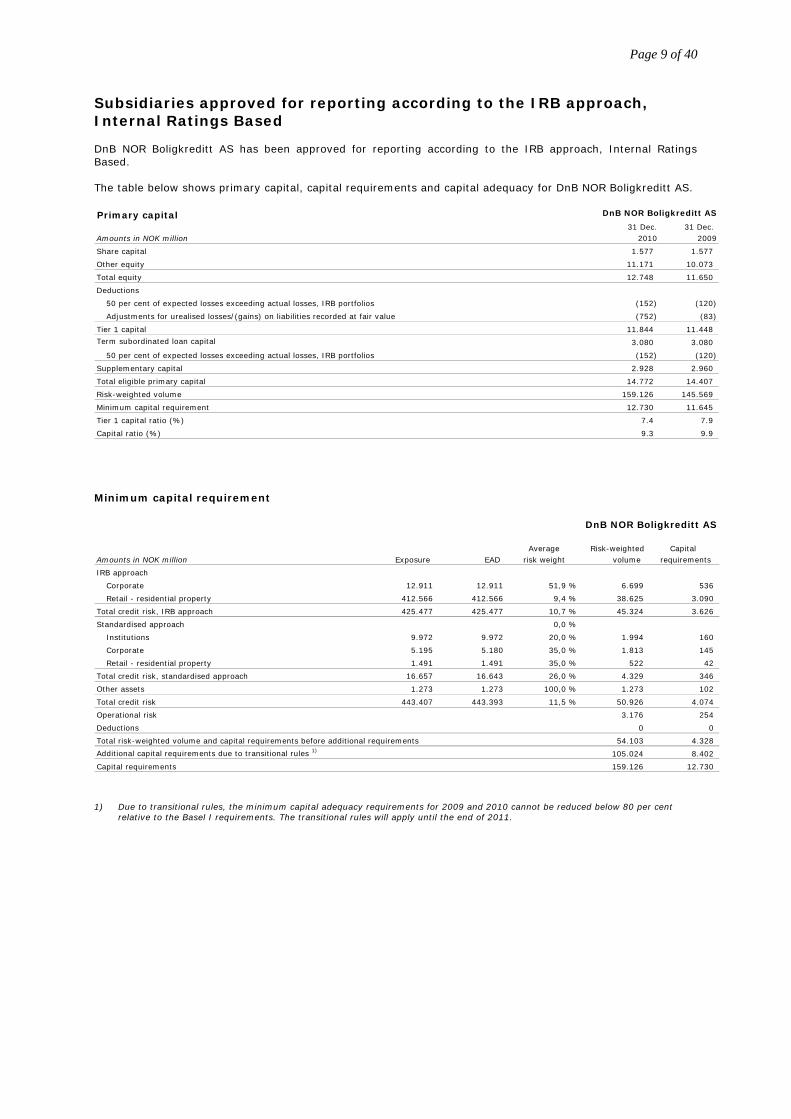
Subsidiaries approved for reporting according to the IRB approach, Internal Ratings Based DnB NOR Boligkreditt AS has been approved for reporting according to the IRB approach, Internal Ratings Based. The table below shows primary capital, capital requirements and capital adequacy for DnB NOR Boligkreditt AS.
Minimum capital requirement
1) Due to transitional rules, the minimum capital adequacy requirements for 2009 and 2010 cannot be reduced below 80 per cent
relative to the Basel I requirements. The transitional rules will apply until the end of 2011.
Primary capital31 Dec. 31 Dec.
Amounts in NOK million 2010 2009
Share capital 1.577 1.577
Other equity 11.171 10.073
Total equity 12.748 11.650
Deductions
50 per cent of expected losses exceeding actual losses, IRB portfolios (152) (120)
Adjustments for urealised losses/(gains) on liabilities recorded at fair value (752) (83)
Tier 1 capital 11.844 11.448
Term subordinated loan capital 3.080 3.080
50 per cent of expected losses exceeding actual losses, IRB portfolios (152) (120)
Supplementary capital 2.928 2.960
Total eligible primary capital 14.772 14.407
Risk-weighted volume 159.126 145.569
Minimum capital requirement 12.730 11.645
Tier 1 capital ratio (%) 7.4 7.9
Capital ratio (%) 9.3 9.9
DnB NOR Boligkreditt AS
DnB NOR Boligkreditt AS
Average Risk-weighted Capital Amounts in NOK million Exposure EAD risk weight volume requirements
IRB approach
Corporate 12.911 12.911 51,9 % 6.699 536
Retail - residential property 412.566 412.566 9,4 % 38.625 3.090
Total credit risk, IRB approach 425.477 425.477 10,7 % 45.324 3.626
Standardised approach 0,0 %
Institutions 9.972 9.972 20,0 % 1.994 160
Corporate 5.195 5.180 35,0 % 1.813 145
Retail - residential property 1.491 1.491 35,0 % 522 42
Total credit risk, standardised approach 16.657 16.643 26,0 % 4.329 346
Other assets 1.273 1.273 100,0 % 1.273 102
Total credit risk 443.407 443.393 11,5 % 50.926 4.074
Operational risk 3.176 254
Deductions 0 0
Total risk-weighted volume and capital requirements before additional requirements 54.103 4.328
Additional capital requirements due to transitional rules 1) 105.024 8.402
Capital requirements 159.126 12.730
Page 10 of 40
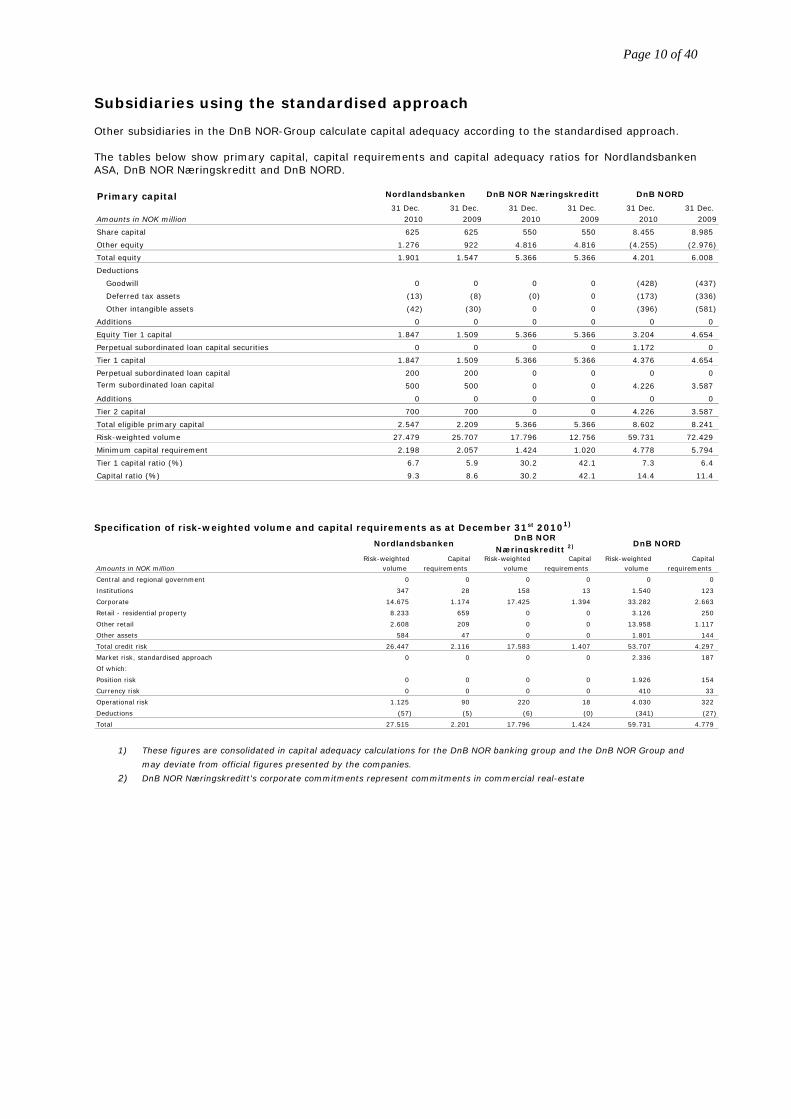
Subsidiaries using the standardised approach Other subsidiaries in the DnB NOR-Group calculate capital adequacy according to the standardised approach. The tables below show primary capital, capital requirements and capital adequacy ratios for Nordlandsbanken ASA, DnB NOR Næringskreditt and DnB NORD.
Specification of risk-weighted volume and capital requirements as at December 31st 20101)
1) These figures are consolidated in capital adequacy calculations for the DnB NOR banking group and the DnB NOR Group and
may deviate from official figures presented by the companies.
2) DnB NOR Næringskreditt's corporate commitments represent commitments in commercial real-estate
Risk-weighted Capital Risk-weighted Capital Risk-weighted Capital Amounts in NOK million volume requirements volume requirements volume requirements
Central and regional government 0 0 0 0 0 0
Institutions 347 28 158 13 1.540 123
Corporate 14.675 1.174 17.425 1.394 33.282 2.663
Retail - residential property 8.233 659 0 0 3.126 250
Other retail 2.608 209 0 0 13.958 1.117
Other assets 584 47 0 0 1.801 144
Total credit risk 26.447 2.116 17.583 1.407 53.707 4.297
Market risk, standardised approach 0 0 0 0 2.336 187
Of which:
Position risk 0 0 0 0 1.926 154
Currency risk 0 0 0 0 410 33
Operational risk 1.125 90 220 18 4.030 322
Deductions (57) (5) (6) (0) (341) (27)
Total 27.515 2.201 17.796 1.424 59.731 4.779
Nordlandsbanken DnB NORDDnB NOR
Næringskreditt 2)
Primary capital31 Dec. 31 Dec. 31 Dec. 31 Dec. 31 Dec. 31 Dec.
Amounts in NOK million 2010 2009 2010 2009 2010 2009
Share capital 625 625 550 550 8.455 8.985
Other equity 1.276 922 4.816 4.816 (4.255) (2.976)
Total equity 1.901 1.547 5.366 5.366 4.201 6.008
Deductions
Goodwill 0 0 0 0 (428) (437)
Deferred tax assets (13) (8) (0) 0 (173) (336)
Other intangible assets (42) (30) 0 0 (396) (581)
Additions 0 0 0 0 0 0
Equity Tier 1 capital 1.847 1.509 5.366 5.366 3.204 4.654
Perpetual subordinated loan capital securities 0 0 0 0 1.172 0
Tier 1 capital 1.847 1.509 5.366 5.366 4.376 4.654
Perpetual subordinated loan capital 200 200 0 0 0 0
Term subordinated loan capital 500 500 0 0 4.226 3.587
Additions 0 0 0 0 0 0
Tier 2 capital 700 700 0 0 4.226 3.587
Total eligible primary capital 2.547 2.209 5.366 5.366 8.602 8.241
Risk-weighted volume 27.479 25.707 17.796 12.756 59.731 72.429
Minimum capital requirement 2.198 2.057 1.424 1.020 4.778 5.794
Tier 1 capital ratio (%) 6.7 5.9 30.2 42.1 7.3 6.4
Capital ratio (%) 9.3 8.6 30.2 42.1 14.4 11.4
DnB NOR NæringskredittNordlandsbanken DnB NORD
Page 11 of 40
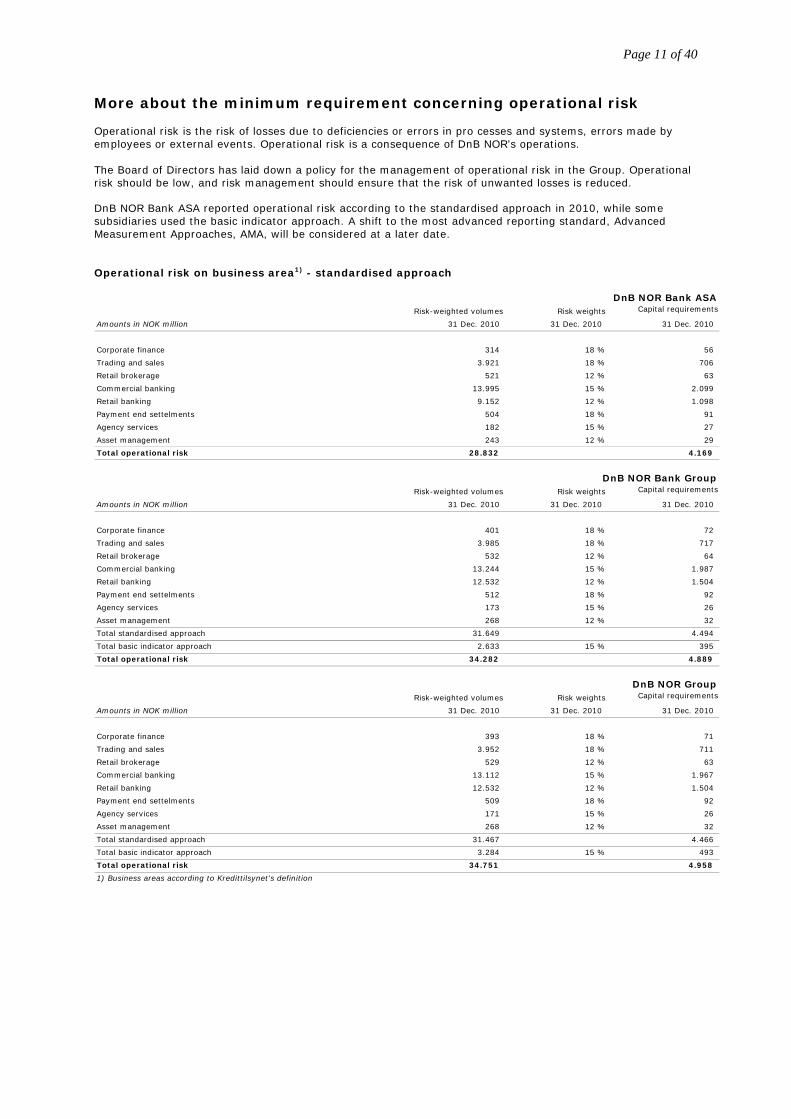
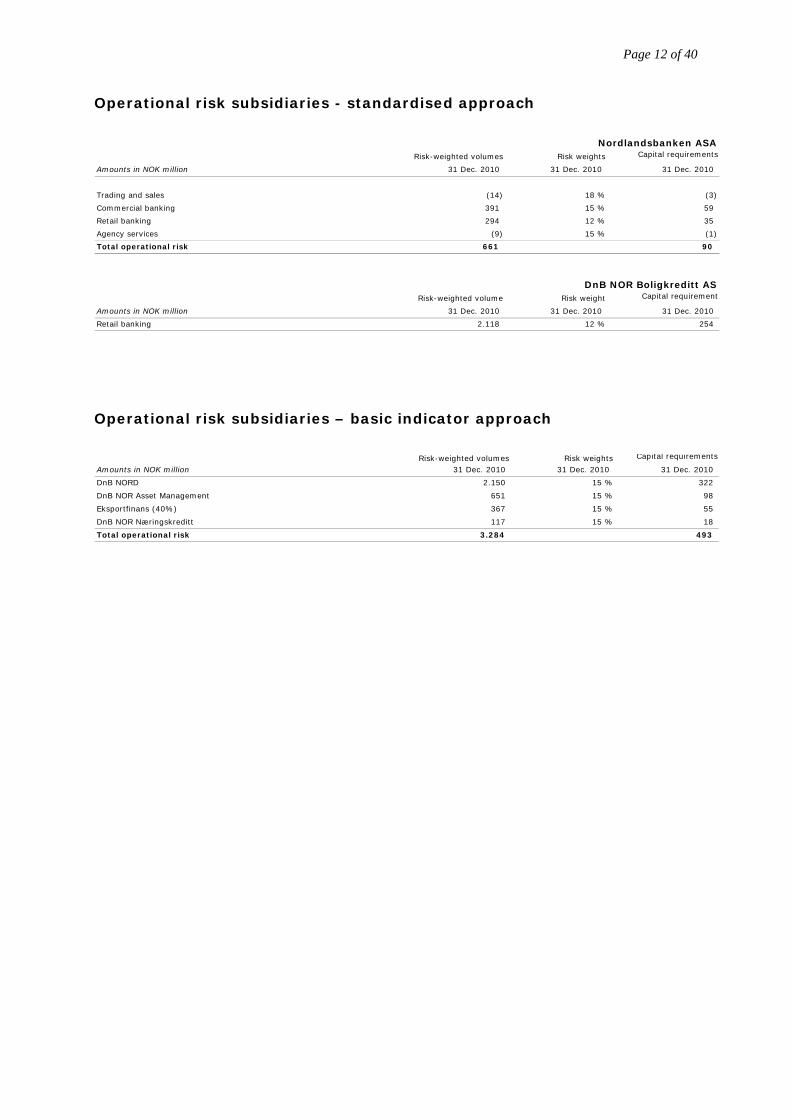
More about the minimum requirement concerning operational risk Operational risk is the risk of losses due to deficiencies or errors in pro cesses and systems, errors made by employees or external events. Operational risk is a consequence of DnB NOR’s operations. The Board of Directors has laid down a policy for the management of operational risk in the Group. Operational risk should be low, and risk management should ensure that the risk of unwanted losses is reduced. DnB NOR Bank ASA reported operational risk according to the standardised approach in 2010, while some subsidiaries used the basic indicator approach. A shift to the most advanced reporting standard, Advanced Measurement Approaches, AMA, will be considered at a later date. Operational risk on business area1) - standardised approach
DnB NOR Bank ASARisk-weighted volumes Risk weights Capital requirements
Amounts in NOK million 31 Dec. 2010 31 Dec. 2010 31 Dec. 2010
Corporate finance 314 18 % 56
Trading and sales 3.921 18 % 706
Retail brokerage 521 12 % 63
Commercial banking 13.995 15 % 2.099
Retail banking 9.152 12 % 1.098
Payment end settelments 504 18 % 91
Agency services 182 15 % 27
Asset management 243 12 % 29
Total operational risk 28.832 4.169
DnB NOR Bank GroupRisk-weighted volumes Risk weights Capital requirements
Amounts in NOK million 31 Dec. 2010 31 Dec. 2010 31 Dec. 2010
Corporate finance 401 18 % 72
Trading and sales 3.985 18 % 717
Retail brokerage 532 12 % 64
Commercial banking 13.244 15 % 1.987
Retail banking 12.532 12 % 1.504
Payment end settelments 512 18 % 92
Agency services 173 15 % 26
Asset management 268 12 % 32
Total standardised approach 31.649 4.494
Total basic indicator approach 2.633 15 % 395
Total operational risk 34.282 4.889
DnB NOR GroupRisk-weighted volumes Risk weights Capital requirements
Amounts in NOK million 31 Dec. 2010 31 Dec. 2010 31 Dec. 2010
Corporate finance 393 18 % 71
Trading and sales 3.952 18 % 711
Retail brokerage 529 12 % 63
Commercial banking 13.112 15 % 1.967
Retail banking 12.532 12 % 1.504
Payment end settelments 509 18 % 92
Agency services 171 15 % 26
Asset management 268 12 % 32
Total standardised approach 31.467 4.466
Total basic indicator approach 3.284 15 % 493
Total operational risk 34.751 4.958
1) Business areas according to Kredittilsynet's definition
Page 12 of 40
Operational risk subsidiaries - standardised approach
Operational risk subsidiaries – basic indicator approach
Nordlandsbanken ASARisk-weighted volumes Risk weights Capital requirements
Amounts in NOK million 31 Dec. 2010 31 Dec. 2010 31 Dec. 2010
Trading and sales (14) 18 % (3)
Commercial banking 391 15 % 59
Retail banking 294 12 % 35
Agency services (9) 15 % (1)
Total operational risk 661 90
DnB NOR Boligkreditt ASRisk-weighted volume Risk weight Capital requirement
Amounts in NOK million 31 Dec. 2010 31 Dec. 2010 31 Dec. 2010
Retail banking 2.118 12 % 254
Risk-weighted volumes Risk weights Capital requirements
Amounts in NOK million 31 Dec. 2010 31 Dec. 2010 31 Dec. 2010
DnB NORD 2.150 15 % 322
DnB NOR Asset Management 651 15 % 98
Eksportfinans (40%) 367 15 % 55
DnB NOR Næringskreditt 117 15 % 18
Total operational risk 3.284 493
Page 13 of 40
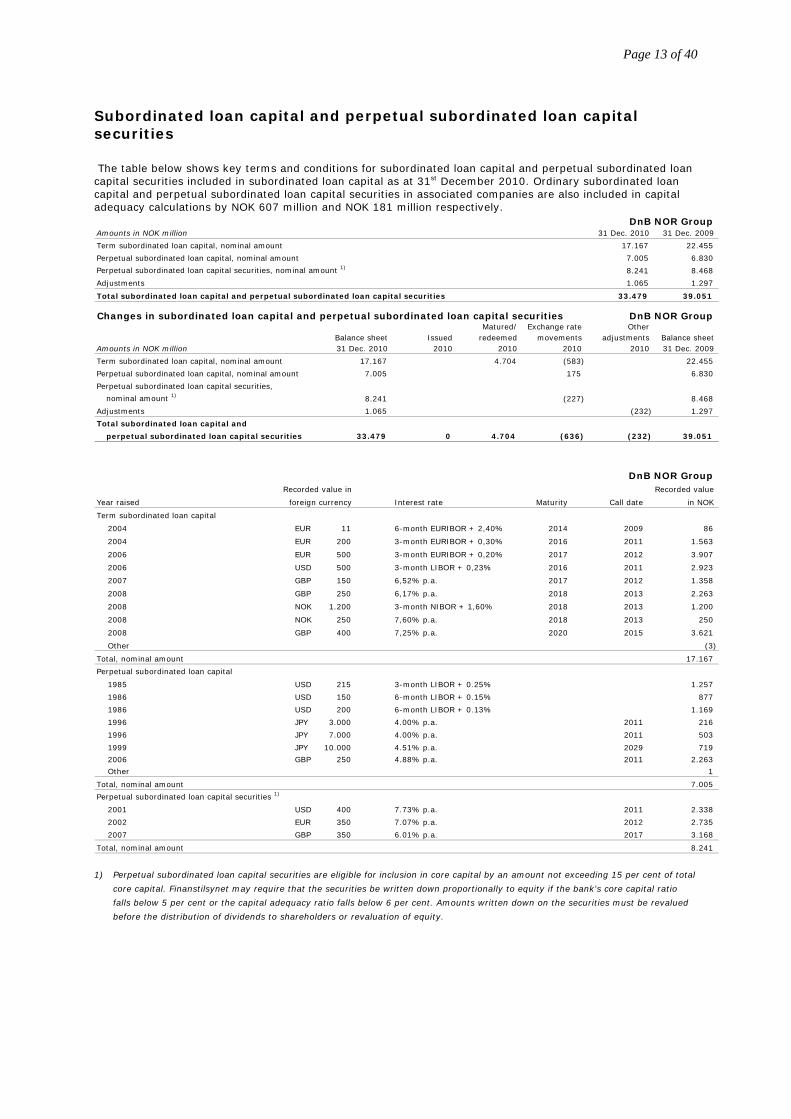
Subordinated loan capital and perpetual subordinated loan capital securities The table below shows key terms and conditions for subordinated loan capital and perpetual subordinated loan capital securities included in subordinated loan capital as at 31st December 2010. Ordinary subordinated loan capital and perpetual subordinated loan capital securities in associated companies are also included in capital adequacy calculations by NOK 607 million and NOK 181 million respectively.
1) Perpetual subordinated loan capital securities are eligible for inclusion in core capital by an amount not exceeding 15 per cent of total
core capital. Finanstilsynet may require that the securities be written down proportionally to equity if the bank's core capital ratio
falls below 5 per cent or the capital adequacy ratio falls below 6 per cent. Amounts written down on the securities must be revalued
before the distribution of dividends to shareholders or revaluation of equity.
DnB NOR Group Amounts in NOK million 31 Dec. 2010 31 Dec. 2009
Term subordinated loan capital, nominal amount 17.167 22.455
Perpetual subordinated loan capital, nominal amount 7.005 6.830
Perpetual subordinated loan capital securities, nominal amount 1) 8.241 8.468
Adjustments 1.065 1.297
Total subordinated loan capital and perpetual subordinated loan capital securities 33.479 39.051
Changes in subordinated loan capital and perpetual subordinated loan capital securities DnB NOR Group Matured/ Exchange rate Other
Balance sheet Issued redeemed movements adjustments Balance sheet Amounts in NOK million 31 Dec. 2010 2010 2010 2010 2010 31 Dec. 2009
Term subordinated loan capital, nominal amount 17.167 4.704 (583) 22.455
Perpetual subordinated loan capital, nominal amount 7.005 175 6.830
Perpetual subordinated loan capital securities,
nominal amount 1) 8.241 (227) 8.468
Adjustments 1.065 (232) 1.297
Total subordinated loan capital and
perpetual subordinated loan capital securities 33.479 0 4.704 (636) (232) 39.051
DnB NOR Group Recorded value in Recorded value
Year raised Interest rate Maturity in NOK
Term subordinated loan capital
2004 EUR 11 6-month EURIBOR + 2,40% 2014 2009 86
2004 EUR 200 3-month EURIBOR + 0,30% 2016 2011 1.563
2006 EUR 500 3-month EURIBOR + 0,20% 2017 2012 3.907
2006 USD 500 3-month LIBOR + 0,23% 2016 2011 2.923
2007 GBP 150 6,52% p.a. 2017 2012 1.358
2008 GBP 250 6,17% p.a. 2018 2013 2.263
2008 NOK 1.200 3-month NIBOR + 1,60% 2018 2013 1.200
2008 NOK 250 7,60% p.a. 2018 2013 250
2008 GBP 400 7,25% p.a. 2020 2015 3.621
Other (3)
Total, nominal amount 17.167
Perpetual subordinated loan capital
1985 USD 215 3-month LIBOR + 0.25% 1.257
1986 USD 150 6-month LIBOR + 0.15% 877
1986 USD 200 6-month LIBOR + 0.13% 1.169
1996 JPY 3.000 4.00% p.a. 2011 216
1996 JPY 7.000 4.00% p.a. 2011 503
1999 JPY 10.000 4.51% p.a. 2029 719
2006 GBP 250 4.88% p.a. 2011 2.263
Other 1
Total, nominal amount 7.005
Perpetual subordinated loan capital securities 1)
2001 USD 400 7.73% p.a. 2011 2.338
2002 EUR 350 7.07% p.a. 2012 2.735
2007 GBP 350 6.01% p.a. 2017 3.168
Total, nominal amount 8.241
foreign currency Call date
Page 14 of 40
Risk management and control, capitalisation The Board of Directors of DnB NOR ASA has a clearly stated goal to maintain a low overall risk profile, which is reflected in the DnB NOR Bank Group's aim to maintain at least an AA level rating for ordinary long-term debt. The profitability of DnB NOR will depend on the Group's ability to identify, manage and accurately price risk arising in connection with financial services. Organisation and authorisation structure
• Board of Directors. The Board of Directors of DnB NOR ASA sets long-term targets for the Group’s risk profile. The risk profile is operationalised through the risk management framework, including the establishment of authorisations. Risk-taking should take place within established limits.
• Authorisations. Authorisations must be in place for the extension of credit and for position and trading limits in all critical financial areas. All authorisations are personal. Authorisations and group limits are determined by the Board of Directors and can be delegated in the organisation, though any further delegation requires approval by an immediate superior.
• Annual review of limits. Risk limits are reviewed at least annually in connection with budget and planning processes.
• Independent risk management functions. Risk management functions and the development of risk management tools are undertaken by units that are independent of operations in the individual business areas.
Monitoring and use
• Accountability. All executives are responsible for risk within their own area of responsibility and must consequently be fully updated on the risk situation at all times.
• Risk reporting. Risk reporting in the Group ensures that all executives have the necessary information about current risk levels and future developments. To ensure high-quality, independent risk reports, responsibility for reporting is assigned to units that are independent of the operative units.
• Capital assessment. A summary and analysis of the Group's capital and risk situation is presented in a special risk report to the Board of Directors in DnB NOR ASA.
• Use of risk information. Risk is an integral part of the management and monitoring of business areas. Return on risk-adjusted capital is reflected in product pricing, profit calculations and in monitoring performance in the business areas.
Relevant risk measures
• A common risk measure for the Group. The Group's risk is measured in the form of risk-adjusted capital, calculated for main risk categories and for all of the Group's business areas.
• Supplementary risk measure. In addition, risk is followed up through supplementary risk measures adapted to operations in the various business areas, for example monitoring of positions relative to limits, key figures and portfolio risk targets.
Risk categories For risk management purposes, DnB NOR distinguishes between the following risk categories:
• Credit risk is the risk of losses due to failure on the part of the Group's counterparties or customers to meet their payment obligations towards the DnB NOR Group. Credit risk refers to all claims against counterparties or customers, including credit risk in trading operations, country risk and settlement risk.
• Market risk is the risk of losses or reduced future income due to fluctuations in market prices or exchange rates. The risk arises as a consequence of the bank's unhedged transactions and exposure in the foreign exchange, interest rate, commodity and equity markets.
• Liquidity risk is the risk that the Group will be unable to meet its obligations as they fall due, and risk that the Group will be unable to meet its liquidity obligations without a substantial rise in appurtenant costs. In a broader perspective, liquidity risk also includes the risk that the Group will be unable to finance increases in assets as its funding requirements rise.
• Market risk in life insurance is the risk that the return on financial assets will not be sufficient to meet the obligations specified in insurance policies.
• Insurance risk comprises risk in life insurance and risk in non-life insurance. Within life insurance, risk is related to changes in future insurance obligations due to changes in life expectancy and disability rates. Within non-life insurance, insurance risk comprises premium risk, reserve risk and natural disaster risk.
• Operational risk is the risk of losses due to deficiencies or errors in processes and systems, errors made by
Page 15 of 40
employees or external events.
• Business risk is the risk of losses due to changes in external factors such as the market situation or government regulations. This risk category also includes reputational risk.
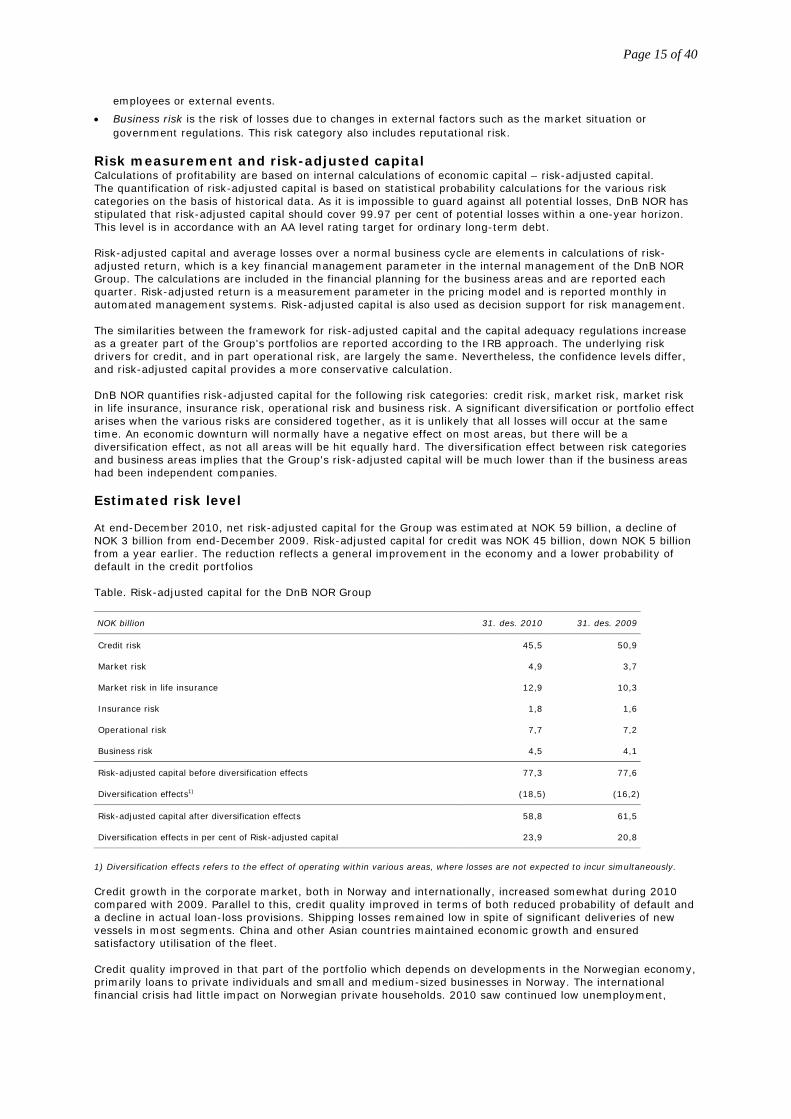
Risk measurement and risk-adjusted capital Calculations of profitability are based on internal calculations of economic capital – risk-adjusted capital. The quantification of risk-adjusted capital is based on statistical probability calculations for the various risk categories on the basis of historical data. As it is impossible to guard against all potential losses, DnB NOR has stipulated that risk-adjusted capital should cover 99.97 per cent of potential losses within a one-year horizon. This level is in accordance with an AA level rating target for ordinary long-term debt. Risk-adjusted capital and average losses over a normal business cycle are elements in calculations of risk-adjusted return, which is a key financial management parameter in the internal management of the DnB NOR Group. The calculations are included in the financial planning for the business areas and are reported each quarter. Risk-adjusted return is a measurement parameter in the pricing model and is reported monthly in automated management systems. Risk-adjusted capital is also used as decision support for risk management. The similarities between the framework for risk-adjusted capital and the capital adequacy regulations increase as a greater part of the Group's portfolios are reported according to the IRB approach. The underlying risk drivers for credit, and in part operational risk, are largely the same. Nevertheless, the confidence levels differ, and risk-adjusted capital provides a more conservative calculation. DnB NOR quantifies risk-adjusted capital for the following risk categories: credit risk, market risk, market risk in life insurance, insurance risk, operational risk and business risk. A significant diversification or portfolio effect arises when the various risks are considered together, as it is unlikely that all losses will occur at the same time. An economic downturn will normally have a negative effect on most areas, but there will be a diversification effect, as not all areas will be hit equally hard. The diversification effect between risk categories and business areas implies that the Group's risk-adjusted capital will be much lower than if the business areas had been independent companies. Estimated risk level At end-December 2010, net risk-adjusted capital for the Group was estimated at NOK 59 billion, a decline of NOK 3 billion from end-December 2009. Risk-adjusted capital for credit was NOK 45 billion, down NOK 5 billion from a year earlier. The reduction reflects a general improvement in the economy and a lower probability of default in the credit portfolios Table. Risk-adjusted capital for the DnB NOR Group
NOK billion 31. des. 2010 31. des. 2009
Credit risk 45,5 50,9
Market risk 4,9 3,7
Market risk in life insurance 12,9 10,3
Insurance risk 1,8 1,6
Operational risk 7,7 7,2
Business risk 4,5 4,1
Risk-adjusted capital before diversification effects 77,3 77,6
Diversification effects1) (18,5) (16,2)
Risk-adjusted capital after diversification effects 58,8 61,5
Diversification effects in per cent of Risk-adjusted capital 23,9 20,8
1) Diversification effects refers to the effect of operating within various areas, where losses are not expected to incur simultaneously. Credit growth in the corporate market, both in Norway and internationally, increased somewhat during 2010 compared with 2009. Parallel to this, credit quality improved in terms of both reduced probability of default and a decline in actual loan-loss provisions. Shipping losses remained low in spite of significant deliveries of new vessels in most segments. China and other Asian countries maintained economic growth and ensured satisfactory utilisation of the fleet. Credit quality improved in that part of the portfolio which depends on developments in the Norwegian economy, primarily loans to private individuals and small and medium-sized businesses in Norway. The international financial crisis had little impact on Norwegian private households. 2010 saw continued low unemployment,
Page 16 of 40
healthy wage growth, low housing loan rates and an increase in housing prices. There was stable growth in the housing loan portfolio during 2010. The Group is to some extent affected by the continued weak trend in the international economy, especially in the Baltic States. However, write-downs in DnB NORD were reduced in 2010, and the Baltic economies show signs of stabilisation. There was a moderate level of write-downs on the portfolio of loans to Norwegian companies, while there was a very low level of write-downs on loans to personal customers in Norway. During 2010, the Group made extensive efforts to ensure the value of problem commitments. A number of problem commitments were restructured, with a positive result. The uncertainty relating to DnB NORD will continue, and economic developments in the Baltic States will be vital to the level of write-downs. Risk-adjusted capital for market risk rose from NOK 3.7 billion at the end of 2009 to NOK 4.9 billion at end-December 2010. The increase mainly reflected a revaluation of equity investments. DnB NOR enjoyed a sound liquidity situation at end-December 2010. The average remaining term to maturity for the portfolio of senior bond debt was 3.6 years at end-December 2010, an increase from 3.0 years a year earlier. The Group aims to achieve a sound and stable maturity structure for funding over the next five years. Throughout 2010, the short-term funding markets were sound and stable for banks with good credit ratings, and the access to funding volumes with different maturities was close to normal. However, as the group of international banks which were considered to be well qualified grew during the year, competition for funding increased somewhat. Financially strong banks generally had good access to long-term funding. At times, however, uncertainty regarding European sovereign debt had pronounced effects on price levels, and the markets were thus still challenging at the end of the year. DnB NOR enjoyed a sound liquidity situation at end-December 2010. The average remaining term to maturity for the portfolio of senior bond debt was 3.6 years at end-December 2010, an increase from 3.0 years a year earlier. The Group aims to achieve a sound and stable maturity structure for funding over the next five years. The DnB NOR Group reported risk-adjusted capital for market risk in life insurance of NOK 12.9 billion at the end of 2010 and NOK 10.3 billion at end-December 2009. At the end of 2010, the average annual guaranteed return was 3.3 per cent. The yield on Norwegian 10-year government bonds declined from 4.2 per cent at year-end 2009 to 3.7 per cent at end-December 2010. In consequence, overall long-term financial risk in Vital increased somewhat. At end-December 2010, risk-adjusted capital for operational risk was estimated at NOK 7.7 billion. A total of 454 operational loss events were reported during 2010, causing an overall net loss of NOK 182 million. Potential losses relating to the same events represented just under NOK 1.3 billion, which was roughly on a level with previous years. The DnB NOR Group's risk-adjusted capital for insurance risk was NOK 1.8 billion at year-end 2010, compared with NOK 1.6 billion at end-December 2009. Insurance risk in life insurance primarily relates to the need for provisions for higher future insurance payments due to an increase in average life expectancy. At year-end 2010, risk-adjusted capital was estimated at NOK 1 billion, virtually unchanged from year-end 2009. Risk-adjusted capital in DnB NOR Skadeforsikring was estimated at NOK 0.8 billion. Risk-weighted volume included in the calculation of the formal capital adequacy requirement was NOK 1 028 billion at end-December 2010, down 2 per cent from 2009. The transitional rules which apply until year-end 2011 allow a maximum reduction in risk-weighted volume of 20 per cent. This transitional floor applied at year-end 2010. The Tier 1 capital ratio was 10.1 per cent at end-December 2010 and 9.3 per cent at year-end 2009, while the capital adequacy ratio was 12.4 per cent at year-end 2010.
Page 17 of 40
Information about risk categories
General information about credit risk
Non-performing commitments and write-downs
On each balance sheet date, the Group will consider whether there are objective indications that the financial assets have decreased in value. Objective indications of a decrease in value of loans include serious financial problems on the part of the debtor, non-payment or other serious breaches of contract, the probability that the debtor will enter into debt negotiations or other special circumstances that have occurred. The renegotiation of loan terms to ease the borrower's position is regarded as objective indications of a decrease in value. Impairment of other financial assets is recognised in the income statement according to the nature of the asset. If objective indications of a decrease in value can be found, write-downs on loans are calculated as the difference between the value of the loan in the balance sheet and the net present value of estimated future cash flows discounted by the effective interest rate. In accordance with IAS 39, the best estimate is used to assess future cash flows. Estimates of future cash flows are based on empirical data and discretionary assessments of future macroeconomic developments and developments in problem commitments, based on the situation on the balance sheet date. The estimates are the result of a process, which involves the business areas and central credit units and represents management's best estimate. When considering write-downs on loans, there will be an element of uncertainty with respect to the identification of impaired loans, the estimation of amounts and the timing of future cash flows, including collateral assessments. The effective interest rate used for discounting is not adjusted to reflect changes in the credit risk and terms of the loan due to objective indications of impairment being identified. Individual write-downs on loans reduce the value of the commitments in the balance sheet. Changes in the assessed value of loans during the period are recorded under "Write-downs on loans and guarantees". Loans and other commitments where payment terms are not complied with are classified as non-performing, unless the situation is considered temporary. Commitments are classified as non-performing no later than 90 days past the formal due date. Guarantees are considered to be defaulted once a claim has been made against the bank. Loans, guarantees etc. classified as high risk, without being in default, are subject to special monitoring and loss risk assessment. Loans, which have not been individually evaluated for impairment, are evaluated collectively in groups. Loans, which have been individually evaluated, but not written down, are also evaluated in groups. The evaluation is based on objective evidence of a decrease in value that has occurred on the balance sheet date and can be related to the group. Loans are grouped on the basis of similar risk and value characteristics in accordance with the division of customers into main sectors or industries and risk categories. The need for write-downs is estimated per customer group based on estimates of the general economic situation and loss experience for the respective customer groups. The economic situation is assessed by means of economic indicators for each customer group based on external information about the markets. Various parameters are used depending on the customer group in question. Key parameters are production gaps, which give an indication of capacity utilisation in the economy, and developments in housing prices and in shipping freight rates. The economic indicators that are used show a high level of correlation with past write-downs. Group write-downs reduce the value of the commitments in the balance sheet, and changes during the period are recorded under "Write-downs on loans and guarantees". Like individual write-downs, group write-downs are based on discounted cach flows. Cash flows are discounted on the basis of statistics derived from individual write-downs. Interest is calculated on commitments subject to group write-downs according to the same principles and experience base as for commitments evaluated on an individual basis. The tables below show the Group's commitment categories on and off the balance sheet and according to sector and geographical location. The tables also show total commitments including decreases in value and write-downs and average figures during the period. In addition, the commitment categories are broken down into residual maturities.
Page 18 of 40
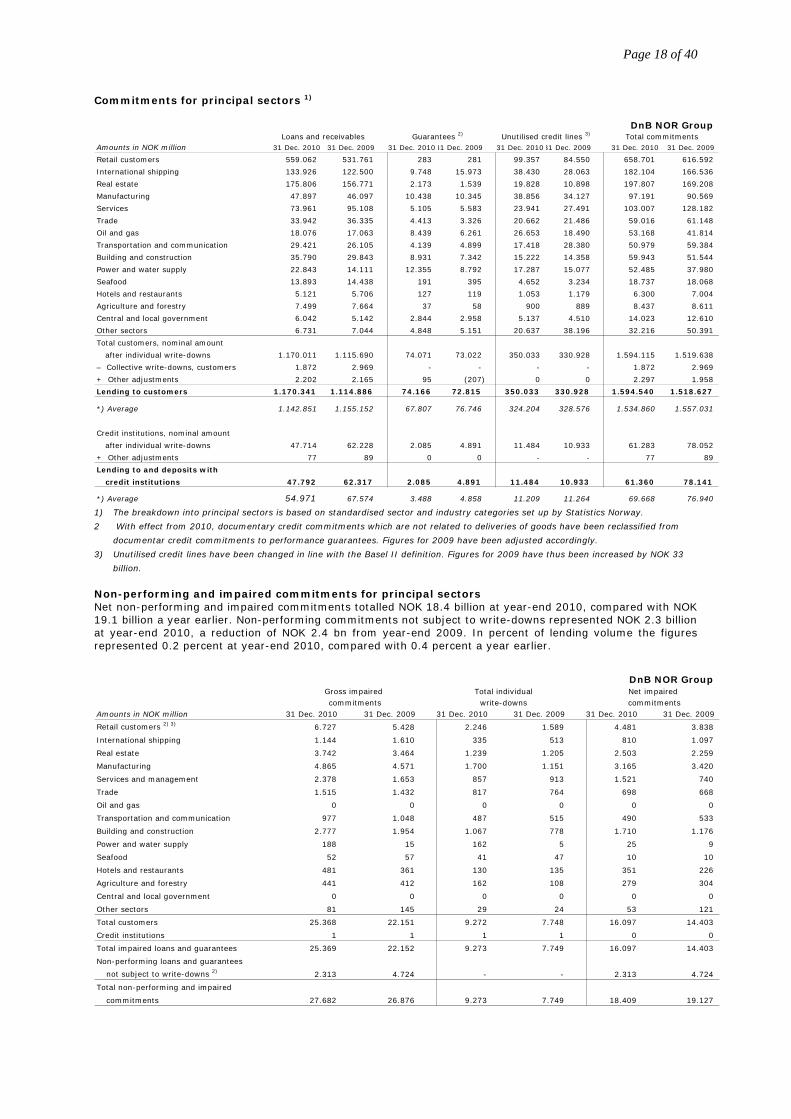
Commitments for principal sectors 1)
1) The breakdown into principal sectors is based on standardised sector and industry categories set up by Statistics Norway.
2 With effect from 2010, documentary credit commitments which are not related to deliveries of goods have been reclassified from
documentar credit commitments to performance guarantees. Figures for 2009 have been adjusted accordingly.
3) Unutilised credit lines have been changed in line with the Basel II definition. Figures for 2009 have thus been increased by NOK 33
billion.
Non-performing and impaired commitments for principal sectors Net non-performing and impaired commitments totalled NOK 18.4 billion at year-end 2010, compared with NOK 19.1 billion a year earlier. Non-performing commitments not subject to write-downs represented NOK 2.3 billion at year-end 2010, a reduction of NOK 2.4 bn from year-end 2009. In percent of lending volume the figures represented 0.2 percent at year-end 2010, compared with 0.4 percent a year earlier.
DnB NOR Group
Amounts in NOK million 31 Dec. 2010 31 Dec. 2009 31 Dec. 2010 31 Dec. 2009 31 Dec. 2010 31 Dec. 2009
Retail customers 2) 3) 6.727 5.428 2.246 1.589 4.481 3.838
International shipping 1.144 1.610 335 513 810 1.097
Real estate 3.742 3.464 1.239 1.205 2.503 2.259
Manufacturing 4.865 4.571 1.700 1.151 3.165 3.420
Services and management 2.378 1.653 857 913 1.521 740
Trade 1.515 1.432 817 764 698 668
Oil and gas 0 0 0 0 0 0
Transportation and communication 977 1.048 487 515 490 533
Building and construction 2.777 1.954 1.067 778 1.710 1.176
Power and water supply 188 15 162 5 25 9
Seafood 52 57 41 47 10 10
Hotels and restaurants 481 361 130 135 351 226
Agriculture and forestry 441 412 162 108 279 304
Central and local government 0 0 0 0 0 0
Other sectors 81 145 29 24 53 121
Total customers 25.368 22.151 9.272 7.748 16.097 14.403
Credit institutions 1 1 1 1 0 0
Total impaired loans and guarantees 25.369 22.152 9.273 7.749 16.097 14.403
Non-performing loans and guarantees
not subject to write-downs 2) 2.313 4.724 - - 2.313 4.724
Total non-performing and impaired
commitments 27.682 26.876 9.273 7.749 18.409 19.127
commitments write-downs commitmentsGross impaired Total individual Net impaired
DnB NOR Group
Amounts in NOK million 31 Dec. 2010 31 Dec. 2009 31 Dec. 201031 Dec. 2009 31 Dec. 201031 Dec. 2009 31 Dec. 2010 31 Dec. 2009
Retail customers 559.062 531.761 283 281 99.357 84.550 658.701 616.592
International shipping 133.926 122.500 9.748 15.973 38.430 28.063 182.104 166.536
Real estate 175.806 156.771 2.173 1.539 19.828 10.898 197.807 169.208
Manufacturing 47.897 46.097 10.438 10.345 38.856 34.127 97.191 90.569
Services 73.961 95.108 5.105 5.583 23.941 27.491 103.007 128.182
Trade 33.942 36.335 4.413 3.326 20.662 21.486 59.016 61.148
Oil and gas 18.076 17.063 8.439 6.261 26.653 18.490 53.168 41.814
Transportation and communication 29.421 26.105 4.139 4.899 17.418 28.380 50.979 59.384
Building and construction 35.790 29.843 8.931 7.342 15.222 14.358 59.943 51.544
Power and water supply 22.843 14.111 12.355 8.792 17.287 15.077 52.485 37.980
Seafood 13.893 14.438 191 395 4.652 3.234 18.737 18.068
Hotels and restaurants 5.121 5.706 127 119 1.053 1.179 6.300 7.004
Agriculture and forestry 7.499 7.664 37 58 900 889 8.437 8.611
Central and local government 6.042 5.142 2.844 2.958 5.137 4.510 14.023 12.610
Other sectors 6.731 7.044 4.848 5.151 20.637 38.196 32.216 50.391
Total customers, nominal amount
after individual write-downs 1.170.011 1.115.690 74.071 73.022 350.033 330.928 1.594.115 1.519.638
– Collective write-downs, customers 1.872 2.969 - - - - 1.872 2.969
+ Other adjustments 2.202 2.165 95 (207) 0 0 2.297 1.958
Lending to customers 1.170.341 1.114.886 74.166 72.815 350.033 330.928 1.594.540 1.518.627
*) Average 1.142.851 1.155.152 67.807 76.746 324.204 328.576 1.534.860 1.557.031
Credit institutions, nominal amount
after individual write-downs 47.714 62.228 2.085 4.891 11.484 10.933 61.283 78.052
+ Other adjustments 77 89 0 0 - - 77 89
Lending to and deposits with
credit institutions 47.792 62.317 2.085 4.891 11.484 10.933 61.360 78.141
*) Average 54.971 67.574 3.488 4.858 11.209 11.264 69.668 76.940
Loans and receivables Guarantees 2) Unutilised credit lines 3) Total commitments
Page 19 of 40
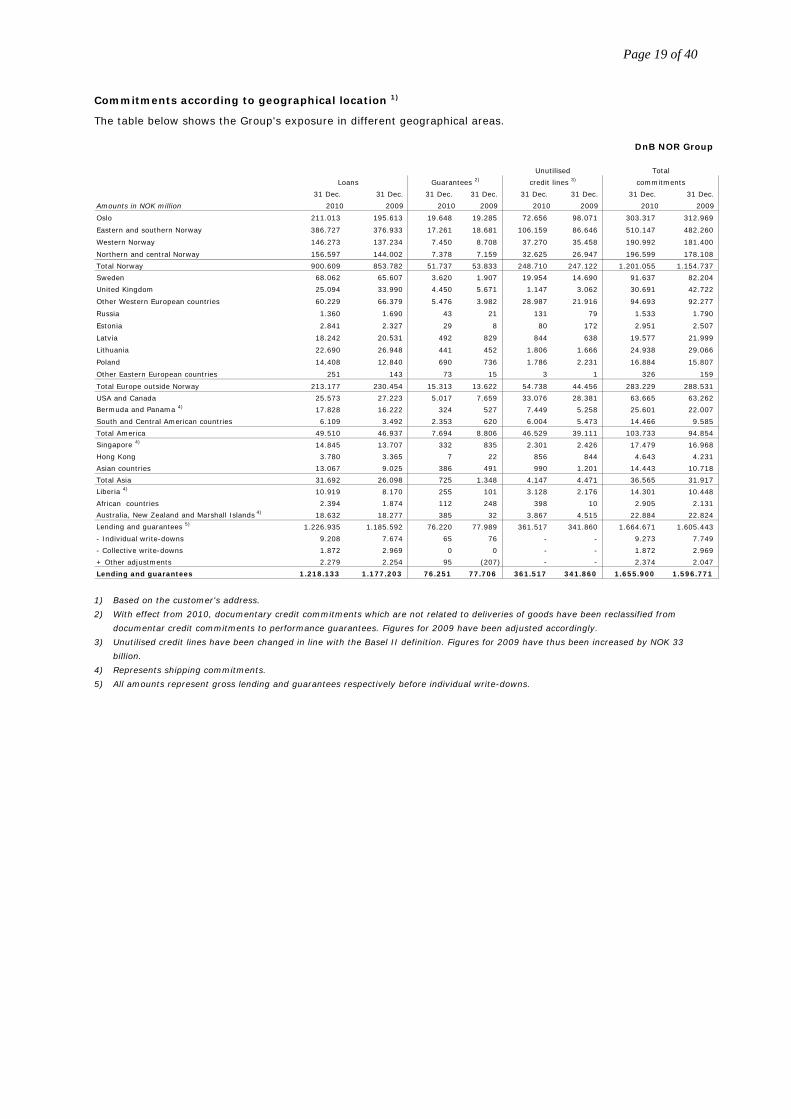
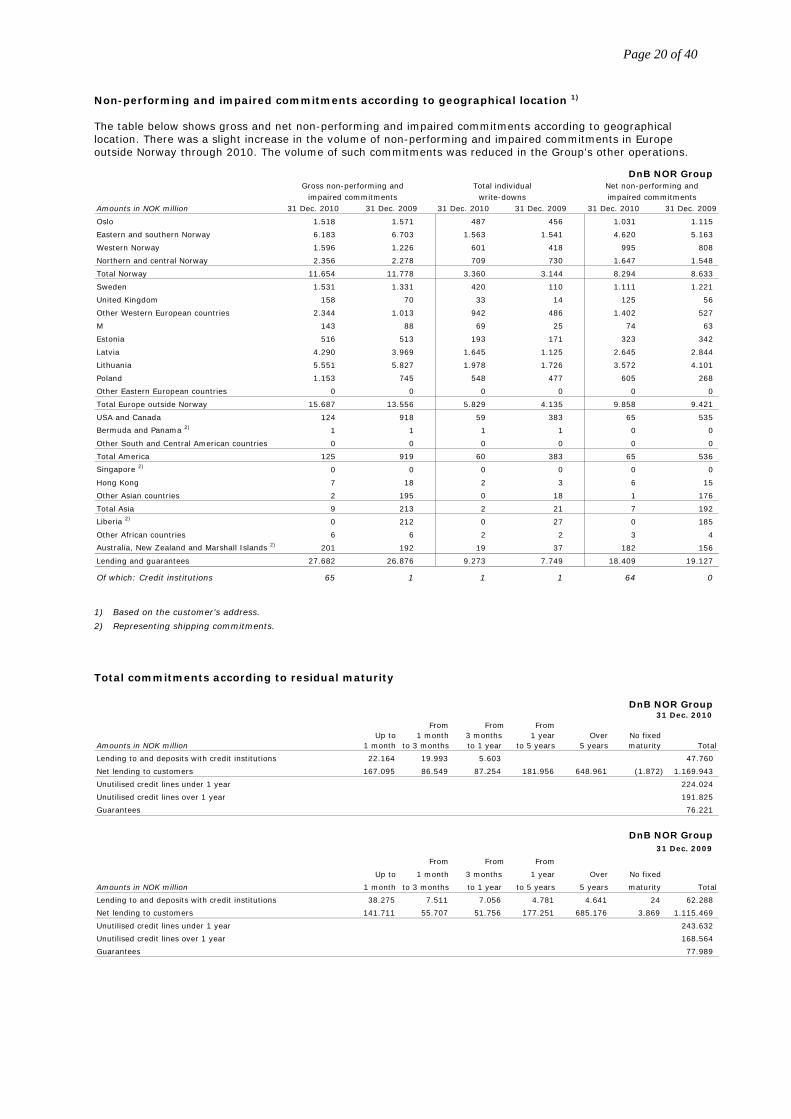
Commitments according to geographical location 1)
The table below shows the Group's exposure in different geographical areas.
1) Based on the customer's address.
2) With effect from 2010, documentary credit commitments which are not related to deliveries of goods have been reclassified from
documentar credit commitments to performance guarantees. Figures for 2009 have been adjusted accordingly.
3) Unutilised credit lines have been changed in line with the Basel II definition. Figures for 2009 have thus been increased by NOK 33
billion.
4) Represents shipping commitments.
5) All amounts represent gross lending and guarantees respectively before individual write-downs.
DnB NOR Group
31 Dec. 31 Dec. 31 Dec. 31 Dec. 31 Dec. 31 Dec. 31 Dec. 31 Dec.
Amounts in NOK million 2010 2009 2010 2009 2010 2009 2010 2009
Oslo 211.013 195.613 19.648 19.285 72.656 98.071 303.317 312.969
Eastern and southern Norway 386.727 376.933 17.261 18.681 106.159 86.646 510.147 482.260
Western Norway 146.273 137.234 7.450 8.708 37.270 35.458 190.992 181.400
Northern and central Norway 156.597 144.002 7.378 7.159 32.625 26.947 196.599 178.108
Total Norway 900.609 853.782 51.737 53.833 248.710 247.122 1.201.055 1.154.737
Sweden 68.062 65.607 3.620 1.907 19.954 14.690 91.637 82.204
United Kingdom 25.094 33.990 4.450 5.671 1.147 3.062 30.691 42.722
Other Western European countries 60.229 66.379 5.476 3.982 28.987 21.916 94.693 92.277
Russia 1.360 1.690 43 21 131 79 1.533 1.790
Estonia 2.841 2.327 29 8 80 172 2.951 2.507
Latvia 18.242 20.531 492 829 844 638 19.577 21.999
Lithuania 22.690 26.948 441 452 1.806 1.666 24.938 29.066
Poland 14.408 12.840 690 736 1.786 2.231 16.884 15.807
Other Eastern European countries 251 143 73 15 3 1 326 159
Total Europe outside Norway 213.177 230.454 15.313 13.622 54.738 44.456 283.229 288.531
USA and Canada 25.573 27.223 5.017 7.659 33.076 28.381 63.665 63.262
Bermuda and Panama 4) 17.828 16.222 324 527 7.449 5.258 25.601 22.007
South and Central American countries 6.109 3.492 2.353 620 6.004 5.473 14.466 9.585
Total America 49.510 46.937 7.694 8.806 46.529 39.111 103.733 94.854
Singapore 4) 14.845 13.707 332 835 2.301 2.426 17.479 16.968
Hong Kong 3.780 3.365 7 22 856 844 4.643 4.231
Asian countries 13.067 9.025 386 491 990 1.201 14.443 10.718
Total Asia 31.692 26.098 725 1.348 4.147 4.471 36.565 31.917
Liberia 4) 10.919 8.170 255 101 3.128 2.176 14.301 10.448
African countries 2.394 1.874 112 248 398 10 2.905 2.131
Australia, New Zealand and Marshall Islands 4) 18.632 18.277 385 32 3.867 4.515 22.884 22.824
Lending and guarantees 5) 1.226.935 1.185.592 76.220 77.989 361.517 341.860 1.664.671 1.605.443
- Individual write-downs 9.208 7.674 65 76 - - 9.273 7.749
- Collective write-downs 1.872 2.969 0 0 - - 1.872 2.969
+ Other adjustments 2.279 2.254 95 (207) - - 2.374 2.047
Lending and guarantees 1.218.133 1.177.203 76.251 77.706 361.517 341.860 1.655.900 1.596.771
Loans Guarantees 2) credit lines 3) commitments
Unutilised Total
Page 20 of 40
Non-performing and impaired commitments according to geographical location 1)
The table below shows gross and net non-performing and impaired commitments according to geographical location. There was a slight increase in the volume of non-performing and impaired commitments in Europe outside Norway through 2010. The volume of such commitments was reduced in the Group's other operations.
1) Based on the customer’s address.
2) Representing shipping commitments.
Total commitments according to residual maturity
DnB NOR Group 31 Dec. 2010
From From From Up to 1 month 3 months 1 year Over No fixed
Amounts in NOK million 1 month to 3 months to 1 year to 5 years 5 years maturity Total
Lending to and deposits with credit institutions 22.164 19.993 5.603 47.760
Net lending to customers 167.095 86.549 87.254 181.956 648.961 (1.872) 1.169.943
Unutilised credit lines under 1 year 224.024
Unutilised credit lines over 1 year 191.825
Guarantees 76.221
DnB NOR Group 31 Dec. 2009
From From From
Up to 1 month 3 months 1 year Over No fixed
Amounts in NOK million 1 month to 3 months to 1 year to 5 years 5 years maturity Total
Lending to and deposits with credit institutions 38.275 7.511 7.056 4.781 4.641 24 62.288
Net lending to customers 141.711 55.707 51.756 177.251 685.176 3.869 1.115.469
Unutilised credit lines under 1 year 243.632
Unutilised credit lines over 1 year 168.564
Guarantees 77.989
DnB NOR Group
Amounts in NOK million 31 Dec. 2010 31 Dec. 2009 31 Dec. 2010 31 Dec. 2009 31 Dec. 2010 31 Dec. 2009
Oslo 1.518 1.571 487 456 1.031 1.115
Eastern and southern Norway 6.183 6.703 1.563 1.541 4.620 5.163
Western Norway 1.596 1.226 601 418 995 808
Northern and central Norway 2.356 2.278 709 730 1.647 1.548
Total Norway 11.654 11.778 3.360 3.144 8.294 8.633
Sweden 1.531 1.331 420 110 1.111 1.221
United Kingdom 158 70 33 14 125 56
Other Western European countries 2.344 1.013 942 486 1.402 527
M 143 88 69 25 74 63
Estonia 516 513 193 171 323 342
Latvia 4.290 3.969 1.645 1.125 2.645 2.844
Lithuania 5.551 5.827 1.978 1.726 3.572 4.101
Poland 1.153 745 548 477 605 268
Other Eastern European countries 0 0 0 0 0 0
Total Europe outside Norway 15.687 13.556 5.829 4.135 9.858 9.421
USA and Canada 124 918 59 383 65 535
Bermuda and Panama 2) 1 1 1 1 0 0
Other South and Central American countries 0 0 0 0 0 0
Total America 125 919 60 383 65 536
Singapore 2) 0 0 0 0 0 0
Hong Kong 7 18 2 3 6 15
Other Asian countries 2 195 0 18 1 176
Total Asia 9 213 2 21 7 192
Liberia 2) 0 212 0 27 0 185
Other African countries 6 6 2 2 3 4
Australia, New Zealand and Marshall Islands 2) 201 192 19 37 182 156
Lending and guarantees 27.682 26.876 9.273 7.749 18.409 19.127
Of which: Credit institutions 65 1 1 1 64 0
impaired commitments write-downs impaired commitmentsGross non-performing and Total individual Net non-performing and
Page 21 of 40
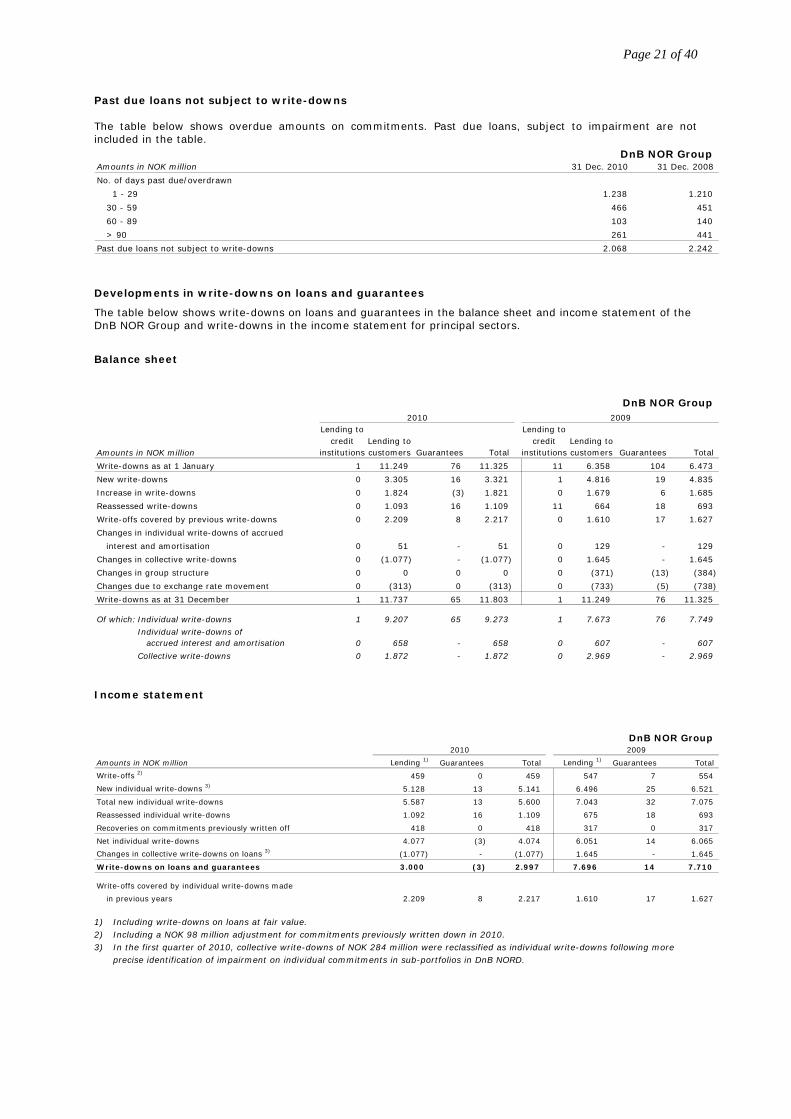
Past due loans not subject to write-downs The table below shows overdue amounts on commitments. Past due loans, subject to impairment are not included in the table.
Developments in write-downs on loans and guarantees
The table below shows write-downs on loans and guarantees in the balance sheet and income statement of the DnB NOR Group and write-downs in the income statement for principal sectors.
Balance sheet
Income statement
1) Including write-downs on loans at fair value. 2) Including a NOK 98 million adjustment for commitments previously written down in 2010. 3) In the first quarter of 2010, collective write-downs of NOK 284 million were reclassified as individual write-downs following more
precise identification of impairment on individual commitments in sub-portfolios in DnB NORD.
DnB NOR Group
Lending to Lending to credit Lending to credit Lending to
Amounts in NOK million institutions customers Guarantees Total institutions customers Guarantees Total
Write-downs as at 1 January 1 11.249 76 11.325 11 6.358 104 6.473
New write-downs 0 3.305 16 3.321 1 4.816 19 4.835
Increase in write-downs 0 1.824 (3) 1.821 0 1.679 6 1.685
Reassessed write-downs 0 1.093 16 1.109 11 664 18 693
Write-offs covered by previous write-downs 0 2.209 8 2.217 0 1.610 17 1.627
Changes in individual write-downs of accrued
interest and amortisation 0 51 - 51 0 129 - 129
Changes in collective write-downs 0 (1.077) - (1.077) 0 1.645 - 1.645
Changes in group structure 0 0 0 0 0 (371) (13) (384)
Changes due to exchange rate movement 0 (313) 0 (313) 0 (733) (5) (738)
Write-downs as at 31 December 1 11.737 65 11.803 1 11.249 76 11.325
Of which: Individual write-downs 1 9.207 65 9.273 1 7.673 76 7.749
Individual write-downs of accrued interest and amortisation 0 658 - 658 0 607 - 607
Collective write-downs 0 1.872 - 1.872 0 2.969 - 2.969
2010 2009
DnB NOR Group
Amounts in NOK million Lending 1) Guarantees Total Lending 1) Guarantees Total
Write-offs 2) 459 0 459 547 7 554
New individual write-downs 3) 5.128 13 5.141 6.496 25 6.521
Total new individual write-downs 5.587 13 5.600 7.043 32 7.075
Reassessed individual write-downs 1.092 16 1.109 675 18 693
Recoveries on commitments previously written off 418 0 418 317 0 317
Net individual write-downs 4.077 (3) 4.074 6.051 14 6.065
Changes in collective write-downs on loans 3) (1.077) - (1.077) 1.645 - 1.645
Write-downs on loans and guarantees 3.000 (3) 2.997 7.696 14 7.710
Write-offs covered by individual write-downs made
in previous years 2.209 8 2.217 1.610 17 1.627
2010 2009
DnB NOR Group Amounts in NOK million 31 Dec. 2010 31 Dec. 2008
No. of days past due/overdrawn
1 - 29 1.238 1.210
30 - 59 466 451
60 - 89 103 140
> 90 261 441
Past due loans not subject to write-downs 2.068 2.242
Page 22 of 40
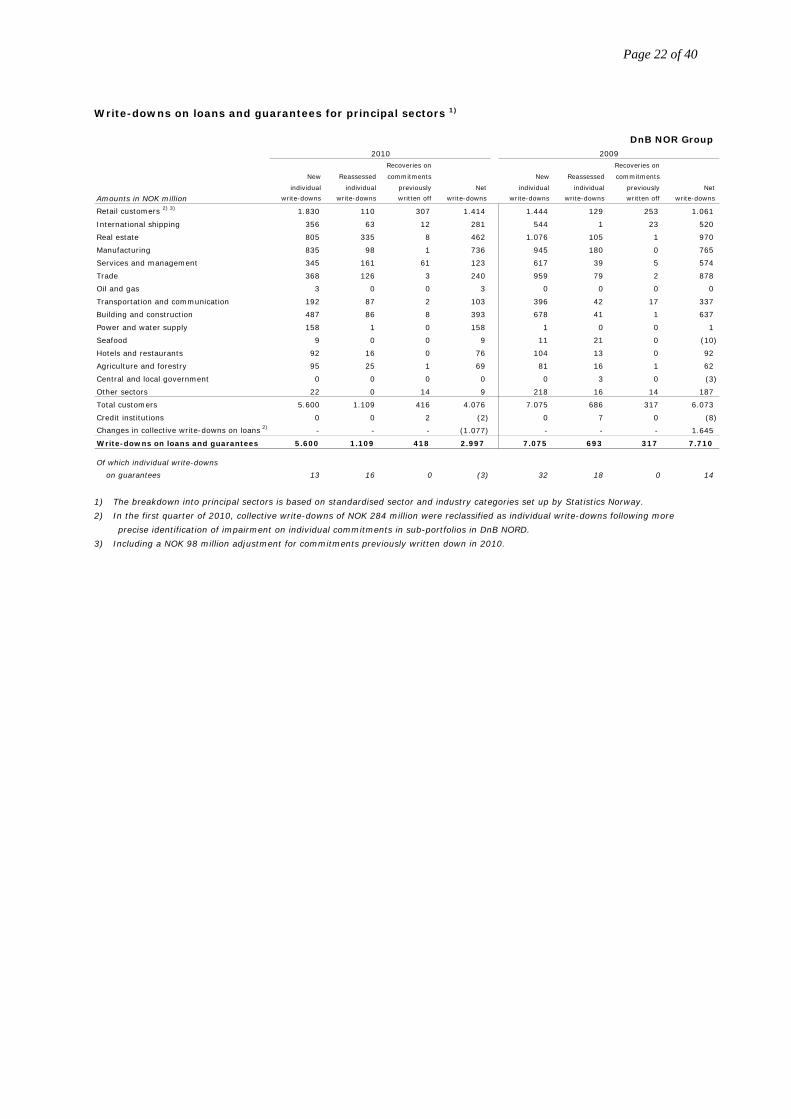
Write-downs on loans and guarantees for principal sectors 1)
1) The breakdown into principal sectors is based on standardised sector and industry categories set up by Statistics Norway.
2) In the first quarter of 2010, collective write-downs of NOK 284 million were reclassified as individual write-downs following more
precise identification of impairment on individual commitments in sub-portfolios in DnB NORD.
3) Including a NOK 98 million adjustment for commitments previously written down in 2010.
DnB NOR Group
Recoveries on Recoveries on
New Reassessed commitments New Reassessed commitments
individual individual previously Net individual individual previously Net
Amounts in NOK million write-downs write-downs written off write-downs write-downs write-downs written off write-downs
Retail customers 2) 3) 1.830 110 307 1.414 1.444 129 253 1.061
International shipping 356 63 12 281 544 1 23 520
Real estate 805 335 8 462 1.076 105 1 970
Manufacturing 835 98 1 736 945 180 0 765
Services and management 345 161 61 123 617 39 5 574
Trade 368 126 3 240 959 79 2 878
Oil and gas 3 0 0 3 0 0 0 0
Transportation and communication 192 87 2 103 396 42 17 337
Building and construction 487 86 8 393 678 41 1 637
Power and water supply 158 1 0 158 1 0 0 1
Seafood 9 0 0 9 11 21 0 (10)
Hotels and restaurants 92 16 0 76 104 13 0 92
Agriculture and forestry 95 25 1 69 81 16 1 62
Central and local government 0 0 0 0 0 3 0 (3)
Other sectors 22 0 14 9 218 16 14 187
Total customers 5.600 1.109 416 4.076 7.075 686 317 6.073
Credit institutions 0 0 2 (2) 0 7 0 (8)
Changes in collective write-downs on loans 2) - - - (1.077) - - - 1.645
Write-downs on loans and guarantees 5.600 1.109 418 2.997 7.075 693 317 7.710
Of which individual write-downs
on guarantees 13 16 0 (3) 32 18 0 14
2010 2009
Page 23 of 40
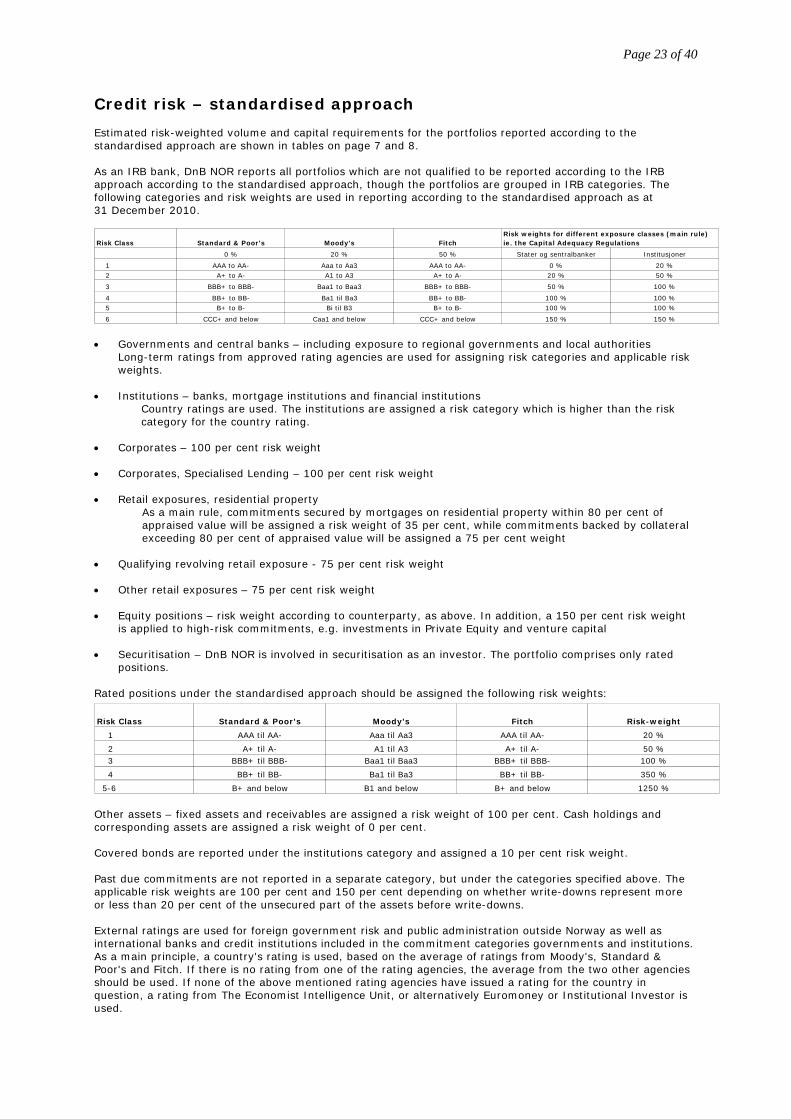
Credit risk – standardised approach Estimated risk-weighted volume and capital requirements for the portfolios reported according to the standardised approach are shown in tables on page 7 and 8. As an IRB bank, DnB NOR reports all portfolios which are not qualified to be reported according to the IRB approach according to the standardised approach, though the portfolios are grouped in IRB categories. The following categories and risk weights are used in reporting according to the standardised approach as at 31 December 2010.
• Governments and central banks – including exposure to regional governments and local authorities
Long-term ratings from approved rating agencies are used for assigning risk categories and applicable risk weights.
• Institutions – banks, mortgage institutions and financial institutions
Country ratings are used. The institutions are assigned a risk category which is higher than the risk category for the country rating.
• Corporates – 100 per cent risk weight
• Corporates, Specialised Lending – 100 per cent risk weight
• Retail exposures, residential property As a main rule, commitments secured by mortgages on residential property within 80 per cent of appraised value will be assigned a risk weight of 35 per cent, while commitments backed by collateral exceeding 80 per cent of appraised value will be assigned a 75 per cent weight
• Qualifying revolving retail exposure - 75 per cent risk weight
• Other retail exposures – 75 per cent risk weight
• Equity positions – risk weight according to counterparty, as above. In addition, a 150 per cent risk weight
is applied to high-risk commitments, e.g. investments in Private Equity and venture capital • Securitisation – DnB NOR is involved in securitisation as an investor. The portfolio comprises only rated
positions.
Rated positions under the standardised approach should be assigned the following risk weights:
Other assets – fixed assets and receivables are assigned a risk weight of 100 per cent. Cash holdings and corresponding assets are assigned a risk weight of 0 per cent. Covered bonds are reported under the institutions category and assigned a 10 per cent risk weight. Past due commitments are not reported in a separate category, but under the categories specified above. The applicable risk weights are 100 per cent and 150 per cent depending on whether write-downs represent more or less than 20 per cent of the unsecured part of the assets before write-downs. External ratings are used for foreign government risk and public administration outside Norway as well as international banks and credit institutions included in the commitment categories governments and institutions. As a main principle, a country's rating is used, based on the average of ratings from Moody's, Standard & Poor's and Fitch. If there is no rating from one of the rating agencies, the average from the two other agencies should be used. If none of the above mentioned rating agencies have issued a rating for the country in question, a rating from The Economist Intelligence Unit, or alternatively Euromoney or Institutional Investor is used.
Risk Class Standard & Poor's Moody's Fitch
0 % 20 % 50 % Stater og sentralbanker Institusjoner
1 AAA to AA- Aaa to Aa3 AAA to AA- 0 % 20 % 2 A+ to A- A1 to A3 A+ to A- 20 % 50 %
3 BBB+ to BBB- Baa1 to Baa3 BBB+ to BBB- 50 % 100 %
4 BB+ to BB- Ba1 til Ba3 BB+ to BB- 100 % 100 % 5 B+ to B- Bi til B3 B+ to B- 100 % 100 %
6 CCC+ and below Caa1 and below CCC+ and below 150 % 150 %
Risk weights for different exposure classes (main rule) ie. the Capital Adequacy Regulations
Risk Class Standard & Poor's Moody's Fitch Risk-weight
1 AAA til AA- Aaa til Aa3 AAA til AA- 20 %
2 A+ til A- A1 til A3 A+ til A- 50 % 3 BBB+ til BBB- Baa1 til Baa3 BBB+ til BBB- 100 %
4 BB+ til BB- Ba1 til Ba3 BB+ til BB- 350 %
5-6 B+ and below B1 and below B+ and below 1250 %
Page 24 of 40
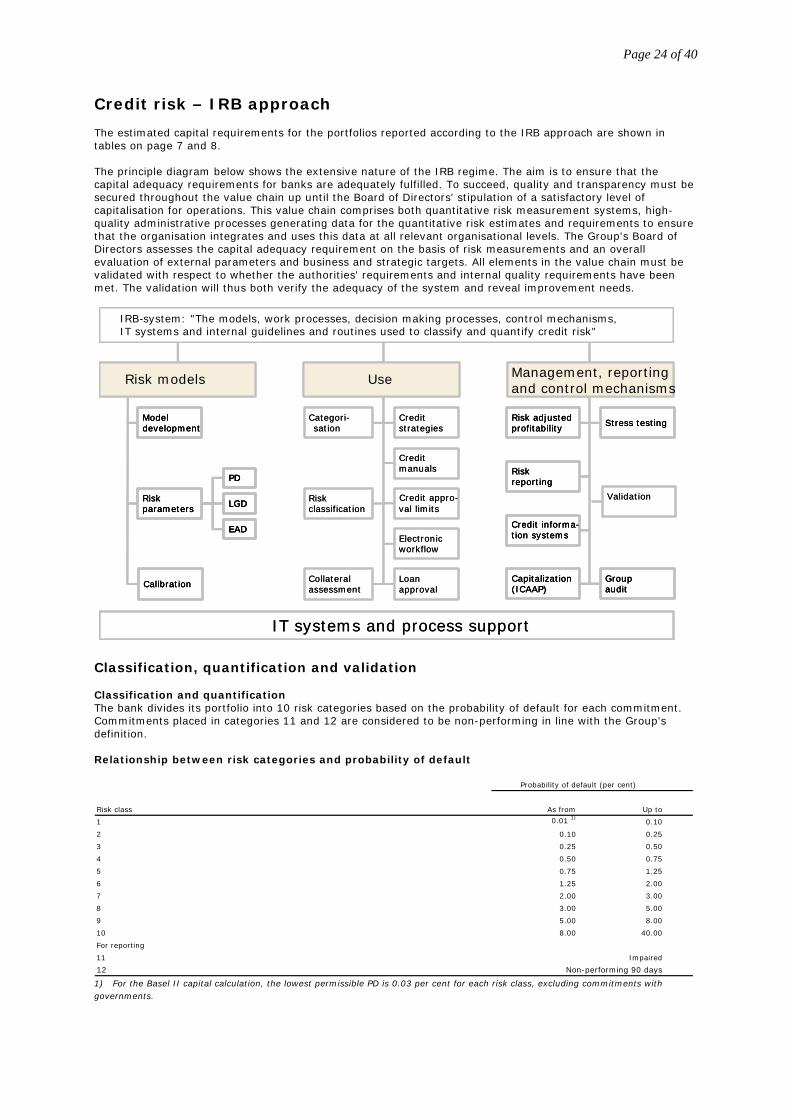
Credit risk – IRB approach The estimated capital requirements for the portfolios reported according to the IRB approach are shown in tables on page 7 and 8. The principle diagram below shows the extensive nature of the IRB regime. The aim is to ensure that the capital adequacy requirements for banks are adequately fulfilled. To succeed, quality and transparency must be secured throughout the value chain up until the Board of Directors' stipulation of a satisfactory level of capitalisation for operations. This value chain comprises both quantitative risk measurement systems, high-quality administrative processes generating data for the quantitative risk estimates and requirements to ensure that the organisation integrates and uses this data at all relevant organisational levels. The Group's Board of Directors assesses the capital adequacy requirement on the basis of risk measurements and an overall evaluation of external parameters and business and strategic targets. All elements in the value chain must be validated with respect to whether the authorities' requirements and internal quality requirements have been met. The validation will thus both verify the adequacy of the system and reveal improvement needs.
IT systems and process support
Use
Categori-sation
Riskclassification
Collateralassessment
Creditstrategies
Creditmanuals
Credit appro-val limits
Electronic workflow
Loan approval
Modeldevelopment
Riskparameters
PD
LGD
EAD
Calibration
Risk models
Capitalization(ICAAP)
Credit informa-tion systems
Riskreporting
Risk adjusted profitability
Groupaudit
Validation
Stress testing
Management, reporting and control mechanisms
IRB system: "The models, work processes, decision making processes, control mechanisms, IT systems and internal guidelines and routines used to classify and quantify credit risk"
-
IT systems and process support
Use
Categori-sation
Riskclassification
Collateralassessment
Creditstrategies
Creditmanuals
Credit appro-val limits
Electronic workflow
Loan approval
ModeldevelopmentModeldevelopment
Riskparameters
PD
LGD
EAD
Riskparameters
PD
LGD
EAD
PD
LGD
EAD
CalibrationCalibration
Risk models
Capitalization(ICAAP)Capitalization(ICAAP)
Credit informa-tion systemsCredit informa-tion systems
RiskreportingRiskreporting
Risk adjusted profitabilityRisk adjusted profitability
GroupauditGroupaudit
Validation
Stress testingStress testing
Management, reporting and control mechanisms
IRB system: "The models, work processes, decision making processes, control mechanisms, IT systems and internal guidelines and routines used to classify and quantify credit risk"
-
Classification, quantification and validation Classification and quantification The bank divides its portfolio into 10 risk categories based on the probability of default for each commitment. Commitments placed in categories 11 and 12 are considered to be non-performing in line with the Group's definition. Relationship between risk categories and probability of default
Risk class As from Up to
1 0.01 1)0.10
2 0.10 0.25
3 0.25 0.50
4 0.50 0.75
5 0.75 1.25
6 1.25 2.00
7 2.00 3.00
8 3.00 5.00
9 5.00 8.00
10 8.00 40.00
For reporting
11 Impaired
12 Non-performing 90 days
Probability of default (per cent)
1) For the Basel II capital calculation, the lowest permissible PD is 0.03 per cent for each risk class, excluding commitments with governments.
Page 25 of 40
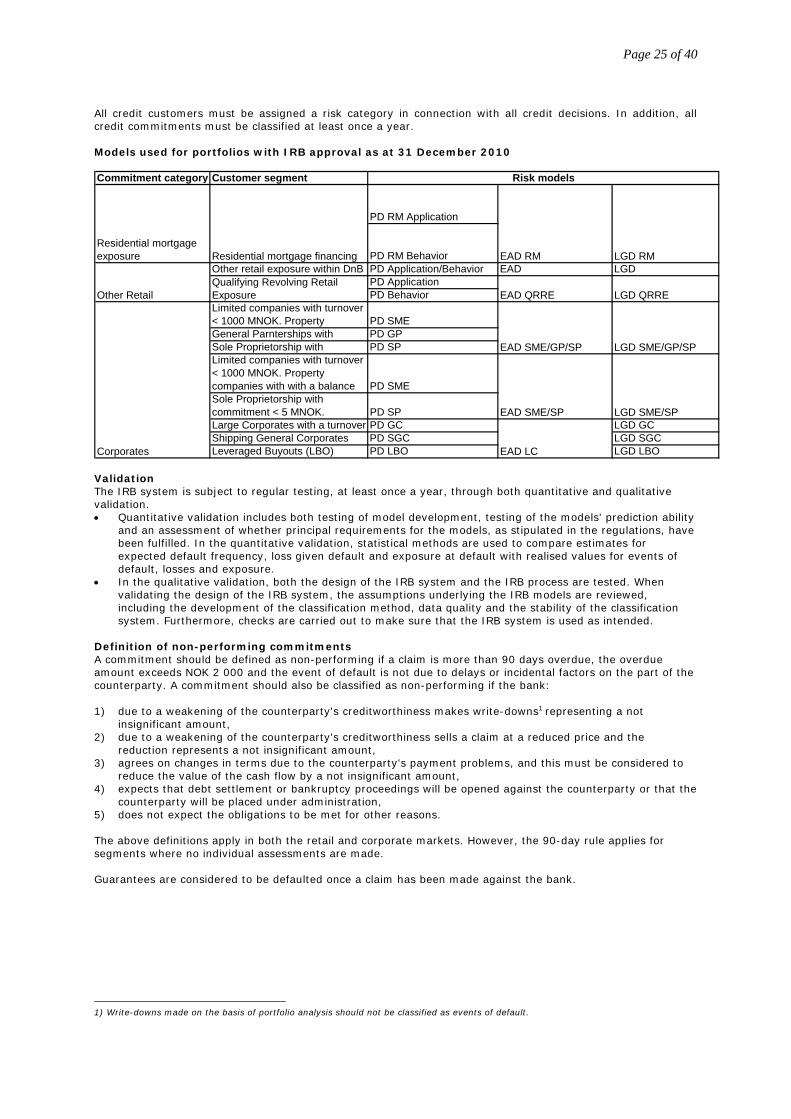
All credit customers must be assigned a risk category in connection with all credit decisions. In addition, all credit commitments must be classified at least once a year. Models used for portfolios with IRB approval as at 31 December 2010
Validation The IRB system is subject to regular testing, at least once a year, through both quantitative and qualitative validation. • Quantitative validation includes both testing of model development, testing of the models' prediction ability
and an assessment of whether principal requirements for the models, as stipulated in the regulations, have been fulfilled. In the quantitative validation, statistical methods are used to compare estimates for expected default frequency, loss given default and exposure at default with realised values for events of default, losses and exposure.
• In the qualitative validation, both the design of the IRB system and the IRB process are tested. When validating the design of the IRB system, the assumptions underlying the IRB models are reviewed, including the development of the classification method, data quality and the stability of the classification system. Furthermore, checks are carried out to make sure that the IRB system is used as intended.
Definition of non-performing commitments A commitment should be defined as non-performing if a claim is more than 90 days overdue, the overdue amount exceeds NOK 2 000 and the event of default is not due to delays or incidental factors on the part of the counterparty. A commitment should also be classified as non-performing if the bank: 1) due to a weakening of the counterparty's creditworthiness makes write-downs1 representing a not
insignificant amount, 2) due to a weakening of the counterparty's creditworthiness sells a claim at a reduced price and the
reduction represents a not insignificant amount, 3) agrees on changes in terms due to the counterparty's payment problems, and this must be considered to
reduce the value of the cash flow by a not insignificant amount, 4) expects that debt settlement or bankruptcy proceedings will be opened against the counterparty or that the
counterparty will be placed under administration, 5) does not expect the obligations to be met for other reasons. The above definitions apply in both the retail and corporate markets. However, the 90-day rule applies for segments where no individual assessments are made. Guarantees are considered to be defaulted once a claim has been made against the bank.
1) Write-downs made on the basis of portfolio analysis should not be classified as events of default.
Commitment category Customer segment
PD RM Application
PD RM BehaviorOther retail exposure within DnB PD Application/Behavior EAD LGD
PD Application PD Behavior
Limited companies with turnover < 1000 MNOK. Property PD SMEGeneral Parnterships with PD GPSole Proprietorship with PD SPLimited companies with turnover < 1000 MNOK. Property companies with with a balance PD SMESole Proprietorship with commitment < 5 MNOK. PD SPLarge Corporates with a turnover PD GC LGD GCShipping General Corporates PD SGC LGD SGCLeveraged Buyouts (LBO) PD LBO LGD LBOCorporates
EAD SME/GP/SP LGD SME/GP/SP
EAD SME/SP LGD SME/SP
EAD LC
Other RetailQualifying Revolving Retail Exposure EAD QRRE LGD QRRE
Residential mortgage exposure EAD RM LGD RM
Risk models
Residential mortgage financing
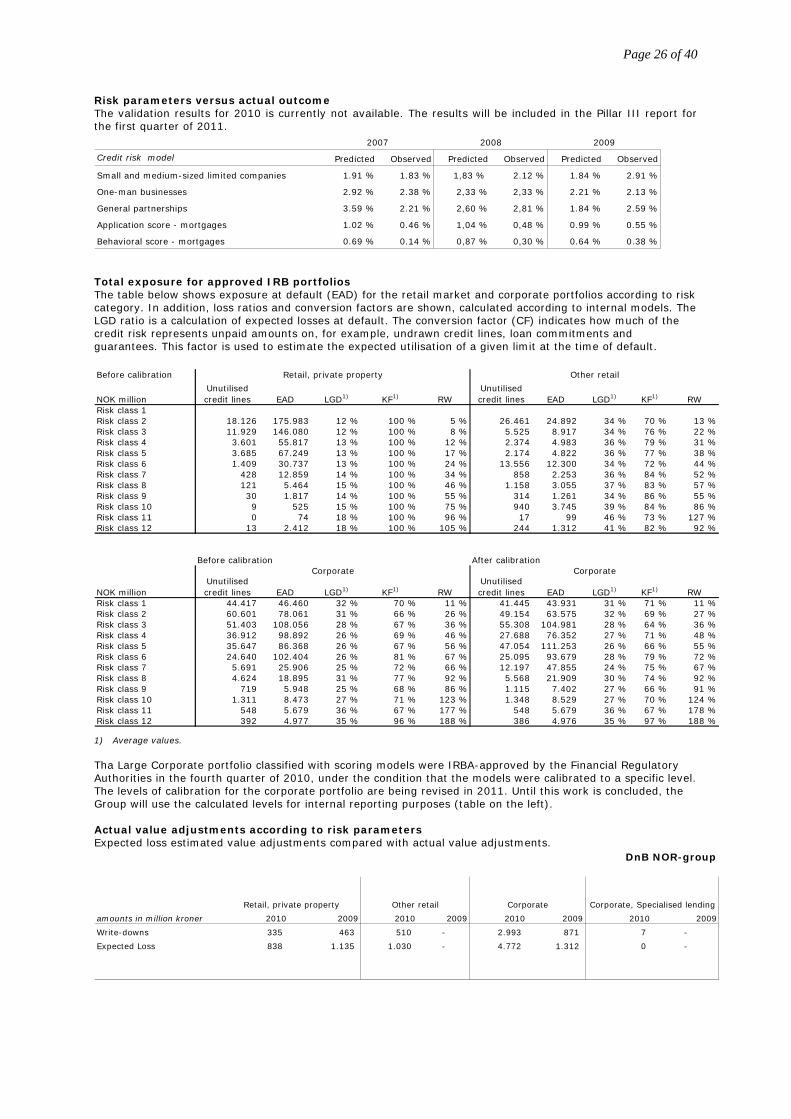
Page 26 of 40
Risk parameters versus actual outcome The validation results for 2010 is currently not available. The results will be included in the Pillar III report for the first quarter of 2011.
Credit risk model Predicted Observed Predicted Observed Predicted Observed
Small and medium-sized limited companies 1.91 % 1.83 % 1,83 % 2.12 % 1.84 % 2.91 %
One-man businesses 2.92 % 2.38 % 2,33 % 2,33 % 2.21 % 2.13 %
General partnerships 3.59 % 2.21 % 2,60 % 2,81 % 1.84 % 2.59 %
Application score - mortgages 1.02 % 0.46 % 1,04 % 0,48 % 0.99 % 0.55 %
Behavioral score - mortgages 0.69 % 0.14 % 0,87 % 0,30 % 0.64 % 0.38 %
2007 2008 2009
Total exposure for approved IRB portfolios The table below shows exposure at default (EAD) for the retail market and corporate portfolios according to risk category. In addition, loss ratios and conversion factors are shown, calculated according to internal models. The LGD ratio is a calculation of expected losses at default. The conversion factor (CF) indicates how much of the credit risk represents unpaid amounts on, for example, undrawn credit lines, loan commitments and guarantees. This factor is used to estimate the expected utilisation of a given limit at the time of default.
1) Average values. Tha Large Corporate portfolio classified with scoring models were IRBA-approved by the Financial Regulatory Authorities in the fourth quarter of 2010, under the condition that the models were calibrated to a specific level. The levels of calibration for the corporate portfolio are being revised in 2011. Until this work is concluded, the Group will use the calculated levels for internal reporting purposes (table on the left). Actual value adjustments according to risk parameters
Expected loss estimated value adjustments compared with actual value adjustments.
DnB NOR-group
amounts in million kroner 2010 2009 2010 2009 2010 2009 2010 2009
Write-downs 335 463 510 - 2.993 871 7 -
Expected Loss 838 1.135 1.030 - 4.772 1.312 0 -
Retail, private property Other retail Corporate Corporate, Specialised lending
Before calibration
NOK millionUnutilisedcredit lines EAD LGD1) KF1) RW
Unutilisedcredit lines EAD LGD1) KF1) RW
Risk class 1Risk class 2 18.126 175.983 12 % 100 % 5 % 26.461 24.892 34 % 70 % 13 %Risk class 3 11.929 146.080 12 % 100 % 8 % 5.525 8.917 34 % 76 % 22 %Risk class 4 3.601 55.817 13 % 100 % 12 % 2.374 4.983 36 % 79 % 31 %Risk class 5 3.685 67.249 13 % 100 % 17 % 2.174 4.822 36 % 77 % 38 %Risk class 6 1.409 30.737 13 % 100 % 24 % 13.556 12.300 34 % 72 % 44 %Risk class 7 428 12.859 14 % 100 % 34 % 858 2.253 36 % 84 % 52 %Risk class 8 121 5.464 15 % 100 % 46 % 1.158 3.055 37 % 83 % 57 %Risk class 9 30 1.817 14 % 100 % 55 % 314 1.261 34 % 86 % 55 %Risk class 10 9 525 15 % 100 % 75 % 940 3.745 39 % 84 % 86 %Risk class 11 0 74 18 % 100 % 96 % 17 99 46 % 73 % 127 %Risk class 12 13 2.412 18 % 100 % 105 % 244 1.312 41 % 82 % 92 %
Before calibration After calibration
NOK millionUnutilisedcredit lines EAD LGD1) KF1) RW
Unutilisedcredit lines EAD LGD1) KF1) RW
Risk class 1 44.417 46.460 32 % 70 % 11 % 41.445 43.931 31 % 71 % 11 %Risk class 2 60.601 78.061 31 % 66 % 26 % 49.154 63.575 32 % 69 % 27 %Risk class 3 51.403 108.056 28 % 67 % 36 % 55.308 104.981 28 % 64 % 36 %Risk class 4 36.912 98.892 26 % 69 % 46 % 27.688 76.352 27 % 71 % 48 %Risk class 5 35.647 86.368 26 % 67 % 56 % 47.054 111.253 26 % 66 % 55 %Risk class 6 24.640 102.404 26 % 81 % 67 % 25.095 93.679 28 % 79 % 72 %Risk class 7 5.691 25.906 25 % 72 % 66 % 12.197 47.855 24 % 75 % 67 %Risk class 8 4.624 18.895 31 % 77 % 92 % 5.568 21.909 30 % 74 % 92 %Risk class 9 719 5.948 25 % 68 % 86 % 1.115 7.402 27 % 66 % 91 %Risk class 10 1.311 8.473 27 % 71 % 123 % 1.348 8.529 27 % 70 % 124 %Risk class 11 548 5.679 36 % 67 % 177 % 548 5.679 36 % 67 % 178 %Risk class 12 392 4.977 35 % 96 % 188 % 386 4.976 35 % 97 % 188 %
Retail, private property Other retail
Corporate Corporate
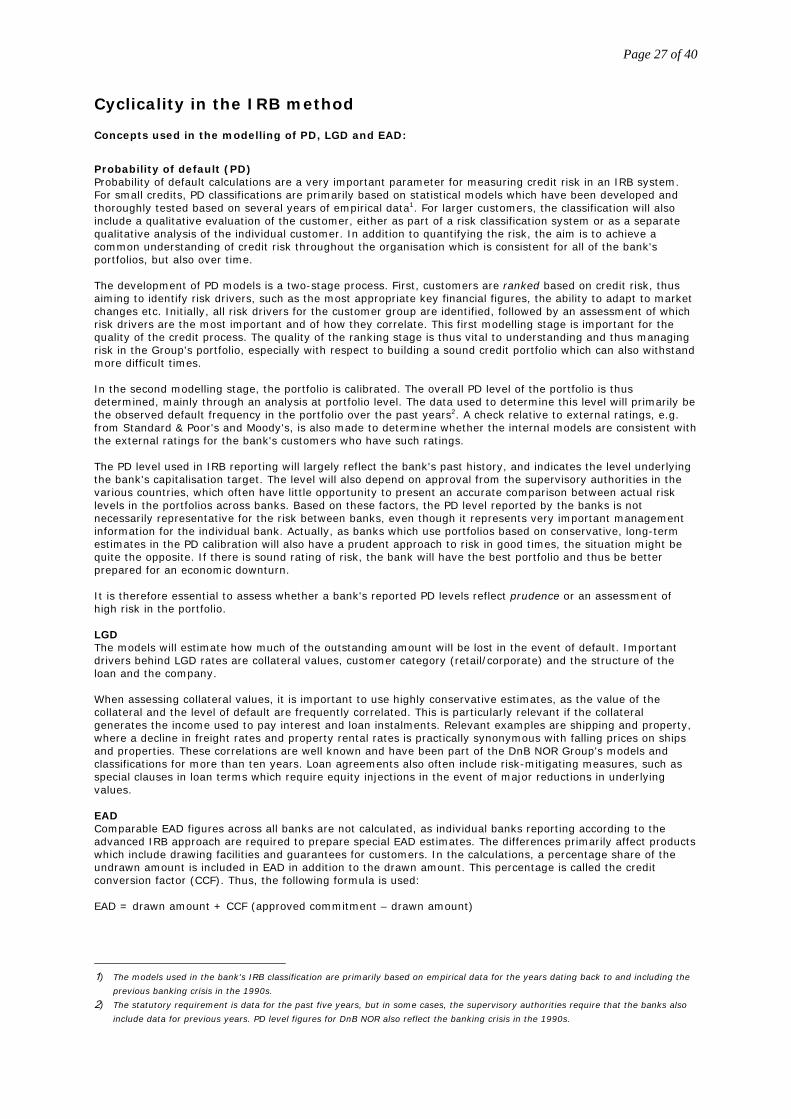
Page 27 of 40
Cyclicality in the IRB method
Concepts used in the modelling of PD, LGD and EAD:
Probability of default (PD) Probability of default calculations are a very important parameter for measuring credit risk in an IRB system. For small credits, PD classifications are primarily based on statistical models which have been developed and thoroughly tested based on several years of empirical data1. For larger customers, the classification will also include a qualitative evaluation of the customer, either as part of a risk classification system or as a separate qualitative analysis of the individual customer. In addition to quantifying the risk, the aim is to achieve a common understanding of credit risk throughout the organisation which is consistent for all of the bank's portfolios, but also over time. The development of PD models is a two-stage process. First, customers are ranked based on credit risk, thus aiming to identify risk drivers, such as the most appropriate key financial figures, the ability to adapt to market changes etc. Initially, all risk drivers for the customer group are identified, followed by an assessment of which risk drivers are the most important and of how they correlate. This first modelling stage is important for the quality of the credit process. The quality of the ranking stage is thus vital to understanding and thus managing risk in the Group's portfolio, especially with respect to building a sound credit portfolio which can also withstand more difficult times. In the second modelling stage, the portfolio is calibrated. The overall PD level of the portfolio is thus determined, mainly through an analysis at portfolio level. The data used to determine this level will primarily be the observed default frequency in the portfolio over the past years2. A check relative to external ratings, e.g. from Standard & Poor's and Moody's, is also made to determine whether the internal models are consistent with the external ratings for the bank's customers who have such ratings. The PD level used in IRB reporting will largely reflect the bank's past history, and indicates the level underlying the bank's capitalisation target. The level will also depend on approval from the supervisory authorities in the various countries, which often have little opportunity to present an accurate comparison between actual risk levels in the portfolios across banks. Based on these factors, the PD level reported by the banks is not necessarily representative for the risk between banks, even though it represents very important management information for the individual bank. Actually, as banks which use portfolios based on conservative, long-term estimates in the PD calibration will also have a prudent approach to risk in good times, the situation might be quite the opposite. If there is sound rating of risk, the bank will have the best portfolio and thus be better prepared for an economic downturn. It is therefore essential to assess whether a bank's reported PD levels reflect prudence or an assessment of high risk in the portfolio. LGD The models will estimate how much of the outstanding amount will be lost in the event of default. Important drivers behind LGD rates are collateral values, customer category (retail/corporate) and the structure of the loan and the company. When assessing collateral values, it is important to use highly conservative estimates, as the value of the collateral and the level of default are frequently correlated. This is particularly relevant if the collateral generates the income used to pay interest and loan instalments. Relevant examples are shipping and property, where a decline in freight rates and property rental rates is practically synonymous with falling prices on ships and properties. These correlations are well known and have been part of the DnB NOR Group's models and classifications for more than ten years. Loan agreements also often include risk-mitigating measures, such as special clauses in loan terms which require equity injections in the event of major reductions in underlying values. EAD Comparable EAD figures across all banks are not calculated, as individual banks reporting according to the advanced IRB approach are required to prepare special EAD estimates. The differences primarily affect products which include drawing facilities and guarantees for customers. In the calculations, a percentage share of the undrawn amount is included in EAD in addition to the drawn amount. This percentage is called the credit conversion factor (CCF). Thus, the following formula is used: EAD = drawn amount + CCF (approved commitment – drawn amount)
1) The models used in the bank's IRB classification are primarily based on empirical data for the years dating back to and including the
previous banking crisis in the 1990s.
2) The statutory requirement is data for the past five years, but in some cases, the supervisory authorities require that the banks also
include data for previous years. PD level figures for DnB NOR also reflect the banking crisis in the 1990s.
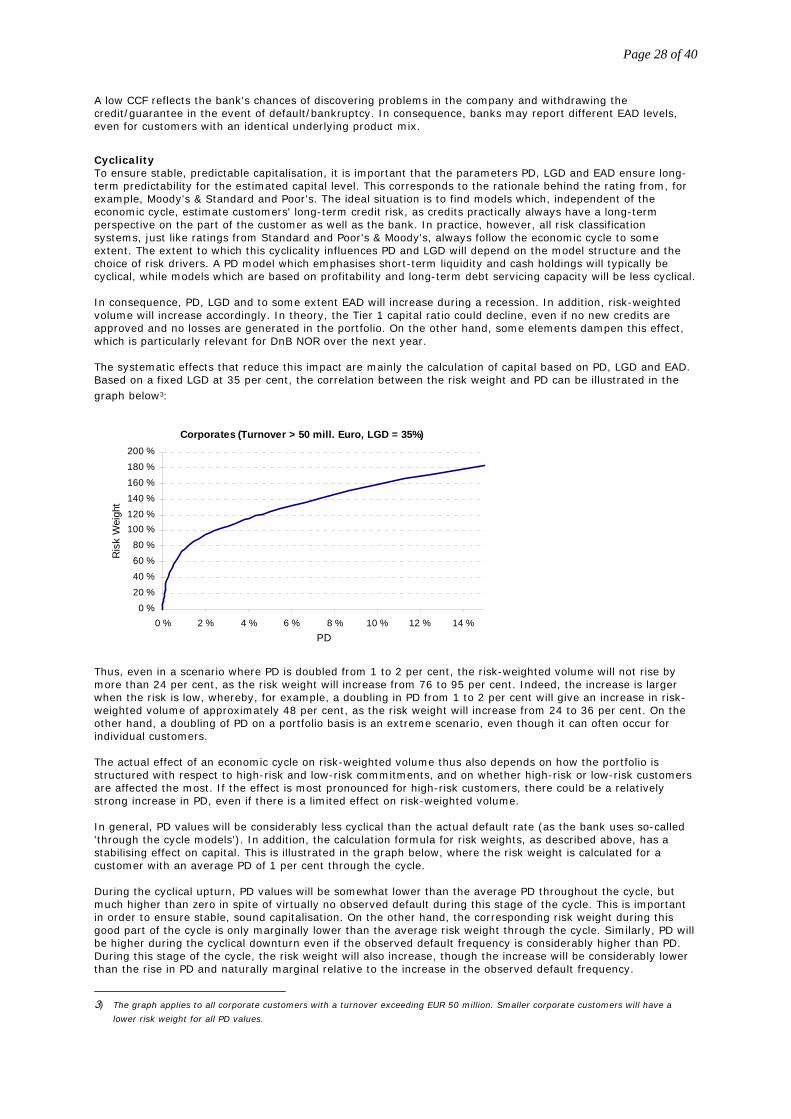
Page 28 of 40
A low CCF reflects the bank's chances of discovering problems in the company and withdrawing the credit/guarantee in the event of default/bankruptcy. In consequence, banks may report different EAD levels, even for customers with an identical underlying product mix.
Cyclicality To ensure stable, predictable capitalisation, it is important that the parameters PD, LGD and EAD ensure long-term predictability for the estimated capital level. This corresponds to the rationale behind the rating from, for example, Moody's & Standard and Poor's. The ideal situation is to find models which, independent of the economic cycle, estimate customers' long-term credit risk, as credits practically always have a long-term perspective on the part of the customer as well as the bank. In practice, however, all risk classification systems, just like ratings from Standard and Poor's & Moody's, always follow the economic cycle to some extent. The extent to which this cyclicality influences PD and LGD will depend on the model structure and the choice of risk drivers. A PD model which emphasises short-term liquidity and cash holdings will typically be cyclical, while models which are based on profitability and long-term debt servicing capacity will be less cyclical. In consequence, PD, LGD and to some extent EAD will increase during a recession. In addition, risk-weighted volume will increase accordingly. In theory, the Tier 1 capital ratio could decline, even if no new credits are approved and no losses are generated in the portfolio. On the other hand, some elements dampen this effect, which is particularly relevant for DnB NOR over the next year. The systematic effects that reduce this impact are mainly the calculation of capital based on PD, LGD and EAD. Based on a fixed LGD at 35 per cent, the correlation between the risk weight and PD can be illustrated in the graph below3:
Corporates (Turnover > 50 mill. Euro, LGD = 35%)
0 %
20 %
40 %60 %
80 %
100 %120 %
140 %160 %
180 %
200 %
0 % 2 % 4 % 6 % 8 % 10 % 12 % 14 %PD
Ris
k W
eigh
t
Thus, even in a scenario where PD is doubled from 1 to 2 per cent, the risk-weighted volume will not rise by more than 24 per cent, as the risk weight will increase from 76 to 95 per cent. Indeed, the increase is larger when the risk is low, whereby, for example, a doubling in PD from 1 to 2 per cent will give an increase in risk-weighted volume of approximately 48 per cent, as the risk weight will increase from 24 to 36 per cent. On the other hand, a doubling of PD on a portfolio basis is an extreme scenario, even though it can often occur for individual customers. The actual effect of an economic cycle on risk-weighted volume thus also depends on how the portfolio is structured with respect to high-risk and low-risk commitments, and on whether high-risk or low-risk customers are affected the most. If the effect is most pronounced for high-risk customers, there could be a relatively strong increase in PD, even if there is a limited effect on risk-weighted volume. In general, PD values will be considerably less cyclical than the actual default rate (as the bank uses so-called 'through the cycle models'). In addition, the calculation formula for risk weights, as described above, has a stabilising effect on capital. This is illustrated in the graph below, where the risk weight is calculated for a customer with an average PD of 1 per cent through the cycle. During the cyclical upturn, PD values will be somewhat lower than the average PD throughout the cycle, but much higher than zero in spite of virtually no observed default during this stage of the cycle. This is important in order to ensure stable, sound capitalisation. On the other hand, the corresponding risk weight during this good part of the cycle is only marginally lower than the average risk weight through the cycle. Similarly, PD will be higher during the cyclical downturn even if the observed default frequency is considerably higher than PD. During this stage of the cycle, the risk weight will also increase, though the increase will be considerably lower than the rise in PD and naturally marginal relative to the increase in the observed default frequency.
3) The graph applies to all corporate customers with a turnover exceeding EUR 50 million. Smaller corporate customers will have a
lower risk weight for all PD values.
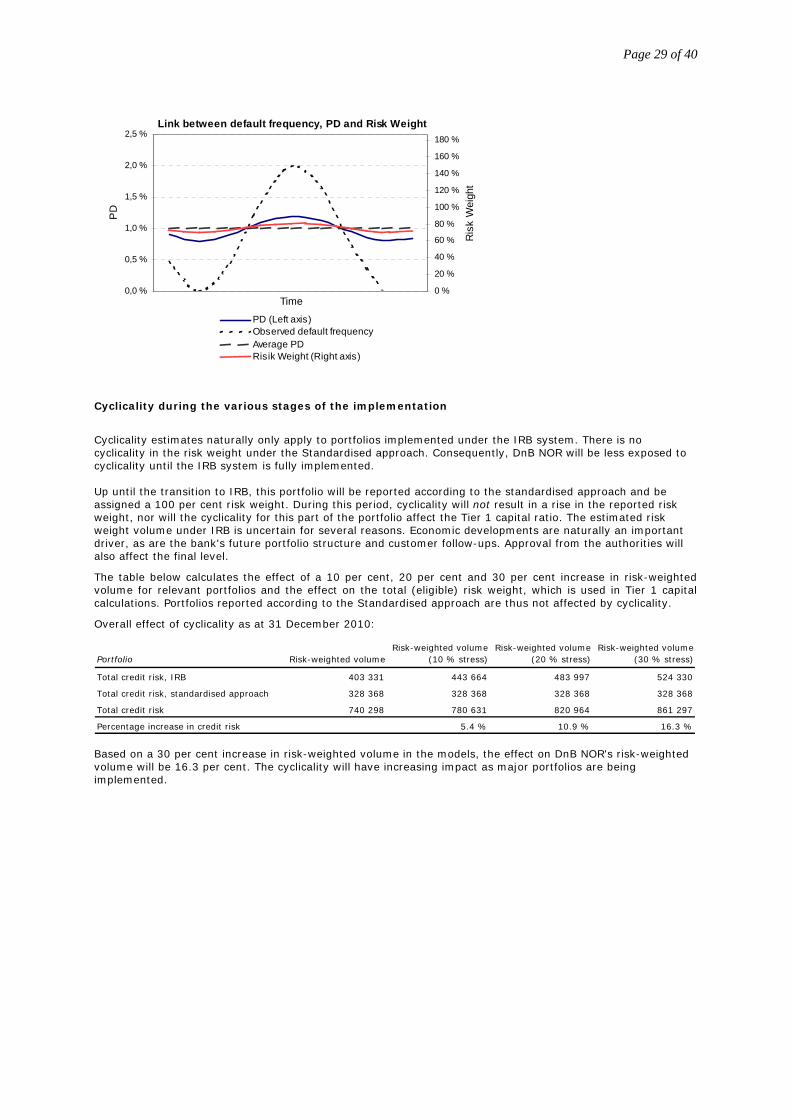
Page 29 of 40
Link between default frequency, PD and Risk Weight
0,0 %
0,5 %
1,0 %
1,5 %
2,0 %
2,5 %
Time
PD
0 %
20 %
40 %
60 %
80 %
100 %
120 %
140 %
160 %
180 %
Ris
k W
eigh
t
PD (Left axis)Observed default frequencyAverage PDRisik Weight (Right axis)
Cyclicality during the various stages of the implementation
Cyclicality estimates naturally only apply to portfolios implemented under the IRB system. There is no cyclicality in the risk weight under the Standardised approach. Consequently, DnB NOR will be less exposed to cyclicality until the IRB system is fully implemented. Up until the transition to IRB, this portfolio will be reported according to the standardised approach and be assigned a 100 per cent risk weight. During this period, cyclicality will not result in a rise in the reported risk weight, nor will the cyclicality for this part of the portfolio affect the Tier 1 capital ratio. The estimated risk weight volume under IRB is uncertain for several reasons. Economic developments are naturally an important driver, as are the bank's future portfolio structure and customer follow-ups. Approval from the authorities will also affect the final level.
The table below calculates the effect of a 10 per cent, 20 per cent and 30 per cent increase in risk-weighted volume for relevant portfolios and the effect on the total (eligible) risk weight, which is used in Tier 1 capital calculations. Portfolios reported according to the Standardised approach are thus not affected by cyclicality.
Overall effect of cyclicality as at 31 December 2010:
Based on a 30 per cent increase in risk-weighted volume in the models, the effect on DnB NOR's risk-weighted volume will be 16.3 per cent. The cyclicality will have increasing impact as major portfolios are being implemented.
Portfolio Risk-weighted volumeRisk-weighted volume
(10 % stress)Risk-weighted volume
(20 % stress)Risk-weighted volume
(30 % stress)
Total credit risk, IRB 403 331 443 664 483 997 524 330
Total credit risk, standardised approach 328 368 328 368 328 368 328 368
Total credit risk 740 298 780 631 820 964 861 297
Percentage increase in credit risk 5.4 % 10.9 % 16.3 %
Page 30 of 40
Credit risk – collateral As a key principle, the bank requires security for all loans in the form of either mortgages or so-called negative pledges, where the customer is required to keep all assets free from encumbrances vis-à-vis all lenders. During the credit process, the bank will consider whether adequate collateral is provided. The main principle for valuing collateral is that the expected realisation value at the time the bank may need to realise the collateral, should be used. The practical implementation is described in extensive rules, including maximum rates for all types of collateral and valuation guidelines. Valuations should be made when approving new loans and in connection with the annual renewal and are considered to be part of credit decisions. A procedure has been established for the periodic control of collateral. The main types of collateral used are mortgages on property, registrable movables, accounts receivable, inventories, plant and equipment, agricultural chattel and fish-farming concessions. The main categories of guarantors are private individuals (consumer guarantees), corporates (professionals), guarantee institutes and banks. Guarantors are classified according to risk based on the bank's rating models. Debtors can only be assigned the guarantor's PD provided that the guarantor is placed in risk category 6 or higher and the guarantee applies to the entire commitment. Guarantees can only serve as collateral (affect LGD) if they are placed in risk category 6 or higher. When using the foundation IRB approach, guarantees are assigned no value as collateral in capital calculations. Credit derivatives are not used for portfolios for which use of the IRB approach has been approved. Guarantees represent a limited part of such portfolios. The Group's netting rights are in compliance with general rules in Norwegian legislation. Netting clauses have been included in all standard loan agreements in DnB NOR Bank ASA and product agreements in DnB NOR Markets. Netting rights have no value in risk and capital calculations, except for Markets products, where stipulations in the framework agreement (ISDA) open up for far more extensive netting. The Group has a well-diversified portfolio. Risk concentrations are taken into account in the bank's ICAAP process.
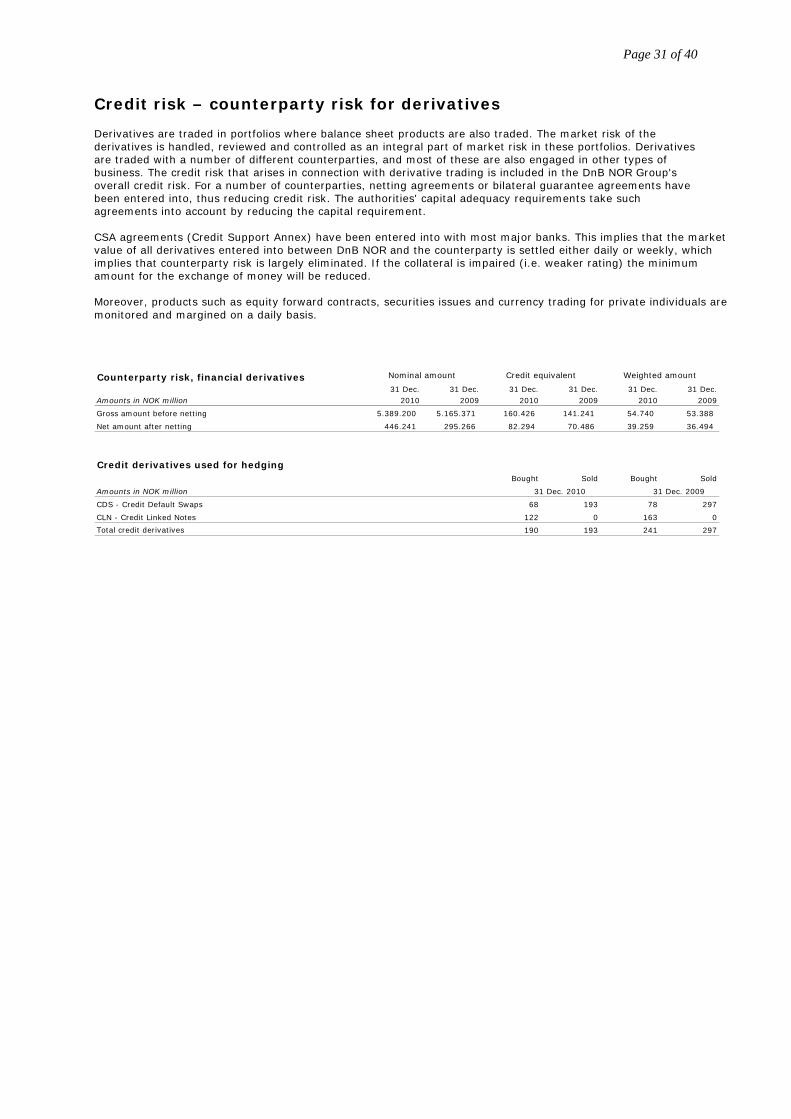
Page 31 of 40
Credit risk – counterparty risk for derivatives Derivatives are traded in portfolios where balance sheet products are also traded. The market risk of the derivatives is handled, reviewed and controlled as an integral part of market risk in these portfolios. Derivatives are traded with a number of different counterparties, and most of these are also engaged in other types of business. The credit risk that arises in connection with derivative trading is included in the DnB NOR Group's overall credit risk. For a number of counterparties, netting agreements or bilateral guarantee agreements have been entered into, thus reducing credit risk. The authorities' capital adequacy requirements take such agreements into account by reducing the capital requirement. CSA agreements (Credit Support Annex) have been entered into with most major banks. This implies that the market value of all derivatives entered into between DnB NOR and the counterparty is settled either daily or weekly, which implies that counterparty risk is largely eliminated. If the collateral is impaired (i.e. weaker rating) the minimum amount for the exchange of money will be reduced. Moreover, products such as equity forward contracts, securities issues and currency trading for private individuals are monitored and margined on a daily basis.
Counterparty risk, financial derivatives 31 Dec. 31 Dec. 31 Dec. 31 Dec. 31 Dec. 31 Dec.
Amounts in NOK million 2010 2009 2010 2009 2010 2009
Gross amount before netting 5.389.200 5.165.371 160.426 141.241 54.740 53.388
Net amount after netting 446.241 295.266 82.294 70.486 39.259 36.494
Credit derivatives used for hedgingBought Sold Bought Sold
Amounts in NOK million
CDS - Credit Default Swaps 68 193 78 297
CLN - Credit Linked Notes 122 0 163 0
Total credit derivatives 190 193 241 297
31 Dec. 2010 31 Dec. 2009
Nominal amount Credit equivalent Weighted amount
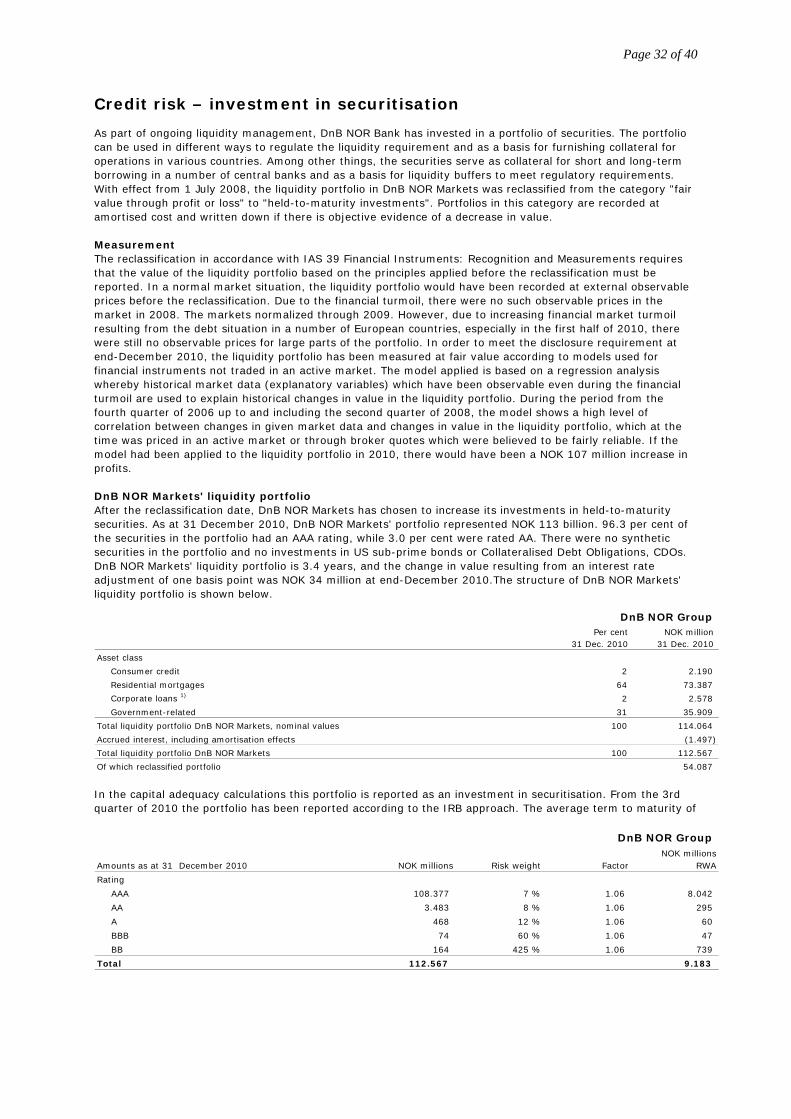
Page 32 of 40
Credit risk – investment in securitisation As part of ongoing liquidity management, DnB NOR Bank has invested in a portfolio of securities. The portfolio can be used in different ways to regulate the liquidity requirement and as a basis for furnishing collateral for operations in various countries. Among other things, the securities serve as collateral for short and long-term borrowing in a number of central banks and as a basis for liquidity buffers to meet regulatory requirements. With effect from 1 July 2008, the liquidity portfolio in DnB NOR Markets was reclassified from the category "fair value through profit or loss" to "held-to-maturity investments". Portfolios in this category are recorded at amortised cost and written down if there is objective evidence of a decrease in value. Measurement The reclassification in accordance with IAS 39 Financial Instruments: Recognition and Measurements requires that the value of the liquidity portfolio based on the principles applied before the reclassification must be reported. In a normal market situation, the liquidity portfolio would have been recorded at external observable prices before the reclassification. Due to the financial turmoil, there were no such observable prices in the market in 2008. The markets normalized through 2009. However, due to increasing financial market turmoil resulting from the debt situation in a number of European countries, especially in the first half of 2010, there were still no observable prices for large parts of the portfolio. In order to meet the disclosure requirement at end-December 2010, the liquidity portfolio has been measured at fair value according to models used for financial instruments not traded in an active market. The model applied is based on a regression analysis whereby historical market data (explanatory variables) which have been observable even during the financial turmoil are used to explain historical changes in value in the liquidity portfolio. During the period from the fourth quarter of 2006 up to and including the second quarter of 2008, the model shows a high level of correlation between changes in given market data and changes in value in the liquidity portfolio, which at the time was priced in an active market or through broker quotes which were believed to be fairly reliable. If the model had been applied to the liquidity portfolio in 2010, there would have been a NOK 107 million increase in profits. DnB NOR Markets' liquidity portfolio After the reclassification date, DnB NOR Markets has chosen to increase its investments in held-to-maturity securities. As at 31 December 2010, DnB NOR Markets' portfolio represented NOK 113 billion. 96.3 per cent of the securities in the portfolio had an AAA rating, while 3.0 per cent were rated AA. There were no synthetic securities in the portfolio and no investments in US sub-prime bonds or Collateralised Debt Obligations, CDOs. DnB NOR Markets' liquidity portfolio is 3.4 years, and the change in value resulting from an interest rate adjustment of one basis point was NOK 34 million at end-December 2010.The structure of DnB NOR Markets' liquidity portfolio is shown below.
In the capital adequacy calculations this portfolio is reported as an investment in securitisation. From the 3rd quarter of 2010 the portfolio has been reported according to the IRB approach. The average term to maturity of
DnB NOR Group Per cent NOK million
31 Dec. 2010 31 Dec. 2010
Asset class
Consumer credit 2 2.190
Residential mortgages 64 73.387
Corporate loans 1) 2 2.578
Government-related 31 35.909
Total liquidity portfolio DnB NOR Markets, nominal values 100 114.064
Accrued interest, including amortisation effects (1.497)
Total liquidity portfolio DnB NOR Markets 100 112.567
Of which reclassified portfolio 54.087
DnB NOR Group NOK millions
Amounts as at 31 December 2010 NOK millions Risk weight Factor RWA
Rating
AAA 108.377 7 % 1.06 8.042
AA 3.483 8 % 1.06 295
A 468 12 % 1.06 60
BBB 74 60 % 1.06 47
BB 164 425 % 1.06 739
Total 112.567 9.183
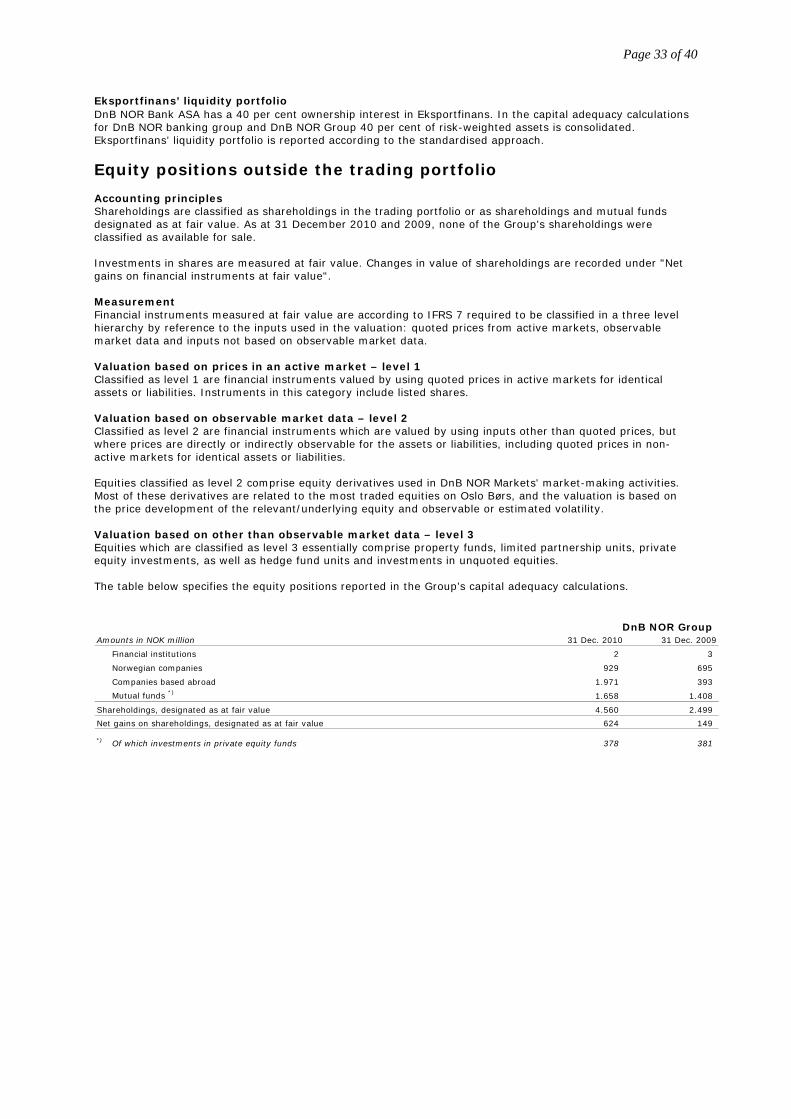
Page 33 of 40
Eksportfinans’ liquidity portfolio DnB NOR Bank ASA has a 40 per cent ownership interest in Eksportfinans. In the capital adequacy calculations for DnB NOR banking group and DnB NOR Group 40 per cent of risk-weighted assets is consolidated. Eksportfinans’ liquidity portfolio is reported according to the standardised approach.
Equity positions outside the trading portfolio Accounting principles Shareholdings are classified as shareholdings in the trading portfolio or as shareholdings and mutual funds designated as at fair value. As at 31 December 2010 and 2009, none of the Group's shareholdings were classified as available for sale. Investments in shares are measured at fair value. Changes in value of shareholdings are recorded under "Net gains on financial instruments at fair value". Measurement Financial instruments measured at fair value are according to IFRS 7 required to be classified in a three level hierarchy by reference to the inputs used in the valuation: quoted prices from active markets, observable market data and inputs not based on observable market data. Valuation based on prices in an active market – level 1 Classified as level 1 are financial instruments valued by using quoted prices in active markets for identical assets or liabilities. Instruments in this category include listed shares. Valuation based on observable market data – level 2 Classified as level 2 are financial instruments which are valued by using inputs other than quoted prices, but where prices are directly or indirectly observable for the assets or liabilities, including quoted prices in non-active markets for identical assets or liabilities. Equities classified as level 2 comprise equity derivatives used in DnB NOR Markets' market-making activities. Most of these derivatives are related to the most traded equities on Oslo Børs, and the valuation is based on the price development of the relevant/underlying equity and observable or estimated volatility. Valuation based on other than observable market data – level 3 Equities which are classified as level 3 essentially comprise property funds, limited partnership units, private equity investments, as well as hedge fund units and investments in unquoted equities. The table below specifies the equity positions reported in the Group’s capital adequacy calculations.
DnB NOR Group Amounts in NOK million 31 Dec. 2010 31 Dec. 2009
Financial institutions 2 3
Norwegian companies 929 695
Companies based abroad 1.971 393
Mutual funds *) 1.658 1.408
Shareholdings, designated as at fair value 4.560 2.499
Net gains on shareholdings, designated as at fair value 624 149
*) Of which investments in private equity funds 378 381
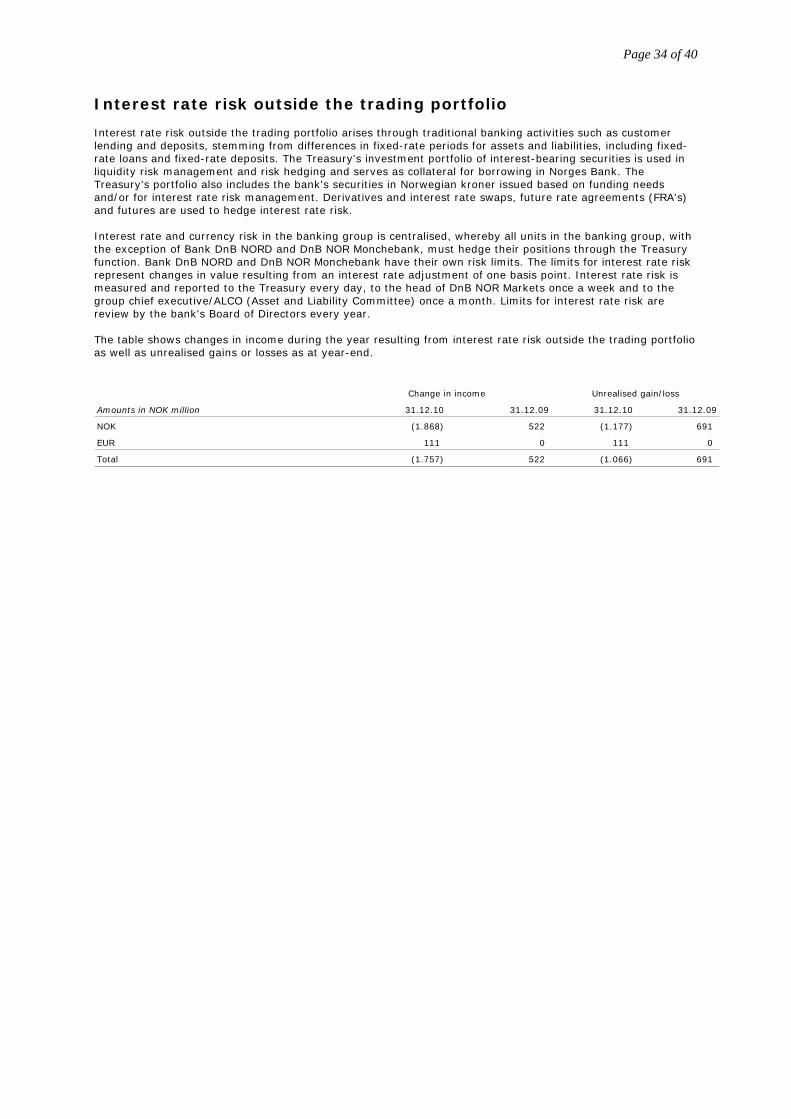
Page 34 of 40
Interest rate risk outside the trading portfolio Interest rate risk outside the trading portfolio arises through traditional banking activities such as customer lending and deposits, stemming from differences in fixed-rate periods for assets and liabilities, including fixed-rate loans and fixed-rate deposits. The Treasury's investment portfolio of interest-bearing securities is used in liquidity risk management and risk hedging and serves as collateral for borrowing in Norges Bank. The Treasury's portfolio also includes the bank's securities in Norwegian kroner issued based on funding needs and/or for interest rate risk management. Derivatives and interest rate swaps, future rate agreements (FRA's) and futures are used to hedge interest rate risk. Interest rate and currency risk in the banking group is centralised, whereby all units in the banking group, with the exception of Bank DnB NORD and DnB NOR Monchebank, must hedge their positions through the Treasury function. Bank DnB NORD and DnB NOR Monchebank have their own risk limits. The limits for interest rate risk represent changes in value resulting from an interest rate adjustment of one basis point. Interest rate risk is measured and reported to the Treasury every day, to the head of DnB NOR Markets once a week and to the group chief executive/ALCO (Asset and Liability Committee) once a month. Limits for interest rate risk are review by the bank's Board of Directors every year. The table shows changes in income during the year resulting from interest rate risk outside the trading portfolio as well as unrealised gains or losses as at year-end.
Amounts in NOK million 31.12.10 31.12.09 31.12.10 31.12.09
NOK (1.868) 522 (1.177) 691
EUR 111 0 111 0
Total (1.757) 522 (1.066) 691
Change in income Unrealised gain/loss
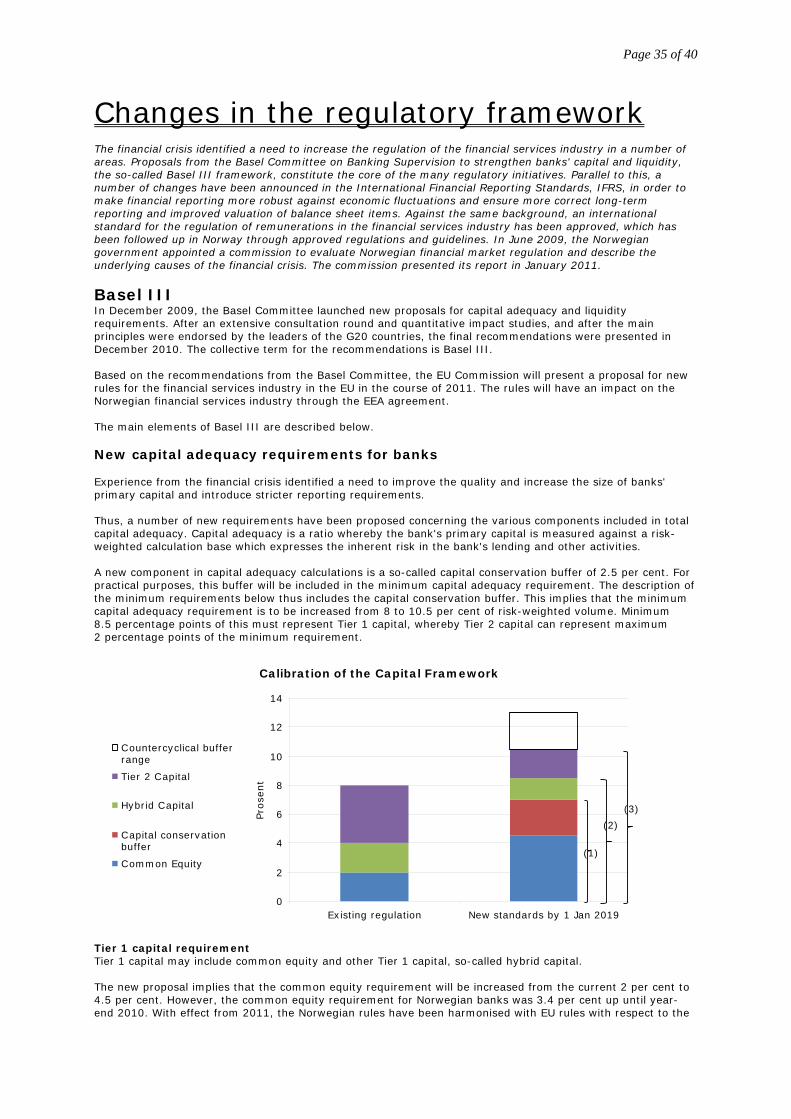
Page 35 of 40
Changes in the regulatory framework The financial crisis identified a need to increase the regulation of the financial services industry in a number of areas. Proposals from the Basel Committee on Banking Supervision to strengthen banks' capital and liquidity, the so-called Basel III framework, constitute the core of the many regulatory initiatives. Parallel to this, a number of changes have been announced in the International Financial Reporting Standards, IFRS, in order to make financial reporting more robust against economic fluctuations and ensure more correct long-term reporting and improved valuation of balance sheet items. Against the same background, an international standard for the regulation of remunerations in the financial services industry has been approved, which has been followed up in Norway through approved regulations and guidelines. In June 2009, the Norwegian government appointed a commission to evaluate Norwegian financial market regulation and describe the underlying causes of the financial crisis. The commission presented its report in January 2011.
Basel III In December 2009, the Basel Committee launched new proposals for capital adequacy and liquidity requirements. After an extensive consultation round and quantitative impact studies, and after the main principles were endorsed by the leaders of the G20 countries, the final recommendations were presented in December 2010. The collective term for the recommendations is Basel III. Based on the recommendations from the Basel Committee, the EU Commission will present a proposal for new rules for the financial services industry in the EU in the course of 2011. The rules will have an impact on the Norwegian financial services industry through the EEA agreement. The main elements of Basel III are described below. New capital adequacy requirements for banks Experience from the financial crisis identified a need to improve the quality and increase the size of banks' primary capital and introduce stricter reporting requirements. Thus, a number of new requirements have been proposed concerning the various components included in total capital adequacy. Capital adequacy is a ratio whereby the bank's primary capital is measured against a risk-weighted calculation base which expresses the inherent risk in the bank's lending and other activities. A new component in capital adequacy calculations is a so-called capital conservation buffer of 2.5 per cent. For practical purposes, this buffer will be included in the minimum capital adequacy requirement. The description of the minimum requirements below thus includes the capital conservation buffer. This implies that the minimum capital adequacy requirement is to be increased from 8 to 10.5 per cent of risk-weighted volume. Minimum 8.5 percentage points of this must represent Tier 1 capital, whereby Tier 2 capital can represent maximum 2 percentage points of the minimum requirement.
Calibration of the Capital Framework
0
2
4
6
8
10
12
14
Existing regulation New standards by 1 Jan 2019
Pro
sent
Countercyclical bufferrange
Tier 2 Capital
Hybrid Capital
Capital conservationbuffer
Common Equity(1)
(2)
(3)
Tier 1 capital requirement Tier 1 capital may include common equity and other Tier 1 capital, so-called hybrid capital. The new proposal implies that the common equity requirement will be increased from the current 2 per cent to 4.5 per cent. However, the common equity requirement for Norwegian banks was 3.4 per cent up until year-end 2010. With effect from 2011, the Norwegian rules have been harmonised with EU rules with respect to the
Page 36 of 40
use of hybrid instruments. In consequence of Basel III, the increased access to use hybrid instruments will be of no practical significance for Norwegian banks. The above-mentioned 2.5 per cent capital conservation buffer comes in addition to the 4.5 per cent minimum Tier 1 capital requirement and will in practice be regarded as part of the minimum requirement. The new minimum common equity requirement will thus be 7 per cent. Common equity must be fully loss absorbing and can only consist of common share capital or retained earnings. The rules concerning deductions from equity have also become stricter, though this is of less significance for Norwegian banks, which already follow strict rules. Furthermore, up to 1.5 percentage points of Tier 1 capital may represent hybrid capital, which brings the minimum Tier 1 capital requirement to 8.5 per cent. The hybrid capital must be fully loss absorbing, which means that it must be possible to write down the capital or convert it to common equity without consequences for the bank's ordinary operations. In addition, the hybrid capital must be perpetual and offer banks no incentive to redeem. Under Basel III, there are much stricter requirements governing the actual loss absorbing capacity of hybrid capital than under previous and current regulatory frameworks. It has been announced that a requirement may be presented whereby systemically important banks must increase Tier 1 capital beyond the above-mentioned minimum requirements. Tier 2 capital requirement Tier 2 capital may represent up to 2 percentage points of the minimum requirement and can include term subordinated loan capital or corresponding instruments which should provide loss absorption in a situation when the bank is declared insolvent. Among other things, the instruments must have a minimum original maturity of five years. The Tier 2 capital will be required to provide loss absorption also in a situation where the bank can continue to operate as a going concern after being recapitalised by the national authorities. Countercyclical capital buffer In addition to the above-mentioned capital conservation buffer, a so-called countercyclical capital element will also be introduced, ranging between 0 and 2.5 per cent. This element should consist of common equity, and the size of the buffer will be determined by the national supervisory authorities. It will later be considered whether the countercyclical capital buffer may also include other fully loss absorbing capital. This element will be of particular relevance during periods when total private sector credit exposures relative to GDP are above the long-term trend. During weaker economic periods, this element may be set at zero. The total common equity requirement will thus range between 7 and 9.5 per cent, representing the minimum common equity requirement of 4.5 per cent plus a total buffer requirement, comprising the capital conservation buffer and the countercyclical capital buffer, of between 2.5 and 5 per cent, depending on the size of the countercyclical buffer. If a bank fails to fully satisfy the buffer requirement, limitations will be placed on dividend and discretionary bonus payments etc. The limitations will be stricter the further the bank's capital base is from meeting the formal 8 per cent minimum requirement. Leverage ratio As a supplement to the risk-weighted capital requirements and as a measure against creative adjustments and gaps in the regulations, a non-risk based capital requirement, ”leverage ratio”, will also be introduced. This requirement implies that Tier 1 capital must be minimum 3 per cent of the total of balance sheet items and off-balance sheet risk exposure. Off-balance sheet items are converted to on-balance sheet items according to further specified rules. Improved measurement of counterparty risk In addition to the capital adequacy regulations, stricter and more exhaustive rules are proposed for the risk-weighting of exposures through derivatives, repurchase agreements and any indirect obligations related to securitisation. According to the new rules, such counterparty risk will be estimated based on assumptions of stressed market conditions as well as a weakening of counterparty creditworthiness. Due to the highly complex and not very transparent derivative market, measures have also been proposed to increase standardisation in the derivatives market and the use of clearing houses. New liquidity requirements for banks Prior to the onset of the financial crisis, there were two clear market trends: the financial system's increased dependence on money and capital market funding and on short-term funding instruments. In addition, contingent liquidity obligations had been accumulated, partially through securitisation activities and obligations relating to so-called margin requirements in derivative transactions. In consequence of the liquidity problems during the financial crisis, two liquidity requirements have been proposed to achieve two separate, but complementary objectives. The first objective is to promote the short-term resilience of the liquidity risk profile of banks by ensuring that they have sufficient high-quality liquid
Page 37 of 40
assets to survive an acute stress scenario lasting for a month. The liquidity coverage ratio, LCR, was developed to achieve this objective. The liquidity requirement, LCR, is calculated as follows:
Liquid assets Liquidity coverage ratio:
Net cash flow over 30 days in a stress scenario > 100 %
The requirement entails that the bank's highest-quality liquidity reserves must exceed the net payments from the bank over a 30-day stress period. The highest-quality liquidity reserves can be in the form of cash and central bank deposits, as well as securities issued by public entities with a zero per cent credit risk weight. In addition, 40 per cent of the reserve may consist of securities issued by a public entity with a maximum 20 per cent credit risk weight, and corporate and covered bonds with a rating of at least AA- which have not been issued by the bank itself. For all securities, there is a qualitative requirement that they are traded in large and active secondary or so-called repo markets even during stressed market conditions. Net payments during the stress period are estimated by, among other things, assuming a decline in deposits. The extent of the reduction depends on the type of deposits. A further assumption is larger drawdowns on the undrawn portion of credit facilities and no renewal of short-term capital market funding which is due during the stress period. These stress effects come in addition to ordinary cash inflows and outflows, including planned lending growth. The LCR requirement should be met for each currency of significance for the banks. With respect to countries with inadequate access to securities which meet the LCR in local currency, the Basel Committee has drawn up three alternative solutions. Final details and a specification of the countries this will apply to will be considered during the observation period for the LCR up until mid-2013. The second objective is to strengthen the liquidity profile over a longer time horizon by creating incentives for banks to fund their operations with more stable sources of funding on a permanent basis. The net stable funding ratio, NSFR, was launched to achieve this objective and has a time horizon of one year. The liquidity requirement, NSRF, is calculated as follows:
Available amount of stable funding Net stable funding ratio:
Required amount of stable funding > 100 %
The net stable funding ratio sets requirements for banks' funding structures relative to lending, investments and other assets. The objective is to limit banks' short-term funding of illiquid and long-term assets. The requirement is based on a comparison between the bank's available amount of stable funding and the estimated required amount of such funding. Calculations of the bank's available amount of stable funding include all contractual funding obligations with residual maturities of 12 months or greater and non-maturity deposits. However, deposits will be subject to a run-off factor of between 10 and 50 per cent, depending on how stable they are considered to be. Calculations of the required amount of long-term funding entail that all assets with maturities greater than one year that are not particularly liquid, must be backed by long-term funding. Home mortgages which meet certain requirements and do not serve as collateral for the issue of covered bonds require only 65 per cent long-term funding. Loans with maturities shorter than one year must be backed by 50-85 per cent long-term funding. In addition, 5 per cent of the undrawn portion of credit facilities must be covered by long-term funding. Supplementary requirements for systemically important banks Systemically important banks and the close ties between them reinforced the extent of the crisis. To limit such risk, the G20 has initiated a process to define further supplementary requirements for these banks. In addition, changes in framework conditions are being considered, aiming to establish systems for the dissolution of banks which make it possible to allow even the largest banks to fail. Introduction of Basel III The new capital adequacy requirements will be gradually phased in over a six-year period starting on 1 January 2013, whereby the new requirements will have full effect from 1 January 2019. Unless changes are approved in the leverage ratio requirement during the observation period, which lasts from 2013 to 2017, this will be included as a minimum requirement with effect from 1 January 2018. Following an observation period starting in 2011, the liquidity requirements LCR and NSFR will be introduced with effect from 1 January 2015 and 1 January 2018, respectively. According to the Basel Committee's recommendation, the LCR should be reported at least monthly, while the NSFR should be reported at least quarterly within 1 January 2012. In addition, there will be extended reporting requirements in relation to liquidity. The extent of possible changes in the requirements after the consideration by the EU remains uncertain. In order to ensure that the Basel III framework will have the desired effect, the Basel Committee has considered
Page 38 of 40
that a fairly long observation period is required. DnB NOR agrees that this period is important to refine the final requirements and avoid undesirable consequences. Among other things, there is no past experience related to the effects of global liquidity standards, and the new requirements will entail a need for significant adjustments for a number of banks. For this reason, and with regard to the competition with international banks, it is important that the introduction of the regulatory framework in Norway takes place parallel to the introduction in the rest of Europe.
Important IFRS amendments A number of new International Financial Reporting Standards (IFRS) must be expected to be introduced over the coming years. The amendments are expected to become effective for Norway after being considered by the EU Commission and the Norwegian authorities. Some of the new accounting rules are due to a wish for improvements which was expressed in the wake of the financial crisis, while others are based on other improvement initiatives, not least in connection with the wish to coordinate international and US financial reporting rules. The amendments which are expected to have the most pronounced impact on the Norwegian financial market are new accounting rules for the assessment of loans and new rules for the assessment of insurance contracts. In this connection, the International Accounting Standards Board, IASB, a standard-setting body, has drawn up an exposure draft for the assessment of credit losses, issued in November 2009. At end-January 2011, the IASB and the US Financial Accounting Standards Board, FASB presented a supplement to the original exposure draft on an impairment model for financial assets. At the beginning of 2011, the standard-setting bodies were still discussing the accounting treatment of the impairment of financial assets, and additional changes may thus be made to the original exposure draft. The final draft for a new IFRS on amortised cost and the impairment of financial instruments is expected to be presented by end-June 2011. If the amendments are implemented in their current form, they may have major consequences for the banking industry and the market in general. Current rules for measuring loan losses According to prevailing rules, the value of a financial asset shall be written down if there is objective evidence of impairment, i.e. when a loss has occurred. Standard-setting bodies, auditors and users have criticised the impairment rules based on the following:
• Interest income is overstated during the period before a loss event occurs. Write-downs can partially be regarded as reversals of "overstated " income in previous periods. Equity may also be overstated.
• It is sometimes unclear when a loss has actually occurred, which results in differences in the way the rules are practiced. Losses may also have to be recorded even if there are no changes in the original expected losses.
• In some cases, the rules have resulted in delayed recognition of losses, as a loss event must have occurred in order for the loss to be recognised under current rules.
New rules for measuring loan losses In the exposure draft presented in November 2009, the IASB proposed an Expected loss model which entails that expected losses upon initial recognition of a financial asset, including loans, are included when determining the effective interest rate underlying the recognition. This implies that the part of the interest rate which compensates for expected losses, should not be recognised as income. In a supplement dated 31 January 2011, the IASB and the FASB presented a joint model for recognising impairment of financial assets in portfolios where assets are added and removed during the life of the portfolio, so-called open portfolios. The impairment model includes elements of the IASB's original proposal, as well as adjustments which are intended to make the model easier to use. Among other things, expected losses are not included in calculations of effective interest rates to be used as a basis for interest income recognition. In addition, a minimum provision level for loan losses in the balance sheet will be introduced, which harmonises with the impairment model originally proposed by the FASB. According to the exposure draft, the accrual of expected losses over the life of the assets should be determined by the characteristics of the assets. The financial assets in the portfolio should be divided into two groups based on the company's internal risk management systems. Expected losses relating to doubtful commitments should be recognised immediately. Provisions for losses on loans on which the company intends to receive interest and instalments, should be recorded at the higher of the losses expected over the remaining life of the portfolio, based on the ratio of the portfolio's age to its expected life, and losses that are expected to occur within the foreseeable future, minimum 12 months. After responses to the exposure draft have been received, the IASB will consider whether the open portfolio model should also apply to other financial assets. The intention behind the new methods is to better reflect the underlying economics in a lending transaction. There should be no need to identify triggering events in order to estimate changes in expected losses. According to the IASB, this method is intended to ensure greater consistency between various reporting entities. The standard-setting bodies expect that the rule changes will present useful information to users of
Page 39 of 40
financial statements for their assessment of original loss estimates and possible changes in estimates over the life of an asset. It is highly questionable whether the new rules will actually give the desired effect. It will be very challenging to assess future expected cash flows for all loans, find good and stable expected loss estimates and identify changes in the originally expected losses on each reporting date. The life of each loan must be determined, including the life of roll-over credits and overdraft facilities. There will be considerable uncertainty related to these estimates. The new rules are expected to cause great volatility in financial reporting. Due to limited experience and the lack of relevant and reliable statistics, adjustments will regularly be made to the assumptions underlying expected loss measurements. Such changes will be reflected in the accounts on a cumulative basis, which means that the full effect of new estimates must be recognised immediately for all commitments affected by the changes. However, adjustments in the new exposure draft may nevertheless result in somewhat lower volatility in financial reporting. Once the new rules are implemented, a reduction is expected in the equity of most financial institutions, as there will probably be a need for higher loan-loss provisions in the accounts. Credit risk margins which up until the implementation of new rules are taken to income through the recognition of interest income on loans, will have to be reversed and recorded as provisions in the accounts. In light of the introduction of Basel III, the consequences may be challenging unless capital adequacy requirements and accounting rules are coordinated. The original preliminary implementation date for the new loss reporting rules was 1 January 2013. However, this will be delayed due to coordination with the US rules. The effective date of IFRS 4, Insurance contracts, was originally planned for 1 January 2013. The new rules imply that insurance liabilities will be measured at the fair value of the cash flows arising from the insurance contracts, plus a risk margin. According to current rules, liabilities are measured according to rules which are further defined in the Act on Insurance Activity. The assets are thus measured at a combination of amortised cost and fair value, depending on the characteristics of the assets. The accounting rules must be expected to result in greater volatility in profit measurements for life insurance companies in the longer term.
Regulation of remunerations in the financial services industry The regulations on remuneration schemes in financial institutions, mutual funds and management companies for mutual funds entered into force on 1 January 2011. Bonuses earned in 2010 or earlier which are paid in 2011, are not encompassed by the regulations. The regulations are based on the EU's CRD III directive, which was finally approved on 30 September 2010. In 2011, Finanstilsynet has issued supplementary guidelines to the regulations in the form of a circular. The regulations are based on the guidelines from the Committee of European Banking Supervisors, CEBS, dated 10 December 2010. In line with the purpose of the regulations, DnB NOR's remuneration scheme should help promote and give incentives to sound management and good control of the company's risk, counteract excessive risk taking and help avoid conflicts of interest. DnB NOR will work on the implementation and follow-up of the regulations through and beyond 2011. In this connection, the Group will prepare revised group remuneration guidelines to ensure compliance with the regulations and appurtenant guidelines. DnB NOR's remuneration scheme will determine which groups of employees belong to the following categories:
1. Senior executives 2. Employees whose responsibilities are of great significance to the company's risk exposure (risk takers) 3. Employees engaged in control functions 4. Employees whose remuneration places them in the same bracket as senior executives
In accordance with the regulations, the remuneration scheme will include special rules for the above-mentioned groups. For these employees, DnB NOR's remuneration scheme will ensure a balanced mix of fixed and variable remuneration. The variable salary of CEOs and senior management team members in banks should not represent more than 50 per cent of fixed salary.
Report from the Financial Crisis Commission In light of the international financial crisis and the experiences gained during this period, the Norwegian government appointed a Financial Crisis Commission in June 2009 to evaluate the Norwegian financial market. Among other things, the Commission was asked to describe the underlying causes of the crisis and to examine whether there were any specific national factors that contributed to its development in Norway. The Commission's report was presented on 25 January 2011. Norway is among the countries that fared best during the financial crisis. However, the failure of international financial markets nevertheless led to acute liquidity challenges for Norwegian banks, and extensive government measures were initiated. The monetary and fiscal policy framework in Norway provided a sound basis for

Page 40 of 40
stabilising the economy and mitigating the effects of the financial crisis. Past experience has shown that fiscal manoeuvrability and confidence in government finances must be built up in good times in order to be well prepared to meet possible periods of recession. According to the report, various taxes and fees may be suitable for supplementing financial market regulation and promoting financial stability. The commission proposes that a new stability fee be imposed on Norwegian financial institutions based on the institutions' debt in excess of equity and guaranteed deposits. In addition, the report proposes the introduction of a new tax on financial institutions' profits and salary payments to compensate for the fact that financial services are exempt from VAT. The Commission recommends that key features of Norwegian financial market regulation be refined and proposes that the Norwegian authorities work to strengthen the regulatory cooperation in the Nordic area relating to financial markets. Cooperation on stricter capital adequacy and liquidity requirements for banks and special requirements for systemically important financial institutions are particularly emphasised. The Commission proposes various measures with a view to improving consumer protection in the financial markets. The Commission's report was sent on a three-month consultation round in January 2011. The Financial Crisis Commission's proposal concerning taxes and fees is presented parallel to the work on possible sector-wide rules on fees for the European financial services sector. In the opinion of DnB NOR, it is questionable whether the premises underlying the Commission's tax proposals are relevant for Norway, as the Norwegian Banks' Guarantee Fund is fully funded even after the financial crisis. Norwegian banks have paid sizeable levies to the Fund, thus fees applying solely to Norwegian financial institutions seem unreasonable. Such fees could also distort competition in favour of institutions which operate under different framework conditions. The Norwegian financial services industry is not particularly large, and there are no indications that financial services are excessively used. Thus, it does not seem appropriate to introduce fees to reduce the use of financial services, which would contribute to higher product and service prices for end users. Nor should the impression be given that Norwegian financial institutions pay little tax. Only the oil sector pays more tax than the financial services industry in Norway.