Embed Size (px)
Citation preview
BANK ISLAM MALAYSIA BERHAD PILLAR 3 DISCLOSURE AS AT 31 DECEMBER 2014 Overview
The Pillar 3 Disclosure for financial year ended 31 December 2014 for Bank Islam (“the Bank”) and its subsidiaries (“the Group”) complies with Bank Negara Malaysia’s (“BNM”) “Capital Adequacy Framework for Islamic Banks (“CAFIB”) – Disclosure Requirements (“Pillar 3”)”, which sets out the minimum disclosure standards, the approach in determining the appropriateness of information disclosed and the internal controls over the disclosure process which cover the verification and review of the accuracy of information disclosed. CAFIB consists of 3 Pillars:
(a) Pillar 1 sets minimum regulatory capital to cover credit, market and operational risk;
(b) Pillar 2 aims to ensure that Islamic banking institutions have adequate capital to support their operations at all times; and
(c) Pillar 3 aims to enhance transparency by setting the minimum requirements for market disclosures of information on the risk management practices and capital adequacy of Islamic banks.
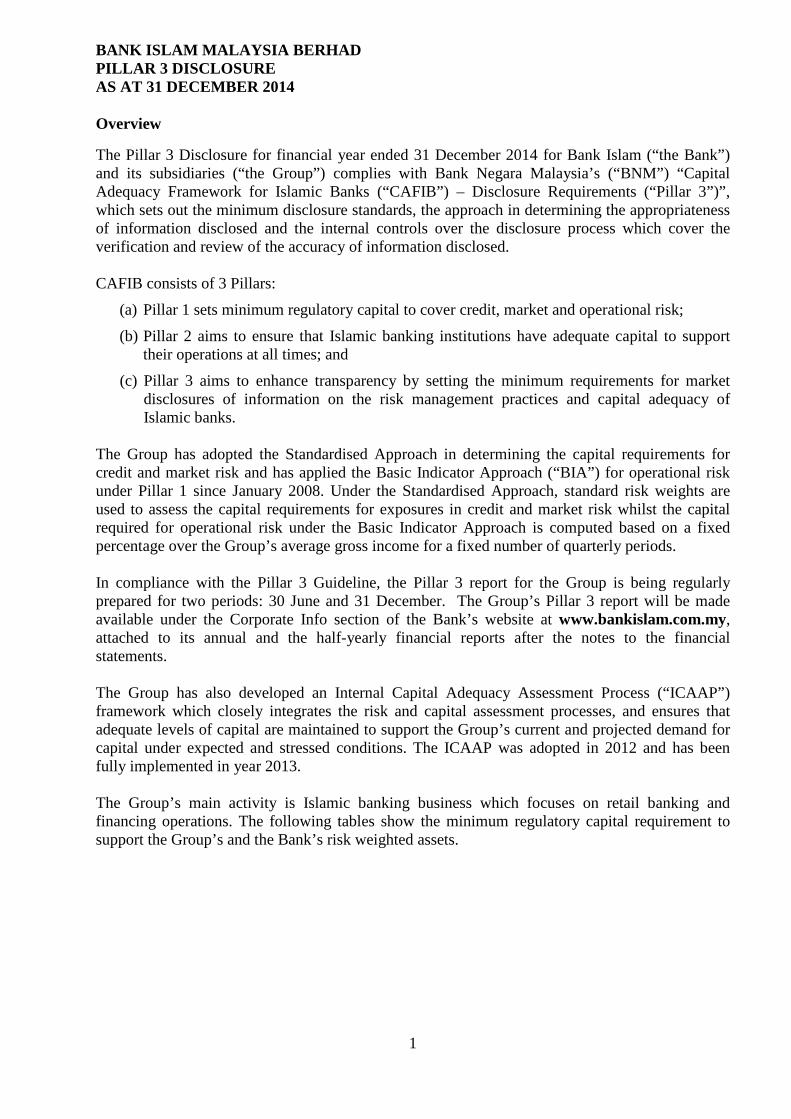
The Group has adopted the Standardised Approach in determining the capital requirements for credit and market risk and has applied the Basic Indicator Approach (“BIA”) for operational risk under Pillar 1 since January 2008. Under the Standardised Approach, standard risk weights are used to assess the capital requirements for exposures in credit and market risk whilst the capital required for operational risk under the Basic Indicator Approach is computed based on a fixed percentage over the Group’s average gross income for a fixed number of quarterly periods. In compliance with the Pillar 3 Guideline, the Pillar 3 report for the Group is being regularly prepared for two periods: 30 June and 31 December. The Group’s Pillar 3 report will be made available under the Corporate Info section of the Bank’s website at www.bankislam.com.my, attached to its annual and the half-yearly financial reports after the notes to the financial statements. The Group has also developed an Internal Capital Adequacy Assessment Process (“ICAAP”) framework which closely integrates the risk and capital assessment processes, and ensures that adequate levels of capital are maintained to support the Group’s current and projected demand for capital under expected and stressed conditions. The ICAAP was adopted in 2012 and has been fully implemented in year 2013. The Group’s main activity is Islamic banking business which focuses on retail banking and financing operations. The following tables show the minimum regulatory capital requirement to support the Group’s and the Bank’s risk weighted assets.
1
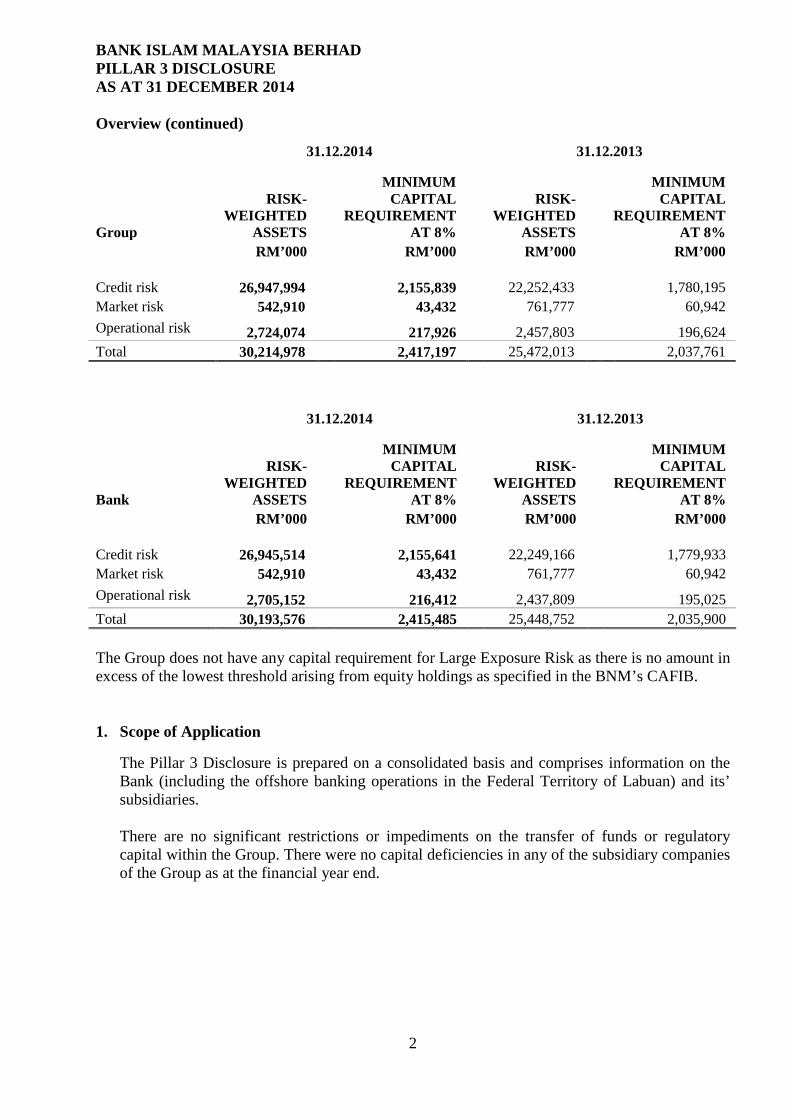
BANK ISLAM MALAYSIA BERHAD PILLAR 3 DISCLOSURE AS AT 31 DECEMBER 2014 Overview (continued)
31.12.2014 31.12.2013
Group
RISK-WEIGHTED
ASSETS
MINIMUM CAPITAL
REQUIREMENT AT 8%
RISK-WEIGHTED
ASSETS
MINIMUM CAPITAL
REQUIREMENT AT 8%
RM’000 RM’000 RM’000 RM’000 Credit risk 26,947,994 2,155,839 22,252,433 1,780,195 Market risk 542,910 43,432 761,777 60,942 Operational risk 2,724,074 217,926 2,457,803 196,624 Total 30,214,978 2,417,197 25,472,013 2,037,761
31.12.2014 31.12.2013
Bank
RISK-WEIGHTED
ASSETS
MINIMUM CAPITAL
REQUIREMENT AT 8%
RISK-WEIGHTED
ASSETS
MINIMUM CAPITAL
REQUIREMENT AT 8%
RM’000 RM’000 RM’000 RM’000 Credit risk 26,945,514 2,155,641 22,249,166 1,779,933 Market risk 542,910 43,432 761,777 60,942 Operational risk 2,705,152 216,412 2,437,809 195,025 Total 30,193,576 2,415,485 25,448,752 2,035,900 The Group does not have any capital requirement for Large Exposure Risk as there is no amount in excess of the lowest threshold arising from equity holdings as specified in the BNM’s CAFIB. 1. Scope of Application
The Pillar 3 Disclosure is prepared on a consolidated basis and comprises information on the Bank (including the offshore banking operations in the Federal Territory of Labuan) and its’ subsidiaries. There are no significant restrictions or impediments on the transfer of funds or regulatory capital within the Group. There were no capital deficiencies in any of the subsidiary companies of the Group as at the financial year end.
2
BANK ISLAM MALAYSIA BERHAD PILLAR 3 DISCLOSURE AS AT 31 DECEMBER 2014 2. Capital Adequacy
Capital Management In view of the immateriality of the subsidiaries’ capital, balance sheet exposures and income, the Capital Management is conducted at the Bank level only. The Bank’s primary objective when managing capital is to maintain a strong capital position to support business growth and to maintain investor, depositor, customer and market confidence. In line with this, the Bank manages its capital actively and ensures that the capital adequacy ratios which take into account the risk profile of the Bank, are above the regulatory minimum requirement. To ensure that the Bank has sufficient capital to support all its business and risk taking activities, the Bank has implemented sound capital management processes in its management systems and processes. A comprehensive capital management framework has been adopted by the Bank as a key enabler for value creation which is important to the long term survival of the Bank. This comprehensive capital management process includes thorough risk assessment and risk management techniques that are embedded within the Bank’s risk governance. The assessment is based on the approved business plan, its estimation of current risks inherent in the Bank and the impact of capital stress tests on the Bank’s capital plan. The Bank aims to achieve the following capital management objectives: • Meeting regulatory capital requirements; • Sustainable returns to shareholders; • Maintaining adequate levels and an optimum mix of different sources of capital to
support the underlying risks of its business; • Ensuring adequate capital to withstand shocks and stress; • Ensuring sufficient capital to expand its business ventures and inorganic growth; and • Allocating an appropriate amount of capital to business units to optimise return on
capital. The Bank’s capital management is guided by the Capital Management Plan, approved by the Board, to ensure management of capital in a consistent and aligned with the Risk Appetite Statement and Internal Capital Adequacy Assessment Process of the Bank. The Bank’s capital management processes comprise: • Capital Structuring – ensuring that the amount of regulatory and statutory capital
available is consistent with the Bank’s growth plan, risk appetite, and desired level of capital adequacy. Capital structuring focuses on selecting the appropriate, most cost-effective mix of capital instruments;
• Capital Allocation – ensuring that the capital is employed efficiently across the Bank based on risk-adjusted return on capital;
• Capital Optimisation – seeking an optimal level of capital by facilitating the optimisation of the risk profile of the balance sheet. This will be done through: reshaping of the balance sheet; capital planning, allocation and optimisation; and a sound management of the capital buffer.
As such, the four fundamental components of a sound capital planning process include:
3
BANK ISLAM MALAYSIA BERHAD PILLAR 3 DISCLOSURE AS AT 31 DECEMBER 2014
• Internal control and governance; • Capital policy and risk capture; • Forward-looking view; and • Management framework for preserving capital.
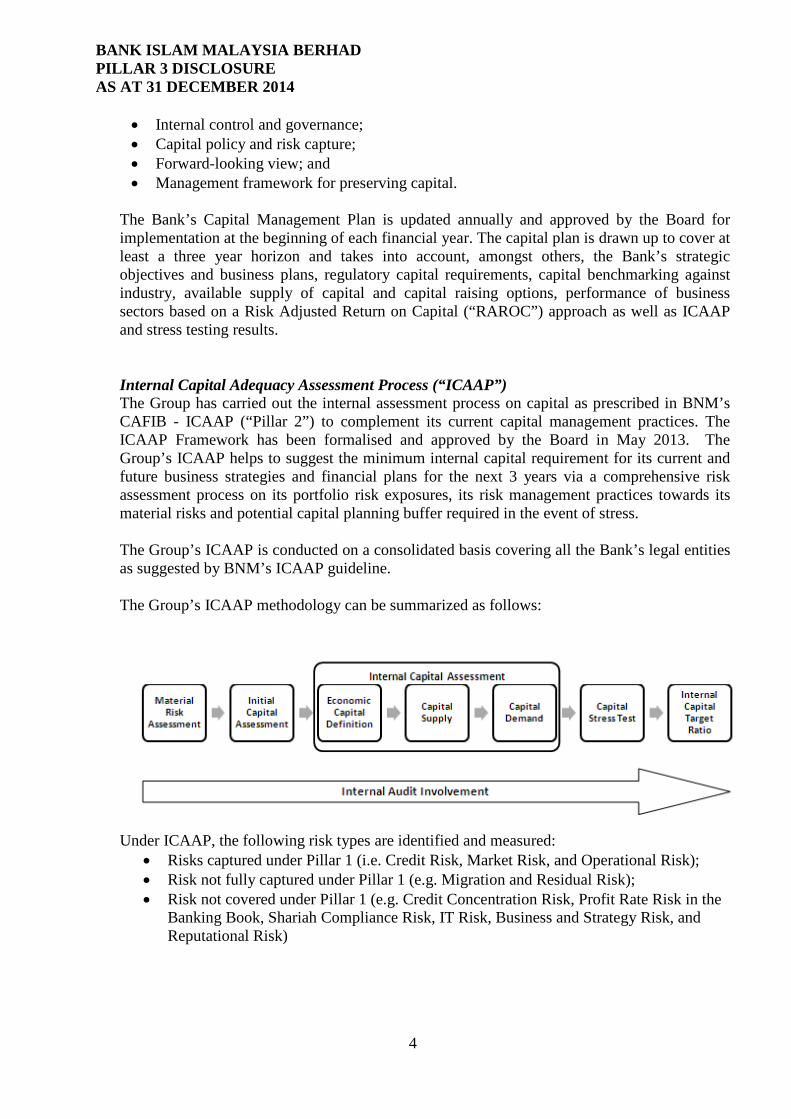
The Bank’s Capital Management Plan is updated annually and approved by the Board for implementation at the beginning of each financial year. The capital plan is drawn up to cover at least a three year horizon and takes into account, amongst others, the Bank’s strategic objectives and business plans, regulatory capital requirements, capital benchmarking against industry, available supply of capital and capital raising options, performance of business sectors based on a Risk Adjusted Return on Capital (“RAROC”) approach as well as ICAAP and stress testing results. Internal Capital Adequacy Assessment Process (“ICAAP”) The Group has carried out the internal assessment process on capital as prescribed in BNM’s CAFIB - ICAAP (“Pillar 2”) to complement its current capital management practices. The ICAAP Framework has been formalised and approved by the Board in May 2013. The Group’s ICAAP helps to suggest the minimum internal capital requirement for its current and future business strategies and financial plans for the next 3 years via a comprehensive risk assessment process on its portfolio risk exposures, its risk management practices towards its material risks and potential capital planning buffer required in the event of stress. The Group’s ICAAP is conducted on a consolidated basis covering all the Bank’s legal entities as suggested by BNM’s ICAAP guideline. The Group’s ICAAP methodology can be summarized as follows:
Under ICAAP, the following risk types are identified and measured:
• Risks captured under Pillar 1 (i.e. Credit Risk, Market Risk, and Operational Risk); • Risk not fully captured under Pillar 1 (e.g. Migration and Residual Risk); • Risk not covered under Pillar 1 (e.g. Credit Concentration Risk, Profit Rate Risk in the
Banking Book, Shariah Compliance Risk, IT Risk, Business and Strategy Risk, and Reputational Risk)
4
BANK ISLAM MALAYSIA BERHAD PILLAR 3 DISCLOSURE AS AT 31 DECEMBER 2014
Stress Testing Regular stress testing is performed to assess the Group’s ability to maintain adequate capital under both a normal business cycle and unfavorable economic conditions. The stress testing is embedded within the risk and capital management process of the Group, and is a key function of capital planning and business planning processes. The Group’s objectives of stress testing include:
• To identify the possible events or future changes in the financial and economic conditions of the country that could potentially have unfavorable effects on the Group’s exposures;
• To identify the different portfolios response to changes in key economic variables (profit rate, foreign exchange rate, GDP, etc);
• To evaluate the Group’s ability to withstand such changes, i.e. its capacity in terms of its capital and earnings, to absorb potentially significant losses;
• To better understand the Group’s risk profile, evaluate business risks and thus take appropriate measures accordingly; and
• To analyse the Group’s ability to meet the minimum regulatory capital requirement at all times throughout a reasonably severe economic crisis.
Capital Adequacy Ratios The Group is required to comply with the Common Equity Tier 1 capital ratio and total capital ratio prescribed by BNM. The Group was in compliance with all prescribed capital ratios throughout the period.
The Group’s capital adequacy ratios remained strong. The table below shows the composition of the regulatory capital and capital adequacy ratios as of 31 December 2014 determined by the requirements of the CAFIB.
5
BANK ISLAM MALAYSIA BERHAD PILLAR 3 DISCLOSURE AS AT 31 DECEMBER 2014 Capital Adequacy (continued)
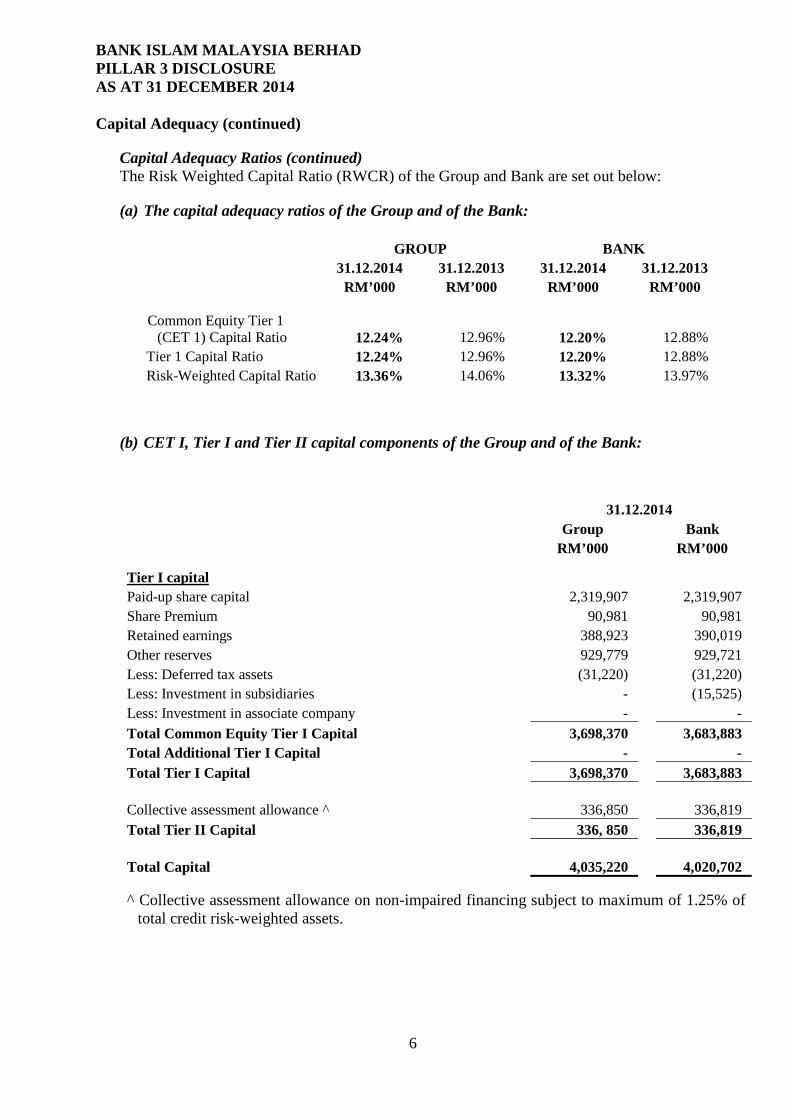
Capital Adequacy Ratios (continued) The Risk Weighted Capital Ratio (RWCR) of the Group and Bank are set out below:
(a) The capital adequacy ratios of the Group and of the Bank: GROUP BANK 31.12.2014 31.12.2013 31.12.2014 31.12.2013 RM’000 RM’000 RM’000 RM’000 Common Equity Tier 1
(CET 1) Capital Ratio 12.24% 12.96% 12.20% 12.88% Tier 1 Capital Ratio 12.24% 12.96% 12.20% 12.88% Risk-Weighted Capital Ratio 13.36% 14.06% 13.32% 13.97%
(b) CET I, Tier I and Tier II capital components of the Group and of the Bank:
31.12.2014 Group Bank RM’000 RM’000 Tier I capital Paid-up share capital 2,319,907 2,319,907 Share Premium 90,981 90,981 Retained earnings 388,923 390,019 Other reserves 929,779 929,721 Less: Deferred tax assets (31,220) (31,220) Less: Investment in subsidiaries - (15,525) Less: Investment in associate company - - Total Common Equity Tier I Capital 3,698,370 3,683,883 Total Additional Tier I Capital - - Total Tier I Capital 3,698,370 3,683,883 Collective assessment allowance ^ 336,850 336,819 Total Tier II Capital 336, 850 336,819 Total Capital 4,035,220 4,020,702 ^ Collective assessment allowance on non-impaired financing subject to maximum of 1.25% of
total credit risk-weighted assets.
6
BANK ISLAM MALAYSIA BERHAD PILLAR 3 DISCLOSURE AS AT 31 DECEMBER 2014 Capital Adequacy (continued)
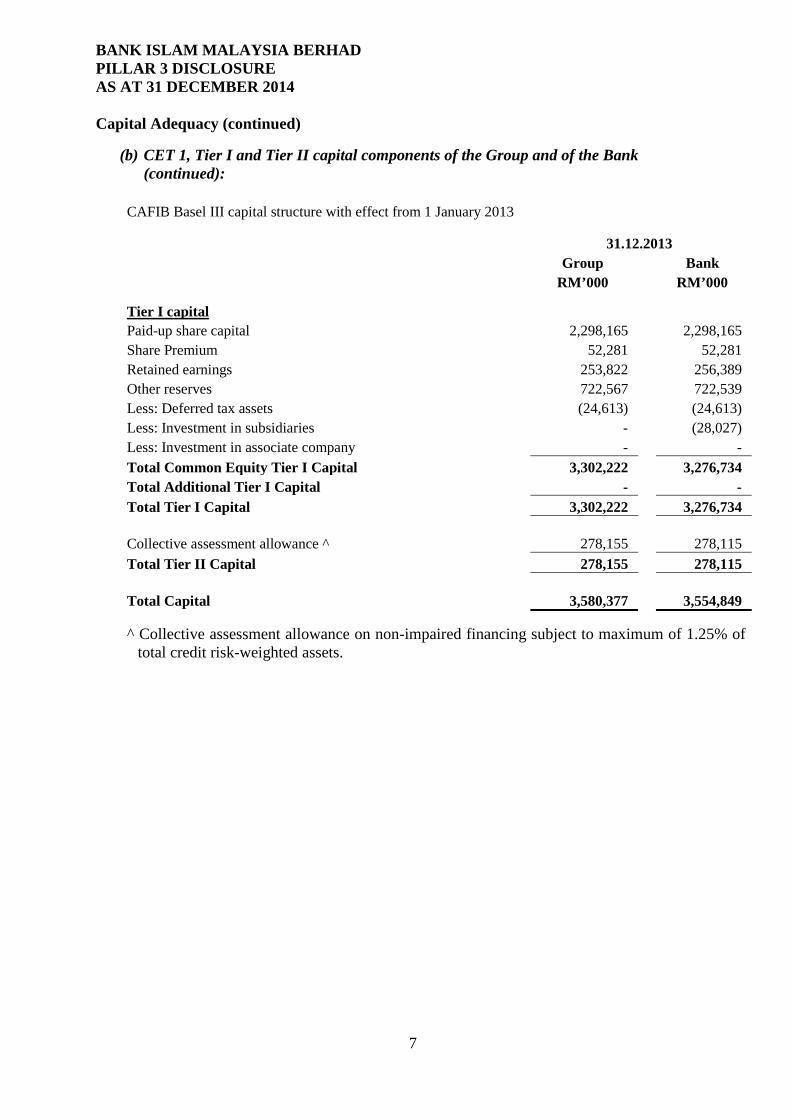
(b) CET 1, Tier I and Tier II capital components of the Group and of the Bank (continued):
CAFIB Basel III capital structure with effect from 1 January 2013
31.12.2013 Group Bank RM’000 RM’000 Tier I capital Paid-up share capital 2,298,165 2,298,165 Share Premium 52,281 52,281 Retained earnings 253,822 256,389 Other reserves 722,567 722,539 Less: Deferred tax assets (24,613) (24,613) Less: Investment in subsidiaries - (28,027) Less: Investment in associate company - - Total Common Equity Tier I Capital 3,302,222 3,276,734 Total Additional Tier I Capital - - Total Tier I Capital 3,302,222 3,276,734 Collective assessment allowance ^ 278,155 278,115 Total Tier II Capital 278,155 278,115 Total Capital 3,580,377 3,554,849 ^ Collective assessment allowance on non-impaired financing subject to maximum of 1.25% of
total credit risk-weighted assets.
7
BANK ISLAM MALAYSIA BERHAD PILLAR 3 DISCLOSURE AS AT 31 DECEMBER 2014 2. Capital Adequacy (continued)
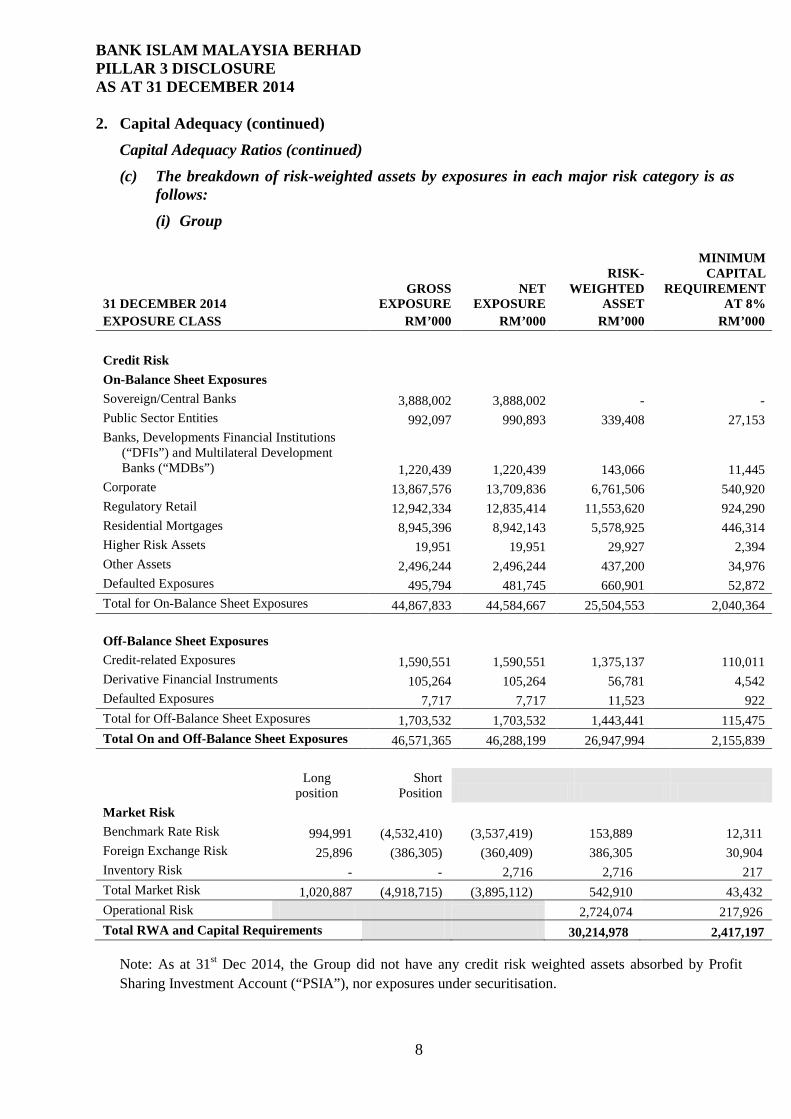
Capital Adequacy Ratios (continued) (c) The breakdown of risk-weighted assets by exposures in each major risk category is as
follows: (i) Group
31 DECEMBER 2014 EXPOSURE CLASS
GROSS EXPOSURE
RM’000
NET EXPOSURE
RM’000
RISK-WEIGHTED
ASSET RM’000
MINIMUM CAPITAL
REQUIREMENT AT 8%
RM’000 Credit Risk On-Balance Sheet Exposures Sovereign/Central Banks 3,888,002 3,888,002 - - Public Sector Entities 992,097 990,893 339,408 27,153 Banks, Developments Financial Institutions
(“DFIs”) and Multilateral Development Banks (“MDBs”) 1,220,439 1,220,439 143,066 11,445
Corporate 13,867,576 13,709,836 6,761,506 540,920 Regulatory Retail 12,942,334 12,835,414 11,553,620 924,290 Residential Mortgages 8,945,396 8,942,143 5,578,925 446,314 Higher Risk Assets 19,951 19,951 29,927 2,394 Other Assets 2,496,244 2,496,244 437,200 34,976 Defaulted Exposures 495,794 481,745 660,901 52,872 Total for On-Balance Sheet Exposures 44,867,833 44,584,667 25,504,553 2,040,364 Off-Balance Sheet Exposures Credit-related Exposures 1,590,551 1,590,551 1,375,137 110,011 Derivative Financial Instruments 105,264 105,264 56,781 4,542 Defaulted Exposures 7,717 7,717 11,523 922 Total for Off-Balance Sheet Exposures 1,703,532 1,703,532 1,443,441 115,475 Total On and Off-Balance Sheet Exposures 46,571,365 46,288,199 26,947,994 2,155,839
Long
position Short
Position Market Risk Benchmark Rate Risk 994,991 (4,532,410) (3,537,419) 153,889 12,311 Foreign Exchange Risk 25,896 (386,305) (360,409) 386,305 30,904 Inventory Risk - - 2,716 2,716 217 Total Market Risk 1,020,887 (4,918,715) (3,895,112) 542,910 43,432 Operational Risk 2,724,074 217,926 Total RWA and Capital Requirements 30,214,978 2,417,197
Note: As at 31st Dec 2014, the Group did not have any credit risk weighted assets absorbed by Profit Sharing Investment Account (“PSIA”), nor exposures under securitisation.
8
BANK ISLAM MALAYSIA BERHAD PILLAR 3 DISCLOSURE AS AT 31 DECEMBER 2014 2. Capital Adequacy (continued)
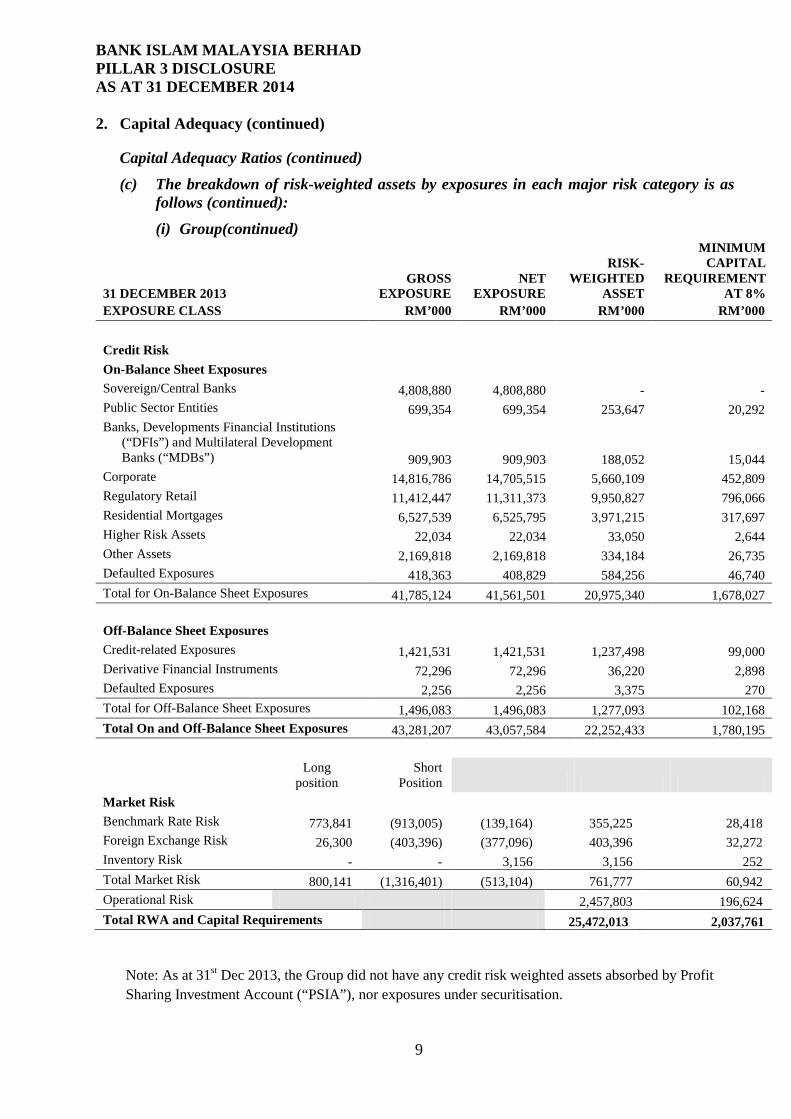
Capital Adequacy Ratios (continued) (c) The breakdown of risk-weighted assets by exposures in each major risk category is as
follows (continued): (i) Group(continued)
31 DECEMBER 2013 EXPOSURE CLASS
GROSS EXPOSURE
RM’000
NET EXPOSURE
RM’000
RISK-WEIGHTED
ASSET RM’000
MINIMUM CAPITAL
REQUIREMENT AT 8%
RM’000 Credit Risk On-Balance Sheet Exposures Sovereign/Central Banks 4,808,880 4,808,880 - - Public Sector Entities 699,354 699,354 253,647 20,292 Banks, Developments Financial Institutions
(“DFIs”) and Multilateral Development Banks (“MDBs”) 909,903 909,903 188,052 15,044
Corporate 14,816,786 14,705,515 5,660,109 452,809 Regulatory Retail 11,412,447 11,311,373 9,950,827 796,066 Residential Mortgages 6,527,539 6,525,795 3,971,215 317,697 Higher Risk Assets 22,034 22,034 33,050 2,644 Other Assets 2,169,818 2,169,818 334,184 26,735 Defaulted Exposures 418,363 408,829 584,256 46,740 Total for On-Balance Sheet Exposures 41,785,124 41,561,501 20,975,340 1,678,027 Off-Balance Sheet Exposures Credit-related Exposures 1,421,531 1,421,531 1,237,498 99,000 Derivative Financial Instruments 72,296 72,296 36,220 2,898 Defaulted Exposures 2,256 2,256 3,375 270 Total for Off-Balance Sheet Exposures 1,496,083 1,496,083 1,277,093 102,168 Total On and Off-Balance Sheet Exposures 43,281,207 43,057,584 22,252,433 1,780,195
Long
position Short
Position Market Risk Benchmark Rate Risk 773,841 (913,005) (139,164) 355,225 28,418 Foreign Exchange Risk 26,300 (403,396) (377,096) 403,396 32,272 Inventory Risk - - 3,156 3,156 252 Total Market Risk 800,141 (1,316,401) (513,104) 761,777 60,942 Operational Risk 2,457,803 196,624 Total RWA and Capital Requirements 25,472,013 2,037,761
Note: As at 31st Dec 2013, the Group did not have any credit risk weighted assets absorbed by Profit Sharing Investment Account (“PSIA”), nor exposures under securitisation.
9
BANK ISLAM MALAYSIA BERHAD PILLAR 3 DISCLOSURE AS AT 31 DECEMBER 2014 2. Capital Adequacy (continued)
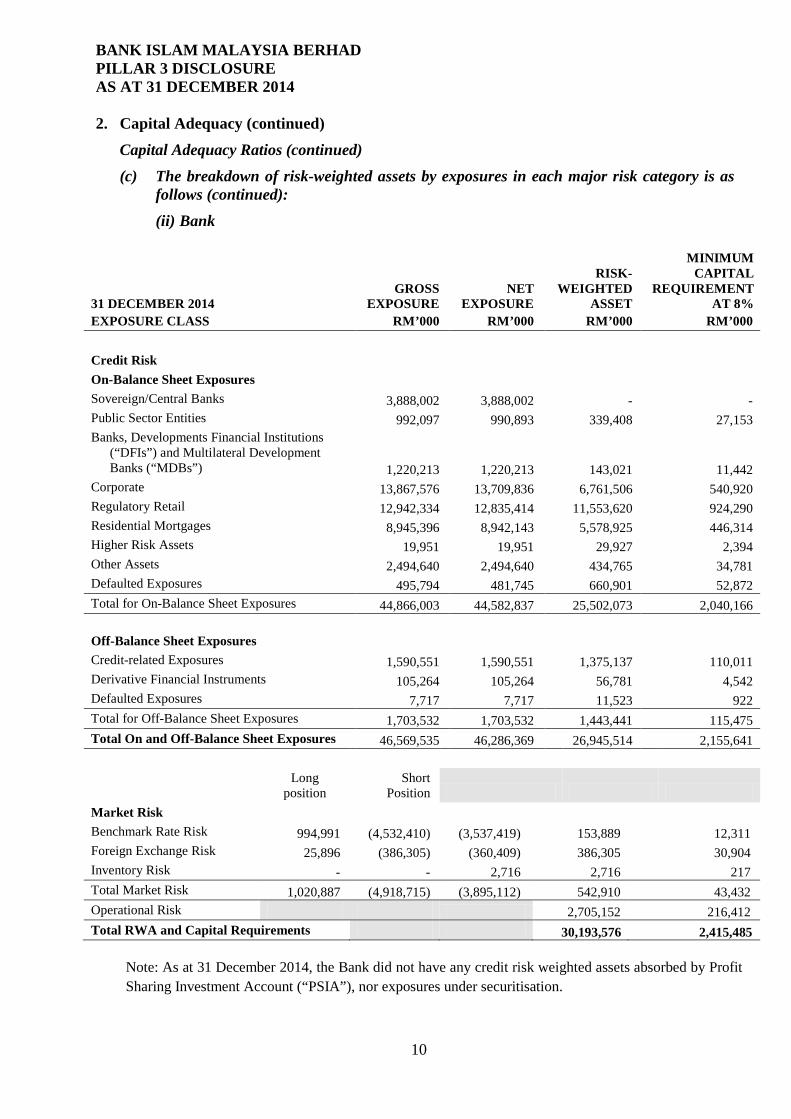
Capital Adequacy Ratios (continued) (c) The breakdown of risk-weighted assets by exposures in each major risk category is as
follows (continued): (ii) Bank
31 DECEMBER 2014 EXPOSURE CLASS
GROSS EXPOSURE
RM’000
NET EXPOSURE
RM’000
RISK-WEIGHTED
ASSET RM’000
MINIMUM CAPITAL
REQUIREMENT AT 8%
RM’000 Credit Risk On-Balance Sheet Exposures Sovereign/Central Banks 3,888,002 3,888,002 - - Public Sector Entities 992,097 990,893 339,408 27,153 Banks, Developments Financial Institutions
(“DFIs”) and Multilateral Development Banks (“MDBs”) 1,220,213 1,220,213 143,021 11,442
Corporate 13,867,576 13,709,836 6,761,506 540,920 Regulatory Retail 12,942,334 12,835,414 11,553,620 924,290 Residential Mortgages 8,945,396 8,942,143 5,578,925 446,314 Higher Risk Assets 19,951 19,951 29,927 2,394 Other Assets 2,494,640 2,494,640 434,765 34,781 Defaulted Exposures 495,794 481,745 660,901 52,872 Total for On-Balance Sheet Exposures 44,866,003 44,582,837 25,502,073 2,040,166 Off-Balance Sheet Exposures Credit-related Exposures 1,590,551 1,590,551 1,375,137 110,011 Derivative Financial Instruments 105,264 105,264 56,781 4,542 Defaulted Exposures 7,717 7,717 11,523 922 Total for Off-Balance Sheet Exposures 1,703,532 1,703,532 1,443,441 115,475 Total On and Off-Balance Sheet Exposures 46,569,535 46,286,369 26,945,514 2,155,641
Long
position Short
Position Market Risk Benchmark Rate Risk 994,991 (4,532,410) (3,537,419) 153,889 12,311 Foreign Exchange Risk 25,896 (386,305) (360,409) 386,305 30,904 Inventory Risk - - 2,716 2,716 217 Total Market Risk 1,020,887 (4,918,715) (3,895,112) 542,910 43,432 Operational Risk 2,705,152 216,412 Total RWA and Capital Requirements 30,193,576 2,415,485
Note: As at 31 December 2014, the Bank did not have any credit risk weighted assets absorbed by Profit Sharing Investment Account (“PSIA”), nor exposures under securitisation.
10
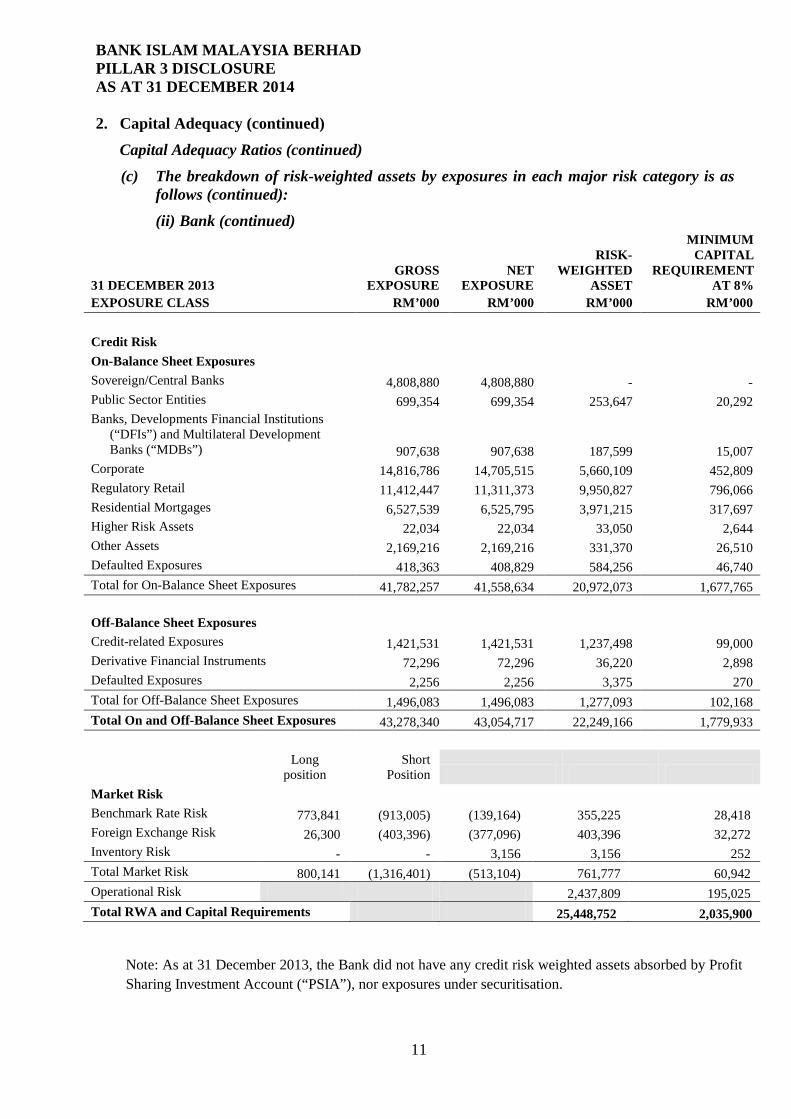
BANK ISLAM MALAYSIA BERHAD PILLAR 3 DISCLOSURE AS AT 31 DECEMBER 2014 2. Capital Adequacy (continued)
Capital Adequacy Ratios (continued) (c) The breakdown of risk-weighted assets by exposures in each major risk category is as
follows (continued): (ii) Bank (continued)
31 DECEMBER 2013 EXPOSURE CLASS
GROSS EXPOSURE
RM’000
NET EXPOSURE
RM’000
RISK-WEIGHTED
ASSET RM’000
MINIMUM CAPITAL
REQUIREMENT AT 8%
RM’000 Credit Risk On-Balance Sheet Exposures Sovereign/Central Banks 4,808,880 4,808,880 - - Public Sector Entities 699,354 699,354 253,647 20,292 Banks, Developments Financial Institutions
(“DFIs”) and Multilateral Development Banks (“MDBs”) 907,638 907,638 187,599 15,007
Corporate 14,816,786 14,705,515 5,660,109 452,809 Regulatory Retail 11,412,447 11,311,373 9,950,827 796,066 Residential Mortgages 6,527,539 6,525,795 3,971,215 317,697 Higher Risk Assets 22,034 22,034 33,050 2,644 Other Assets 2,169,216 2,169,216 331,370 26,510 Defaulted Exposures 418,363 408,829 584,256 46,740 Total for On-Balance Sheet Exposures 41,782,257 41,558,634 20,972,073 1,677,765 Off-Balance Sheet Exposures Credit-related Exposures 1,421,531 1,421,531 1,237,498 99,000 Derivative Financial Instruments 72,296 72,296 36,220 2,898 Defaulted Exposures 2,256 2,256 3,375 270 Total for Off-Balance Sheet Exposures 1,496,083 1,496,083 1,277,093 102,168 Total On and Off-Balance Sheet Exposures 43,278,340 43,054,717 22,249,166 1,779,933
Long
position Short
Position Market Risk Benchmark Rate Risk 773,841 (913,005) (139,164) 355,225 28,418 Foreign Exchange Risk 26,300 (403,396) (377,096) 403,396 32,272 Inventory Risk - - 3,156 3,156 252 Total Market Risk 800,141 (1,316,401) (513,104) 761,777 60,942 Operational Risk 2,437,809 195,025 Total RWA and Capital Requirements 25,448,752 2,035,900
Note: As at 31 December 2013, the Bank did not have any credit risk weighted assets absorbed by Profit Sharing Investment Account (“PSIA”), nor exposures under securitisation.
11
BANK ISLAM MALAYSIA BERHAD PILLAR 3 DISCLOSURE AS AT 31 DECEMBER 2014 3. Risk Management
The Group’s mission with respect to risk management is to advance its risk management capabilities, culture and practices so as to be in line with internationally accepted standards and practices.
In that regard, the objectives of managing risk are to:
• Inculcate a risk-awareness culture throughout the Group; • Establish a standard approach and methodology in managing credit, market, liquidity,
operational and business risks across the Group; • Clarify functional structures including objectives, roles and responsibilities; • Implement and use a risk management information system that meets international
standards on confidentiality, integrity and its availability; • Develop and use tools, such as economic capital, value at risk, scoring models and stress
testing to support the measurement of risks and enhance risk-based decisions; • Ensure that risk policies and overall risk appetite are in line with business targets; and • Ensure that the Group’s capital can support current and planned business needs in terms
of risk exposures.
Risk Management Functional and Governance Structure
The Group has realigned its risk organisational responsibilities with the objective of ensuring a common view of risks across the Group. As a matter of good business practice and prudence, the Group’s core risk management functions, which report to the Board Risk Committee (“BRC”), are independent and clearly segregated from the business divisions and centralized at head office.
12
BANK ISLAM MALAYSIA BERHAD PILLAR 3 DISCLOSURE AS AT 31 DECEMBER 2014 3. Risk Management (continued)
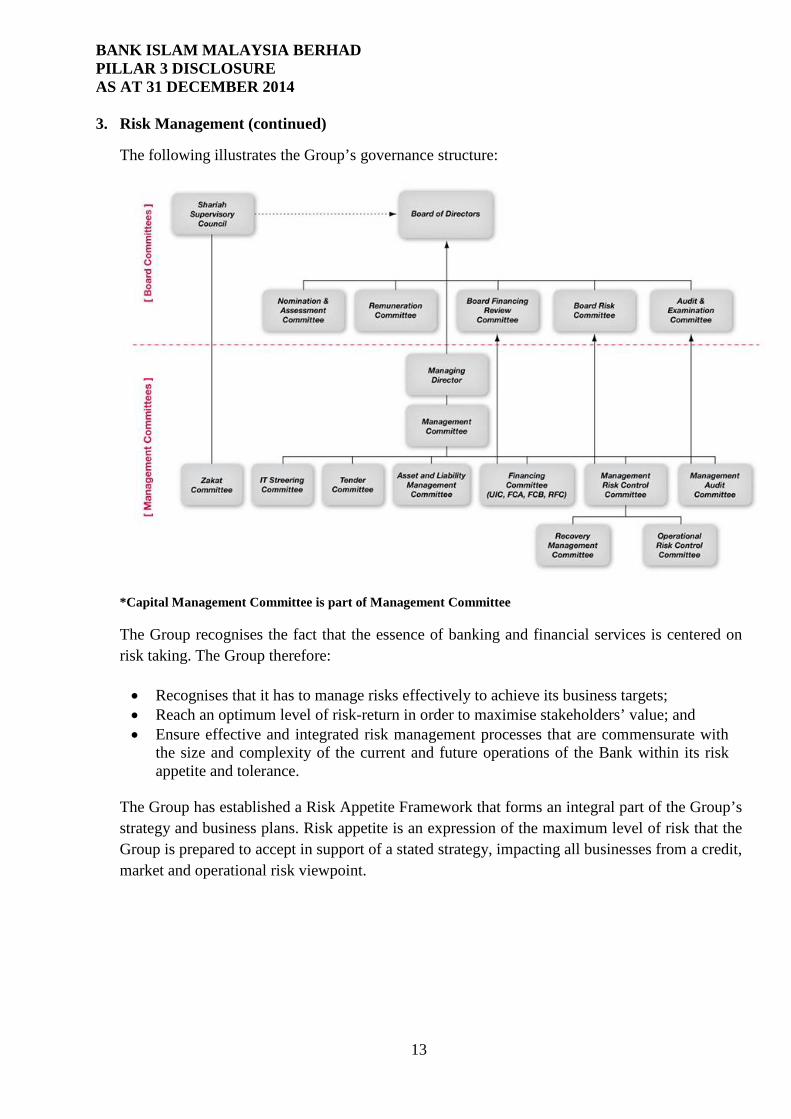
The following illustrates the Group’s governance structure:
*Capital Management Committee is part of Management Committee
The Group recognises the fact that the essence of banking and financial services is centered on risk taking. The Group therefore:
• Recognises that it has to manage risks effectively to achieve its business targets; • Reach an optimum level of risk-return in order to maximise stakeholders’ value; and • Ensure effective and integrated risk management processes that are commensurate with
the size and complexity of the current and future operations of the Bank within its risk appetite and tolerance.
The Group has established a Risk Appetite Framework that forms an integral part of the Group’s strategy and business plans. Risk appetite is an expression of the maximum level of risk that the Group is prepared to accept in support of a stated strategy, impacting all businesses from a credit, market and operational risk viewpoint.
13
BANK ISLAM MALAYSIA BERHAD PILLAR 3 DISCLOSURE AS AT 31 DECEMBER 2014
4. Credit Risk
Credit risk arises from all transactions that could lead to actual, contingent or potential claims against any party, borrower or obligor. The types of credit risks that the Bank considers to be material include: Default Risk, Counterparty Risk, Pre-Settlement Risk, Credit Concentration Risk, Residual/Credit Mitigation Risk, and Migration Risk. Credit risk governance The management of credit risk is principally carried out by using sets of policies and guidelines approved by the Board Risk Committee (“BRC”), guided by the Board of Directors’ approved Risk Appetite Statement. The Management Risk Control Committee (“MRCC”) is responsible under the authority delegated by the BRC for managing credit risk at strategic level. The MRCC reviews the Bank’s credit risk frameworks and guidelines, aligns credit risk management with business strategies and planning, reviews credit profile of the credit portfolios and recommends necessary actions to ensure that the credit risk remains within established risk tolerance levels. The Group’s credit risk management governance includes the establishment of comprehensive credit risk policies, guidelines and procedures which document the Group’s financing standards, discretionary powers for financing approval, credit risk ratings methodologies and models, acceptable collaterals and valuation, and the review, rehabilitation and restructuring of problematic and delinquent financing. Management of Credit Risk The management of credit risk is being performed by two distinct departments within the Risk Management Division (“RMD”), i.e. Credit Analysis and Credit Risk Control and two departments outside of the RMD domain, namely, Credit Administration and Credit Recovery. The combined objectives are, amongst others:
• To build a high quality credit portfolio in line with the Group’s overall strategy and risk appetite;
• To ensure that the Bank is compensated for the risk taken, balancing/optimizing the risk /return relationship;
• To develop an increasing ability to recognise, measure and avoid or mitigate potential credit risk problem areas; and
• To conform with statutory, regulatory and internal credit requirements. The Group monitors its credit exposures either on a portfolio basis or individual basis through annual reviews. Credit risk is proactively monitored through a set of early warning signals that could trigger immediate reviews of (a certain part of) the portfolio. The affected portfolio or financing is placed on a watch list to enforce close monitoring and prevent financing from turning impaired and to increase chances of full recovery. A comprehensive limit structure is in place to ensure that risks taken are within the risk appetite as set by the Board and to avoid credit risk contagion to a single customer, sector, product, Shariah contract, etc.
14

BANK ISLAM MALAYSIA BERHAD PILLAR 3 DISCLOSURE AS AT 31 DECEMBER 2014
Credit risk arising from dealing and investing activities are managed by the establishment of limits which include counter parties limits and permissible acquisition of private entities’ instruments, subject to a specified minimum rating threshold. Furthermore, the dealing and investing activities are monitored by an independent middle office unit.
Capital Treatment for Credit Risk The Bank adopts the Standardized Approach to compute the credit risk capital requirement under BNM’s Capital Adequacy Framework for Islamic Banks (CAFIB).
15
BANK ISLAM MALAYSIA BERHAD PILLAR 3 DISCLOSURE AS AT 31 DECEMBER 2014 Credit Risk (continued)
4.1 Credit Quality of Gross Financing and Advances
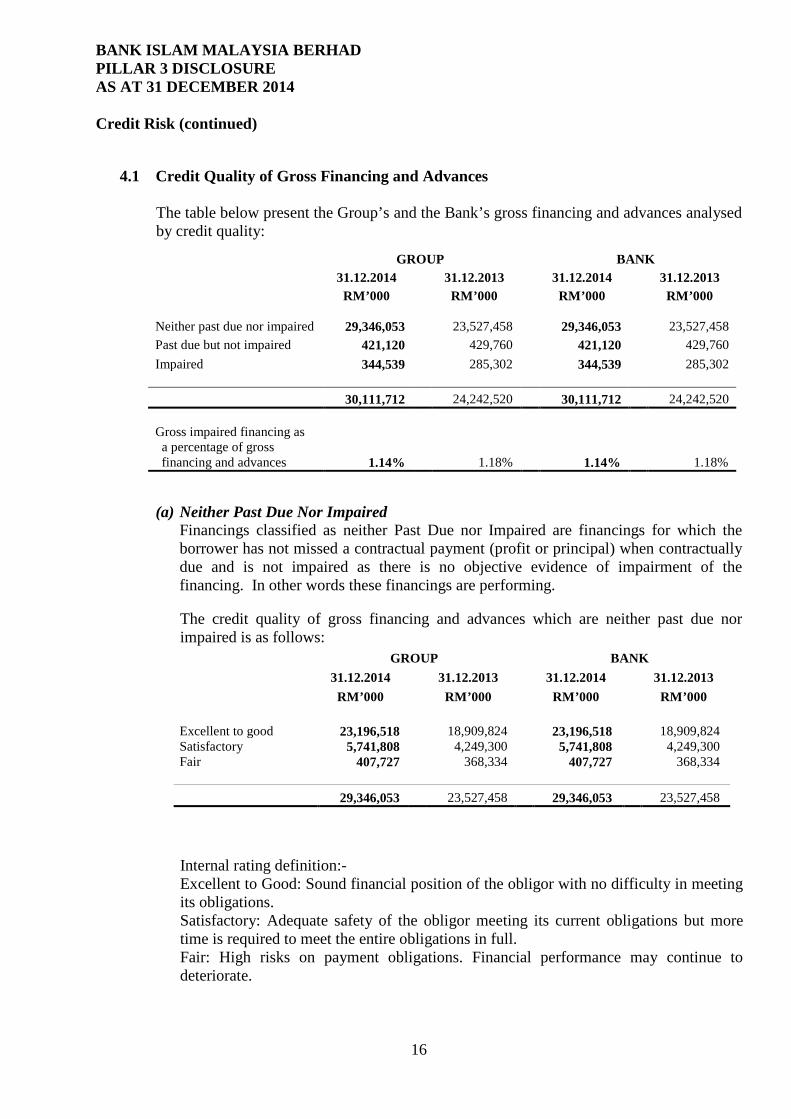
The table below present the Group’s and the Bank’s gross financing and advances analysed by credit quality:
GROUP BANK 31.12.2014 31.12.2013 31.12.2014 31.12.2013 RM’000 RM’000 RM’000 RM’000 Neither past due nor impaired 29,346,053 23,527,458 29,346,053 23,527,458 Past due but not impaired 421,120 429,760 421,120 429,760 Impaired 344,539 285,302 344,539 285,302 30,111,712 24,242,520 30,111,712 24,242,520 Gross impaired financing as a percentage of gross financing and advances 1.14% 1.18% 1.14% 1.18%
(a) Neither Past Due Nor Impaired
Financings classified as neither Past Due nor Impaired are financings for which the borrower has not missed a contractual payment (profit or principal) when contractually due and is not impaired as there is no objective evidence of impairment of the financing. In other words these financings are performing. The credit quality of gross financing and advances which are neither past due nor impaired is as follows: GROUP BANK 31.12.2014 31.12.2013 31.12.2014 31.12.2013 RM’000 RM’000 RM’000 RM’000
Excellent to good 23,196,518 18,909,824 23,196,518 18,909,824 Satisfactory 5,741,808 4,249,300 5,741,808 4,249,300 Fair 407,727 368,334 407,727 368,334
29,346,053 23,527,458 29,346,053 23,527,458
Internal rating definition:- Excellent to Good: Sound financial position of the obligor with no difficulty in meeting its obligations. Satisfactory: Adequate safety of the obligor meeting its current obligations but more time is required to meet the entire obligations in full. Fair: High risks on payment obligations. Financial performance may continue to deteriorate.
16
BANK ISLAM MALAYSIA BERHAD PILLAR 3 DISCLOSURE AS AT 31 DECEMBER 2014
4. Credit Risk (continued)
4.1 Credit Quality of Gross Financing and Advances (continued)
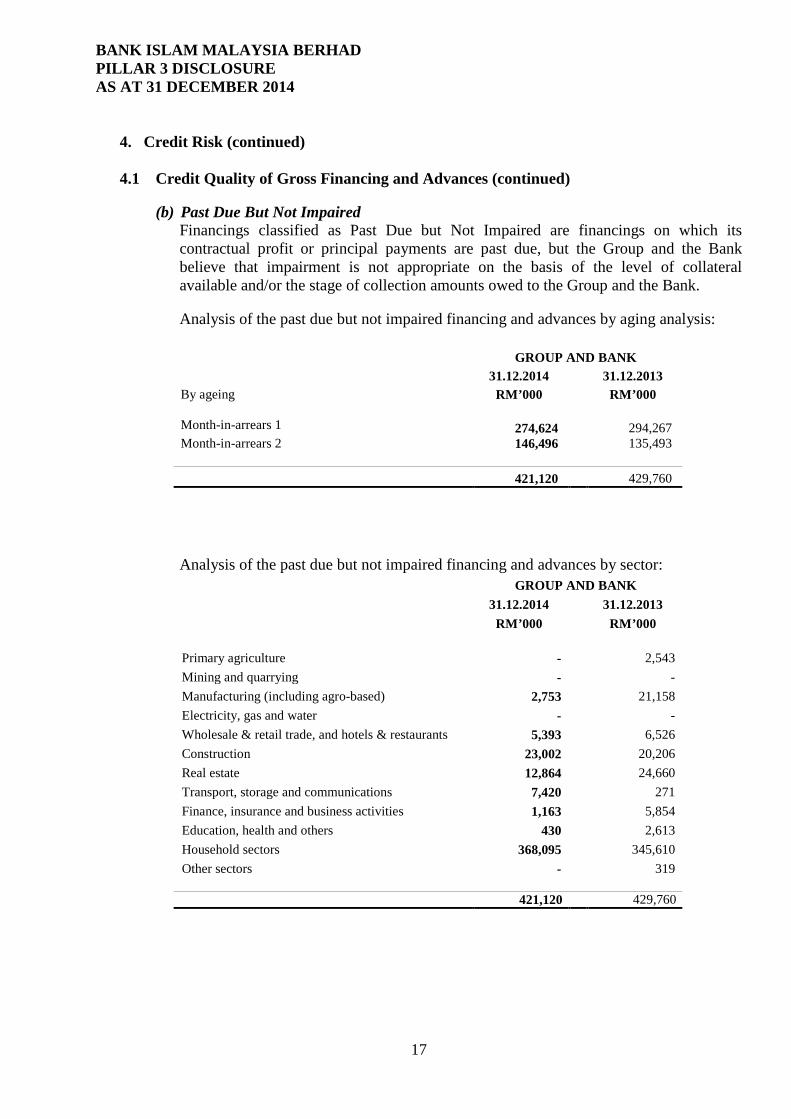
(b) Past Due But Not Impaired
Financings classified as Past Due but Not Impaired are financings on which its contractual profit or principal payments are past due, but the Group and the Bank believe that impairment is not appropriate on the basis of the level of collateral available and/or the stage of collection amounts owed to the Group and the Bank. Analysis of the past due but not impaired financing and advances by aging analysis: GROUP AND BANK 31.12.2014 31.12.2013 By ageing RM’000 RM’000 Month-in-arrears 1 274,624 294,267 Month-in-arrears 2 146,496 135,493
421,120 429,760
Analysis of the past due but not impaired financing and advances by sector: GROUP AND BANK 31.12.2014 31.12.2013 RM’000 RM’000 Primary agriculture - 2,543 Mining and quarrying - - Manufacturing (including agro-based) 2,753 21,158 Electricity, gas and water - - Wholesale & retail trade, and hotels & restaurants 5,393 6,526 Construction 23,002 20,206 Real estate 12,864 24,660 Transport, storage and communications 7,420 271 Finance, insurance and business activities 1,163 5,854 Education, health and others 430 2,613 Household sectors 368,095 345,610 Other sectors - 319 421,120 429,760
17
BANK ISLAM MALAYSIA BERHAD PILLAR 3 DISCLOSURE AS AT 31 DECEMBER 2014
4. Credit Risk (continued)
4.1 Credit Quality of Gross Financing and Advances (continued)
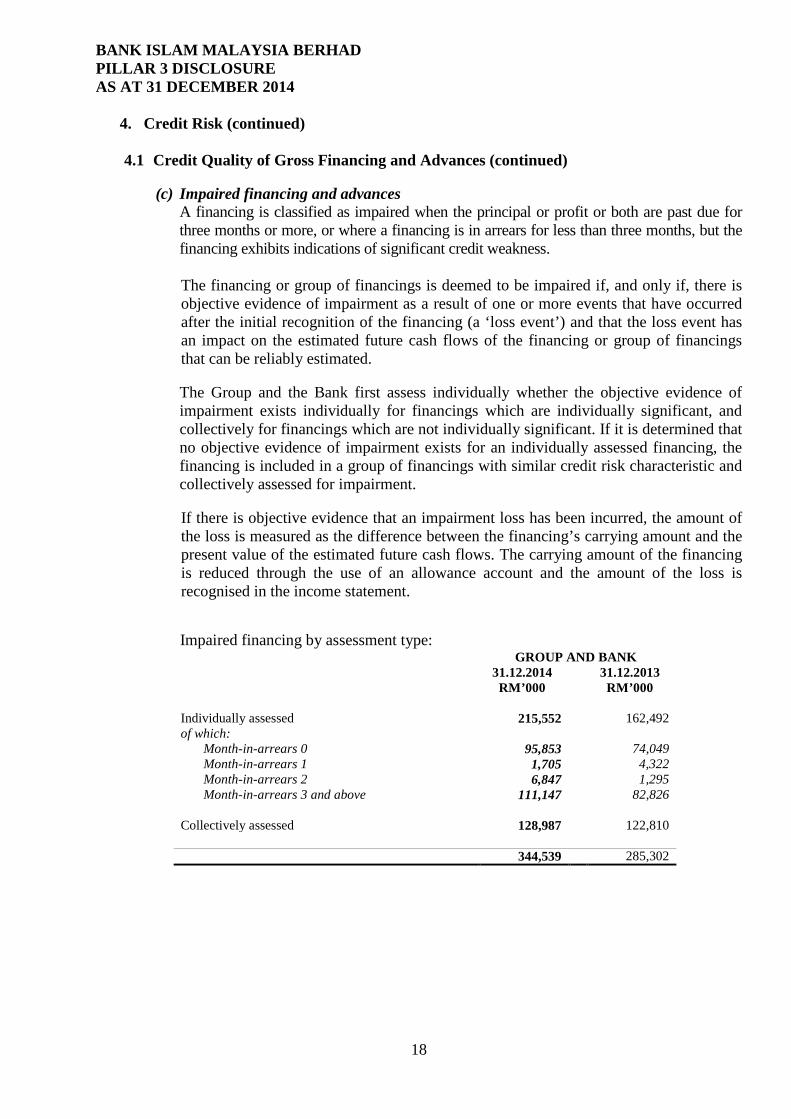
(c) Impaired financing and advances A financing is classified as impaired when the principal or profit or both are past due for three months or more, or where a financing is in arrears for less than three months, but the financing exhibits indications of significant credit weakness. The financing or group of financings is deemed to be impaired if, and only if, there is objective evidence of impairment as a result of one or more events that have occurred after the initial recognition of the financing (a ‘loss event’) and that the loss event has an impact on the estimated future cash flows of the financing or group of financings that can be reliably estimated. The Group and the Bank first assess individually whether the objective evidence of impairment exists individually for financings which are individually significant, and collectively for financings which are not individually significant. If it is determined that no objective evidence of impairment exists for an individually assessed financing, the financing is included in a group of financings with similar credit risk characteristic and collectively assessed for impairment. If there is objective evidence that an impairment loss has been incurred, the amount of the loss is measured as the difference between the financing’s carrying amount and the present value of the estimated future cash flows. The carrying amount of the financing is reduced through the use of an allowance account and the amount of the loss is recognised in the income statement. Impaired financing by assessment type:
GROUP AND BANK 31.12.2014 31.12.2013 RM’000 RM’000
Individually assessed 215,552 162,492 of which:
Month-in-arrears 0 95,853 74,049 Month-in-arrears 1 1,705 4,322 Month-in-arrears 2 6,847 1,295 Month-in-arrears 3 and above 111,147 82,826
Collectively assessed 128,987 122,810
344,539 285,302
18
BANK ISLAM MALAYSIA BERHAD PILLAR 3 DISCLOSURE AS AT 31 DECEMBER 2014
4. Credit Risk (continued)
4.1 Credit Quality of Gross Financing and Advances (continued)
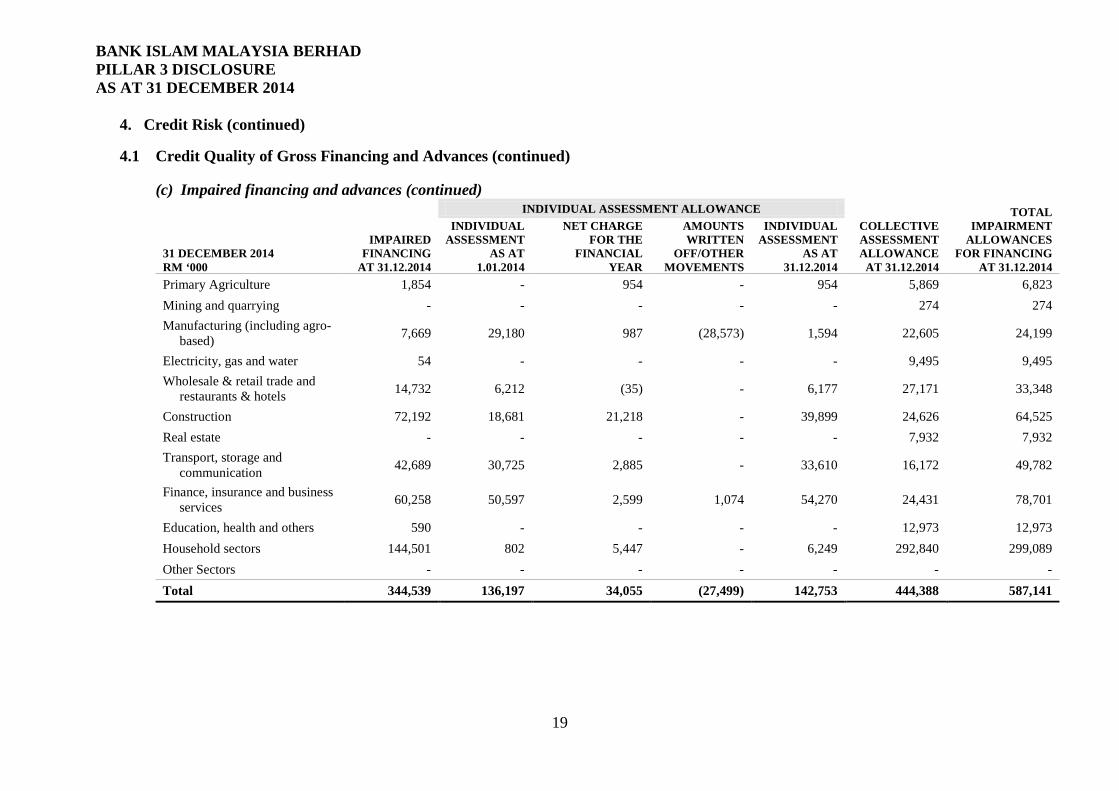
(c) Impaired financing and advances (continued)
31 DECEMBER 2014 RM ‘000
IMPAIRED FINANCING
AT 31.12.2014
INDIVIDUAL ASSESSMENT ALLOWANCE COLLECTIVE ASSESSMENT ALLOWANCE
AT 31.12.2014
TOTAL IMPAIRMENT
ALLOWANCES FOR FINANCING
AT 31.12.2014
INDIVIDUAL ASSESSMENT
AS AT 1.01.2014
NET CHARGE FOR THE
FINANCIAL YEAR
AMOUNTS WRITTEN
OFF/OTHER MOVEMENTS
INDIVIDUAL ASSESSMENT
AS AT 31.12.2014
Primary Agriculture 1,854 - 954 - 954 5,869 6,823 Mining and quarrying - - - - - 274 274 Manufacturing (including agro-
based) 7,669 29,180 987 (28,573) 1,594 22,605 24,199
Electricity, gas and water 54 - - - - 9,495 9,495 Wholesale & retail trade and
restaurants & hotels 14,732 6,212 (35) - 6,177 27,171 33,348
Construction 72,192 18,681 21,218 - 39,899 24,626 64,525 Real estate - - - - - 7,932 7,932 Transport, storage and
communication 42,689 30,725 2,885 - 33,610 16,172 49,782
Finance, insurance and business services 60,258 50,597 2,599 1,074 54,270 24,431 78,701
Education, health and others 590 - - - - 12,973 12,973 Household sectors 144,501 802 5,447 - 6,249 292,840 299,089 Other Sectors - - - - - - - Total 344,539 136,197 34,055 (27,499) 142,753 444,388 587,141
19
BANK ISLAM MALAYSIA BERHAD PILLAR 3 DISCLOSURE AS AT 31 DECEMBER 2014 4. Credit Risk (continued)
4.1 Credit Quality of Gross Financing and Advances (continued)
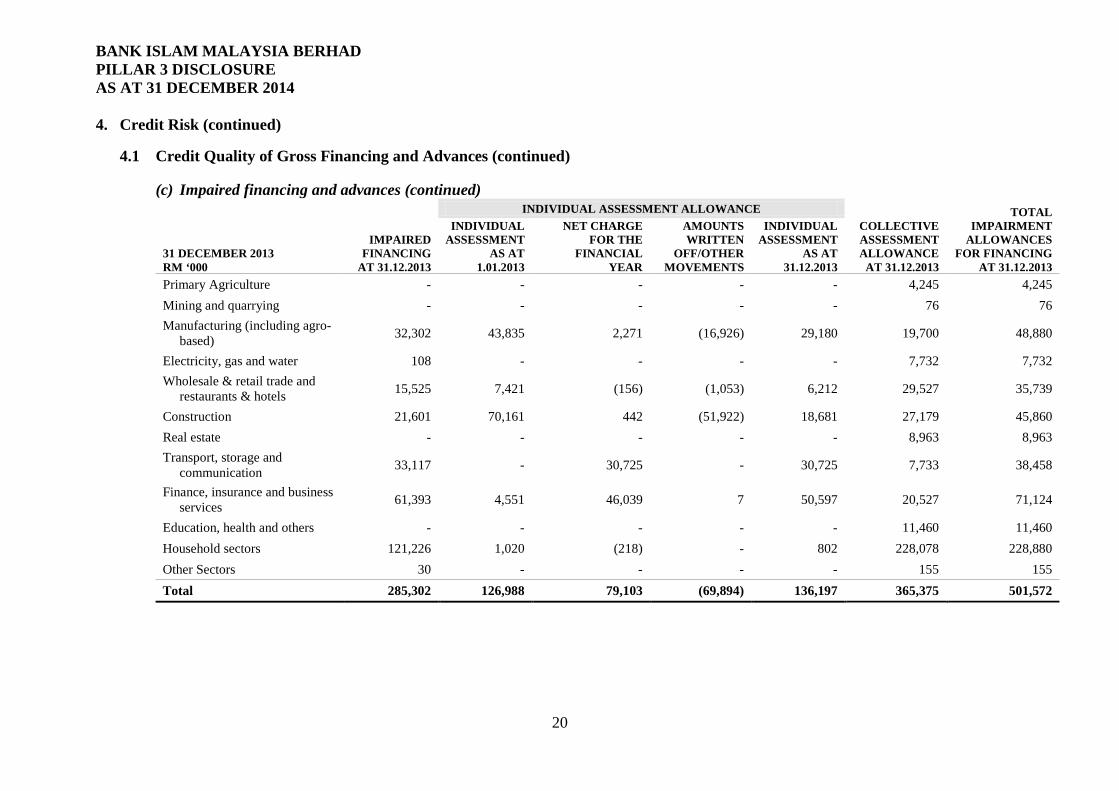
(c) Impaired financing and advances (continued)
31 DECEMBER 2013 RM ‘000
IMPAIRED FINANCING
AT 31.12.2013
INDIVIDUAL ASSESSMENT ALLOWANCE COLLECTIVE ASSESSMENT ALLOWANCE
AT 31.12.2013
TOTAL IMPAIRMENT
ALLOWANCES FOR FINANCING
AT 31.12.2013
INDIVIDUAL ASSESSMENT
AS AT 1.01.2013
NET CHARGE FOR THE
FINANCIAL YEAR
AMOUNTS WRITTEN
OFF/OTHER MOVEMENTS
INDIVIDUAL ASSESSMENT
AS AT 31.12.2013
Primary Agriculture - - - - - 4,245 4,245 Mining and quarrying - - - - - 76 76 Manufacturing (including agro-
based) 32,302 43,835 2,271 (16,926) 29,180 19,700 48,880
Electricity, gas and water 108 - - - - 7,732 7,732 Wholesale & retail trade and
restaurants & hotels 15,525 7,421 (156) (1,053) 6,212 29,527 35,739
Construction 21,601 70,161 442 (51,922) 18,681 27,179 45,860 Real estate - - - - - 8,963 8,963 Transport, storage and
communication 33,117 - 30,725 - 30,725 7,733 38,458
Finance, insurance and business services 61,393 4,551 46,039 7 50,597 20,527 71,124
Education, health and others - - - - - 11,460 11,460 Household sectors 121,226 1,020 (218) - 802 228,078 228,880 Other Sectors 30 - - - - 155 155 Total 285,302 126,988 79,103 (69,894) 136,197 365,375 501,572
20
BANK ISLAM MALAYSIA BERHAD PILLAR 3 DISCLOSURE AS AT 31 DECEMBER 2014
4. Credit Risk (continued) 4.1 Credit Quality of Gross Financing and Advances (continued)
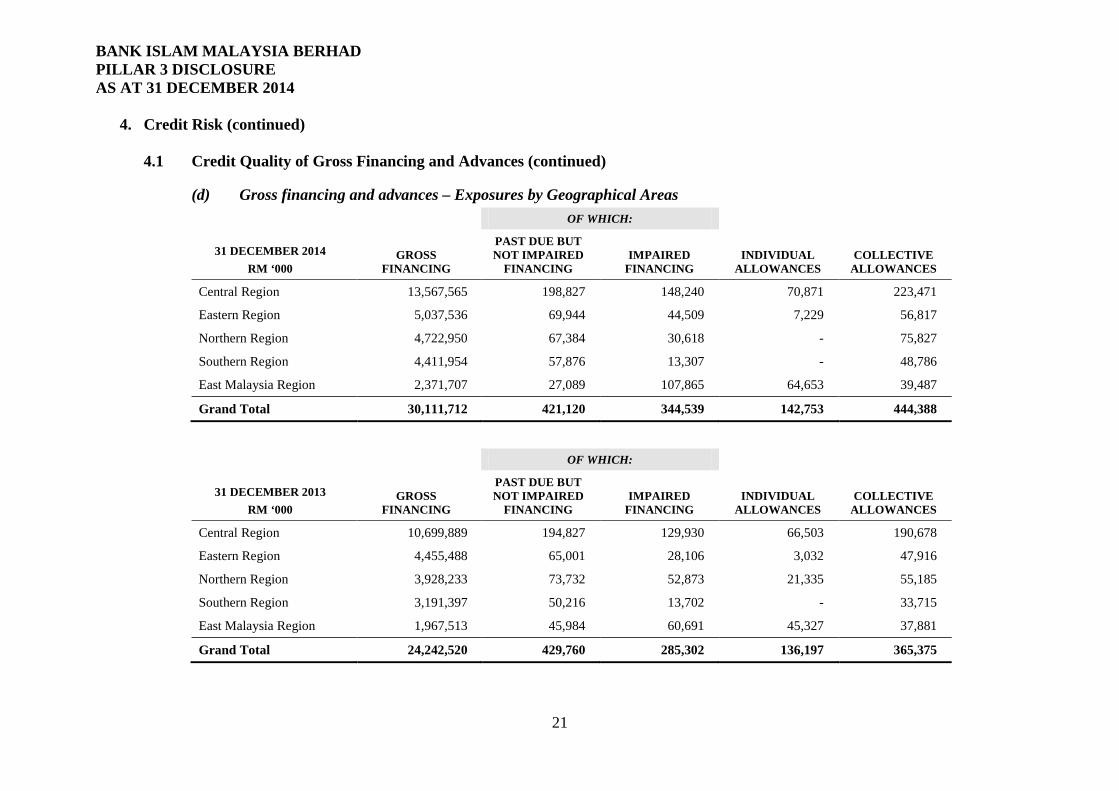
(d) Gross financing and advances – Exposures by Geographical Areas
31 DECEMBER 2014 RM ‘000
GROSS FINANCING
OF WHICH:
INDIVIDUAL ALLOWANCES
COLLECTIVE ALLOWANCES
PAST DUE BUT NOT IMPAIRED
FINANCING IMPAIRED
FINANCING
Central Region 13,567,565 198,827 148,240 70,871 223,471
Eastern Region 5,037,536 69,944 44,509 7,229 56,817
Northern Region 4,722,950 67,384 30,618 - 75,827
Southern Region 4,411,954 57,876 13,307 - 48,786
East Malaysia Region 2,371,707 27,089 107,865 64,653 39,487
Grand Total 30,111,712 421,120 344,539 142,753 444,388
31 DECEMBER 2013 RM ‘000
GROSS FINANCING
OF WHICH:
INDIVIDUAL ALLOWANCES
COLLECTIVE ALLOWANCES
PAST DUE BUT NOT IMPAIRED
FINANCING IMPAIRED
FINANCING
Central Region 10,699,889 194,827 129,930 66,503 190,678
Eastern Region 4,455,488 65,001 28,106 3,032 47,916
Northern Region 3,928,233 73,732 52,873 21,335 55,185
Southern Region 3,191,397 50,216 13,702 - 33,715
East Malaysia Region 1,967,513 45,984 60,691 45,327 37,881
Grand Total 24,242,520 429,760 285,302 136,197 365,375
21
BANK ISLAM MALAYSIA BERHAD PILLAR 3 DISCLOSURE AS AT 31 DECEMBER 2014
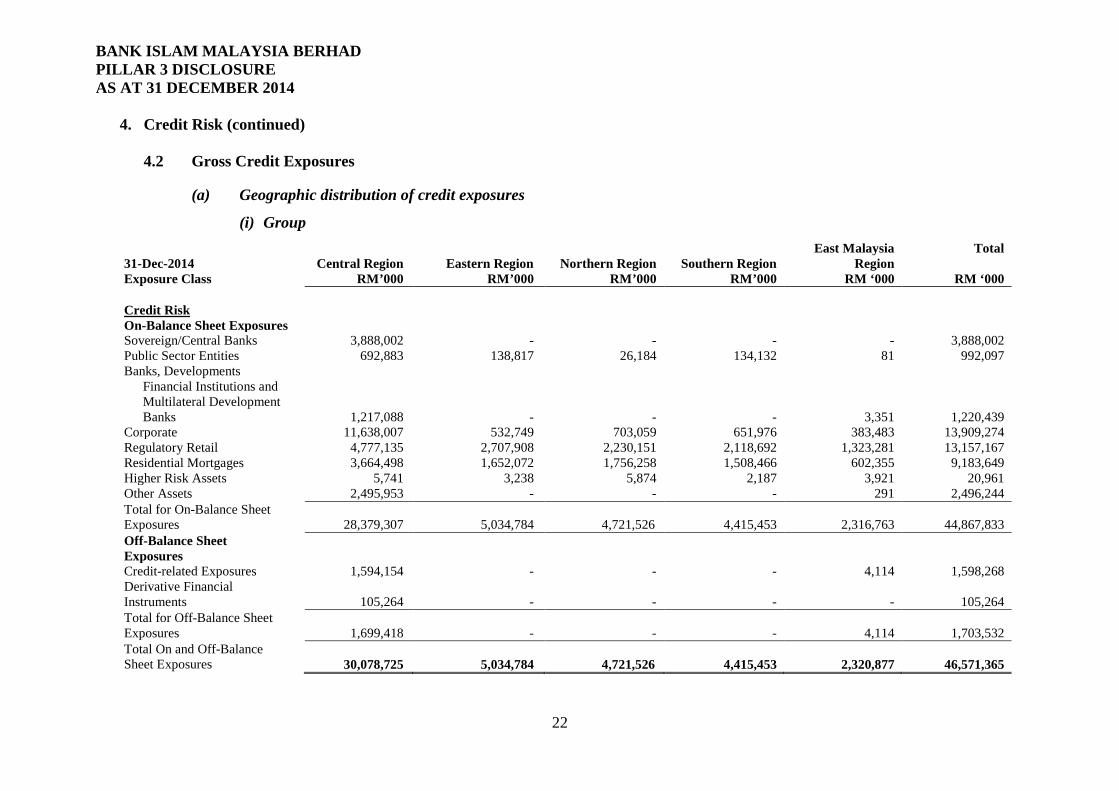
4. Credit Risk (continued) 4.2 Gross Credit Exposures
(a) Geographic distribution of credit exposures
(i) Group
31-Dec-2014 Exposure Class
Central Region RM’000
Eastern Region RM’000
Northern Region RM’000
Southern Region RM’000
East Malaysia Region
RM ‘000
Total
RM ‘000 Credit Risk On-Balance Sheet Exposures Sovereign/Central Banks 3,888,002 - - - - 3,888,002 Public Sector Entities 692,883 138,817 26,184 134,132 81 992,097 Banks, Developments
Financial Institutions and Multilateral Development Banks 1,217,088 - - -
3,351
1,220,439 Corporate 11,638,007 532,749 703,059 651,976 383,483 13,909,274 Regulatory Retail 4,777,135 2,707,908 2,230,151 2,118,692 1,323,281 13,157,167 Residential Mortgages 3,664,498 1,652,072 1,756,258 1,508,466 602,355 9,183,649 Higher Risk Assets 5,741 3,238 5,874 2,187 3,921 20,961 Other Assets 2,495,953 - - - 291 2,496,244 Total for On-Balance Sheet Exposures 28,379,307 5,034,784 4,721,526 4,415,453
2,316,763
44,867,833
Off-Balance Sheet Exposures
Credit-related Exposures 1,594,154 - - - 4,114 1,598,268 Derivative Financial Instruments 105,264 - - -
-
105,264
Total for Off-Balance Sheet Exposures 1,699,418 - - -
4,114
1,703,532
Total On and Off-Balance Sheet Exposures 30,078,725 5,034,784 4,721,526 4,415,453
2,320,877
46,571,365
22

BANK ISLAM MALAYSIA BERHAD PILLAR 3 DISCLOSURE AS AT 31 DECEMBER 2014
4. Credit Risk (continued) 4.2 Gross Credit Exposures (continued)
(a) Geographic distribution of credit exposures (continued)
(i) Group(continued)
31-Dec-2013 Exposure Class
Central Region RM’000
Eastern Region RM’000
Northern Region RM’000
Southern Region RM’000
East Malaysia Region
RM ‘000
Total
RM ‘000 Credit Risk On-Balance Sheet Exposures Sovereign/Central Banks 4,808,880 - - - - 4,808,880 Public Sector Entities 490,022 112,481 28,891 67,839 121 699,354 Banks, Developments
Financial Institutions and Multilateral Development Banks 903,903 - - -
6,000
909,903 Corporate 13,120,240 490,459 530,971 220,152 434,292 14,796,114 Regulatory Retail 4,082,044 2,653,793 1,981,086 1,816,313 1,079,702 11,612,938 Residential Mortgages 2,710,656 1,197,203 1,358,151 1,088,249 410,016 6,764,275 Higher Risk Assets 7,541 3,957 6,724 1,115 4,505 23,842 Other Assets 2,169,467 - - - 351 2,169,818 Total for On-Balance Sheet Exposures 28,292,753 4,457,893 3,905,823 3,193,668
1,934,987
41,785,124
Off-Balance Sheet Exposures
Credit-related Exposures 1,413,954 - - - 9,833 1,423,787 Derivative Financial Instruments 72,296 - - -
-
72,296
Total for Off-Balance Sheet Exposures 1,486,250 - - -
9,833
1,496,083
Total On and Off-Balance Sheet Exposures 29,779,003 4,457,893 3,905,823 3,193,668
1,944,820
43,281,207
23
BANK ISLAM MALAYSIA BERHAD PILLAR 3 DISCLOSURE AS AT 31 DECEMBER 2014
4. Credit Risk (continued)
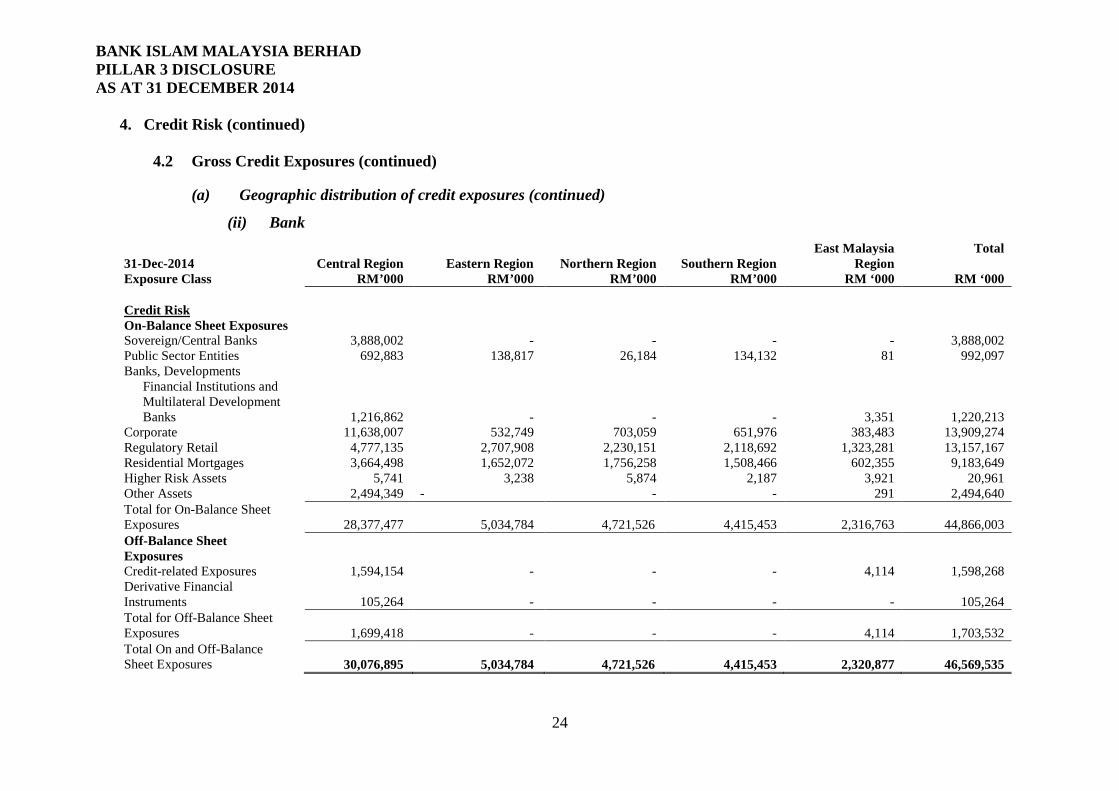
4.2 Gross Credit Exposures (continued)
(a) Geographic distribution of credit exposures (continued)
(ii) Bank
31-Dec-2014 Exposure Class
Central Region RM’000
Eastern Region RM’000
Northern Region RM’000
Southern Region RM’000
East Malaysia Region
RM ‘000
Total
RM ‘000 Credit Risk On-Balance Sheet Exposures Sovereign/Central Banks 3,888,002 - - - - 3,888,002 Public Sector Entities 692,883 138,817 26,184 134,132 81 992,097 Banks, Developments
Financial Institutions and Multilateral Development Banks 1,216,862 - - -
3,351
1,220,213 Corporate 11,638,007 532,749 703,059 651,976 383,483 13,909,274 Regulatory Retail 4,777,135 2,707,908 2,230,151 2,118,692 1,323,281 13,157,167 Residential Mortgages 3,664,498 1,652,072 1,756,258 1,508,466 602,355 9,183,649 Higher Risk Assets 5,741 3,238 5,874 2,187 3,921 20,961 Other Assets 2,494,349 - - - 291 2,494,640 Total for On-Balance Sheet Exposures 28,377,477 5,034,784 4,721,526 4,415,453
2,316,763
44,866,003
Off-Balance Sheet Exposures
Credit-related Exposures 1,594,154 - - - 4,114 1,598,268 Derivative Financial Instruments 105,264 - - -
-
105,264
Total for Off-Balance Sheet Exposures 1,699,418 - - -
4,114
1,703,532
Total On and Off-Balance Sheet Exposures 30,076,895 5,034,784 4,721,526 4,415,453
2,320,877
46,569,535
24
BANK ISLAM MALAYSIA BERHAD PILLAR 3 DISCLOSURE AS AT 31 DECEMBER 2014
4. Credit Risk (continued) 4.2 Gross Credit Exposures (continued)
(a) Geographic distribution of credit exposures (continued)
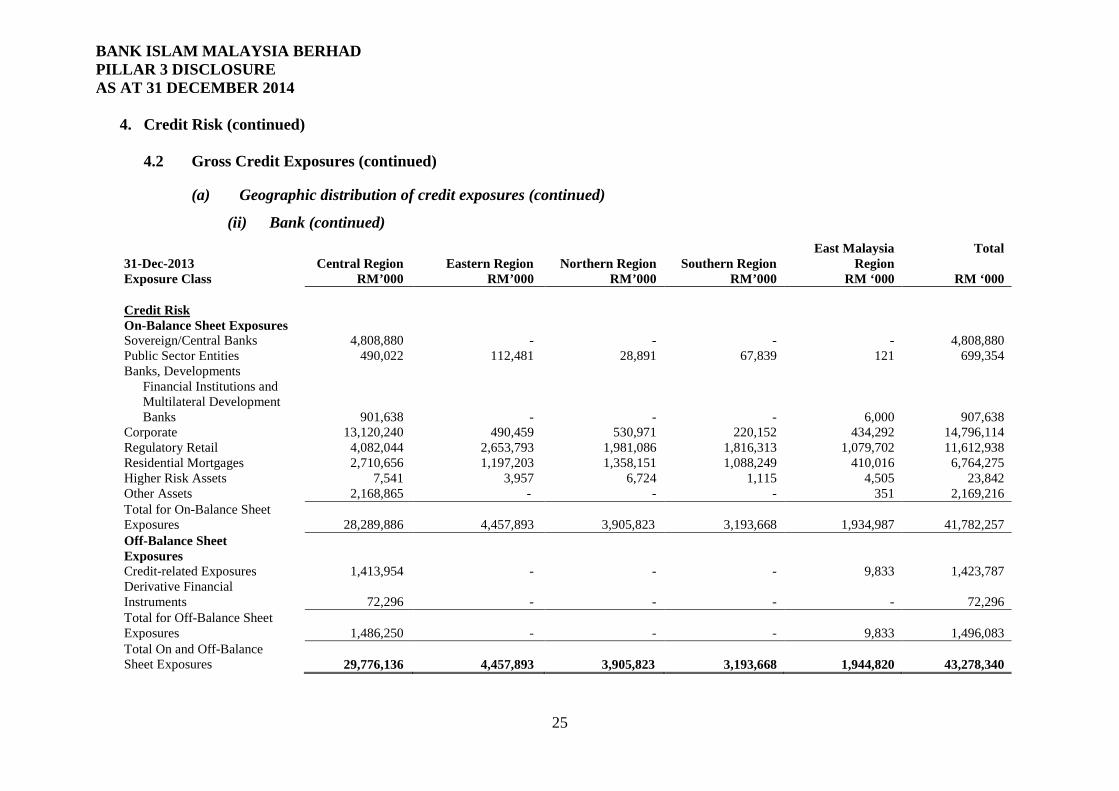
(ii) Bank (continued)
31-Dec-2013 Exposure Class
Central Region RM’000
Eastern Region RM’000
Northern Region RM’000
Southern Region RM’000
East Malaysia Region
RM ‘000
Total
RM ‘000 Credit Risk On-Balance Sheet Exposures Sovereign/Central Banks 4,808,880 - - - - 4,808,880 Public Sector Entities 490,022 112,481 28,891 67,839 121 699,354 Banks, Developments
Financial Institutions and Multilateral Development Banks 901,638 - - -
6,000
907,638 Corporate 13,120,240 490,459 530,971 220,152 434,292 14,796,114 Regulatory Retail 4,082,044 2,653,793 1,981,086 1,816,313 1,079,702 11,612,938 Residential Mortgages 2,710,656 1,197,203 1,358,151 1,088,249 410,016 6,764,275 Higher Risk Assets 7,541 3,957 6,724 1,115 4,505 23,842 Other Assets 2,168,865 - - - 351 2,169,216 Total for On-Balance Sheet Exposures 28,289,886 4,457,893 3,905,823 3,193,668
1,934,987
41,782,257
Off-Balance Sheet Exposures
Credit-related Exposures 1,413,954 - - - 9,833 1,423,787 Derivative Financial Instruments 72,296 - - -
-
72,296
Total for Off-Balance Sheet Exposures 1,486,250 - - -
9,833
1,496,083
Total On and Off-Balance Sheet Exposures 29,776,136 4,457,893 3,905,823 3,193,668
1,944,820
43,278,340
25

BANK ISLAM MALAYSIA BERHAD PILLAR 3 DISCLOSURE AS AT 31 DECEMBER 2014
4. Credit Risk (continued) 4.2 Gross Credit Exposures (continued)
(b) Distribution of credit exposures by sector
(i) Group
31-Dec-2014 Exposure Class
Primary Agriculture
Mining and quarrying
Manufacturing
Electricity, gas and water
Wholesale & retail trade
and restaurant &
hotels
Construction
Real Estate
Transport, storage &
communication
Finance, insurance
and business services
Education, health and
others
Household Sector
Other Sectors
Total
RM ‘000 RM ‘000 RM ‘000 RM ‘000 RM ‘000 RM ‘000 RM ‘000 RM ‘000 RM ‘000 RM ‘000 RM ‘000 RM ‘000 RM ‘000
Credit Risk On-Balance Sheet Exposures Sovereign/Central Banks - - - - - - - - 3,888,002 - - - 3,888,002 Public Sector Entities - - - - - - - 354,487 313,440 324,089 81 - 992,097 Banks, Developments Financial
Institutions and Multilateral Development Banks - - - -
-
-
-
-
1,171,816
-
48,623
1,220,439 Corporate 365,319 18,177 1,045,912 3,499,186 800,515 2,966,028 892,936 1,616,369 2,512,571 127,455 64,134 672 13,909,274 Regulatory Retail 9,151 2,294 36,987 1,836 80,568 80,147 21,458 23,271 60,157 31,809 12,809,401 88 13,157,167 Residential Mortgages - - - - - - - - - - 9,183,649 - 9,183,649 Higher Risk Assets - - - - - - - - - - 20,961 - 20,961 Other Assets - - - - - - - - - - - 2,496,244 2,496,244 Total for On-Balance Sheet Exposures 374,470 20,471 1,082,899 3,501,022
881,083
3,046,175
914,394
1,994,127
7,945,986
483,353
22,078,226
2,545,627
44,867,833
Off-Balance Sheet Exposures Credit-related Exposures 45,611 38,867 76,055 133,776 140,356 215,154 55,777 57,843 200,557 77,138 552,867 4,267 1,598,268 Derivative Financial Instruments - - 3,658 - 2,562 - 12,997 - 36,262 1 - 49,784 105,264 Total for Off-Balance Sheet Exposures 45,611 38,867 79,713 133,776
142,918
215,154
68,774
57,843
236,819
77,139
552,867
54,051
1,703,532
Total On and Off-Balance Sheet Exposures 420,081 59,338 1,162,612 3,634,798
1,024,001
3,261,329
983,168
2,051,970
8,182,805
560,492
22,631,093
2,599,678
46,571,365
26

BANK ISLAM MALAYSIA BERHAD PILLAR 3 DISCLOSURE AS AT 31 DECEMBER 2014
4. Credit Risk (continued) 4.2 Gross Credit Exposures (continued)
(b) Distribution of credit exposures by sector (continued)
(i) Group (continued)
31-Dec-2013 Exposure Class
Primary Agriculture
Mining and quarrying
Manufacturing
Electricity, gas and water
Wholesale & retail trade
and restaurant &
hotels
Construction
Real Estate
Transport, storage &
communication
Finance, insurance
and business services
Education, health and
others
Household Sector
Other Sectors
Total
RM ‘000 RM ‘000 RM ‘000 RM ‘000 RM ‘000 RM ‘000 RM ‘000 RM ‘000 RM ‘000 RM ‘000 RM ‘000 RM ‘000 RM ‘000
Credit Risk On-Balance Sheet Exposures Sovereign/Central Banks - - - - - - - - 4,808,880 - - - 4,808,880 Public Sector Entities 664 - - - - 430 60,201 244,276 254,414 139,238 131 - 699,354 Banks, Developments Financial
Institutions and Multilateral Development Banks - - - -
-
-
-
-
867,937
-
-
41,966
909,903 Corporate 338,728 6,685 840,973 4,425,104 640,166 2,831,299 765,902 1,782,560 2,992,449 107,733 54,462 10,053 14,796,114 Regulatory Retail 10,767 1,429 44,946 3,550 79,064 69,735 17,258 18,031 49,392 26,018 11,292,589 159 11,612,938 Residential Mortgages - - - - - - - - - - 6,764,275 - 6,764,275 Higher Risk Assets - - - - - - - - - - 23,842 - 23,842 Other Assets - - - - - - - - - - - 2,169,818 2,169,818 Total for On-Balance Sheet Exposures 350,159 8,114 885,919 4,428,654
719,230
2,901,464
843,361
2,044,867
8,973,072
272,989
18,135,299
2,221,996
41,785,124
Off-Balance Sheet Exposures
Credit-related Exposures 58,540 31,153 43,775 172,706 123,971 203,675 51,617 44,081 122,178 61,853 495,843 14,395 1,423,787 Derivative Financial Instruments - - 2,490 - 650 9 15,660 - 2,172 3,124 - 48,191 72,296 Total for Off-Balance Sheet Exposures 58,540 31,153 46,265 172,706
124,621
203,684
67,277
44,081
124,350
64,977
495,843
62,586
1,496,083
Total On and Off-Balance Sheet Exposures 408,699 39,267 932,184 4,601,360
843,851
3,105,148
910,638
2,088,948
9,097,422
337,966
18,631,142
2,284,582
43,281,207
27
BANK ISLAM MALAYSIA BERHAD PILLAR 3 DISCLOSURE AS AT 31 DECEMBER 2014
4. Credit Risk (continued) 4.2 Gross Credit Exposures (continued)
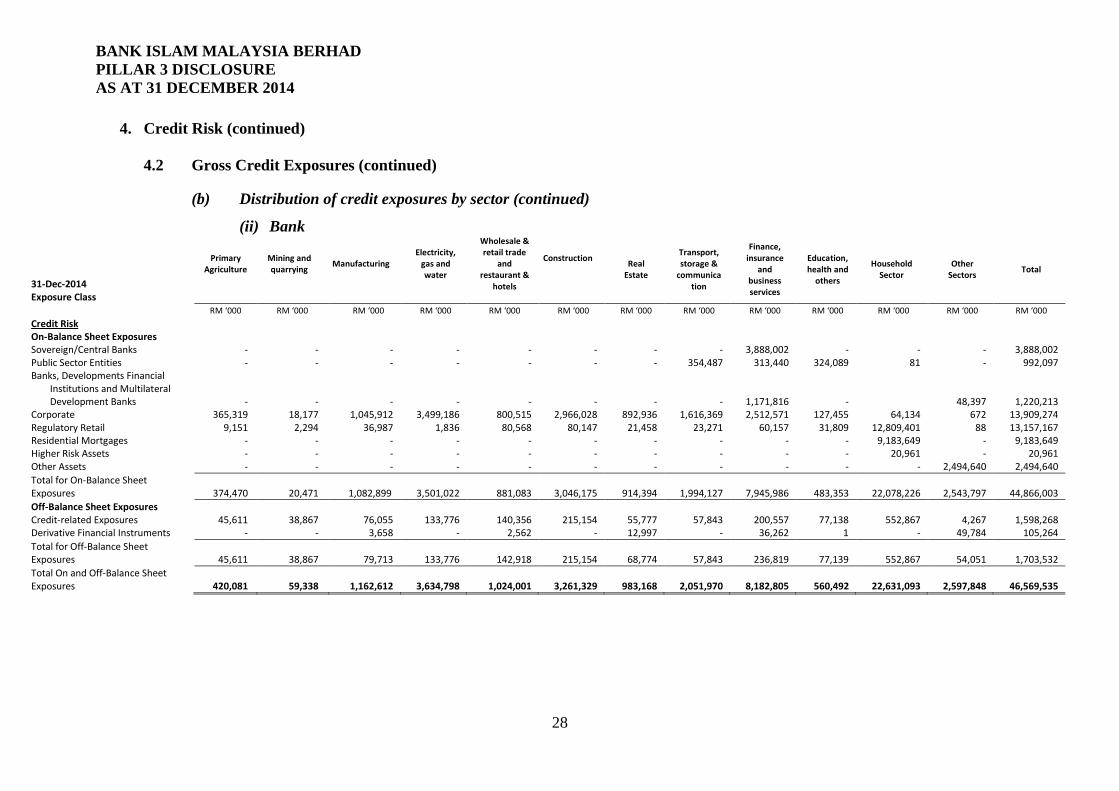
(b) Distribution of credit exposures by sector (continued)
(ii) Bank
31-Dec-2014 Exposure Class
Primary Agriculture
Mining and quarrying
Manufacturing
Electricity, gas and water
Wholesale & retail trade
and restaurant &
hotels
Construction
Real Estate
Transport, storage &
communication
Finance, insurance
and business services
Education, health and
others
Household Sector
Other Sectors
Total
RM ‘000 RM ‘000 RM ‘000 RM ‘000 RM ‘000 RM ‘000 RM ‘000 RM ‘000 RM ‘000 RM ‘000 RM ‘000 RM ‘000 RM ‘000
Credit Risk On-Balance Sheet Exposures Sovereign/Central Banks - - - - - - - - 3,888,002 - - - 3,888,002 Public Sector Entities - - - - - - - 354,487 313,440 324,089 81 - 992,097 Banks, Developments Financial
Institutions and Multilateral Development Banks - - - -
-
-
-
-
1,171,816
-
48,397
1,220,213 Corporate 365,319 18,177 1,045,912 3,499,186 800,515 2,966,028 892,936 1,616,369 2,512,571 127,455 64,134 672 13,909,274 Regulatory Retail 9,151 2,294 36,987 1,836 80,568 80,147 21,458 23,271 60,157 31,809 12,809,401 88 13,157,167 Residential Mortgages - - - - - - - - - - 9,183,649 - 9,183,649 Higher Risk Assets - - - - - - - - - - 20,961 - 20,961 Other Assets - - - - - - - - - - - 2,494,640 2,494,640 Total for On-Balance Sheet Exposures 374,470 20,471 1,082,899 3,501,022
881,083
3,046,175
914,394
1,994,127
7,945,986
483,353
22,078,226
2,543,797
44,866,003
Off-Balance Sheet Exposures Credit-related Exposures 45,611 38,867 76,055 133,776 140,356 215,154 55,777 57,843 200,557 77,138 552,867 4,267 1,598,268 Derivative Financial Instruments - - 3,658 - 2,562 - 12,997 - 36,262 1 - 49,784 105,264 Total for Off-Balance Sheet Exposures 45,611 38,867 79,713 133,776
142,918
215,154
68,774
57,843
236,819
77,139
552,867
54,051
1,703,532
Total On and Off-Balance Sheet Exposures 420,081 59,338 1,162,612 3,634,798
1,024,001
3,261,329
983,168
2,051,970
8,182,805
560,492
22,631,093
2,597,848
46,569,535
28
BANK ISLAM MALAYSIA BERHAD PILLAR 3 DISCLOSURE AS AT 31 DECEMBER 2014
4. Credit Risk (continued) 4.2 Gross Credit Exposures (continued)
(b) Distribution of credit exposures by sector (continued)
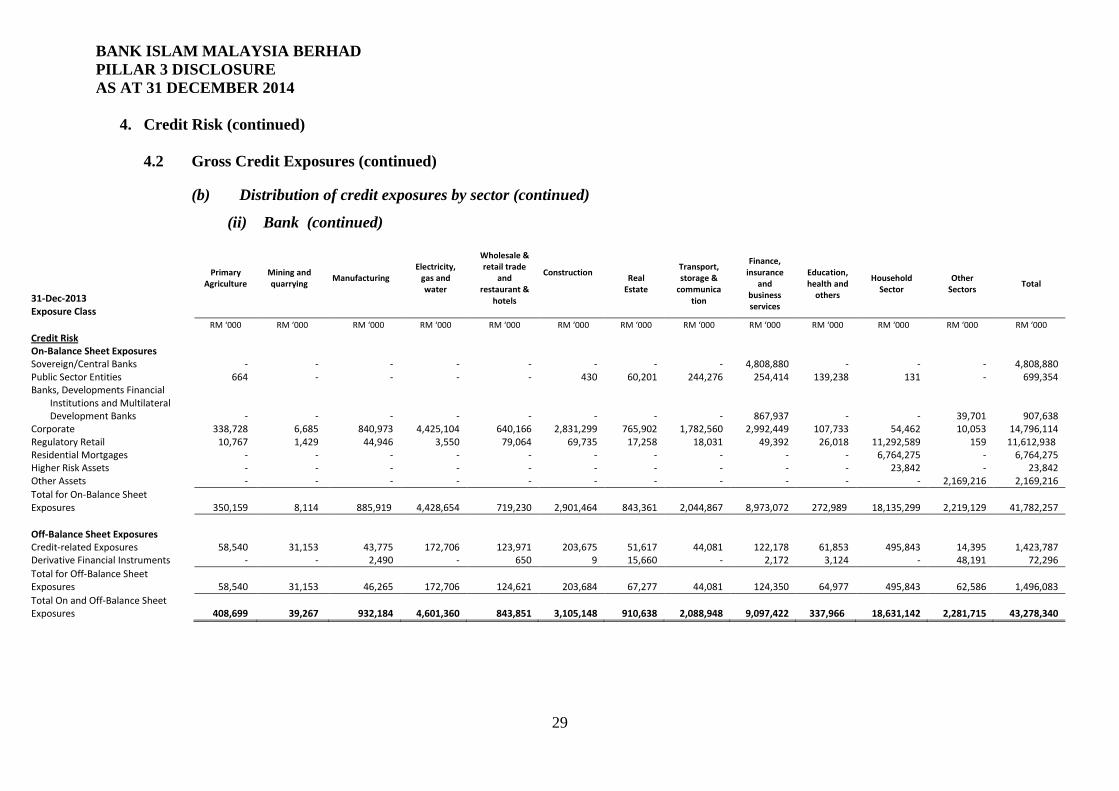
(ii) Bank (continued)
31-Dec-2013 Exposure Class
Primary Agriculture
Mining and quarrying
Manufacturing
Electricity, gas and water
Wholesale & retail trade
and restaurant &
hotels
Construction
Real Estate
Transport, storage &
communication
Finance, insurance
and business services
Education, health and
others
Household Sector
Other Sectors
Total
RM ‘000 RM ‘000 RM ‘000 RM ‘000 RM ‘000 RM ‘000 RM ‘000 RM ‘000 RM ‘000 RM ‘000 RM ‘000 RM ‘000 RM ‘000
Credit Risk On-Balance Sheet Exposures Sovereign/Central Banks - - - - - - - - 4,808,880 - - - 4,808,880 Public Sector Entities 664 - - - - 430 60,201 244,276 254,414 139,238 131 - 699,354 Banks, Developments Financial
Institutions and Multilateral Development Banks - - - -
-
-
-
-
867,937
-
-
39,701
907,638 Corporate 338,728 6,685 840,973 4,425,104 640,166 2,831,299 765,902 1,782,560 2,992,449 107,733 54,462 10,053 14,796,114 Regulatory Retail 10,767 1,429 44,946 3,550 79,064 69,735 17,258 18,031 49,392 26,018 11,292,589 159 11,612,938 Residential Mortgages - - - - - - - - - - 6,764,275 - 6,764,275 Higher Risk Assets - - - - - - - - - - 23,842 - 23,842 Other Assets - - - - - - - - - - - 2,169,216 2,169,216 Total for On-Balance Sheet Exposures 350,159 8,114 885,919 4,428,654
719,230
2,901,464
843,361
2,044,867
8,973,072
272,989
18,135,299
2,219,129
41,782,257
Off-Balance Sheet Exposures
Credit-related Exposures 58,540 31,153 43,775 172,706 123,971 203,675 51,617 44,081 122,178 61,853 495,843 14,395 1,423,787 Derivative Financial Instruments - - 2,490 - 650 9 15,660 - 2,172 3,124 - 48,191 72,296 Total for Off-Balance Sheet Exposures 58,540 31,153 46,265 172,706
124,621
203,684
67,277
44,081
124,350
64,977
495,843
62,586
1,496,083
Total On and Off-Balance Sheet Exposures 408,699 39,267 932,184 4,601,360
843,851
3,105,148
910,638
2,088,948
9,097,422
337,966
18,631,142
2,281,715
43,278,340
29
BANK ISLAM MALAYSIA BERHAD PILLAR 3 DISCLOSURE AS AT 31 DECEMBER 2014
4. Credit Risk (continued) 4.2 Gross Credit Exposures (continued)
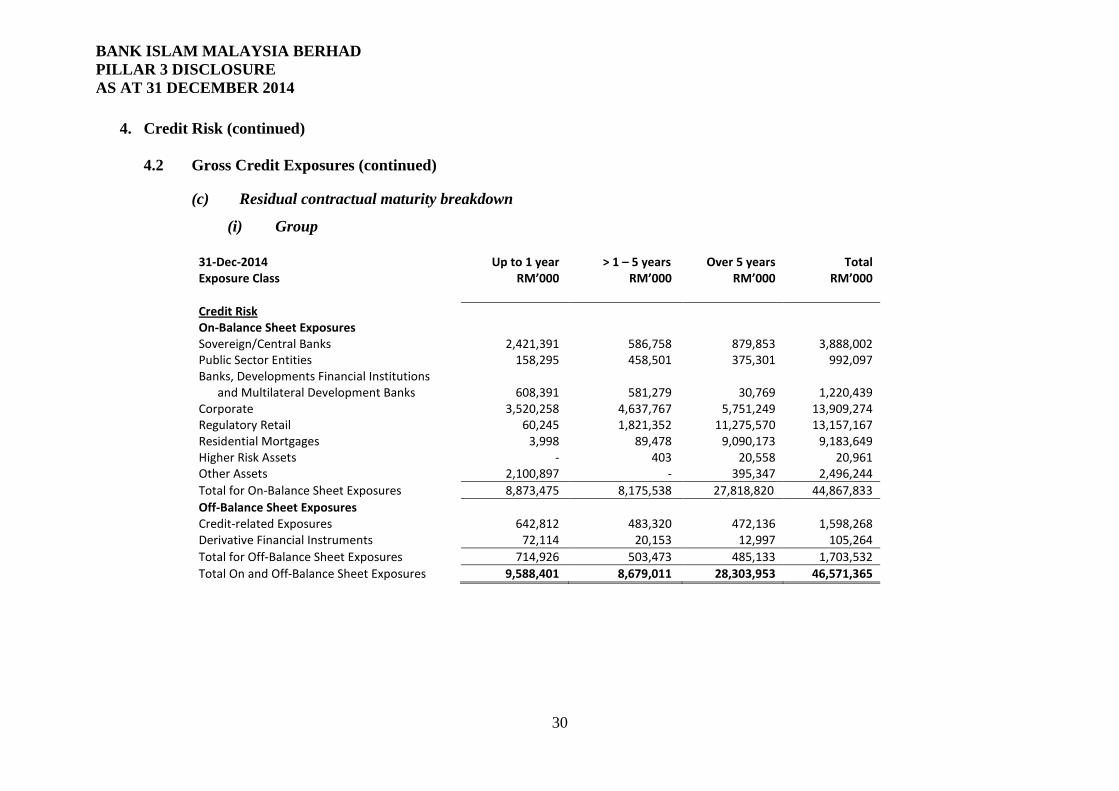
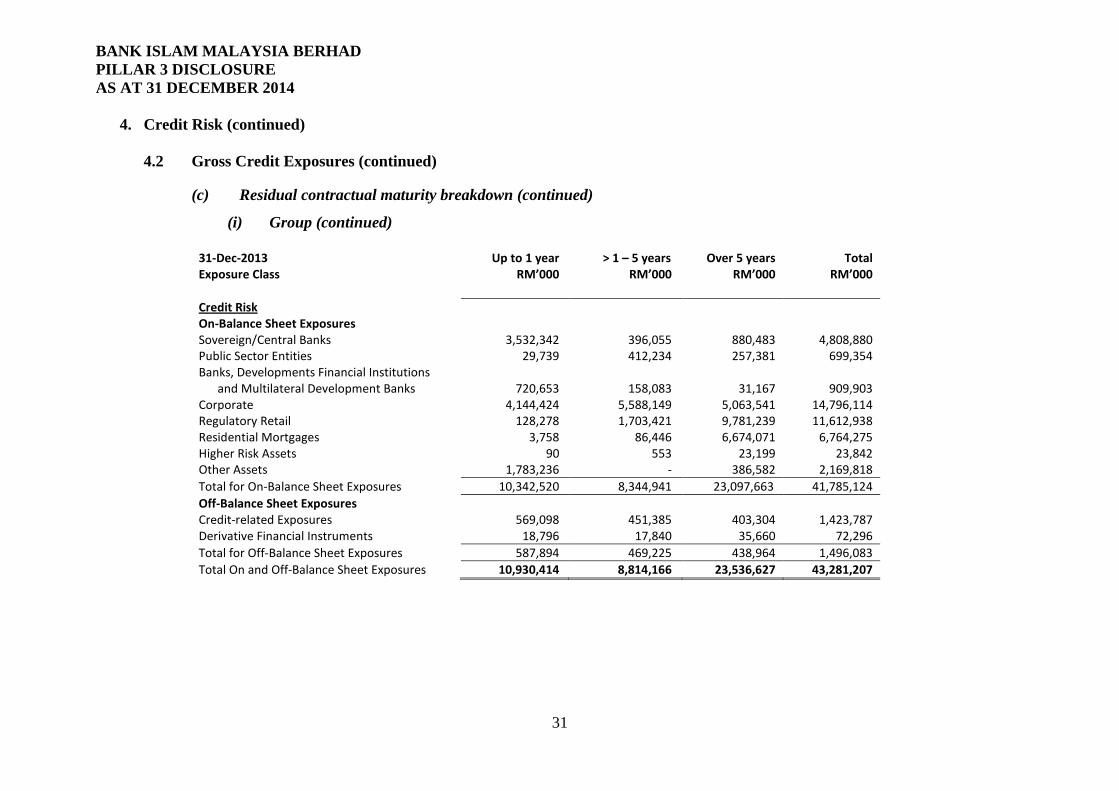
(c) Residual contractual maturity breakdown
(i) Group
31-Dec-2014 Exposure Class
Up to 1 year RM’000
> 1 – 5 years RM’000
Over 5 years RM’000
Total RM’000
Credit Risk On-Balance Sheet Exposures Sovereign/Central Banks 2,421,391 586,758 879,853 3,888,002 Public Sector Entities 158,295 458,501 375,301 992,097 Banks, Developments Financial Institutions
and Multilateral Development Banks 608,391 581,279 30,769 1,220,439 Corporate 3,520,258 4,637,767 5,751,249 13,909,274 Regulatory Retail 60,245 1,821,352 11,275,570 13,157,167 Residential Mortgages 3,998 89,478 9,090,173 9,183,649 Higher Risk Assets - 403 20,558 20,961 Other Assets 2,100,897 - 395,347 2,496,244 Total for On-Balance Sheet Exposures 8,873,475 8,175,538 27,818,820 44,867,833 Off-Balance Sheet Exposures Credit-related Exposures 642,812 483,320 472,136 1,598,268 Derivative Financial Instruments 72,114 20,153 12,997 105,264 Total for Off-Balance Sheet Exposures 714,926 503,473 485,133 1,703,532 Total On and Off-Balance Sheet Exposures 9,588,401 8,679,011 28,303,953 46,571,365
30
BANK ISLAM MALAYSIA BERHAD PILLAR 3 DISCLOSURE AS AT 31 DECEMBER 2014
4. Credit Risk (continued) 4.2 Gross Credit Exposures (continued)
(c) Residual contractual maturity breakdown (continued)
(i) Group (continued)
31-Dec-2013 Exposure Class
Up to 1 year RM’000
> 1 – 5 years RM’000
Over 5 years RM’000
Total RM’000
Credit Risk On-Balance Sheet Exposures Sovereign/Central Banks 3,532,342 396,055 880,483 4,808,880 Public Sector Entities 29,739 412,234 257,381 699,354 Banks, Developments Financial Institutions
and Multilateral Development Banks 720,653 158,083 31,167 909,903 Corporate 4,144,424 5,588,149 5,063,541 14,796,114 Regulatory Retail 128,278 1,703,421 9,781,239 11,612,938 Residential Mortgages 3,758 86,446 6,674,071 6,764,275 Higher Risk Assets 90 553 23,199 23,842 Other Assets 1,783,236 - 386,582 2,169,818 Total for On-Balance Sheet Exposures 10,342,520 8,344,941 23,097,663 41,785,124 Off-Balance Sheet Exposures Credit-related Exposures 569,098 451,385 403,304 1,423,787 Derivative Financial Instruments 18,796 17,840 35,660 72,296 Total for Off-Balance Sheet Exposures 587,894 469,225 438,964 1,496,083 Total On and Off-Balance Sheet Exposures 10,930,414 8,814,166 23,536,627 43,281,207
31
BANK ISLAM MALAYSIA BERHAD PILLAR 3 DISCLOSURE AS AT 31 DECEMBER 2014
4. Credit Risk (continued) 4.2 Gross Credit Exposures (continued)
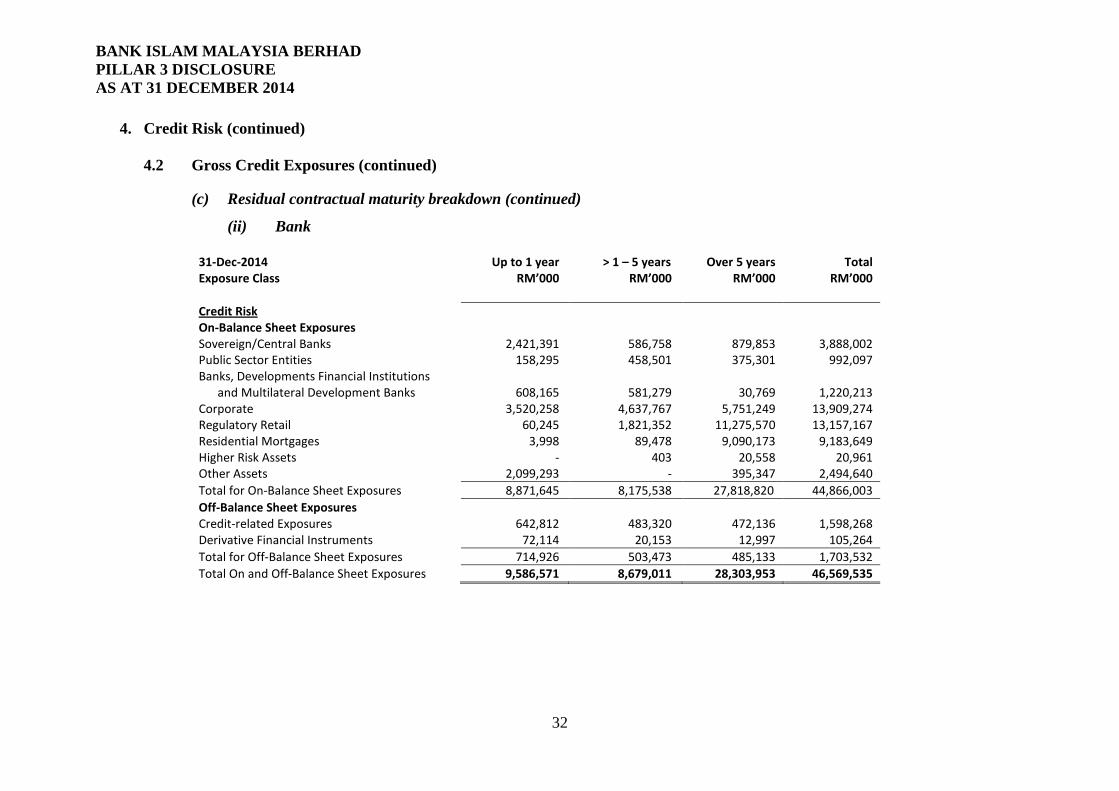
(c) Residual contractual maturity breakdown (continued)
(ii) Bank
31-Dec-2014 Exposure Class
Up to 1 year RM’000
> 1 – 5 years RM’000
Over 5 years RM’000
Total RM’000
Credit Risk On-Balance Sheet Exposures Sovereign/Central Banks 2,421,391 586,758 879,853 3,888,002 Public Sector Entities 158,295 458,501 375,301 992,097 Banks, Developments Financial Institutions
and Multilateral Development Banks 608,165 581,279 30,769 1,220,213 Corporate 3,520,258 4,637,767 5,751,249 13,909,274 Regulatory Retail 60,245 1,821,352 11,275,570 13,157,167 Residential Mortgages 3,998 89,478 9,090,173 9,183,649 Higher Risk Assets - 403 20,558 20,961 Other Assets 2,099,293 - 395,347 2,494,640 Total for On-Balance Sheet Exposures 8,871,645 8,175,538 27,818,820 44,866,003 Off-Balance Sheet Exposures Credit-related Exposures 642,812 483,320 472,136 1,598,268 Derivative Financial Instruments 72,114 20,153 12,997 105,264 Total for Off-Balance Sheet Exposures 714,926 503,473 485,133 1,703,532 Total On and Off-Balance Sheet Exposures 9,586,571 8,679,011 28,303,953 46,569,535
32
BANK ISLAM MALAYSIA BERHAD PILLAR 3 DISCLOSURE AS AT 31 DECEMBER 2014
4. Credit Risk (continued) 4.2 Gross Credit Exposures (continued)
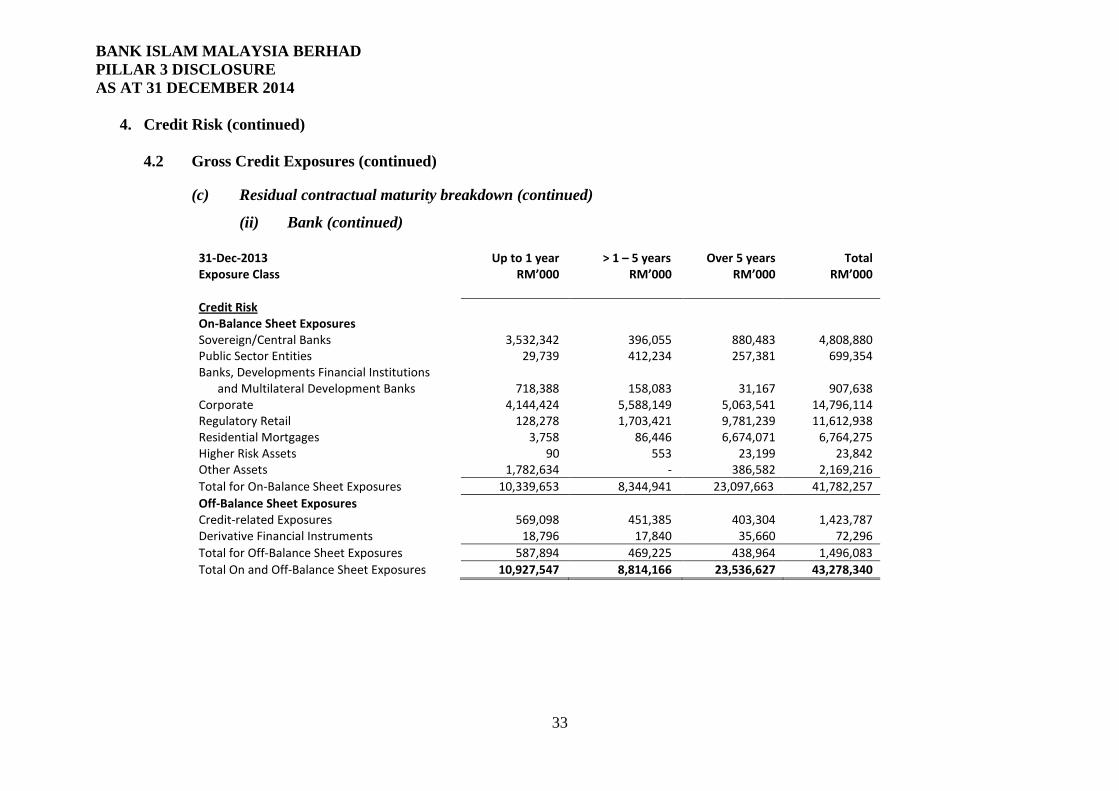
(c) Residual contractual maturity breakdown (continued)
(ii) Bank (continued)
31-Dec-2013 Exposure Class
Up to 1 year RM’000
> 1 – 5 years RM’000
Over 5 years RM’000
Total RM’000
Credit Risk On-Balance Sheet Exposures Sovereign/Central Banks 3,532,342 396,055 880,483 4,808,880 Public Sector Entities 29,739 412,234 257,381 699,354 Banks, Developments Financial Institutions
and Multilateral Development Banks 718,388 158,083 31,167 907,638 Corporate 4,144,424 5,588,149 5,063,541 14,796,114 Regulatory Retail 128,278 1,703,421 9,781,239 11,612,938 Residential Mortgages 3,758 86,446 6,674,071 6,764,275 Higher Risk Assets 90 553 23,199 23,842 Other Assets 1,782,634 - 386,582 2,169,216 Total for On-Balance Sheet Exposures 10,339,653 8,344,941 23,097,663 41,782,257 Off-Balance Sheet Exposures Credit-related Exposures 569,098 451,385 403,304 1,423,787 Derivative Financial Instruments 18,796 17,840 35,660 72,296 Total for Off-Balance Sheet Exposures 587,894 469,225 438,964 1,496,083 Total On and Off-Balance Sheet Exposures 10,927,547 8,814,166 23,536,627 43,278,340
33
BANK ISLAM MALAYSIA BERHAD PILLAR 3 DISCLOSURE AS AT 31 DECEMBER 2014 4. Credit Risk (continued)
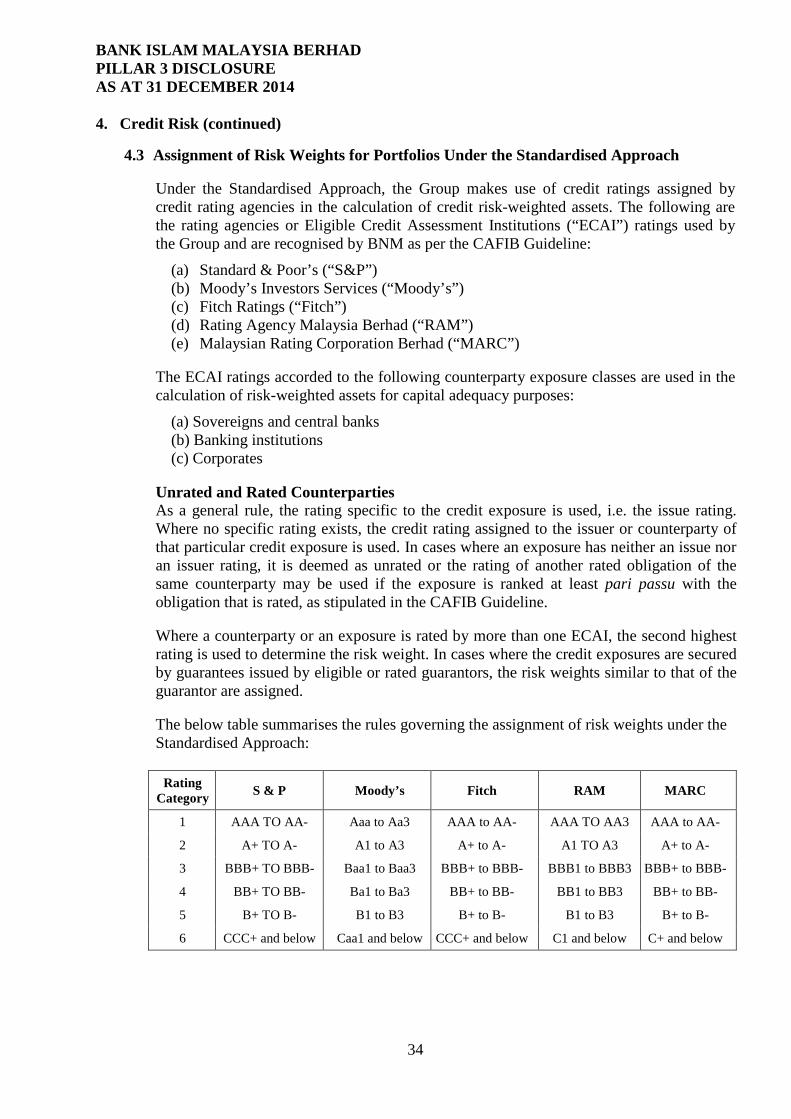
4.3 Assignment of Risk Weights for Portfolios Under the Standardised Approach
Under the Standardised Approach, the Group makes use of credit ratings assigned by credit rating agencies in the calculation of credit risk-weighted assets. The following are the rating agencies or Eligible Credit Assessment Institutions (“ECAI”) ratings used by the Group and are recognised by BNM as per the CAFIB Guideline:
(a) Standard & Poor’s (“S&P”) (b) Moody’s Investors Services (“Moody’s”) (c) Fitch Ratings (“Fitch”) (d) Rating Agency Malaysia Berhad (“RAM”) (e) Malaysian Rating Corporation Berhad (“MARC”)
The ECAI ratings accorded to the following counterparty exposure classes are used in the calculation of risk-weighted assets for capital adequacy purposes:
(a) Sovereigns and central banks (b) Banking institutions (c) Corporates
Unrated and Rated Counterparties As a general rule, the rating specific to the credit exposure is used, i.e. the issue rating. Where no specific rating exists, the credit rating assigned to the issuer or counterparty of that particular credit exposure is used. In cases where an exposure has neither an issue nor an issuer rating, it is deemed as unrated or the rating of another rated obligation of the same counterparty may be used if the exposure is ranked at least pari passu with the obligation that is rated, as stipulated in the CAFIB Guideline. Where a counterparty or an exposure is rated by more than one ECAI, the second highest rating is used to determine the risk weight. In cases where the credit exposures are secured by guarantees issued by eligible or rated guarantors, the risk weights similar to that of the guarantor are assigned. The below table summarises the rules governing the assignment of risk weights under the Standardised Approach:
Rating Category S & P Moody’s Fitch RAM MARC
1 AAA TO AA- Aaa to Aa3 AAA to AA- AAA TO AA3 AAA to AA-
2 A+ TO A- A1 to A3 A+ to A- A1 TO A3 A+ to A-
3 BBB+ TO BBB- Baa1 to Baa3 BBB+ to BBB- BBB1 to BBB3 BBB+ to BBB-
4 BB+ TO BB- Ba1 to Ba3 BB+ to BB- BB1 to BB3 BB+ to BB-
5 B+ TO B- B1 to B3 B+ to B- B1 to B3 B+ to B-
6 CCC+ and below Caa1 and below CCC+ and below C1 and below C+ and below
34
BANK ISLAM MALAYSIA BERHAD PILLAR 3 DISCLOSURE AS AT 31 DECEMBER 2014 4. Credit Risk (continued)
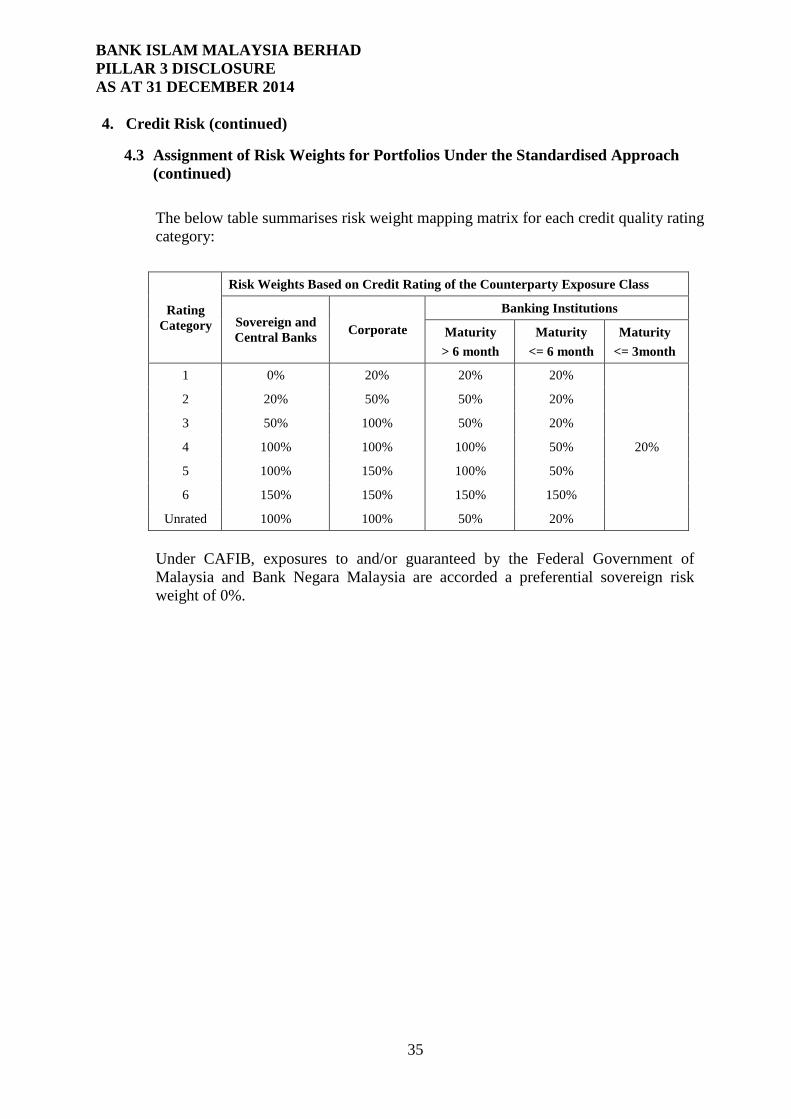
4.3 Assignment of Risk Weights for Portfolios Under the Standardised Approach (continued) The below table summarises risk weight mapping matrix for each credit quality rating category:
Rating Category
Risk Weights Based on Credit Rating of the Counterparty Exposure Class
Sovereign and Central Banks Corporate
Banking Institutions
Maturity > 6 month
Maturity <= 6 month
Maturity <= 3month
1 0% 20% 20% 20%
20%
2 20% 50% 50% 20%
3 50% 100% 50% 20%
4 100% 100% 100% 50%
5 100% 150% 100% 50%
6 150% 150% 150% 150%
Unrated 100% 100% 50% 20%
Under CAFIB, exposures to and/or guaranteed by the Federal Government of Malaysia and Bank Negara Malaysia are accorded a preferential sovereign risk weight of 0%.
35
BANK ISLAM MALAYSIA BERHAD PILLAR 3 DISCLOSURE AS AT 31 DECEMBER 2014 4. Credit Risk (continued)
4.3 Assignment of Risk Weights for Portfolios Under the Standardised Approach (continued)
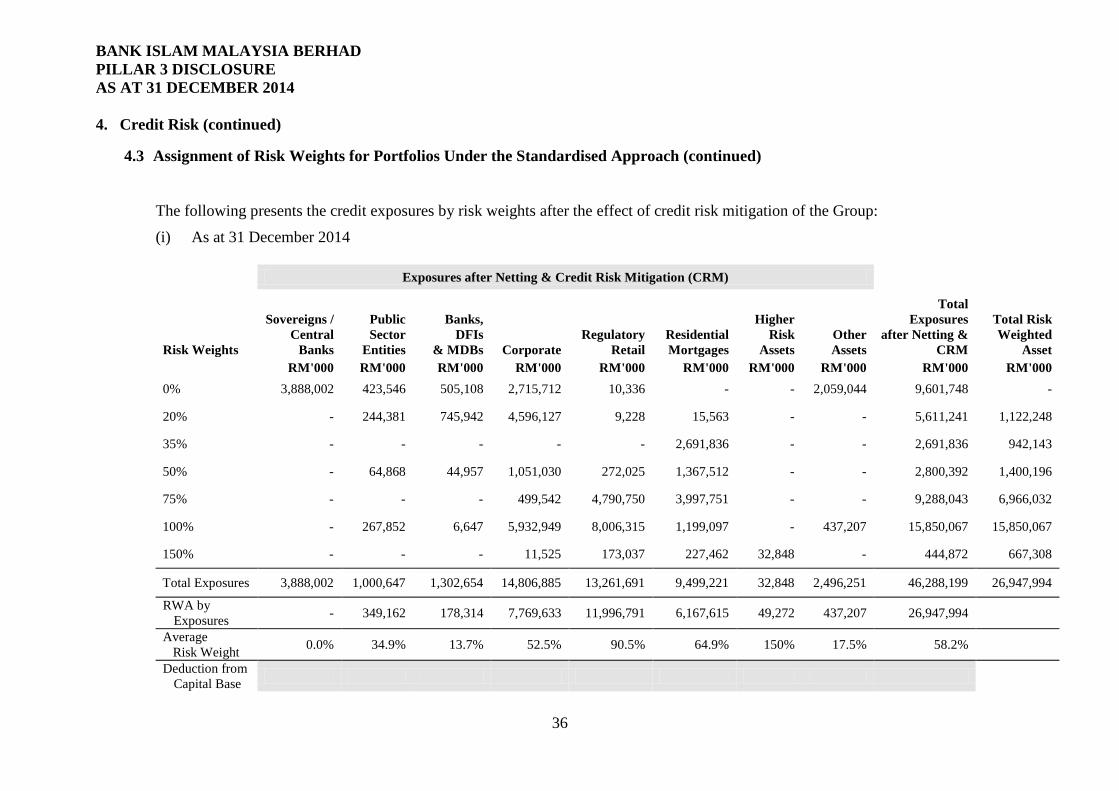
The following presents the credit exposures by risk weights after the effect of credit risk mitigation of the Group:
(i) As at 31 December 2014
Exposures after Netting & Credit Risk Mitigation (CRM)
Risk Weights
Sovereigns / Central
Banks
Public Sector
Entities
Banks, DFIs
& MDBs Corporate Regulatory
Retail Residential Mortgages
Higher Risk
Assets Other Assets
Total Exposures
after Netting & CRM
Total Risk Weighted
Asset RM'000 RM'000 RM'000 RM'000 RM'000 RM'000 RM'000 RM'000 RM'000 RM'000 0% 3,888,002 423,546 505,108 2,715,712 10,336 - - 2,059,044 9,601,748 -
20% - 244,381 745,942 4,596,127 9,228 15,563 - - 5,611,241 1,122,248
35% - - - - - 2,691,836 - - 2,691,836 942,143
50% - 64,868 44,957 1,051,030 272,025 1,367,512 - - 2,800,392 1,400,196
75% - - - 499,542 4,790,750 3,997,751 - - 9,288,043 6,966,032
100% - 267,852 6,647 5,932,949 8,006,315 1,199,097 - 437,207 15,850,067 15,850,067
150% - - - 11,525 173,037 227,462 32,848 - 444,872 667,308
Total Exposures 3,888,002 1,000,647 1,302,654 14,806,885 13,261,691 9,499,221 32,848 2,496,251 46,288,199 26,947,994
RWA by Exposures - 349,162 178,314 7,769,633 11,996,791 6,167,615 49,272 437,207 26,947,994
Average Risk Weight 0.0% 34.9% 13.7% 52.5% 90.5% 64.9% 150% 17.5% 58.2%
Deduction from Capital Base
36
BANK ISLAM MALAYSIA BERHAD PILLAR 3 DISCLOSURE AS AT 31 DECEMBER 2014 4. Credit Risk (continued)
4.3 Assignment of Risk Weights for Portfolios Under the Standardised Approach (continued)
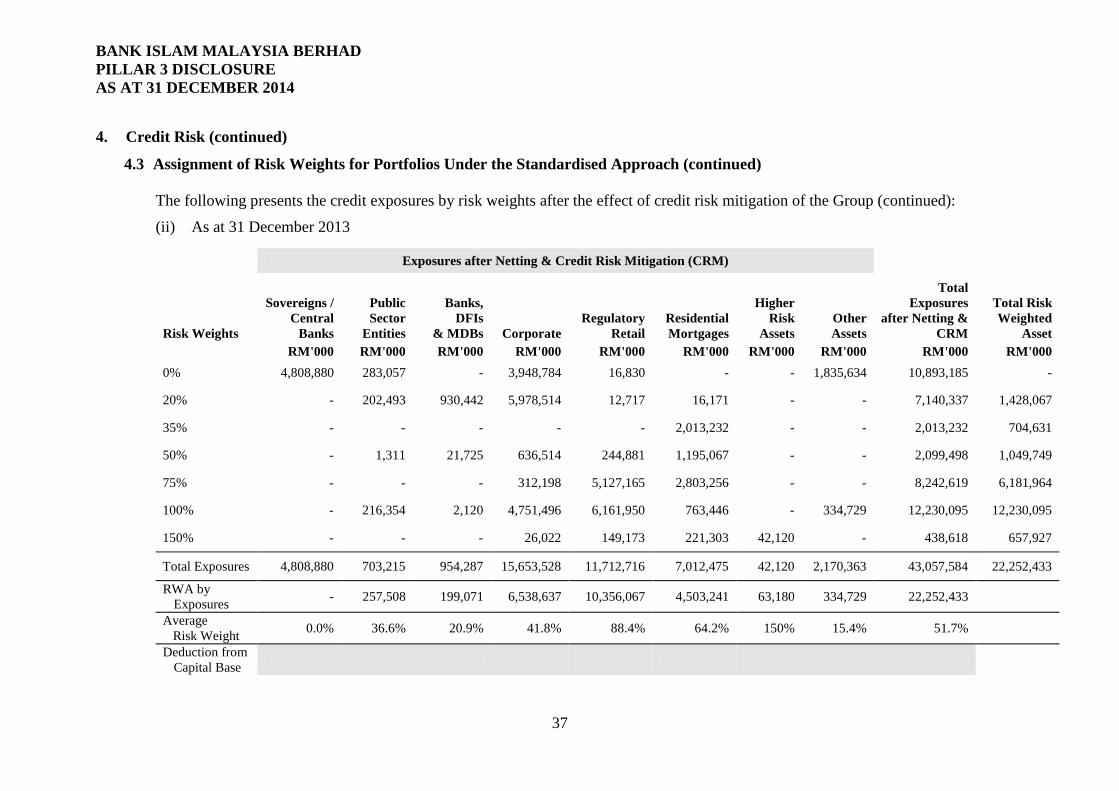
The following presents the credit exposures by risk weights after the effect of credit risk mitigation of the Group (continued):
(ii) As at 31 December 2013
Exposures after Netting & Credit Risk Mitigation (CRM)
Risk Weights
Sovereigns / Central
Banks
Public Sector
Entities
Banks, DFIs
& MDBs Corporate Regulatory
Retail Residential Mortgages
Higher Risk
Assets Other Assets
Total Exposures
after Netting & CRM
Total Risk Weighted
Asset RM'000 RM'000 RM'000 RM'000 RM'000 RM'000 RM'000 RM'000 RM'000 RM'000 0% 4,808,880 283,057 - 3,948,784 16,830 - - 1,835,634 10,893,185 -
20% - 202,493 930,442 5,978,514 12,717 16,171 - - 7,140,337 1,428,067
35% - - - - - 2,013,232 - - 2,013,232 704,631
50% - 1,311 21,725 636,514 244,881 1,195,067 - - 2,099,498 1,049,749
75% - - - 312,198 5,127,165 2,803,256 - - 8,242,619 6,181,964
100% - 216,354 2,120 4,751,496 6,161,950 763,446 - 334,729 12,230,095 12,230,095
150% - - - 26,022 149,173 221,303 42,120 - 438,618 657,927
Total Exposures 4,808,880 703,215 954,287 15,653,528 11,712,716 7,012,475 42,120 2,170,363 43,057,584 22,252,433
RWA by Exposures - 257,508 199,071 6,538,637 10,356,067 4,503,241 63,180 334,729 22,252,433
Average Risk Weight 0.0% 36.6% 20.9% 41.8% 88.4% 64.2% 150% 15.4% 51.7%
Deduction from Capital Base
37
BANK ISLAM MALAYSIA BERHAD PILLAR 3 DISCLOSURE AS AT 31 DECEMBER 2014 4. Credit Risk (continued)
4.3 Assignment of Risk Weights for Portfolios Under the Standardised Approach (continued)
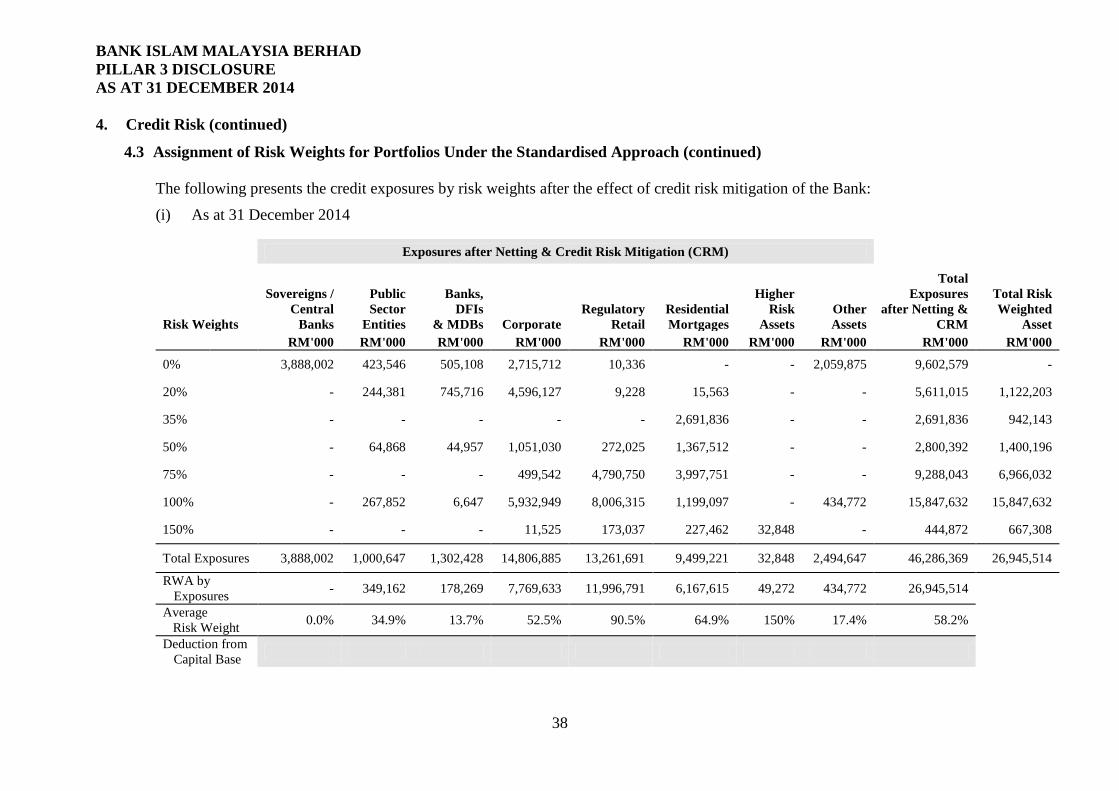
The following presents the credit exposures by risk weights after the effect of credit risk mitigation of the Bank:
(i) As at 31 December 2014
Exposures after Netting & Credit Risk Mitigation (CRM)
Risk Weights
Sovereigns / Central
Banks
Public Sector
Entities
Banks, DFIs
& MDBs Corporate Regulatory
Retail Residential Mortgages
Higher Risk
Assets Other Assets
Total Exposures
after Netting & CRM
Total Risk Weighted
Asset RM'000 RM'000 RM'000 RM'000 RM'000 RM'000 RM'000 RM'000 RM'000 RM'000
0% 3,888,002 423,546 505,108 2,715,712 10,336 - - 2,059,875 9,602,579 -
20% - 244,381 745,716 4,596,127 9,228 15,563 - - 5,611,015 1,122,203
35% - - - - - 2,691,836 - - 2,691,836 942,143
50% - 64,868 44,957 1,051,030 272,025 1,367,512 - - 2,800,392 1,400,196
75% - - - 499,542 4,790,750 3,997,751 - - 9,288,043 6,966,032
100% - 267,852 6,647 5,932,949 8,006,315 1,199,097 - 434,772 15,847,632 15,847,632
150% - - - 11,525 173,037 227,462 32,848 - 444,872 667,308
Total Exposures 3,888,002 1,000,647 1,302,428 14,806,885 13,261,691 9,499,221 32,848 2,494,647 46,286,369 26,945,514
RWA by Exposures - 349,162 178,269 7,769,633 11,996,791 6,167,615 49,272 434,772 26,945,514
Average Risk Weight 0.0% 34.9% 13.7% 52.5% 90.5% 64.9% 150% 17.4% 58.2%
Deduction from Capital Base
38
BANK ISLAM MALAYSIA BERHAD PILLAR 3 DISCLOSURE AS AT 31 DECEMBER 2014 4. Credit Risk (continued)
4.3 Assignment of Risk Weights for Portfolios Under the Standardised Approach (continued)
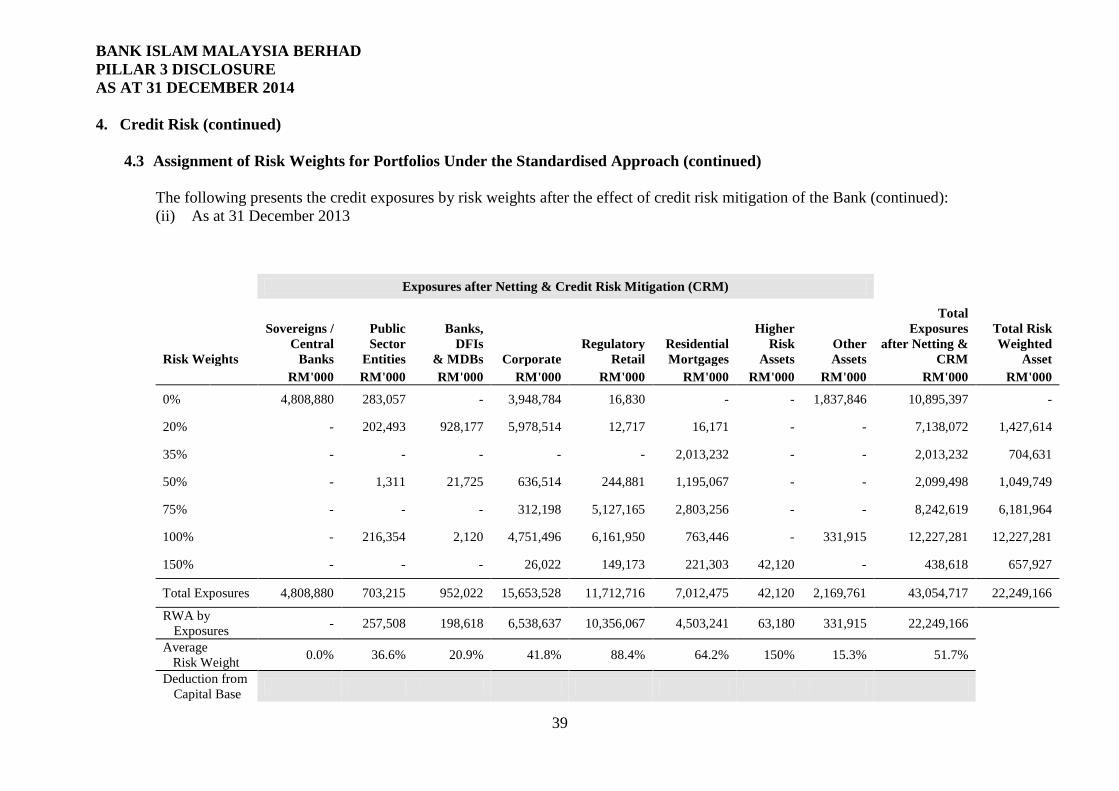
The following presents the credit exposures by risk weights after the effect of credit risk mitigation of the Bank (continued): (ii) As at 31 December 2013
Exposures after Netting & Credit Risk Mitigation (CRM)
Risk Weights
Sovereigns / Central
Banks
Public Sector
Entities
Banks, DFIs
& MDBs Corporate Regulatory
Retail Residential Mortgages
Higher Risk
Assets Other Assets
Total Exposures
after Netting & CRM
Total Risk Weighted
Asset RM'000 RM'000 RM'000 RM'000 RM'000 RM'000 RM'000 RM'000 RM'000 RM'000
0% 4,808,880 283,057 - 3,948,784 16,830 - - 1,837,846 10,895,397 -
20% - 202,493 928,177 5,978,514 12,717 16,171 - - 7,138,072 1,427,614
35% - - - - - 2,013,232 - - 2,013,232 704,631
50% - 1,311 21,725 636,514 244,881 1,195,067 - - 2,099,498 1,049,749
75% - - - 312,198 5,127,165 2,803,256 - - 8,242,619 6,181,964
100% - 216,354 2,120 4,751,496 6,161,950 763,446 - 331,915 12,227,281 12,227,281
150% - - - 26,022 149,173 221,303 42,120 - 438,618 657,927
Total Exposures 4,808,880 703,215 952,022 15,653,528 11,712,716 7,012,475 42,120 2,169,761 43,054,717 22,249,166
RWA by Exposures - 257,508 198,618 6,538,637 10,356,067 4,503,241 63,180 331,915 22,249,166
Average Risk Weight 0.0% 36.6% 20.9% 41.8% 88.4% 64.2% 150% 15.3% 51.7%
Deduction from Capital Base
39
BANK ISLAM MALAYSIA BERHAD PILLAR 3 DISCLOSURE AS AT 31 DECEMBER 2014 4. Credit Risk (continued)
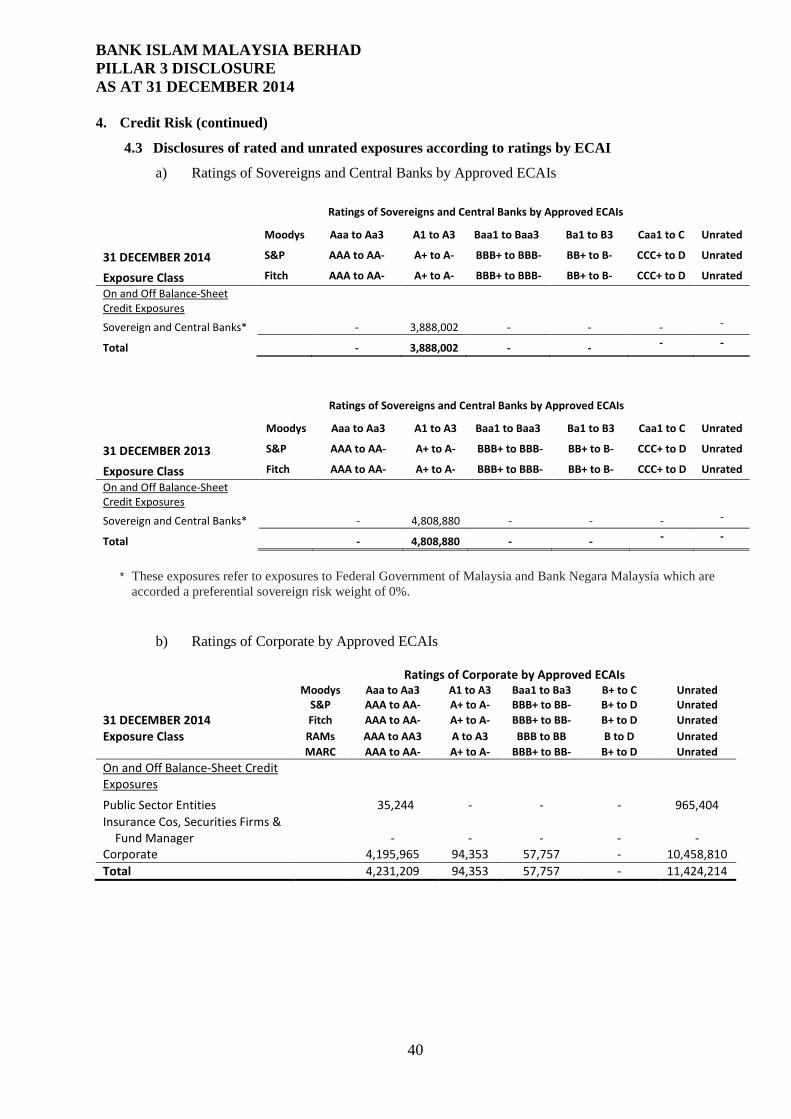
4.3 Disclosures of rated and unrated exposures according to ratings by ECAI
a) Ratings of Sovereigns and Central Banks by Approved ECAIs
Ratings of Sovereigns and Central Banks by Approved ECAIs
Moodys Aaa to Aa3 A1 to A3 Baa1 to Baa3 Ba1 to B3 Caa1 to C Unrated
31 DECEMBER 2014 S&P AAA to AA- A+ to A- BBB+ to BBB- BB+ to B- CCC+ to D Unrated
Exposure Class Fitch AAA to AA- A+ to A- BBB+ to BBB- BB+ to B- CCC+ to D Unrated
On and Off Balance-Sheet Credit Exposures
Sovereign and Central Banks*
- 3,888,002 - - - -
Total
- 3,888,002 - - - -
Ratings of Sovereigns and Central Banks by Approved ECAIs
Moodys Aaa to Aa3 A1 to A3 Baa1 to Baa3 Ba1 to B3 Caa1 to C Unrated
31 DECEMBER 2013 S&P AAA to AA- A+ to A- BBB+ to BBB- BB+ to B- CCC+ to D Unrated
Exposure Class Fitch AAA to AA- A+ to A- BBB+ to BBB- BB+ to B- CCC+ to D Unrated
On and Off Balance-Sheet Credit Exposures
Sovereign and Central Banks*
- 4,808,880 - - - -
Total
- 4,808,880 - - - -
* These exposures refer to exposures to Federal Government of Malaysia and Bank Negara Malaysia which are
accorded a preferential sovereign risk weight of 0%.
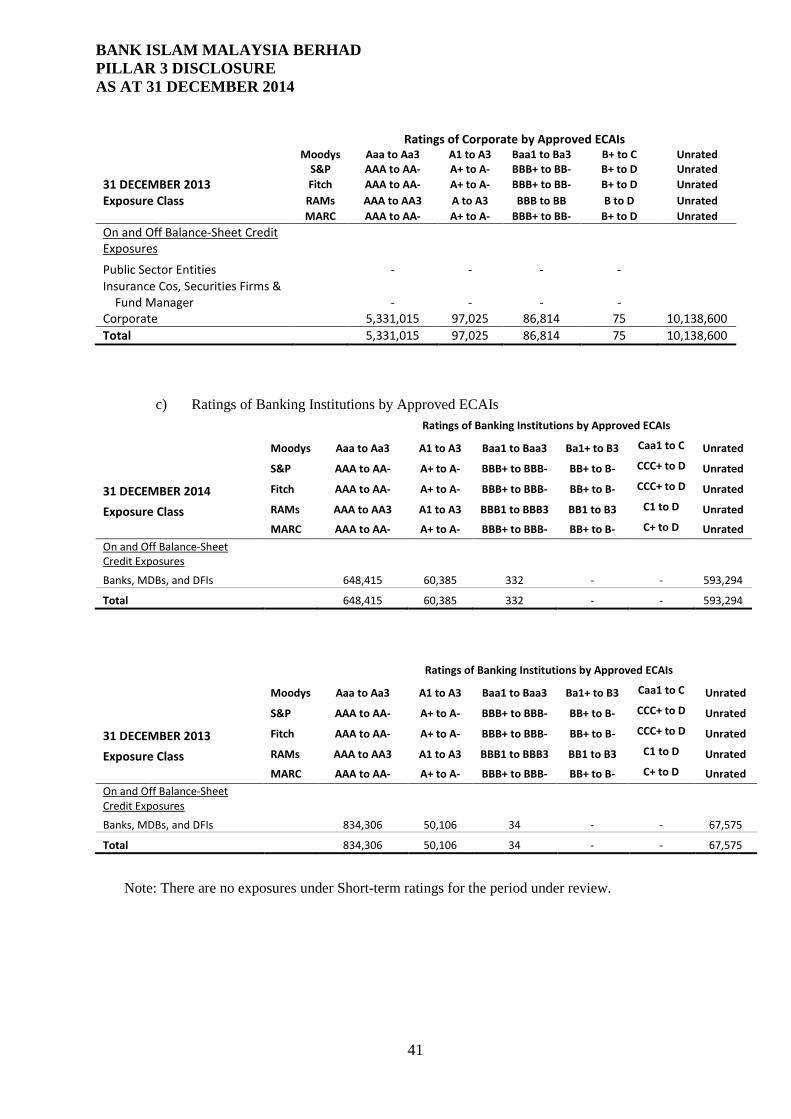
b) Ratings of Corporate by Approved ECAIs
Ratings of Corporate by Approved ECAIs
Moodys Aaa to Aa3 A1 to A3 Baa1 to Ba3 B+ to C Unrated
S&P AAA to AA- A+ to A- BBB+ to BB- B+ to D Unrated
31 DECEMBER 2014 Fitch AAA to AA- A+ to A- BBB+ to BB- B+ to D Unrated Exposure Class RAMs AAA to AA3 A to A3 BBB to BB B to D Unrated
MARC AAA to AA- A+ to A- BBB+ to BB- B+ to D Unrated
On and Off Balance-Sheet Credit Exposures
Public Sector Entities
35,244 - - - 965,404 Insurance Cos, Securities Firms & Fund Manager
- - - - -
Corporate
4,195,965 94,353 57,757 - 10,458,810 Total
4,231,209 94,353 57,757 - 11,424,214
40
BANK ISLAM MALAYSIA BERHAD PILLAR 3 DISCLOSURE AS AT 31 DECEMBER 2014
Ratings of Corporate by Approved ECAIs
Moodys Aaa to Aa3 A1 to A3 Baa1 to Ba3 B+ to C Unrated
S&P AAA to AA- A+ to A- BBB+ to BB- B+ to D Unrated
31 DECEMBER 2013 Fitch AAA to AA- A+ to A- BBB+ to BB- B+ to D Unrated Exposure Class RAMs AAA to AA3 A to A3 BBB to BB B to D Unrated
MARC AAA to AA- A+ to A- BBB+ to BB- B+ to D Unrated
On and Off Balance-Sheet Credit Exposures
Public Sector Entities
- - - - Insurance Cos, Securities Firms & Fund Manager
- - - -
Corporate
5,331,015 97,025 86,814 75 10,138,600 Total
5,331,015 97,025 86,814 75 10,138,600
c) Ratings of Banking Institutions by Approved ECAIs
Ratings of Banking Institutions by Approved ECAIs
Moodys Aaa to Aa3 A1 to A3 Baa1 to Baa3 Ba1+ to B3 Caa1 to C Unrated
S&P AAA to AA- A+ to A- BBB+ to BBB- BB+ to B- CCC+ to D Unrated
31 DECEMBER 2014 Fitch AAA to AA- A+ to A- BBB+ to BBB- BB+ to B- CCC+ to D Unrated
Exposure Class RAMs AAA to AA3 A1 to A3 BBB1 to BBB3 BB1 to B3 C1 to D Unrated
MARC AAA to AA- A+ to A- BBB+ to BBB- BB+ to B- C+ to D Unrated
On and Off Balance-Sheet Credit Exposures
Banks, MDBs, and DFIs
648,415 60,385 332 - - 593,294
Total
648,415 60,385 332 - - 593,294
Ratings of Banking Institutions by Approved ECAIs
Moodys Aaa to Aa3 A1 to A3 Baa1 to Baa3 Ba1+ to B3 Caa1 to C Unrated
S&P AAA to AA- A+ to A- BBB+ to BBB- BB+ to B- CCC+ to D Unrated
31 DECEMBER 2013 Fitch AAA to AA- A+ to A- BBB+ to BBB- BB+ to B- CCC+ to D Unrated
Exposure Class RAMs AAA to AA3 A1 to A3 BBB1 to BBB3 BB1 to B3 C1 to D Unrated
MARC AAA to AA- A+ to A- BBB+ to BBB- BB+ to B- C+ to D Unrated
On and Off Balance-Sheet Credit Exposures
Banks, MDBs, and DFIs
834,306 50,106 34 - - 67,575
Total
834,306 50,106 34 - - 67,575
Note: There are no exposures under Short-term ratings for the period under review.
41
BANK ISLAM MALAYSIA BERHAD PILLAR 3 DISCLOSURE AS AT 31 DECEMBER 2014 4. Credit Risk (continued)
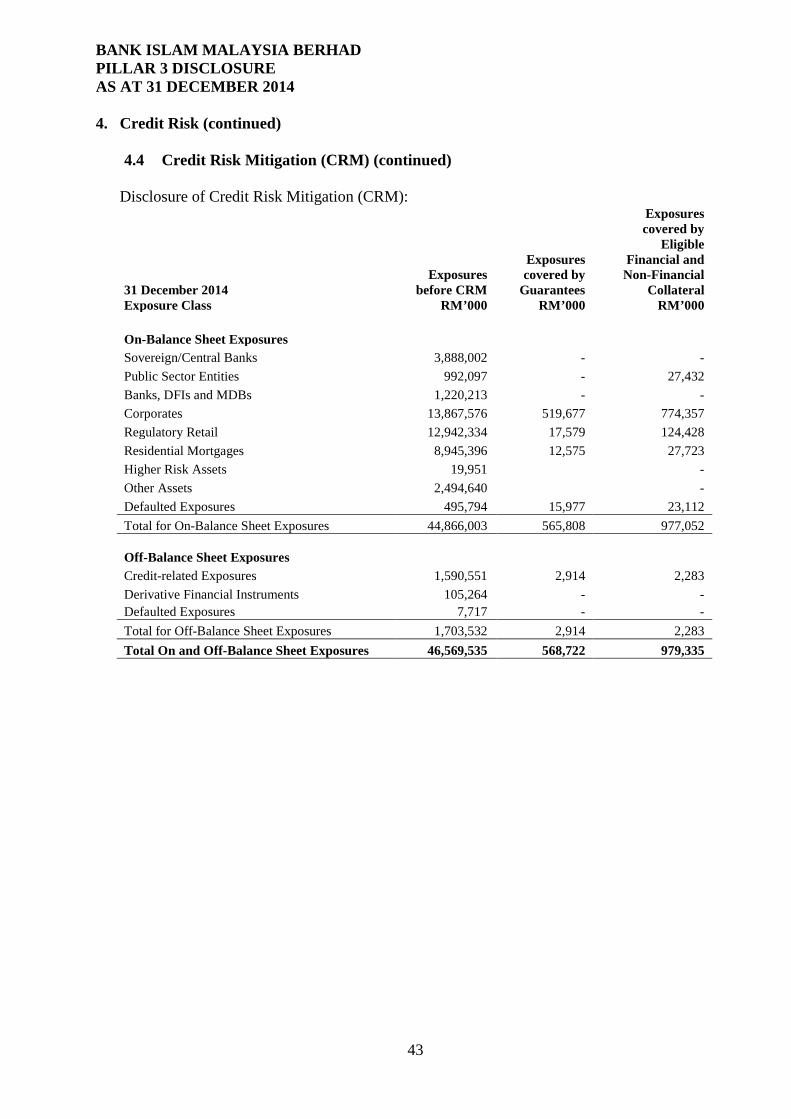
4.4 Credit Risk Mitigation (CRM) As a first way out, the assessment of credit when granting a financing facility is based on a particular customer’s cash flows as the main source of payment and not on the collateral offered. However the acceptance of tangible security as collateral would offer a second way out in the event of business failure thereby improving recovery rates. The type of collaterals accepted by the Bank has an impact on the calculation of the Bank’s capital adequacy as the quality and type of collateral determine whether the Bank is able to obtain capital relief and the extent of such relief. The main types of collateral obtained by the Group to mitigate credit risks are as follows:
(a) Cash on lien (b) Landed property (c) Shariah compliant quoted shares and unit trusts (d) Malaysian Federal Government Securities (e) Rate / Unrated Islamic Securities / Sukuk (f) Guarantee
The reliance that can be placed on CRM is carefully assessed in light of issues such as compliance with Shariah rules, legal enforceability, market value and counterparty credit risk of the guarantor. Policies and procedures are in place to govern the protection of the Group’s position from the onset of a customer relationship, for instance in requiring standard terms and conditions or specifically agreed upon documentation to ensure the legal enforceability of the credit risk mitigants.
42
BANK ISLAM MALAYSIA BERHAD PILLAR 3 DISCLOSURE AS AT 31 DECEMBER 2014 4. Credit Risk (continued)
4.4 Credit Risk Mitigation (CRM) (continued)
Disclosure of Credit Risk Mitigation (CRM):
31 December 2014 Exposure Class
Exposures before CRM
RM’000
Exposures covered by
Guarantees RM’000
Exposures covered by
Eligible Financial and
Non-Financial Collateral
RM’000 On-Balance Sheet Exposures Sovereign/Central Banks 3,888,002 - - Public Sector Entities 992,097 - 27,432 Banks, DFIs and MDBs 1,220,213 - - Corporates 13,867,576 519,677 774,357 Regulatory Retail 12,942,334 17,579 124,428 Residential Mortgages 8,945,396 12,575 27,723 Higher Risk Assets 19,951 - Other Assets 2,494,640 - Defaulted Exposures 495,794 15,977 23,112 Total for On-Balance Sheet Exposures 44,866,003 565,808 977,052 Off-Balance Sheet Exposures Credit-related Exposures 1,590,551 2,914 2,283 Derivative Financial Instruments 105,264 - - Defaulted Exposures 7,717 - - Total for Off-Balance Sheet Exposures 1,703,532 2,914 2,283 Total On and Off-Balance Sheet Exposures 46,569,535 568,722 979,335
43
BANK ISLAM MALAYSIA BERHAD PILLAR 3 DISCLOSURE AS AT 31 DECEMBER 2014
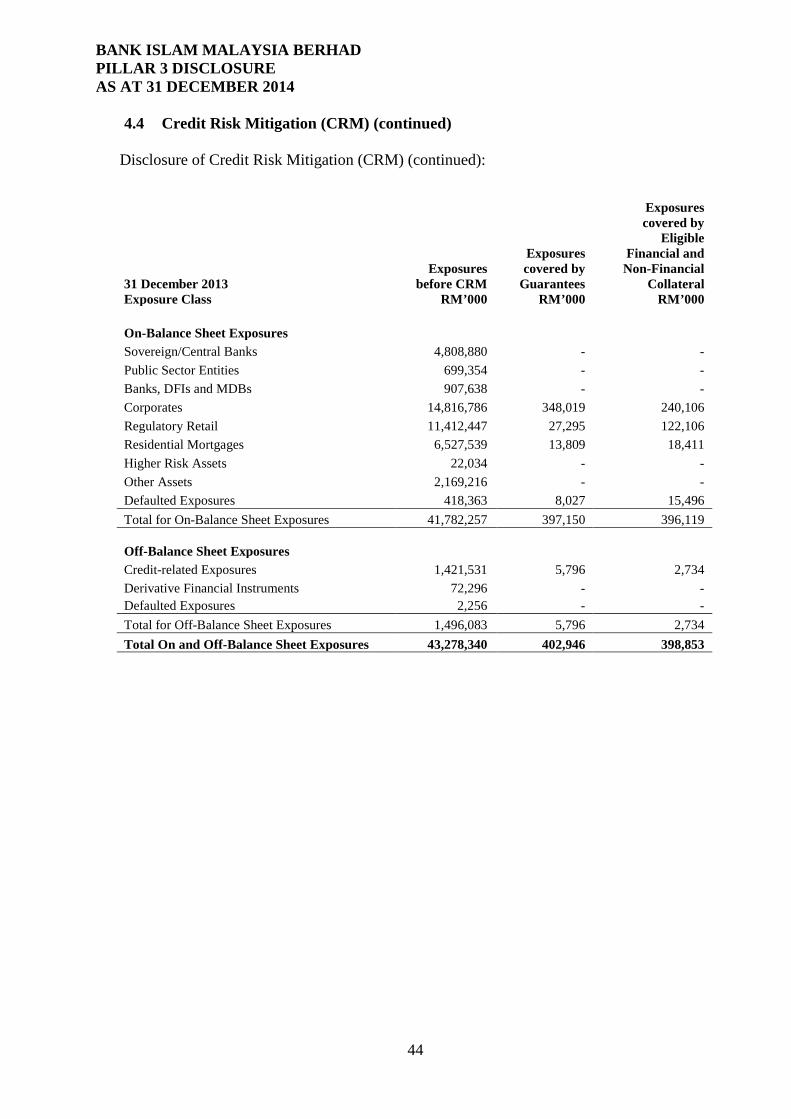
4.4 Credit Risk Mitigation (CRM) (continued) Disclosure of Credit Risk Mitigation (CRM) (continued):
31 December 2013 Exposure Class
Exposures before CRM
RM’000
Exposures covered by
Guarantees RM’000
Exposures covered by
Eligible Financial and
Non-Financial Collateral
RM’000 On-Balance Sheet Exposures Sovereign/Central Banks 4,808,880 - - Public Sector Entities 699,354 - - Banks, DFIs and MDBs 907,638 - - Corporates 14,816,786 348,019 240,106 Regulatory Retail 11,412,447 27,295 122,106 Residential Mortgages 6,527,539 13,809 18,411 Higher Risk Assets 22,034 - - Other Assets 2,169,216 - - Defaulted Exposures 418,363 8,027 15,496 Total for On-Balance Sheet Exposures 41,782,257 397,150 396,119 Off-Balance Sheet Exposures Credit-related Exposures 1,421,531 5,796 2,734 Derivative Financial Instruments 72,296 - - Defaulted Exposures 2,256 - - Total for Off-Balance Sheet Exposures 1,496,083 5,796 2,734 Total On and Off-Balance Sheet Exposures 43,278,340 402,946 398,853
44
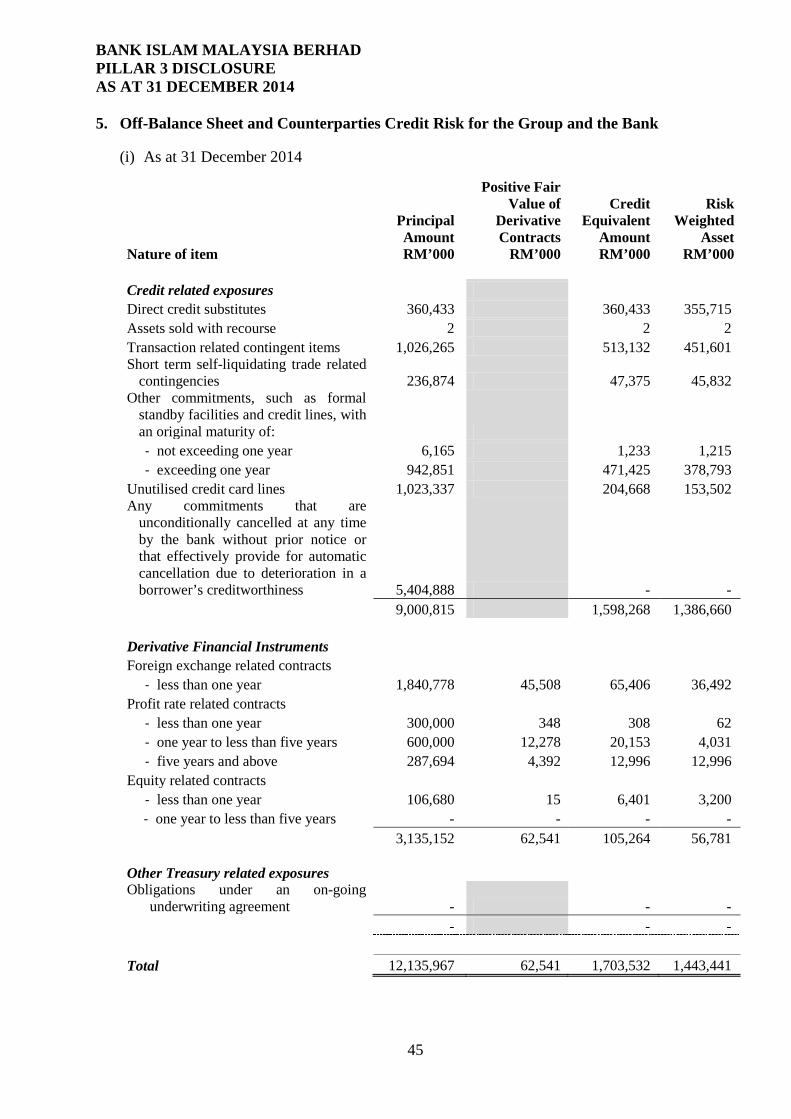
BANK ISLAM MALAYSIA BERHAD PILLAR 3 DISCLOSURE AS AT 31 DECEMBER 2014 5. Off-Balance Sheet and Counterparties Credit Risk for the Group and the Bank
(i) As at 31 December 2014
Nature of item
Principal Amount RM’000
Positive Fair Value of
Derivative Contracts
RM’000
Credit Equivalent
Amount RM’000
Risk Weighted
Asset RM’000
Credit related exposures Direct credit substitutes 360,433 360,433 355,715 Assets sold with recourse 2 2 2 Transaction related contingent items 1,026,265 513,132 451,601 Short term self-liquidating trade related
contingencies 236,874 47,375 45,832 Other commitments, such as formal
standby facilities and credit lines, with an original maturity of: - not exceeding one year 6,165 1,233 1,215 - exceeding one year 942,851 471,425 378,793
Unutilised credit card lines 1,023,337 204,668 153,502 Any commitments that are
unconditionally cancelled at any time by the bank without prior notice or that effectively provide for automatic cancellation due to deterioration in a borrower’s creditworthiness 5,404,888 - -
9,000,815 1,598,268 1,386,660 Derivative Financial Instruments Foreign exchange related contracts
- less than one year 1,840,778 45,508 65,406 36,492 Profit rate related contracts
- less than one year 300,000 348 308 62 - one year to less than five years 600,000 12,278 20,153 4,031 - five years and above 287,694 4,392 12,996 12,996
Equity related contracts - less than one year 106,680 15 6,401 3,200 - one year to less than five years - - - -
3,135,152 62,541 105,264 56,781 Other Treasury related exposures Obligations under an on-going
underwriting agreement - - - - - -
Total 12,135,967 62,541 1,703,532 1,443,441
45
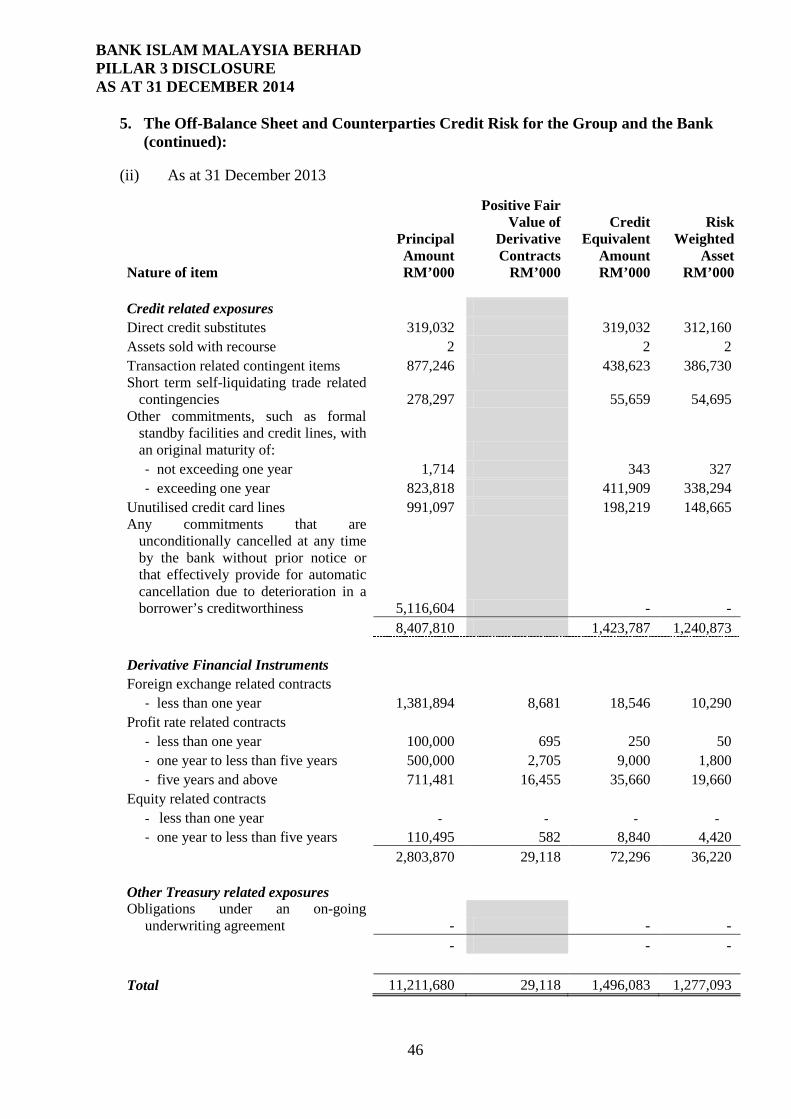
BANK ISLAM MALAYSIA BERHAD PILLAR 3 DISCLOSURE AS AT 31 DECEMBER 2014
5. The Off-Balance Sheet and Counterparties Credit Risk for the Group and the Bank (continued):
(ii) As at 31 December 2013
Nature of item
Principal Amount RM’000
Positive Fair Value of
Derivative Contracts
RM’000
Credit Equivalent
Amount RM’000
Risk Weighted
Asset RM’000
Credit related exposures Direct credit substitutes 319,032 319,032 312,160 Assets sold with recourse 2 2 2 Transaction related contingent items 877,246 438,623 386,730 Short term self-liquidating trade related
contingencies 278,297 55,659 54,695 Other commitments, such as formal
standby facilities and credit lines, with an original maturity of: - not exceeding one year 1,714 343 327 - exceeding one year 823,818 411,909 338,294
Unutilised credit card lines 991,097 198,219 148,665 Any commitments that are
unconditionally cancelled at any time by the bank without prior notice or that effectively provide for automatic cancellation due to deterioration in a borrower’s creditworthiness 5,116,604 - -
8,407,810 1,423,787 1,240,873 Derivative Financial Instruments Foreign exchange related contracts
- less than one year 1,381,894 8,681 18,546 10,290 Profit rate related contracts
- less than one year 100,000 695 250 50 - one year to less than five years 500,000 2,705 9,000 1,800 - five years and above 711,481 16,455 35,660 19,660
Equity related contracts - less than one year - - - - - one year to less than five years 110,495 582 8,840 4,420
2,803,870 29,118 72,296 36,220 Other Treasury related exposures Obligations under an on-going
underwriting agreement - - - - - - Total 11,211,680 29,118 1,496,083 1,277,093
46
BANK ISLAM MALAYSIA BERHAD PILLAR 3 DISCLOSURE AS AT 31 DECEMBER 2014 6. Market Risk
All the Bank’s businesses are subject to the risk that market prices and rates will move, resulting in profit or losses to the Bank. Furthermore, significant or sudden movements in rates could affect the Bank’s liquidity / funding position. The Bank is exposed to the following main market / liquidity risk factors: - Rate of Return or Profit Rate Risk: the potential impact on the Bank’s profitability caused
by changes in the market rate of return, either due to general market movements or due to issuer / borrower specific causes;
- Foreign Exchange Risk: the impact of exchange rate movements on the Bank’s currency positions;
- Equity Investment Risk: the profitability impact on the Bank’s equity positions or investments caused by changes in equity prices or values;
- Commodity Inventory Risk: the risk of loss due to movements in commodity prices; - Liquidity Risk: the potential inability of the Bank to meet its funding requirements at a
reasonable cost (funding liquidity risk) or its inability to liquidate positions quickly at a reasonable price (market liquidity risk).
The objective of the Bank’s market risk management is to manage and control market risk exposures in order to optimise return on risk while maintaining a market risk profile consistent with the Bank’s approved risk appetite. The Bank separates exposures to market risk into either trading or non-trading portfolios. Trading portfolios include those positions arising from market making, proprietary position taking and other marked-to-market positions so designated as per the approved Trading Book Policy Statements. Non-trading portfolios primarily arise from the re-pricing mismatches of the Bank’s customer driven assets and liabilities and from the Bank’s investment of its surplus funds.
Market risk governance The management of market risk is principally carried out by using risk limits approved by the BRC, guided by the Risk Appetite Statement approved by the Board of Directors. The Asset and Liability Management Committee (“ALCO”) is responsible under the authority delegated by the BRC for managing market risk at strategic level.
The Management of Market Risk All market risk exposures are managed by Treasury. The aim is to ensure that all market risks are consolidated at Treasury, which has the necessary skills, tools, management and governance to manage such risks professionally. Limits are set for portfolios, products and risk types, with market liquidity and credit quality being the principal factors in determining the level of limits set.
47
BANK ISLAM MALAYSIA BERHAD PILLAR 3 DISCLOSURE AS AT 31 DECEMBER 2014
Market Risk Management Department (“MRMD”) is the independent risk control function and is responsible for ensuring efficient implementation of market risk management policies. MRMD is also responsible for developing the Bank’s market risk management guidelines, measurement techniques, behavioural assumptions and limit setting methodologies. Any excesses against the prescribed limits are reported immediately to the Senior Management. Strict escalation procedures are well documented and approved by the BRC. In addition, the market risk exposures and limits are regularly reported to the ALCO and BRC. Other controls to ensure that market risk exposures remain within tolerable levels include stress testing, rigorous new product approval procedures and a list of permissible instruments than can be traded. Stress test results are produced monthly to determine the impact of changes in profit rates, foreign exchange rates and other risk factors on the Bank’s profitability, capital adequacy and liquidity. The stress test provides the Management and the BRC with an assessment of the financial impact of identified extreme events on the market risk exposures of the Bank. Profit Rate Risk in the Non-Trading Portfolio Profit rate risk in the non-trading portfolio is managed and controlled using measurement tools known as economic value of equity (“EVE”) and earnings-at-risk (“EaR”). EVE and EaR limits are approved by the BRC and independently monitored by MRMD. Exposures and limits are regularly discussed and reported to ALCO and BRC.
The Bank manages market risk in non-trading portfolios by monitoring the sensitivity of projected EaR and EVE under varying profit rate scenarios (simulation modeling). For simulation modeling, a combination of standard scenarios and non-standard scenarios relevant to the local market are used. The standard scenarios monitored monthly include a 100 basis points parallel fall or rise in profit rates and historical simulation of past events. The scenario assumes no management action. Hence, it does not incorporate actions that would be taken by Treasury to mitigate the impact of the profit rate risk. In reality, depending on the view on future market movements, Treasury would proactively seek to change the profit rate exposure profile to minimise losses and to optimise net revenues. The nature of the hedging and risk mitigation strategies corresponds to the market instruments available. These strategies range from the use of derivative financial instruments, such as profit rate swaps, to more intricate hedging strategies to address inordinate profit rate risk exposures.
The table below shows the projected Bank’s sensitivity to a 100 basis points parallel shift to profit rates across all maturities applied on the Group’s and Bank’s profit rate sensitivity gap as at reporting date.
48
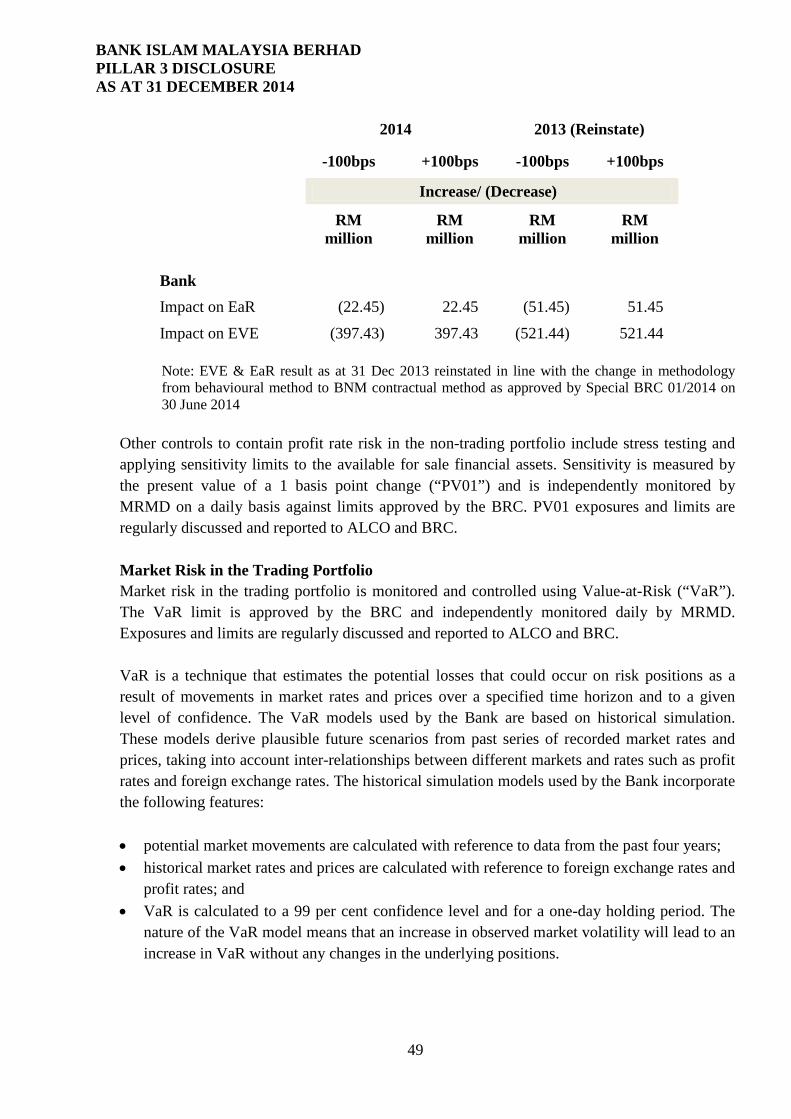
BANK ISLAM MALAYSIA BERHAD PILLAR 3 DISCLOSURE AS AT 31 DECEMBER 2014
2014 2013 (Reinstate)
-100bps +100bps -100bps +100bps
Increase/ (Decrease)
RM million RM
million RM million RM
million
Bank Impact on EaR (22.45) 22.45 (51.45) 51.45
Impact on EVE (397.43) 397.43 (521.44) 521.44
Note: EVE & EaR result as at 31 Dec 2013 reinstated in line with the change in methodology from behavioural method to BNM contractual method as approved by Special BRC 01/2014 on 30 June 2014
Other controls to contain profit rate risk in the non-trading portfolio include stress testing and applying sensitivity limits to the available for sale financial assets. Sensitivity is measured by the present value of a 1 basis point change (“PV01”) and is independently monitored by MRMD on a daily basis against limits approved by the BRC. PV01 exposures and limits are regularly discussed and reported to ALCO and BRC. Market Risk in the Trading Portfolio Market risk in the trading portfolio is monitored and controlled using Value-at-Risk (“VaR”). The VaR limit is approved by the BRC and independently monitored daily by MRMD. Exposures and limits are regularly discussed and reported to ALCO and BRC. VaR is a technique that estimates the potential losses that could occur on risk positions as a result of movements in market rates and prices over a specified time horizon and to a given level of confidence. The VaR models used by the Bank are based on historical simulation. These models derive plausible future scenarios from past series of recorded market rates and prices, taking into account inter-relationships between different markets and rates such as profit rates and foreign exchange rates. The historical simulation models used by the Bank incorporate the following features: • potential market movements are calculated with reference to data from the past four years; • historical market rates and prices are calculated with reference to foreign exchange rates and
profit rates; and • VaR is calculated to a 99 per cent confidence level and for a one-day holding period. The
nature of the VaR model means that an increase in observed market volatility will lead to an increase in VaR without any changes in the underlying positions.
49
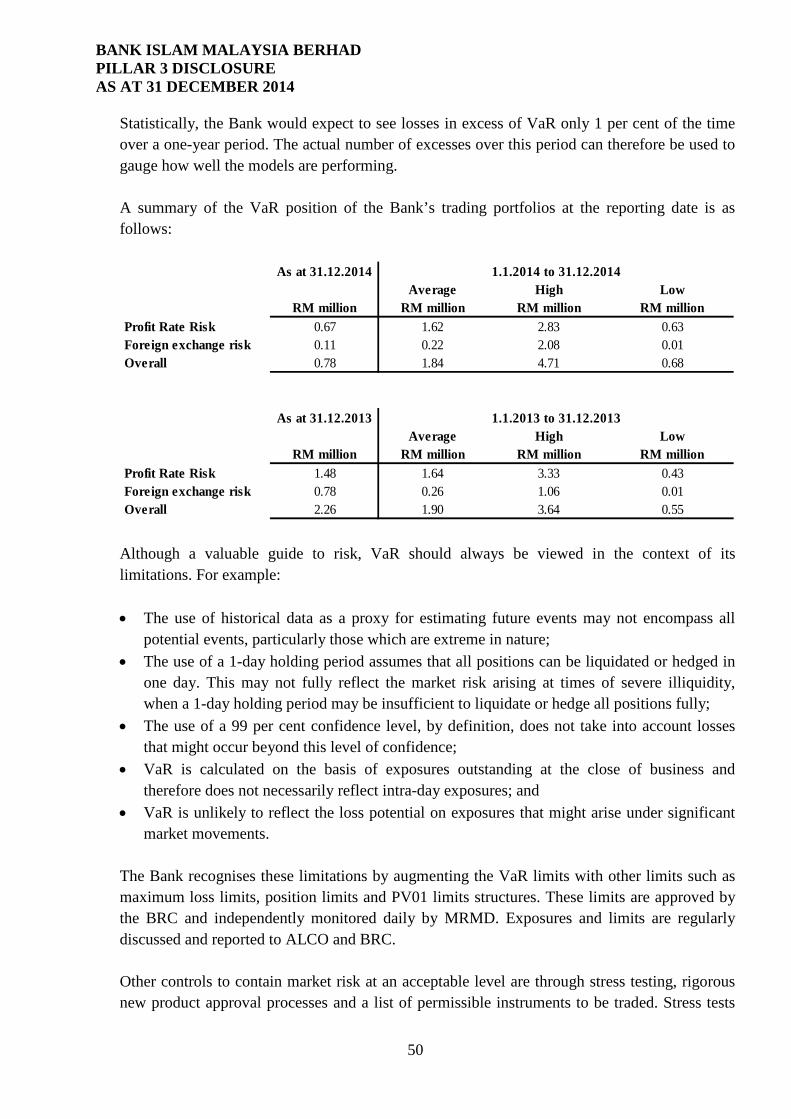
BANK ISLAM MALAYSIA BERHAD PILLAR 3 DISCLOSURE AS AT 31 DECEMBER 2014
Statistically, the Bank would expect to see losses in excess of VaR only 1 per cent of the time over a one-year period. The actual number of excesses over this period can therefore be used to gauge how well the models are performing. A summary of the VaR position of the Bank’s trading portfolios at the reporting date is as follows:
Although a valuable guide to risk, VaR should always be viewed in the context of its limitations. For example: • The use of historical data as a proxy for estimating future events may not encompass all
potential events, particularly those which are extreme in nature; • The use of a 1-day holding period assumes that all positions can be liquidated or hedged in
one day. This may not fully reflect the market risk arising at times of severe illiquidity, when a 1-day holding period may be insufficient to liquidate or hedge all positions fully;
• The use of a 99 per cent confidence level, by definition, does not take into account losses that might occur beyond this level of confidence;
• VaR is calculated on the basis of exposures outstanding at the close of business and therefore does not necessarily reflect intra-day exposures; and
• VaR is unlikely to reflect the loss potential on exposures that might arise under significant market movements.
The Bank recognises these limitations by augmenting the VaR limits with other limits such as maximum loss limits, position limits and PV01 limits structures. These limits are approved by the BRC and independently monitored daily by MRMD. Exposures and limits are regularly discussed and reported to ALCO and BRC. Other controls to contain market risk at an acceptable level are through stress testing, rigorous new product approval processes and a list of permissible instruments to be traded. Stress tests
Profit Rate RiskForeign exchange riskOverall
Profit Rate RiskForeign exchange riskOverall
RM million RM million RM million RM million
As at 31.12.2014 1.1.2014 to 31.12.2014Average High Low
0.67 1.62 2.83 0.630.11 0.22 2.08 0.010.78 1.84 4.71 0.68
As at 31.12.2013 1.1.2013 to 31.12.2013Average High Low
RM million RM million RM million RM million1.48 1.64 3.33 0.430.78 0.26 1.06 0.012.26 1.90 3.64 0.55
50
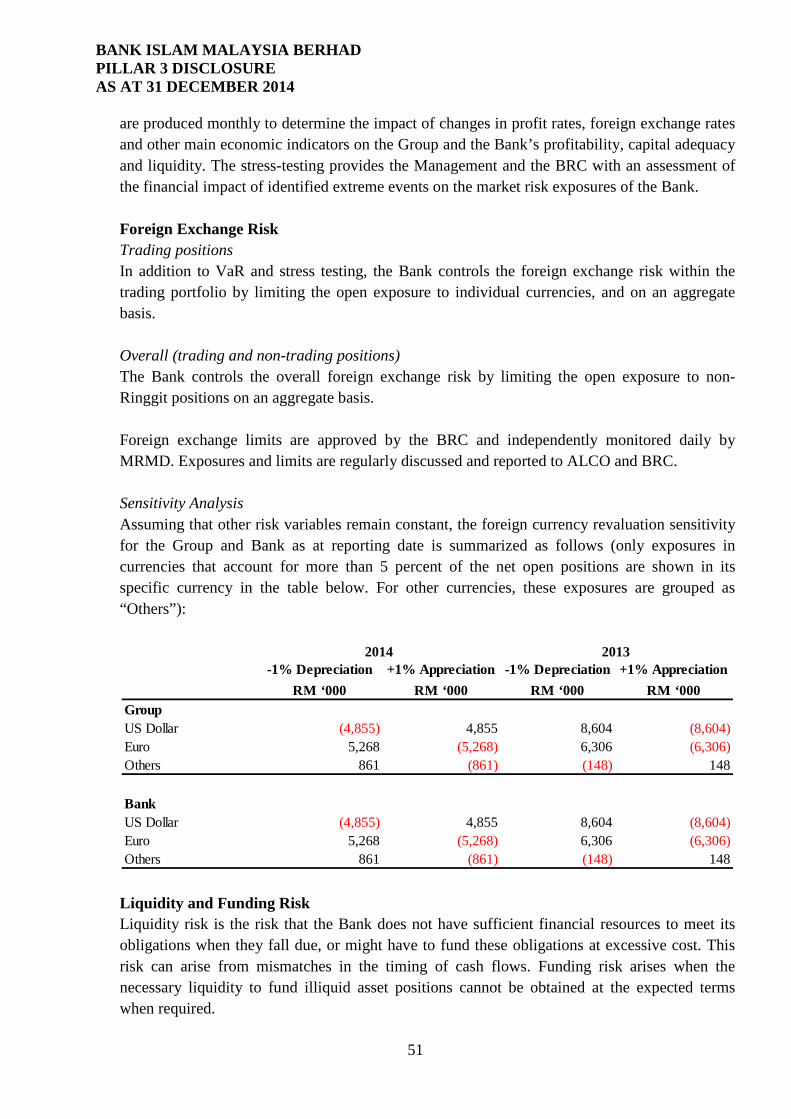
BANK ISLAM MALAYSIA BERHAD PILLAR 3 DISCLOSURE AS AT 31 DECEMBER 2014
are produced monthly to determine the impact of changes in profit rates, foreign exchange rates and other main economic indicators on the Group and the Bank’s profitability, capital adequacy and liquidity. The stress-testing provides the Management and the BRC with an assessment of the financial impact of identified extreme events on the market risk exposures of the Bank. Foreign Exchange Risk Trading positions In addition to VaR and stress testing, the Bank controls the foreign exchange risk within the trading portfolio by limiting the open exposure to individual currencies, and on an aggregate basis. Overall (trading and non-trading positions) The Bank controls the overall foreign exchange risk by limiting the open exposure to non-Ringgit positions on an aggregate basis. Foreign exchange limits are approved by the BRC and independently monitored daily by MRMD. Exposures and limits are regularly discussed and reported to ALCO and BRC. Sensitivity Analysis Assuming that other risk variables remain constant, the foreign currency revaluation sensitivity for the Group and Bank as at reporting date is summarized as follows (only exposures in currencies that account for more than 5 percent of the net open positions are shown in its specific currency in the table below. For other currencies, these exposures are grouped as “Others”):
Liquidity and Funding Risk Liquidity risk is the risk that the Bank does not have sufficient financial resources to meet its obligations when they fall due, or might have to fund these obligations at excessive cost. This risk can arise from mismatches in the timing of cash flows. Funding risk arises when the necessary liquidity to fund illiquid asset positions cannot be obtained at the expected terms when required.
-1% Depreciation +1% Appreciation -1% Depreciation +1% AppreciationRM ‘000 RM ‘000 RM ‘000 RM ‘000
GroupUS Dollar (4,855) 4,855 8,604 (8,604)Euro 5,268 (5,268) 6,306 (6,306)Others 861 (861) (148) 148
BankUS Dollar (4,855) 4,855 8,604 (8,604)Euro 5,268 (5,268) 6,306 (6,306)Others 861 (861) (148) 148
20132014
51
BANK ISLAM MALAYSIA BERHAD PILLAR 3 DISCLOSURE AS AT 31 DECEMBER 2014
The Bank maintains a diversified and stable funding base comprising core retail, commercial, corporate customer deposits and institutional balances. This is augmented by wholesale funding and portfolios of highly liquid assets. The objective of the Bank’s liquidity and funding management is to ensure that all foreseeable funding commitments and deposit withdrawals can be met when due and that wholesale market access remains accessible and cost effective. Current accounts and savings deposits payable on demand or at short notice form a significant part of the Bank’s funding, and the Bank places considerable importance on maintaining their stability. For deposits, stability depends upon preserving depositor confidence in the Bank and the Bank’s capital strength and liquidity, and on competitive and transparent pricing. The management of liquidity and funding is primarily carried out in accordance with the Bank Negara Malaysia Liquidity Framework and practices and limits and triggers approved by the BRC and ALCO. These limits and triggers vary to take account of the depth and liquidity of the local market in which the Bank operates. The Bank maintains a strong liquidity position and manages the liquidity profile of its assets, liabilities and commitments to ensure that cash flows are appropriately balanced and all obligations are met when due. The Bank’s liquidity and funding management process include: • Daily projection of cash flows and ensuring that the Bank has sufficient liquidity surplus
and reserves to sustain a sudden liquidity shock; • Projecting cash flows and considering the level of liquid assets necessary in relation thereto; • Maintaining liabilities of appropriate term relative to the asset base; • Maintaining a diverse range of funding sources with adequate back-up facilities; • Monitoring depositor concentration in order to avoid undue reliance on large individual
depositors and ensure a satisfactory overall funding mix; and • Managing the maturities and diversifying funding liabilities across products and
counterparties. Liquidity and Funding Risk Governance The management of liquidity and funding risk is principally undertaken using risk limit mandates approved by the BRC and management action triggers assigned by the ALCO. ALCO is responsible under the authority delegated by the BRC for managing liquidity and funding risk at strategic level. Management of liquidity and funding risk All liquidity risk exposures are managed by Treasury. The aim is to ensure that liquidity and funding risk are consolidated at Treasury, which has the necessary skills, tools, management
52
BANK ISLAM MALAYSIA BERHAD PILLAR 3 DISCLOSURE AS AT 31 DECEMBER 2014
and governance to manage such risks professionally. Limits and triggers are set to meet the following objectives: • Sufficient liquidity surplus and reserves to sustain a sudden liquidity shock; • Cash flows are relatively diversified across all maturities; • Deposit base is not overly concentrated to a relatively small number of depositors; • Sufficient borrowing capacity in the Interbank market and highly liquid financial assets to
back it up; and • Not over-extending financing activities relative to the deposit base. MRMD is the independent risk control function and is responsible for ensuring efficient implementation of liquidity and funding risk management policies. Another control to ensure that liquidity and funding risk exposures remain within tolerable levels includes stress testing. A final key control feature of the Bank’s liquidity and funding risk management are the approved and documented liquidity and funding contingency plans. These plans identify early indicators of stress conditions and describe actions to be taken in the event of difficulties arising from systemic or other crises while minimising adverse long-term implications to the Bank.
Capital Treatment for Market Risk The Bank adopts the Standardised Approach to compute the market risk capital requirement under BNM’s Capital Adequacy Framework for Islamic Banks (CAFIB).
53
BANK ISLAM MALAYSIA BERHAD PILLAR 3 DISCLOSURE AS AT 31 DECEMBER 2014 7. Operational Risk
Operational Risk (“OR”) is defined as the “risk of loss arising from inadequate or failed internal processes, people and systems and external events, which includes legal risk and shariah compliance risk but excludes strategic and reputational risk”.
It is inherent in all banking products, activities, processes and systems and the effective management of operational risk has always been a fundamental element of a bank’s risk management programme. Operational Risk Governance Bank Islam’s operational risk management (“ORM”) is guided by its ORM Framework and Risk Management Policy as well as its Risk Appetite Framework which are designed to provide a sound and well-controlled operational environment within the Bank. The MRCC, under the authority delegated by the BRC is responsible to perform the oversight functions and to ensure effective management of issues relating to OR at strategic level. The ORCC which is a sub-committee of MRCC is primarily responsible in ensuring the effective implementation and maintenance of policies, processes and systems for managing OR for the Bank. Notwithstanding the above, the various Business & Support Units (“BU/SU”) are responsible for managing OR within their respective domains on a day to day basis and ensuring that their business & operational activities are carried out within the established ORM policies, guidelines, procedures and limits. To reinforce accountability and ownership of risk & control at BU/SU level, a Risk Controller for each BU/SU is appointed to assist in driving the risk & control programme for the Bank. Ultimately all staff of the Bank are to ensure they properly discharge their day to day responsibilities and are well-equipped with the necessary knowledge including the policies and procedures in executing their job functions. This is in line with our Risk Management Tagline i.e. “Managing Risk is Everyone’s Business”. Management of Operational Risk Bank Islam recognizes the utmost importance of operational risk management (“ORM”) and manages this risk through a control-based environment where processes are documented, authorisation is independent, transactions are reconciled and monitored and business activities are carried out within the established OR policies, guidelines, procedures and limits. The Bank’s overall governance approach in managing OR is premised on the Three Lines of Defence Approach:
54
BANK ISLAM MALAYSIA BERHAD PILLAR 3 DISCLOSURE AS AT 31 DECEMBER 2014
a) 1st line of defence – the risk owner or risk taking unit i.e. BU/SU is accountable for putting in place a robust control environment within their respective units. They are responsible for the day to day management of OR.
b) 2nd line of defence – The Operational Risk Management Department (“ORMD”)
which includes Shariah Risk Management (“SRM”) is responsible for establishing and maintaining the ORM framework, developing various ORM tools to facilitate the management of OR, monitoring the effectiveness of ORM, assessing OR issues from the risk owner and escalating OR issues to the relevant governance level with recommendations on appropriate risk mitigation strategies. In creating a strong risk culture, ORMD is also responsible to promote risk awareness across the Bank.
The Bank’s Compliance Division complements the role of ORM as the second line of defence by ensuring effective oversight on compliance-related risks such as regulatory compliance risk, compliance risk as well as money laundering and terrorism financing risks through proper classification of risks and developing, reviewing and enhancing compliance-related training programme as well as conducting training through ongoing awareness creation.
c) 3rd line of defence – Internal Audit provides independent assurance to the Board and
senior management on the effectiveness of the ORM process. Operational Risk Management Framework The Bank’s ORM is guided by the ORM framework designed to provide a sound and well-controlled operational environment within the Bank. The framework sets out the Bank’s approach to identifying, assessing, monitoring and mitigating OR and focuses on the four causal factors of OR i.e. internal processes, people, system and external events. It consists of the following components:
55
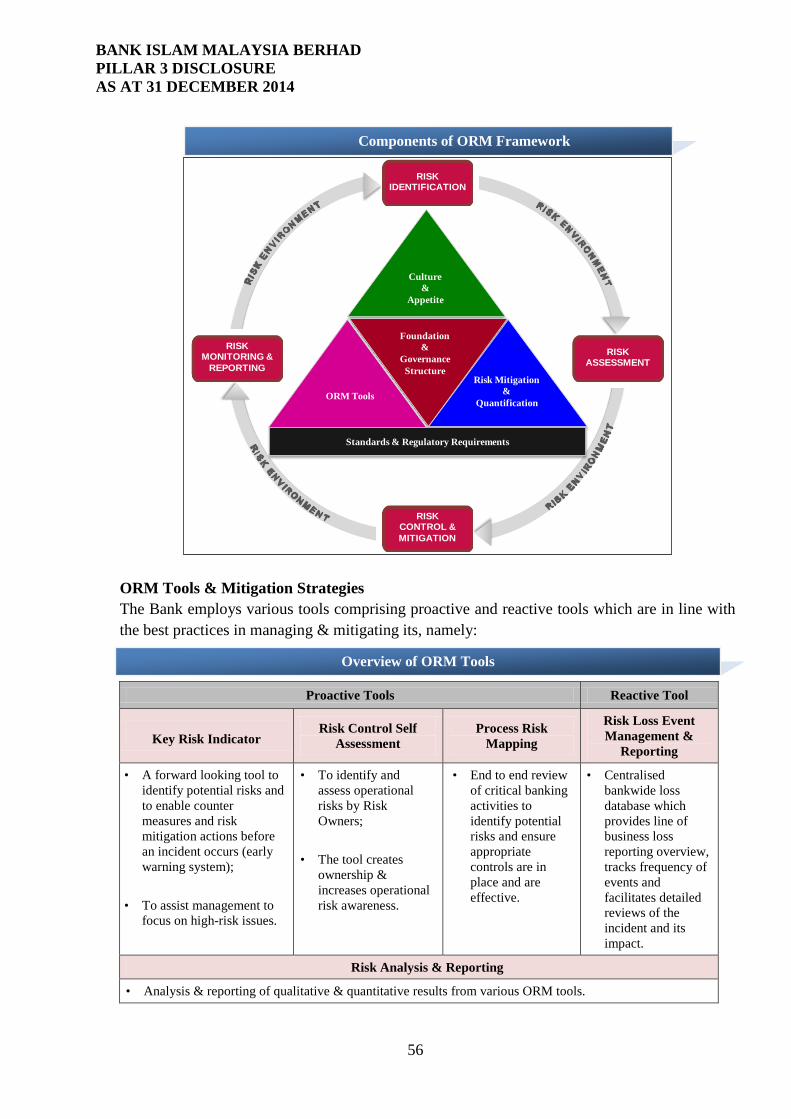
BANK ISLAM MALAYSIA BERHAD PILLAR 3 DISCLOSURE AS AT 31 DECEMBER 2014
ORM Tools & Mitigation Strategies The Bank employs various tools comprising proactive and reactive tools which are in line with the best practices in managing & mitigating its, namely:
Proactive Tools Reactive Tool
Key Risk Indicator Risk Control Self
Assessment Process Risk
Mapping
Risk Loss Event Management &
Reporting
• A forward looking tool to identify potential risks and to enable counter measures and risk mitigation actions before an incident occurs (early warning system);
• To assist management to focus on high-risk issues.
• To identify and assess operational risks by Risk Owners;
• The tool creates ownership & increases operational risk awareness.
• End to end review of critical banking activities to identify potential risks and ensure appropriate controls are in place and are effective.
• Centralised bankwide loss database which provides line of business loss reporting overview, tracks frequency of events and facilitates detailed reviews of the incident and its impact.
Risk Analysis & Reporting
• Analysis & reporting of qualitative & quantitative results from various ORM tools.
RISK MONITORING &
REPORTING
RISK IDENTIFICATION
RISK ASSESSMENT
RISK CONTROL & MITIGATION
Standards & Regulatory Requirements
Foundation&
Governance Structure
Risk Mitigation&
Quantification
Standards & Regulatory Requirements
ORM Tools
Culture&
Appetite
Overview of ORM Tools
Components of ORM Framework
56
BANK ISLAM MALAYSIA BERHAD PILLAR 3 DISCLOSURE AS AT 31 DECEMBER 2014
In addition, a comprehensive Business Continuity Management (“BCM”) function has been established within Bank Islam to ensure that in the event of material disruptions from internal or external events, critical business functions can be maintained or restored in a timely manner. This ensures minimal adverse impact on customers, staff and products and services. BCM constitutes an essential component of the Bank’s risk management process by providing a controlled response to potential OR that could have a significant impact on the Bank’s critical processes and revenue streams. As part of the risk transfer strategy, the Bank obtains 3rd party takaful coverage to cover for the Bank’s high impact loss events. The Bank also ensures that the Bankwide OR awareness programme is conducted on an ongoing basis. This training programme includes emphasis on inculcating an OR culture among staff, effective implementation of ORM tools, fraud awareness, BCM and other aspects of ORM.
Capital Treatment for Operational Risk Operational Risk capital charge is calculated using the BIA as per BNM’s CAFIB Guideline. The BIA for operational risk capital charge calculation applies an alpha (15%) to the average of positive gross income that was achieved over the previous three years by the Group. The RWA amount is computed by multiplying the minimum capital required with a multiplier of 12.5 (reciprocal of 8%).
57
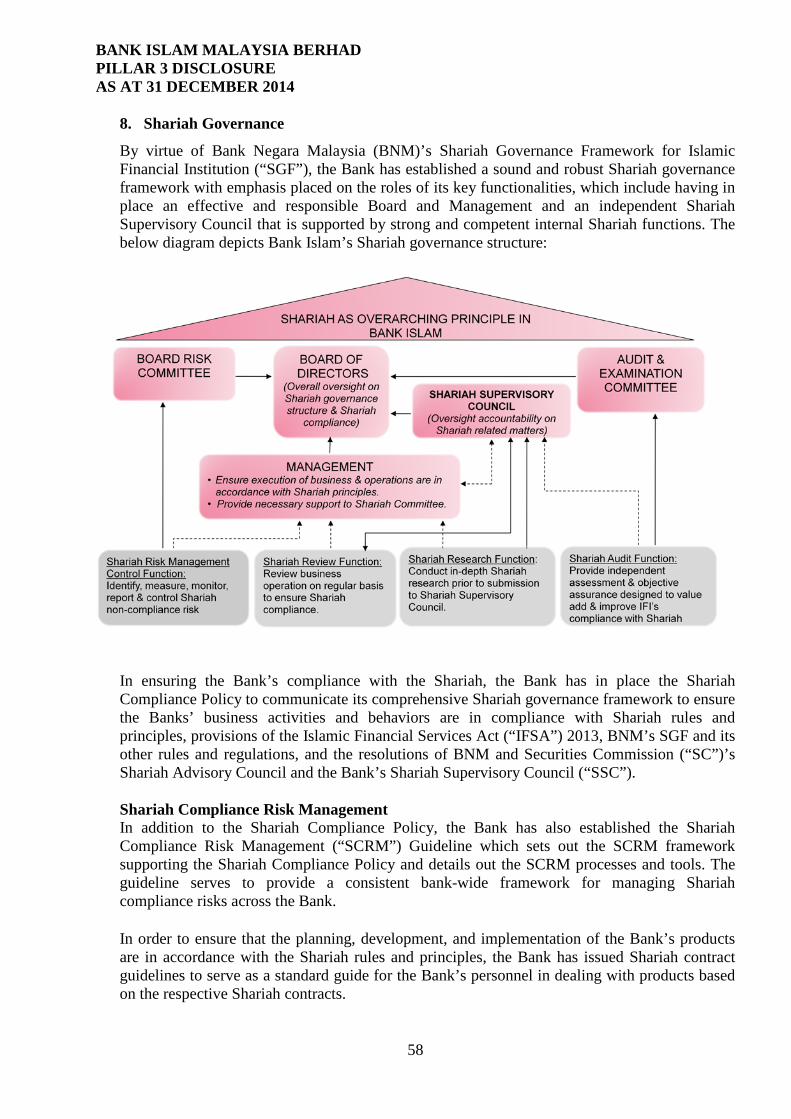
BANK ISLAM MALAYSIA BERHAD PILLAR 3 DISCLOSURE AS AT 31 DECEMBER 2014
8. Shariah Governance
By virtue of Bank Negara Malaysia (BNM)’s Shariah Governance Framework for Islamic Financial Institution (“SGF”), the Bank has established a sound and robust Shariah governance framework with emphasis placed on the roles of its key functionalities, which include having in place an effective and responsible Board and Management and an independent Shariah Supervisory Council that is supported by strong and competent internal Shariah functions. The below diagram depicts Bank Islam’s Shariah governance structure:
In ensuring the Bank’s compliance with the Shariah, the Bank has in place the Shariah Compliance Policy to communicate its comprehensive Shariah governance framework to ensure the Banks’ business activities and behaviors are in compliance with Shariah rules and principles, provisions of the Islamic Financial Services Act (“IFSA”) 2013, BNM’s SGF and its other rules and regulations, and the resolutions of BNM and Securities Commission (“SC”)’s Shariah Advisory Council and the Bank’s Shariah Supervisory Council (“SSC”). Shariah Compliance Risk Management In addition to the Shariah Compliance Policy, the Bank has also established the Shariah Compliance Risk Management (“SCRM”) Guideline which sets out the SCRM framework supporting the Shariah Compliance Policy and details out the SCRM processes and tools. The guideline serves to provide a consistent bank-wide framework for managing Shariah compliance risks across the Bank.
In order to ensure that the planning, development, and implementation of the Bank’s products are in accordance with the Shariah rules and principles, the Bank has issued Shariah contract guidelines to serve as a standard guide for the Bank’s personnel in dealing with products based on the respective Shariah contracts.
58
BANK ISLAM MALAYSIA BERHAD PILLAR 3 DISCLOSURE AS AT 31 DECEMBER 2014
In line with the definition of Operational Risk which includes Shariah Compliance Risk (“SCR”) as part of Operational Risk, the Shariah risk management embarks on the established Operational Risk Management processes and tools in managing Shariah non-compliance risks bank-wide. Shariah Non-Compliance Events A Shariah non-compliance (“SNC”) event is a result of the Bank’s failure to comply with the Shariah rules and principles determined by the relevant Shariah regulatory councils. The Bank has established its internal framework of SNC reporting pursuant to the mechanism set out by BNM through its circular on SNC Reporting which was then superseded by BNM’s Operational Risk Reporting Requirement – Operational Risk Integrated Online Network (“ORION”). This framework was established to ensure compliance to section 28(3) of the Islamic Financial Services Act (“IFSA”) 2013 which requires any SNC event to be immediately reported to BNM. By virtue of the requirement, the Bank is also obliged to report potential SNC events to BNM on monthly basis. Throughout the year 2014, there were three (3) SNC events reported due to failure to perform aqad execution as per approved product structures by the Bank’s SSC. Nevertheless, these events did not result to de-recognition of income as the SNC events occurred in deposit products in which the Bank was not entitled to any profit. The Bank, from time to time, makes efforts to prevent similar Shariah breaches from recurring by tightening controls such as revising the Shariah compliance checklist, conducting awareness initiatives as well as putting additional controls to ensure compliance with Shariah requirements. Shariah Non-Compliant Income
31 December 2014 31 December 2013 RM3,360.01 RM50,713.42
The above amount consists of commissions from Shariah non-compliant merchants of card business, interest received from the Bank’s nostro account as well as rental purification from the Bank’s land that is being used to facilitate bai’ inah based transaction. The income was channeled to charitable causes upon approval by the Shariah Supervisory Council.
59
BANK ISLAM MALAYSIA BERHAD PILLAR 3 DISCLOSURE AS AT 31 DECEMBER 2014 Managing Director Attestation In accordance with Bank Negara Malaysia’s Capital Adequacy Framework for Islamic Bank (CAFIB) Disclosure Requirements (Pillar 3), I hereby attest that to the best of my knowledge, the disclosures contained in Bank Islam Berhad’s Pillar 3 Disclosures report for the financial year ended 31 December 2014 are consistent with the manner in which the Group and the Bank assesses and manages its risk, and are not misleading in any particular way.
---------------------------------- Dato’ Sri Zukri Samat Managing Director Bank Islam Malaysia Berhad
60