Embed Size (px)
Citation preview
Bas
el II
Pill
ar 3
Rep
ort
2009
Deu
tsch
e B
ank
Deutsche Bank
Basel II Pillar 3 Report 2009

Pillar 3 Report Index of Content
1
1. Introduction ...................................................................................................................................................................................... 3
2. Scope of Application .................................................................................................................................................................... 4
3. Capital Adequacy ........................................................................................................................................................................... 6
3.1 Regulatory Capital ................................................................................................................................................................. 6
3.2 Regulatory Capital Requirements .................................................................................................................................... 8
3.3 Regulatory Capital Ratios ................................................................................................................................................... 11
3.4 Internal Capital Adequacy Assessment Process (ICAAP) ..................................................................................... 12
4. Risk and Capital Management of the Group .................................................................................................................... 13
4.1 Risk and Capital Management Principles and Organization ................................................................................. 13
4.2 Categories, Quantification and Reporting of Risk ..................................................................................................... 15
4.3 Capital Management ............................................................................................................................................................. 20
4.4 Balance Sheet Management ............................................................................................................................................. 22
4.5 Economic Capital Requirements ...................................................................................................................................... 22
5. Counterparty Credit Risk: Strategy and Processes ..................................................................................................... 24
5.1 Credit Risk Management Principles and Strategy .................................................................................................... 24
5.2 Credit Risk Ratings and Governance ............................................................................................................................. 24
5.3 Credit Risk Mitigation ............................................................................................................................................................ 25
5.4 Credit Risk Limit Setting and Monitoring ....................................................................................................................... 27
5.5 Credit Exposure ...................................................................................................................................................................... 29
5.6 Counterparty Credit Risk from Derivatives ................................................................................................................... 33
5.7 Asset Quality ............................................................................................................................................................................ 37
6. Counterparty Credit Risk: Regulatory Assessment .................................................................................................... 46
6.1 Advanced Internal Ratings Based Approach .............................................................................................................. 46
6.2 Advanced IRBA Exposure .................................................................................................................................................. 51
6.3 Other IRBA Exposure ........................................................................................................................................................... 55
6.4 Standardized Approach ....................................................................................................................................................... 56
6.5 Regulatory Application of Credit Risk Mitigation Techniques ............................................................................... 57
7. Securitization ................................................................................................................................................................................... 60
7.1 Overview of Activities Undertaken by the Group ....................................................................................................... 60
7.2 Accounting and Valuation Policies for Securitizations ............................................................................................. 62
7.3 Regulatory Securitization Framework ............................................................................................................................ 63
7.4 Securitization Details ............................................................................................................................................................ 65
8. Trading Market Risk ..................................................................................................................................................................... 71
9. Nontrading Market Risk .............................................................................................................................................................. 82
9.1 Equity Investments in the Banking Book ...................................................................................................................... 82
9.2 Interest Rate Risk in the Banking Book ......................................................................................................................... 85
9.3 Nontrading Market Risk Management ........................................................................................................................... 86
10. Operational Risk ............................................................................................................................................................................. 90
11. Liquidity Risk ................................................................................................................................................................................... 95
Glossary ...................................................................................................................................................................................................... 100
Impressum .................................................................................................................................................................................................. 104
Index of Content
Pillar 3 Report Index of Tables
2
Table 1 Regulatory Capital ................................................................................................................................................ 7 Table 2 Reconciliation of IFRS Shareholders’ Equity to Tier 1 Capital ................................................................ 8 Table 3 Regulatory Capital Requirements and RWA ................................................................................................. 10 Table 4 Coverage of Minimum Capital Requirements ............................................................................................... 11 Table 5 Economic Capital Requirements ...................................................................................................................... 23 Table 6 Credit Risk Exposure by Region ....................................................................................................................... 30 Table 7 Credit Risk Exposure by Industry ..................................................................................................................... 31 Table 8 Credit Risk Exposure by Maturity ..................................................................................................................... 32 Table 9 Average Credit Risk Exposure .......................................................................................................................... 32 Table 10 Positive Market Values of Derivatives ............................................................................................................ 36 Table 11 Notional Amount of Credit Derivatives ............................................................................................................ 37 Table 12 Loans Impaired or Past Due by Region .......................................................................................................... 41 Table 13 Loans Impaired or Past Due by Industry ........................................................................................................ 42 Table 14 Loans Impaired by Industry ................................................................................................................................ 43 Table 15 Loans Past Due but not Impaired ..................................................................................................................... 44 Table 16 Development of Allowance for Credit Losses ............................................................................................... 45 Table 17 Expected Loss and Actual Loss by IRBA Exposure Class ....................................................................... 49 Table 18 Actual Loss by IRBA Exposure Class ............................................................................................................. 50 Table 19 EAD of Advanced IRBA Credit Exposures by PD Grade .......................................................................... 52 Table 20 EAD of Undrawn Commitments in the Advanced IRBA by Exposure Class ........................................ 54 Table 21 EAD of Equity Investments, CIUs and Other Non-credit Obligation Assets by Risk Weight .......... 55 Table 22 EAD in the Standardized Approach by Risk Weight ................................................................................... 57 Table 23 Collateralized Counterparty Credit Risk Exposure in the Advanced IRBA
by Exposure Class ................................................................................................................................................ 58 Table 24 Collateralized Counterparty Credit Risk Exposure in the Standardized Approach
by Exposure Class ................................................................................................................................................ 59 Table 25 Outstanding Exposures Securitized by Exposure Type (Overall Pool Size) ....................................... 66 Table 26 Impaired and Past Due Exposures Securitized and Losses Recognized
by Exposure Type (Overall Pool Size) ............................................................................................................ 67 Table 27 Securitization Positions Retained or Purchased by Exposure Type ...................................................... 68 Table 28 Securitization Positions Retained or Purchased by Region ..................................................................... 68 Table 29 Securitization Positions Retained or Purchased by Risk Weight Band ................................................. 69 Table 30 Securitization Activity – Total Outstanding Exposures Securitized by Exposure Type .................... 70 Table 31 Value-at-Risk of CIB Trading Units by Risk Type ........................................................................................ 77 Table 32 Value-at-Risk of CIB Trading Units in the Reporting Period .................................................................... 77 Table 33 Equity Investments According to IFRS Classification ................................................................................ 83 Table 34 Realized Gains (Losses) in the Reporting Period and Unrealized Gains (Losses)
at Year-end from Equity Investments .............................................................................................................. 84 Table 35 Economic Capital Usage for the Group’s Nontrading Market Risk Portfolios
per Business Area ................................................................................................................................................. 87 Table 36 Carrying Value and Economic Capital Usage for the Group’s Nontrading Market Risk Portfolios ... 88 Table 37 Measuring the Group’s Operational Risks ..................................................................................................... 92 Table 38 Stress Testing Liquidity Risk ............................................................................................................................. 98
Index of Tables

Pillar 3 Report 1. Introduction
3
Since 2008 Deutsche Bank Group operates under the Basel II capital framework (“Basel II”), the revised interna-
tional capital adequacy standards as recommended by the Basel Committee on Banking Supervision in 2004. This
framework consists of three pillars each of them concentrating on a different aspect of banking regulation.
— Pillar 1 makes recommendations for calculation of minimum capital requirements.
— Pillar 2 discusses the key principles of supervisory review and risk management guidance.
— Pillar 3 complements the first two pillars of Basel II by requiring a range of disclosures on capital and risk
assessment processes, aimed at encouraging and reinforcing market discipline.
The European Union enacted the Capital Requirements Directive, which adopted the Basel II capital framework.
Germany adopted the Capital Requirements Directive into national law and codified the disclosure requirements
related to Pillar 3 in Section 26a of the German Banking Act (“Kreditwesengesetz” or “KWG”) and in Part 5 of the
German Regulation on Solvency (“Solvabilitätsverordnung”, “Solvency Regulation” or “SolvV”).
The Deutsche Bank group of institutions (also referred to as “the Group”) has applied the revised capital frame-
work on the basis of the Group’s internal models for measuring credit risk, market risk and operational risk, as
approved by the German Federal Financial Supervisory Authority (Bundesanstalt für Finanzdienstleistungs-
aufsicht, referred to as “BaFin”). This report is the Group’s second Basel II Pillar 3 report. It is published for the
financial year ending December 31, 2009.
As it is not required by regulation, this report has not been audited by the Group’s external auditors. However, it
also includes information that is contained within the audited consolidated financial statements as reported in the
Group’s Financial Report 2009.
1. Introduction
Pillar 3 Report 2. Scope of Application
4
Deutsche Bank Aktiengesellschaft (“Deutsche Bank AG”), headquartered in Frankfurt am Main, Germany, is the
parent institution of the Deutsche Bank group of institutions, which is subject to the supervisory provisions of
the Banking Act and the SolvV. Under the Banking Act, a regulatory group of institutions consists of a credit
institution (also referred to as “bank”) or financial services institution, as the parent company, and all other banks,
financial services institutions, investment management companies, financial enterprises, ancillary services
enterprises and payment institutions which are subsidiaries in the meaning of Section 1 (7) KWG. Such entities
are fully consolidated for the Group’s regulatory reporting. Insurance companies and companies outside the
finance sector are not included.
For financial conglomerates, however, insurance companies are included in an additional capital adequacy (also
“solvency margin”) calculation. The Group has been designated as a financial conglomerate following the acquisi-
tion of Abbey Life Assurance Company Limited in October 2007. The Group’s solvency margin as a financial
conglomerate remains dominated by its banking activities.
The regulatory principles of consolidation are not identical to those for the Group’s financial statements, which are
prepared in accordance with the International Financial Reporting Standards (“IFRS”). Nonetheless, the majority
of subsidiaries according to the Banking Act are also fully consolidated in accordance with IFRS in the Group’s
consolidated financial statements and vice versa. For more detailed information about the Group’s accounting
policies on consolidation please see Note [1] “Significant Accounting Policies” in the Group’s Financial
Report 2009.
The main differences between regulatory and accounting consolidation are:
— Entities which do not form part of the regulatory group of institutions because they do not belong to the
banking industry, but which are controlled by the Deutsche Bank Group according to IFRS are included in
the consolidated financial statements.
— Most of the Group’s Special Purpose Entities (“SPEs”) consolidated under IFRS do not meet the specific
consolidation requirements pursuant to Section 10a KWG and are consequently not consolidated within the
regulatory Group. However, the risks resulting from the Group’s exposures to such entities are reflected in
the Group’s regulatory capital requirements.
— Some entities included in the regulatory scope of application are not consolidated for accounting purposes
but are treated differently, in particular using the equity method of accounting. There is only one entity within
the Deutsche Bank group of institutions which is jointly controlled by its owners and consolidated on a pro-rata
basis. It is accounted for under the equity method in the Group’s financial statements.
2. Scope of Application

Pillar 3 Report 2. Scope of Application
5
Section 10 (6) No. 1, 2, 3 and 5 KWG requires the deduction of participating interests in unconsolidated banking,
financial and insurance entities from the Group’s own funds when the Group holds more than 10 % of the capital
(in case of insurance entities 20 % either of the capital or of voting rights unless included in the solvency margin
calculation of the financial conglomerate). Since the Deutsche Bank Group is classified as a financial conglome-
rate, material investments in insurance entities amounting to at least 20 % of capital or voting rights are not
deducted from the Group’s own funds as they are included in the solvency calculation at financial conglomerate
level.
In the following chapters the quantitative information presented refers to the regulatory Group unless another
relevant scope is explicitly stated.
Pillar 3 Report 3. Capital Adequacy
6
3.1 Regulatory Capital
A bank’s total regulatory capital, also referred to as “Own Funds”, is divided into three tiers: Tier 1, Tier 2 and
Tier 3 capital, and the sum of Tier 1 and Tier 2 capital is also referred to as “Regulatory Banking Capital”.
— Tier 1 capital consists primarily of common share capital, additional paid-in capital, retained earnings and
hybrid capital components such as noncumulative trust preferred securities. Common shares in treasury,
goodwill and other intangible assets are deducted from Tier 1. Other regulatory adjustments according to the
Banking Act entail the exclusion of capital from entities outside the group of institutions and the reversal of
capital effects under the fair value option on financial liabilities due to own credit risk. Tier 1 capital without
hybrid capital components is referred to as Core Tier 1 capital.
— Tier 2 capital consists primarily of cumulative trust preferred securities and long-term subordinated debt, as
well as 45 % of unrealized gains on certain listed securities.
Certain items must be deducted from Tier 1 and Tier 2 capital. Primarily these include deductible investments in
unconsolidated banking, financial and insurance entities where the Group holds more than 10 % of the capital
(in case of insurance entities 20 % either of the capital or of voting rights unless included in the solvency margin
calculation of the financial conglomerate); the amount by which the expected loss for exposures to central gov-
ernments, institutions, corporate and retail exposures as measured under the Group’s internal ratings based
approach (“IRBA”) model exceeds the value adjustments and provisions for such exposures; the expected losses
for certain equity exposures; securitization positions not included in the risk-weighted assets (“RWA”); and the
value of securities delivered to a counterparty plus any replacement cost to the extent the required payment by
the counterparty has not been made within five business days after delivery provided the transaction has been
allocated to the Group’s trading book.
— Tier 3 capital consists mainly of certain short-term subordinated debt.
The amount of subordinated debt that may be included as Tier 2 capital is limited to 50 % of Tier 1 capital. Total
Tier 2 capital is limited to 100 % of Tier 1 capital.
3. Capital Adequacy
Pillar 3 Report 3. Capital Adequacy
7
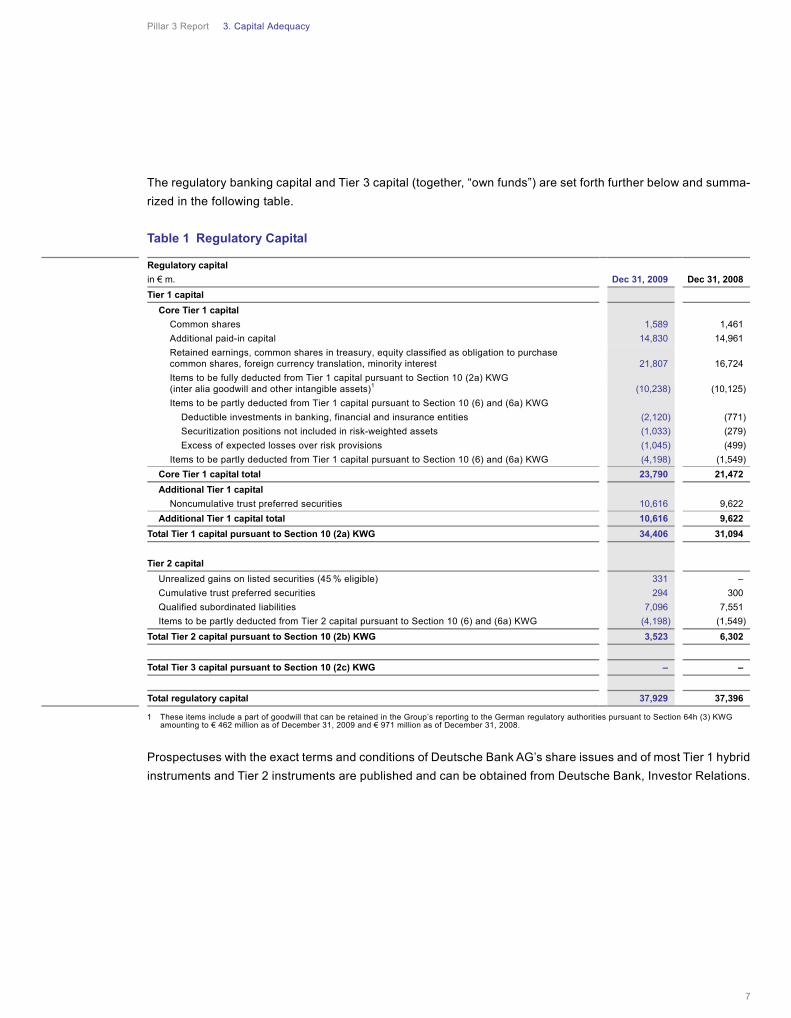
The regulatory banking capital and Tier 3 capital (together, “own funds”) are set forth further below and summa-
rized in the following table.
Table 1 Regulatory Capital
1 These items include a part of goodwill that can be retained in the Group’s reporting to the German regulatory authorities pursuant to Section 64h (3) KWG amounting to € 462 million as of December 31, 2009 and € 971 million as of December 31, 2008.
Prospectuses with the exact terms and conditions of Deutsche Bank AG’s share issues and of most Tier 1 hybrid
instruments and Tier 2 instruments are published and can be obtained from Deutsche Bank, Investor Relations.
Regulatory capital
in € m. Dec 31, 2009 Dec 31, 2008
Tier 1 capital
Core Tier 1 capital
Common shares 1,589 1,461
Additional paid-in capital 14,830 14,961
Retained earnings, common shares in treasury, equity classified as obligation to purchase common shares, foreign currency translation, minority interest 21,807 16,724
Items to be fully deducted from Tier 1 capital pursuant to Section 10 (2a) KWG (inter alia goodwill and other intangible assets)1 (10,238) (10,125)
Items to be partly deducted from Tier 1 capital pursuant to Section 10 (6) and (6a) KWG
Deductible investments in banking, financial and insurance entities (2,120) (771)
Securitization positions not included in risk-weighted assets (1,033) (279)
Excess of expected losses over risk provisions (1,045) (499)
Items to be partly deducted from Tier 1 capital pursuant to Section 10 (6) and (6a) KWG (4,198) (1,549)
Core Tier 1 capital total 23,790 21,472
Additional Tier 1 capital
Noncumulative trust preferred securities 10,616 9,622
Additional Tier 1 capital total 10,616 9,622
Total Tier 1 capital pursuant to Section 10 (2a) KWG 34,406 31,094
Tier 2 capital
Unrealized gains on listed securities (45 % eligible) 331 –
Cumulative trust preferred securities 294 300
Qualified subordinated liabilities 7,096 7,551
Items to be partly deducted from Tier 2 capital pursuant to Section 10 (6) and (6a) KWG (4,198) (1,549)
Total Tier 2 capital pursuant to Section 10 (2b) KWG 3,523 6,302
Total Tier 3 capital pursuant to Section 10 (2c) KWG – –
Total regulatory capital 37,929 37,396
Pillar 3 Report 3. Capital Adequacy
8
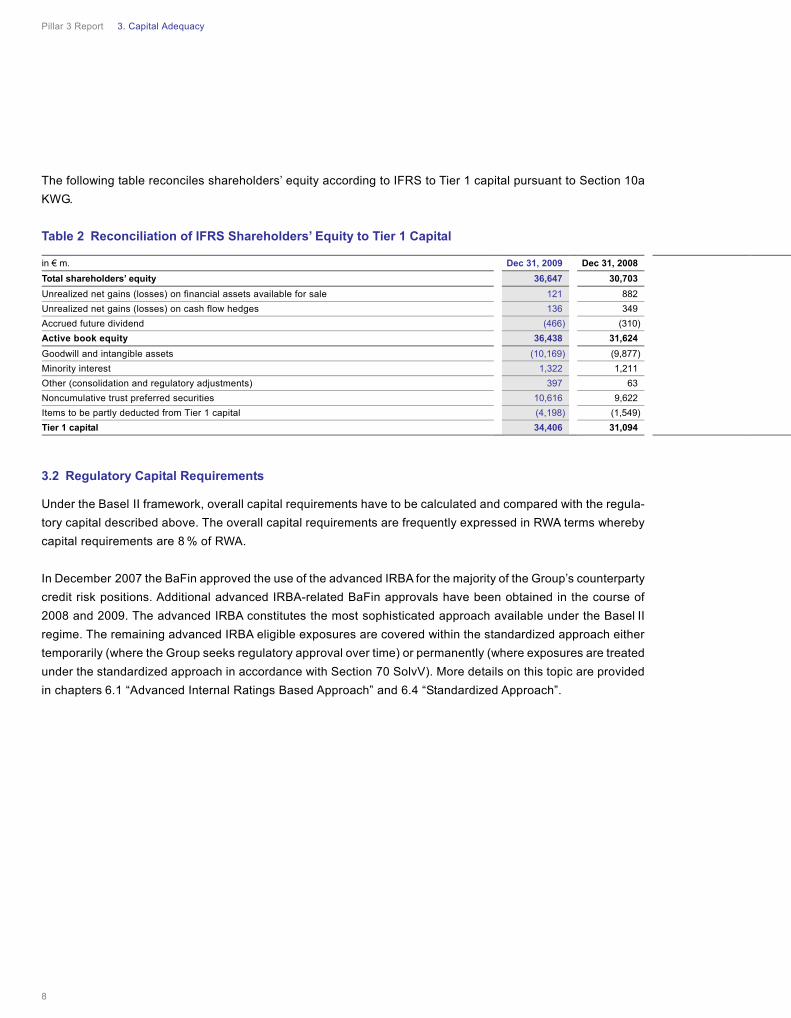
The following table reconciles shareholders’ equity according to IFRS to Tier 1 capital pursuant to Section 10a
KWG.
Table 2 Reconciliation of IFRS Shareholders’ Equity to Tier 1 Capital
3.2 Regulatory Capital Requirements
Under the Basel II framework, overall capital requirements have to be calculated and compared with the regula-
tory capital described above. The overall capital requirements are frequently expressed in RWA terms whereby
capital requirements are 8 % of RWA.
In December 2007 the BaFin approved the use of the advanced IRBA for the majority of the Group’s counterparty
credit risk positions. Additional advanced IRBA-related BaFin approvals have been obtained in the course of
2008 and 2009. The advanced IRBA constitutes the most sophisticated approach available under the Basel II
regime. The remaining advanced IRBA eligible exposures are covered within the standardized approach either
temporarily (where the Group seeks regulatory approval over time) or permanently (where exposures are treated
under the standardized approach in accordance with Section 70 SolvV). More details on this topic are provided
in chapters 6.1 “Advanced Internal Ratings Based Approach” and 6.4 “Standardized Approach”.
in € m. Dec 31, 2009 Dec 31, 2008
Total shareholders’ equity 36,647 30,703
Unrealized net gains (losses) on financial assets available for sale 121 882
Unrealized net gains (losses) on cash flow hedges 136 349
Accrued future dividend (466) (310)
Active book equity 36,438 31,624
Goodwill and intangible assets (10,169) (9,877)
Minority interest 1,322 1,211
Other (consolidation and regulatory adjustments) 397 63
Noncumulative trust preferred securities 10,616 9,622
Items to be partly deducted from Tier 1 capital (4,198) (1,549)
Tier 1 capital 34,406 31,094
Pillar 3 Report 3. Capital Adequacy
9
The table below shows a breakdown of the total capital requirements and risk-weighted assets by risk type. The
counterparty credit risk within the advanced IRBA and the standardized approach is broken down into different
regulatory exposure classes. The capital requirement for securitization positions is separately displayed and
is calculated substantially using the IRBA approach; only a minor exposure portion is captured under the stan-
dardized approach. More details on the treatment of securitization positions can be found in chapter 7 “Securi-
tization”.
For equity investments entered into before January 1, 2008, the Group uses the transitional arrangement to
exempt these positions from an IRBA treatment and applies the grandfathering rule, using a 100 % risk weighting.
For more recent investments in equity positions entered into since January 1, 2008, the Group applies the simple
risk weight approach within the IRBA. For more details regarding equity investments please refer to chapter 9.1
“Equity Investments in the Banking Book”.
The calculation of regulatory market risk capital requirements (for general and specific market risk) is based on an
internal value-at-risk model, which was approved by the BaFin in October 1998. More details on the internal
value-at-risk model are provided in chapter 8 “Trading Market Risk”.
In December 2007, the Group obtained approval to apply the advanced measurement approach (“AMA”) to
determine its regulatory operational risk capital requirements. The table below shows the AMA-based capital
requirement for operational risk. Details on the Group’s AMA model are given in chapter 10 “Operational Risk”.
Pillar 3 Report 3. Capital Adequacy
10
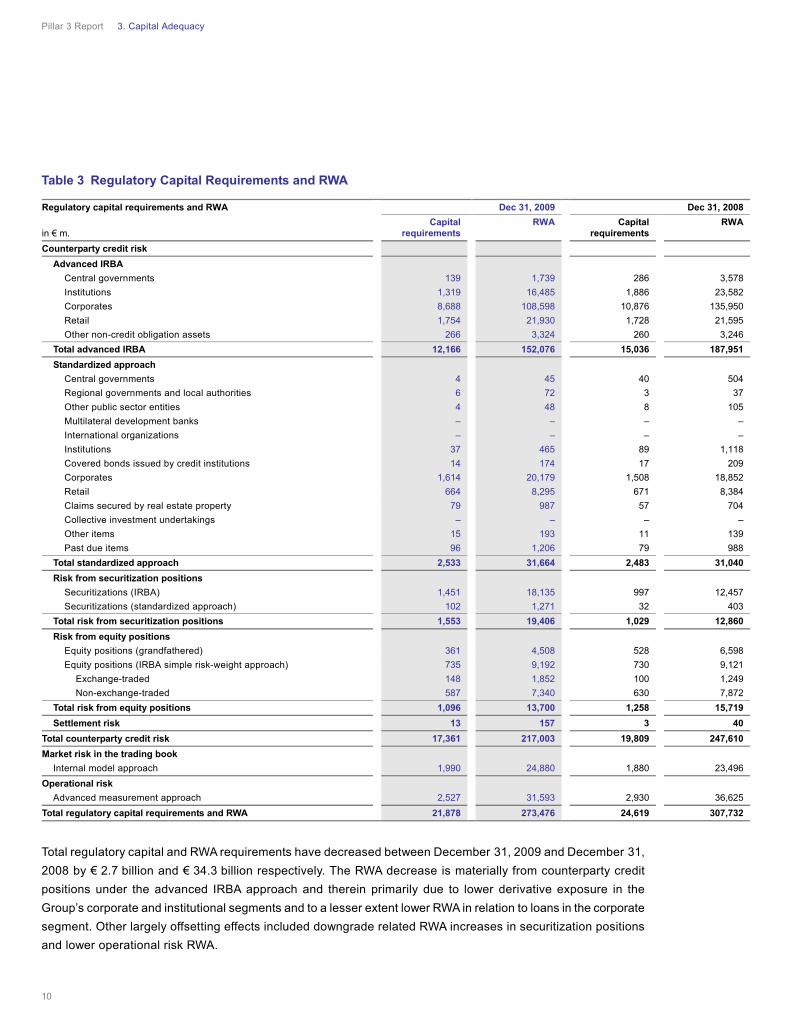
Table 3 Regulatory Capital Requirements and RWA
Total regulatory capital and RWA requirements have decreased between December 31, 2009 and December 31,
2008 by € 2.7 billion and € 34.3 billion respectively. The RWA decrease is materially from counterparty credit
positions under the advanced IRBA approach and therein primarily due to lower derivative exposure in the
Group’s corporate and institutional segments and to a lesser extent lower RWA in relation to loans in the corporate
segment. Other largely offsetting effects included downgrade related RWA increases in securitization positions
and lower operational risk RWA.
Regulatory capital requirements and RWA Dec 31, 2009 Dec 31, 2008
in € m. Capital
requirements RWA Capital
requirements RWA
Counterparty credit risk
Advanced IRBA
Central governments 139 1,739 286 3,578
Institutions 1,319 16,485 1,886 23,582
Corporates 8,688 108,598 10,876 135,950
Retail 1,754 21,930 1,728 21,595
Other non-credit obligation assets 266 3,324 260 3,246
Total advanced IRBA 12,166 152,076 15,036 187,951
Standardized approach
Central governments 4 45 40 504
Regional governments and local authorities 6 72 3 37
Other public sector entities 4 48 8 105
Multilateral development banks – – – –
International organizations – – – –
Institutions 37 465 89 1,118
Covered bonds issued by credit institutions 14 174 17 209
Corporates 1,614 20,179 1,508 18,852
Retail 664 8,295 671 8,384
Claims secured by real estate property 79 987 57 704
Collective investment undertakings – – – –
Other items 15 193 11 139
Past due items 96 1,206 79 988
Total standardized approach 2,533 31,664 2,483 31,040
Risk from securitization positions
Securitizations (IRBA) 1,451 18,135 997 12,457
Securitizations (standardized approach) 102 1,271 32 403
Total risk from securitization positions 1,553 19,406 1,029 12,860
Risk from equity positions
Equity positions (grandfathered) 361 4,508 528 6,598
Equity positions (IRBA simple risk-weight approach) 735 9,192 730 9,121
Exchange-traded 148 1,852 100 1,249
Non-exchange-traded 587 7,340 630 7,872
Total risk from equity positions 1,096 13,700 1,258 15,719
Settlement risk 13 157 3 40
Total counterparty credit risk 17,361 217,003 19,809 247,610
Market risk in the trading book
Internal model approach 1,990 24,880 1,880 23,496
Operational risk
Advanced measurement approach 2,527 31,593 2,930 36,625
Total regulatory capital requirements and RWA 21,878 273,476 24,619 307,732
Pillar 3 Report 3. Capital Adequacy
11
3.3 Regulatory Capital Ratios
The German Banking Act and the German Regulation on Solvency reflect the capital adequacy rules of Basel II
and require German banks to maintain an adequate level of capital in relation to their regulatory capital require-
ments comprising counterparty credit risk, operational risk and market risk. Counterparty credit risk and opera-
tional risk must be covered with Tier 1 capital and Tier 2 capital (together “regulatory banking capital”). Market
risk must be covered with regulatory banking capital (to the extent not required to cover counterparty credit and
operational risk) or Tier 3 capital (together with regulatory banking capital, “own funds”).
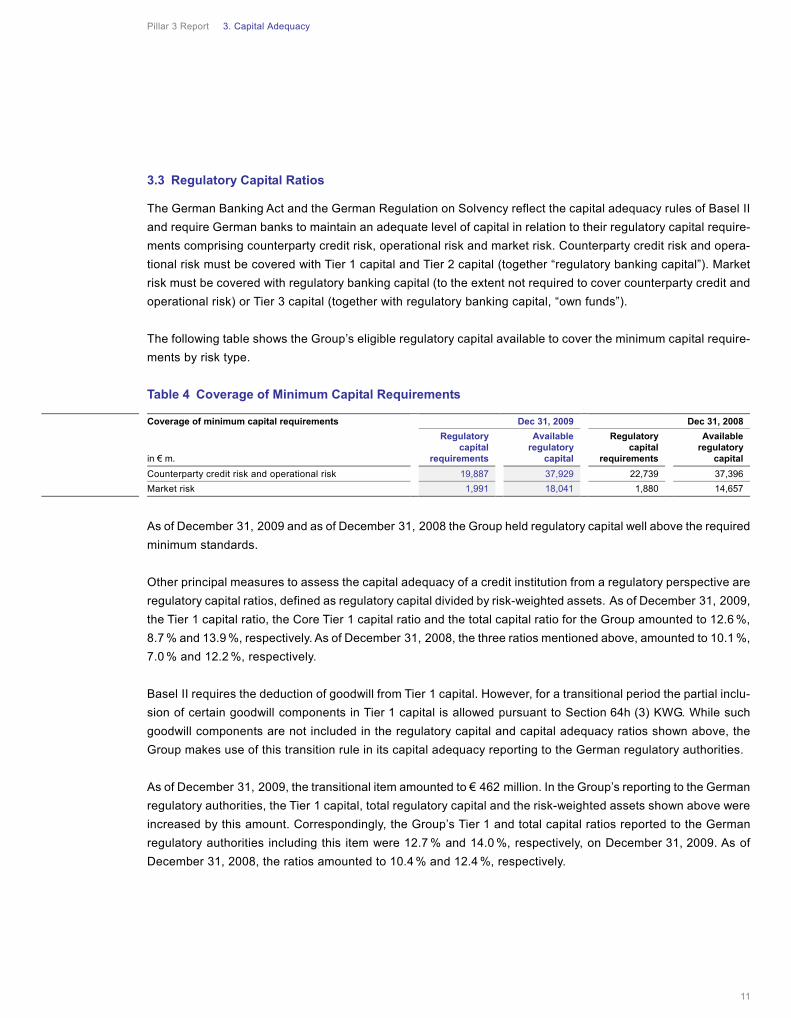
The following table shows the Group’s eligible regulatory capital available to cover the minimum capital require-
ments by risk type.
Table 4 Coverage of Minimum Capital Requirements
As of December 31, 2009 and as of December 31, 2008 the Group held regulatory capital well above the required
minimum standards.
Other principal measures to assess the capital adequacy of a credit institution from a regulatory perspective are
regulatory capital ratios, defined as regulatory capital divided by risk-weighted assets. As of December 31, 2009,
the Tier 1 capital ratio, the Core Tier 1 capital ratio and the total capital ratio for the Group amounted to 12.6 %,
8.7 % and 13.9 %, respectively. As of December 31, 2008, the three ratios mentioned above, amounted to 10.1 %,
7.0 % and 12.2 %, respectively.
Basel II requires the deduction of goodwill from Tier 1 capital. However, for a transitional period the partial inclu-
sion of certain goodwill components in Tier 1 capital is allowed pursuant to Section 64h (3) KWG. While such
goodwill components are not included in the regulatory capital and capital adequacy ratios shown above, the
Group makes use of this transition rule in its capital adequacy reporting to the German regulatory authorities.
As of December 31, 2009, the transitional item amounted to € 462 million. In the Group’s reporting to the German
regulatory authorities, the Tier 1 capital, total regulatory capital and the risk-weighted assets shown above were
increased by this amount. Correspondingly, the Group’s Tier 1 and total capital ratios reported to the German
regulatory authorities including this item were 12.7 % and 14.0 %, respectively, on December 31, 2009. As of
December 31, 2008, the ratios amounted to 10.4 % and 12.4 %, respectively.
Coverage of minimum capital requirements Dec 31, 2009 Dec 31, 2008
in € m.
Regulatory capital
requirements
Available regulatory
capital
Regulatory capital
requirements
Available regulatory
capital
Counterparty credit risk and operational risk 19,887 37,929 22,739 37,396
Market risk 1,991 18,041 1,880 14,657
Pillar 3 Report 3. Capital Adequacy
12
Regulatory capital ratios for the Group’s significant subsidiaries, defined as those entities whose relative individual
contribution to the Group’s risk-weighted assets exceeds 5 % of the Group’s overall RWA, are not disclosed as
they meet the conditions of and have applied the exemptions codified in Section 2a KWG. As a result, they are
exempted from the obligation to comply with certain regulatory requirements of the Banking Act on a standalone
basis, including solvency calculations and reporting of regulatory capital ratios. The Group’s only significant
entities, Deutsche Bank AG and Deutsche Bank Privat- und Geschäftskunden AG, as well as three other entities,
namely Berliner Bank AG & Co. KG, norisbank GmbH and DWS Finanz-Service GmbH do not calculate and report
capital ratios due to the application of this exemption. These exemptions can only be applied if there is no material
practical or legal impediment to the prompt transfer of own funds or repayment of liabilities from Deutsche Bank
AG to the respective subsidiaries or from all subsidiaries in the Group to Deutsche Bank AG.
Failure to meet minimum capital requirements can result in orders to suspend or reduce dividend payments or
other profit distributions on regulatory capital and discretionary actions by the BaFin that, if undertaken, could
have a direct material effect on the Group’s businesses. The Group complied with the regulatory capital adequacy
requirements in 2009. The Group’s subsidiaries which are not included in the regulatory consolidation did not
report any capital deficiencies in 2009.
3.4 Internal Capital Adequacy Assessment Process (ICAAP)
The Group not only reviews its regulatory capital ratios in line with the set targets, but it also assesses and
continuously monitors its risk bearing capacity. The Group’s primary internal measure to assess the impact of very
severe unexpected losses across the different risk types is economic capital, which is also planned as part of
the risk and capital strategy as described further below. Economic capital is also a key component to allocate the
Group’s book equity to the business divisions. For further details on the Group’s economic capital please refer to
chapter 4.5 “Economic Capital Requirements”.
The primary measure to assess the Group’s risk bearing capacity is a ratio of the Group’s active book equity
divided by the economic capital plus goodwill and intangibles. A ratio of more than 100 % signifies that the active
book equity adequately covers the aforementioned risk positions. This ratio has been continuously above 100 %
during 2009 and stood at an annual high of 118 % as of December 31, 2009, reflective of a growth in active book
equity over the course of the year.
Pillar 3 Report 4. Risk and Capital Management of the Group
13
4.1 Risk and Capital Management Principles and Organization
Market Development
Confidence and liquidity in financial markets improved during much of 2009, underpinned by continued govern-
ment and central bank support measures. Equity markets recovered sharply, volatility subsided, and corporate
credit and interbank spreads approached, and in some cases returned to, pre-crisis levels. Issuance volumes in
corporate bond markets were very strong as investor risk appetite improved. However, securitization markets saw
only a more modest recovery, despite extensive liquidity support and outright purchases of assets by governmen-
tal institutions. Issuance volumes have remained low, and prices depressed, indicating that confidence in securiti-
zation has not yet been restored.
Conditions in the wider economy remained challenging. Most developed economies returned to positive growth in
the second half of 2009, but the pace of recovery remained relatively subdued and reliant on public sector stimu-
lus measures. Economic headwinds persisted with unemployment increasing, weighing on household credit
quality, and corporate defaults rising further. Residential real estate prices continued to fall in many developed
markets, but the German market remained stable. Towards the end of the year, large fiscal deficits and sharply
rising public debt, mainly a reflection of the deep economic recession and the cost of financial sector support
measures, led to growing concerns in financial markets over sovereign risk.
Risk and Capital Management
The wide variety of the Group’s businesses requires it to identify, measure, aggregate and manage its risks
effectively, and to allocate capital among the businesses appropriately. The Group manages risk and capital
through a framework of principles, organizational structures, as well as measurement and monitoring processes
that are closely aligned with the activities of the Group’s divisions. The importance of a strong focus on risk
management and the continuous need to refine risk management practice has become particularly evident during
the financial market crisis. While the Group’s risk and capital management continuously evolves and improves,
there can be no assurance that all market developments, in particular those of extreme nature, can be fully
anticipated at all times.
Risk and Capital Management Principles
The following key principles underpin the Group’s approach to risk and capital management:
— The Group’s Management Board provides overall risk and capital management supervision for its consolidated
Group. The Group’s Supervisory Board regularly monitors its risk and capital profile.
— The Group manages credit, market, operational, liquidity, business, legal and reputational risks as well as its
capital in a coordinated manner at all relevant levels within the Group’s organization. This also holds true for
complex products which the Group typically manages within its framework established for trading exposures.
— The structure of the Group’s integrated legal, risk & capital function is closely aligned with the structure of its
group divisions.
— The legal, risk & capital function is independent of the Group’s divisions.
4. Risk and Capital Management of the Group

Pillar 3 Report 4. Risk and Capital Management of the Group
14
Risk and Capital Management Organization
The Group’s Chief Risk Officer, who is a member of the Management Board, is responsible for the Group-wide
credit, market, operational, liquidity, business, legal and reputational risk management as well as capital man-
agement activities and heads the Group’s integrated legal, risk & capital function.
Two functional committees, which are both chaired by the Group’s Chief Risk Officer, are central to the legal,
risk & capital function.
— The Group’s Risk Executive Committee is responsible for management and control of the aforementioned risks
across the consolidated Group. To fulfill this mandate, the Risk Executive Committee is supported by sub-
committees that are responsible for dedicated areas of risk management, including several policy committees
and the Group Reputational Risk Committee.
— The responsibilities of the Capital and Risk Committee include risk profile and capital planning, capital capacity
monitoring and optimization of funding.
Dedicated legal, risk & capital units are established with the mandate to:
— Ensure that the business conducted within each division is consistent with the risk appetite that the Capital
and Risk Committee has set within a framework established by the Management Board;
— Formulate and implement risk and capital management policies, procedures and methodologies that are
appropriate to the businesses within each division;
— Approve credit, market and liquidity risk limits;
— Conduct periodic portfolio reviews to ensure that the portfolio of risks is within acceptable parameters; and
— Develop and implement risk and capital management infrastructures and systems that are appropriate for
each division.
The heads of the Group’s legal, risk & capital units, which are amongst the members of the Group’s Risk Execu-
tive Committee, are responsible for the performance of the units and report directly to the Group’s Chief Risk
Officer.
The Group’s finance and audit departments support the legal, risk & capital function. They operate independently
of both the group divisions and of the legal, risk & capital function. The role of the finance department is to help
quantify and verify the risk that the Group assumes and ensure the quality and integrity of risk-related data. The
Group’s audit department performs risk-oriented reviews of the design and operating effectiveness of its internal
control procedures.

Pillar 3 Report 4. Risk and Capital Management of the Group
15
Risk and Capital Strategy
The legal, risk & capital function annually develops its risk and capital strategy in an integrated process together
with the group divisions and Finance, ensuring Group-wide alignment of risk and performance targets. The
strategy is ultimately presented to, and approved by, the Management Board. Subsequently, this plan is also
presented to, and discussed with, the Risk Committee of the Supervisory Board.
Targets and projections are set for various parameters and different levels of the Group. Performance against
these targets is monitored regularly and a report on selected important and high-level targets is brought to the
direct attention of the Chief Risk Officer and/or the Management Board. In case of a significant deviation from
the targets, it is the responsibility of the divisional legal, risk & capital units to bring this to the attention
of their superiors and ultimately the Chief Risk Officer if no mitigation or mitigation strategy can be achieved on a
subordinated level.
Amendments to the risk and capital strategy must be approved by the Chief Risk Officer or the full Management
Board, depending on significance.
4.2 Categories, Quantification and Reporting of Risk
The most important risks the Group assumes are specific banking risks and reputational risks, as well as risks
arising from the general business environment.
Specific Banking Risks
The Group’s risk management processes distinguish among four kinds of specific banking risks: credit risk,
market risk, operational risk and liquidity risk.
— Credit risk arises from all transactions that give rise to actual, contingent or potential claims against any
counterparty, borrower or obligor (which the Group refers to collectively as “counterparties”). The Group distin-
guishes between three kinds of credit risk:
— Default risk is the risk that counterparties fail to meet contractual payment obligations.
— Country risk is the risk that the Group may suffer a loss, in any given country, due to any of the following
reasons: a possible deterioration of economic conditions, political and social upheaval, nationalization and
expropriation of assets, government repudiation of indebtedness, exchange controls and disruptive cur-
rency depreciation or devaluation. Country risk includes transfer risk which arises when debtors are unable
to meet their obligations owing to an inability to transfer assets to nonresidents due to direct sovereign in-
tervention.
— Settlement risk is the risk that the settlement or clearance of transactions will fail. It arises whenever the
exchange of cash, securities and/or other assets is not simultaneous.
Pillar 3 Report 4. Risk and Capital Management of the Group
16
— Market risk arises from the uncertainty concerning changes in market prices and rates (including interest rates,
equity prices, foreign exchange rates and commodity prices), the correlations among them and their levels of
volatility.
— Operational risk is the potential for incurring losses in relation to employees, contractual specifications and
documentation, technology, infrastructure failure and disasters, external influences and customer relation-
ships. This definition includes legal and regulatory risk, but excludes business and reputational risk.
— Liquidity risk is the risk arising from the Group’s potential inability to meet all payment obligations when they
come due or only being able to meet these obligations at excessive costs.
Reputational Risk
Within the Group’s risk management processes, the Group defines reputational risk as the risk that publicity
concerning a transaction, counterparty or business practice involving a client will negatively impact the public’s
trust in the Group’s organization.
Several policies and guidelines form the framework of the Group’s reputational risk management. The primary
responsibility for the identification, escalation and resolution of reputational risk issues resides with the business
divisions. The risk management units assist and advise the business divisions in ascertaining that reputational risk
issues are appropriately identified, escalated and addressed.
The most senior dedicated body for reputational risk issues is the Group Reputational Risk Committee (GRRC).
It is a permanent sub-committee of the Risk Executive Committee and is chaired by the Chief Risk Officer. The
GRRC reviews and makes final determinations on all reputational risk issues, where escalation of such issues is
deemed necessary by senior business and regional management, or required under other Group policies and
procedures.
Business Risk
Business risk describes the risk the Group assumes due to potential changes in general business conditions, such
as the Group’s market environment, client behavior and technological progress. This can affect the Group’s
results if the Group fails to adjust quickly to these changing conditions.

Pillar 3 Report 4. Risk and Capital Management of the Group
17
Insurance Specific Risk
The Group’s exposure to insurance risk increased upon the 2007 acquisition of Abbey Life Assurance Company
Limited and the 2006 acquisition of a stake in Paternoster Limited, a regulated insurance company. The Group is
primarily exposed to the following insurance-related risks.
— Mortality and morbidity risks – the risks of a higher or lower than expected number of death claims on assur-
ance products and of an occurrence of one or more large claims, and the risk of a higher or lower than ex-
pected number of disability claims, respectively. The Group aims to mitigate these risks by the use of
reinsurance and the application of discretionary charges. The Group investigates rates of mortality and mor-
bidity annually.
— Longevity risk – is the risk of faster or slower than expected improvements in life expectancy on immediate
and deferred annuity products. The Group monitors this risk against the latest external industry data and
emerging trends.
— Expenses risk – is the risk that policies cost more or less to administer than expected. The Group monitors
these expenses by an analysis of the actual expenses relative to the budget. The Group investigates reasons
for any significant divergence from expectations and takes remedial action. The Group reduces the expense
risk by having in place (until 2010 with the option of renewal for two more years) an outsourcing agreement
which covers the administration of the policies.
— Persistency risk – is the risk of a higher or lower than expected percentage of lapsed policies. The Group
assesses the persistency rates annually by reference to appropriate risk factors.
The Group monitors the actual claims and persistency against the assumptions used and refines the assumptions
for the future assessment of liabilities. Actual experience may vary from estimates, the more so as projections are
made further into the future. Liabilities are evaluated at least annually.
To the extent that actual experience is less favorable than the underlying assumptions, or it is necessary to
increase provisions due to more onerous assumptions, the amount of capital required in the insurance entities
may increase.
The profitability of the Group’s non unit-linked long-term insurance businesses depends to a significant extent on
the value of claims paid in the future relative to the assets accumulated to the date of claim. Typically, over the
lifetime of a contract, premiums and investment returns exceed claim costs in the early years and it is necessary
to set aside these amounts to meet future obligations. The amount of such future obligations is assessed on
actuarial principles by reference to assumptions about the development of financial and insurance risks.
Pillar 3 Report 4. Risk and Capital Management of the Group
18
For unit-linked investment contracts, profitability is based on the charges taken being sufficient to meet expenses
and profit. The premium and charges are assessed based on actuarial principles by reference to assumptions
about the development of financial and insurance risks.
As stated above, reinsurance is used as a mechanism to reduce risk. The strategy is to continue to utilize reinsur-
ance as appropriate.
Risk Management Tools
The Group uses a comprehensive range of quantitative tools and metrics for monitoring and managing risks. As a
matter of policy, the Group continually assesses the appropriateness and the reliability of its quantitative tools
and metrics in light of the Group’s changing risk environment. Some of these tools are common to a number of
risk categories, while others are tailored to the particular features of specific risk categories. The following are
the most important quantitative tools and metrics the Group currently uses to measure, manage and report the
Group’s risk:
— Economic capital. Economic capital measures the amount of capital the Group needs to absorb very severe
unexpected losses arising from the Group’s exposures. “Very severe” in this context means that economic
capital is set at a level to cover with a probability of 99.98 % the aggregated unexpected losses within one
year. The Group calculates economic capital for the default risk, transfer risk and settlement risk elements of
credit risk, for market risk, for operational risk and for general business risk. The Group continuously reviews
and enhances its economic capital model as appropriate. Notably during the course of 2009 the economic
capital stress tests for market risk were recalibrated to reflect the extreme market moves observed in the later
part of 2008. This included extension of the assumed holding periods on credit positions, and significant
increases to the shocks applied to equity indices and credit spreads, especially for securitized products. In
addition to the recalibration, there were improvements to the economic capital model. These included the addi-
tion of stress tests for leveraged exchange traded funds and for gap risk in non-recourse finance in emerging
markets. Within the economic capital framework the Group captures the effects of rating migration as well as
profits and losses due to fair value accounting. The Group uses economic capital to show an aggregated view
of its risk position from individual business lines up to consolidated Group level. The Group also uses econom-
ic capital (as well as goodwill and unamortized other intangible assets) in order to allocate book capital among
the businesses. This enables the Group to assess each business unit’s risk-adjusted profitability, which is a
key metric in managing financial resources. In addition, the Group considers economic capital, in particular for
credit risk, when the Group measures the risk-adjusted profitability of its client relationships.
Pillar 3 Report 4. Risk and Capital Management of the Group
19
— Expected loss. The Group uses expected loss as a measure of the credit and operational risk. Expected loss
is a measurement of the loss the Group can expect within a one-year period from these risks as of the respec-
tive reporting date, based on historical loss experience. When calculating expected loss for credit risk, the
Group takes into account credit risk ratings, collateral, maturities and statistical averaging procedures to reflect
the risk characteristics of different types of exposures and facilities. All parameter assumptions are based on
statistical averages of up to seven years based on the Group’s internal default and loss history as well as
external benchmarks. The Group uses expected loss as a tool of the risk management process and as part of
the Group’s management reporting systems. The Group also considers the applicable results of the expected
loss calculations as a component of its collectively assessed allowance for credit losses included in the finan-
cial statements. For operational risk the Group determines the expected loss from statistical averages of inter-
nal loss history, recent risk trends as well as forward looking expert estimates.
— Value-at-risk. The Group uses the value-at-risk approach to derive quantitative measures for trading book
market risks under normal market conditions. The Group’s value-at-risk figures play a role in both internal and
external (regulatory) reporting. For a given portfolio, value-at-risk measures the potential future loss (in terms
of market value) that, under normal market conditions, will not be exceeded with a defined confidence level in
a defined period. The value-at-risk for a total portfolio represents a measure of diversified market risk (aggre-
gated using pre-determined correlations) in that portfolio.
— Stress testing. The Group supplements the analysis of credit, market, operational and liquidity risk with stress
testing. For credit risk management purposes, the Group performs stress tests to assess the impact of
changes in general economic conditions or specific parameters on credit exposures or parts thereof as well
as the impact on the creditworthiness of the Group’s portfolio. For market risk management purposes, the
Group performs stress tests because value-at-risk calculations are based on relatively recent historical data,
only purport to estimate risk up to a defined confidence level and assume good asset liquidity. Therefore, they
only reflect possible losses under relatively normal market conditions. Stress tests helps the Group to deter-
mine the effects of potentially extreme market developments on the value of market risk sensitive exposures,
both on highly liquid and less liquid trading positions as well as investments. The correlations between market
risk factors used in the Group’s current stress tests are estimated from volatile market conditions in the past
using an algorithm, and the estimated correlations proved to be essentially consistent with those observed
during recent periods of market stress. The Group uses stress testing to determine the amount of economic
capital the Group needs to allocate in order to cover market risk exposure under the scenarios of extreme
market conditions the Group selects for simulations. For operational risk management purposes, the Group
performs stress tests on its economic capital model to assess its sensitivity to changes in key model compo-
nents, which include external losses. For liquidity risk management purposes, the Group performs stress tests
and scenario analysis to evaluate the impact of sudden stress events on the Group’s liquidity position. In 2009,
the Group has stepped up its efforts to further align the Group’s stress testing framework across the different
risk types.
Pillar 3 Report 4. Risk and Capital Management of the Group
20
— Regulatory risk assessment. The Group’s operations throughout the world are regulated and supervised by
relevant authorities in each of the jurisdictions in which it conducts business. Such regulation covers licensing,
capital adequacy, liquidity, risk concentration, conduct of business and organizational and reporting require-
ments. Primarily, the Group is subject to comprehensive regulation and supervision by the BaFin and
the Deutsche Bundesbank (referred to as “Bundesbank”), the German central bank. The BaFin supervises the
operations of German banks to ensure that they are in compliance with the Banking Act and other applicable
laws and regulations. The Bundesbank supports the BaFin and closely cooperates with it. The Banking Act
and the rules and regulations thereunder implement certain recommendations of the Basel Committee on
Banking Supervision, as well as certain European Union directives relating to banks. It addresses issues such
as regulatory capital, risk-based capital adequacy and consolidated supervision.
Risk Reporting and Measurement Systems
The Group has centralized risk data warehouses and systems supporting regulatory reporting and external
disclosures, as well as internal management reporting for credit, market, operational and liquidity risk. The
Group’s risk infrastructure incorporates the relevant legal entities and business divisions and provides the basis
for tailor-made reporting on risk positions, capital adequacy and limit utilization to the relevant functions on a
regular and ad-hoc basis. Established units within Finance and Legal, Risk & Capital assume responsibility for
measurement, analysis and reporting of risk while ensuring sufficient quality and integrity of risk-related data.
4.3 Capital Management
The Group’s Treasury function manages the Group’s capital at group level and locally in each region. The alloca-
tion of financial resources, in general, and capital, in particular, favors business portfolios with the highest positive
impact on the Group’s profitability and shareholder value. As a result, Treasury periodically reallocates capital
among business portfolios.
Treasury implements the Group’s capital strategy, which itself is developed by the Capital and Risk Committee
and approved by the Management Board, including the issuance and repurchase of shares. The Group is com-
mitted to maintain its sound capitalization. Overall capital demand and supply are constantly monitored and
adjusted, if necessary, to meet the need for capital from various perspectives. These include book equity based
on IFRS accounting standards, regulatory capital and economic capital. Since October 2008, the Group’s target
for the Tier 1 capital ratio continued to be at 10 % or above.

Pillar 3 Report 4. Risk and Capital Management of the Group
21
The allocation of capital, determination of the Group’s funding plan and other resource issues are presented to
and approved by the Capital and Risk Committee.
The Group conducts an annual planning process to determine the Group’s future strategic direction, decide on key
initiatives and allocate resources to the businesses. The Group’s plan comprises profit and loss, capital supply
and capital demand, other resources, such as headcount, and business-specific key performance indicators. This
process is performed at the business division level comprising the next five years, with the first of the five years
detailed by quarter (operative plan). Based upon a range of economic scenarios, the business areas discuss their
strategic development with the required risk management functions in order to align their revenue potential with
the Group’s risk appetite/ resources. Group Strategy & Planning and Finance coordinate the strategic planning
process and present the resulting strategic plan to the Group Executive Committee for discussion and final
approval. The final plan is also presented to the Supervisory Board at the beginning of each year.
The approved planned risk-weighted assets and capital deduction items form the basis for quarterly capital
demand limits by business area. The risk and performance plans feed into Treasury’s capital and liquidity plan-
ning. Depending on the development of risk-weighted assets and capital deduction items, Treasury regularly
updates contingency measures in light of the Group’s Tier 1 ratio target.
Regional capital plans covering the capital needs of the Group’s branches and subsidiaries are prepared on a
semi-annual basis and presented to the Group Investment Committee. Most of the Group’s subsidiaries are
subject to legal and regulatory capital requirements. Local Asset and Liability Committees attend to those needs
under the stewardship of regional Treasury teams. Furthermore, they safeguard compliance with requirements
such as restrictions on dividends allowable for remittance to Deutsche Bank AG or on the ability of the Group’s
subsidiaries to make loans or advances to the parent bank. In developing, implementing and testing the Group’s
capital and liquidity, the Group takes such legal and regulatory requirements into account.
The 2008 Annual General Meeting granted to the Group’s management the authority to buy back up to 53.1 million
shares before October 31, 2009. No shares had been repurchased under this authorization until the Annual
General Meeting in May 2009 when a new authorization was granted.
The 2009 Annual General Meeting granted the Group’s management the authority to buy back up to 62.1 million
shares before the end of October 2010. During the period from the Annual General Meeting in May 2009 until
year-end 2009, 11.7 million shares (or 1.9 % of shares issued) were purchased, which were used for equity com-
pensation purposes. The purchases were executed in July and August 2009.
In March 2009, the Group issued 50 million new registered shares to Deutsche Post AG. In turn, Deutsche
Post AG contributed-in-kind a minority stake in Deutsche Postbank AG to Deutsche Bank AG.
Pillar 3 Report 4. Risk and Capital Management of the Group
22
The Group issued € 1.3 billion of hybrid Tier 1 capital for the year ended December 31, 2009. Total outstand-
ing hybrid Tier 1 capital (all noncumulative trust preferred securities) as of December 31, 2009, amounted to
€ 10.6 billion compared to € 9.6 billion as of December 31, 2008.
4.4 Balance Sheet Management
The Group manages its balance sheet on a Group level and, where applicable, locally in each region. In the
allocation of financial resources the Group favors business portfolios with the highest positive impact on its
profitability and shareholder value. During 2009, the Group strengthened balance sheet oversight by the introduc-
tion of a new function within Finance with the mandate to monitor and analyze balance sheet developments and
to track certain market observed balance sheet ratios. Based on this the Group triggers discussion and manage-
ment action by the Capital and Risk Committee. While the Group monitors IFRS balance sheet developments, the
balance sheet management is principally focused on US GAAP pro-forma values as used in the Group’s leverage
ratio target definition. In 2009, the Group reduced its leverage ratio, according to its target definition, from 28 as
of December 31, 2008 to 23 as of December 31, 2009, well below the Group’s leverage ratio target of 25. This
improvement in the Group’s leverage ratio, according to its target definition, principally reflects lower US GAAP
pro-forma assets, as well as higher adjusted equity. The leverage ratio according to the Group’s target definition is
calculated using adjusted total assets and total equity figures. The Group’s leverage ratio, calculated as the ratio
of total assets under IFRS to total equity under IFRS, was 40 at the end of 2009 compared to 69 at the end
of 2008.
4.5 Economic Capital Requirements
The Group uses economic capital to show an aggregated management view of the risk position from individual
business lines up to the consolidated Group level. The Group also uses economic capital (as well as goodwill and
other nonamortizing intangibles) in order to allocate the Group’s active book equity among its businesses. This
enables the Group to assess each business unit’s risk-adjusted profitability, which is a key metric in managing the
financial resources in order to optimize the value generated for the Group’s shareholders. Active book equity is
defined as shareholders’ equity adjusted by unrealized net gains on assets available for sale, fair value adjust-
ments on cash flow hedges (both components net of applicable taxes) and dividends, for which a proposal is
accrued on a quarterly basis and for which payments occur once a year following the approval by the Annual
General Meeting. In addition, the Group considers economic capital, in particular for credit risk, when measuring
the risk-adjusted profitability of the Group’s client relationships.
Pillar 3 Report 4. Risk and Capital Management of the Group
23
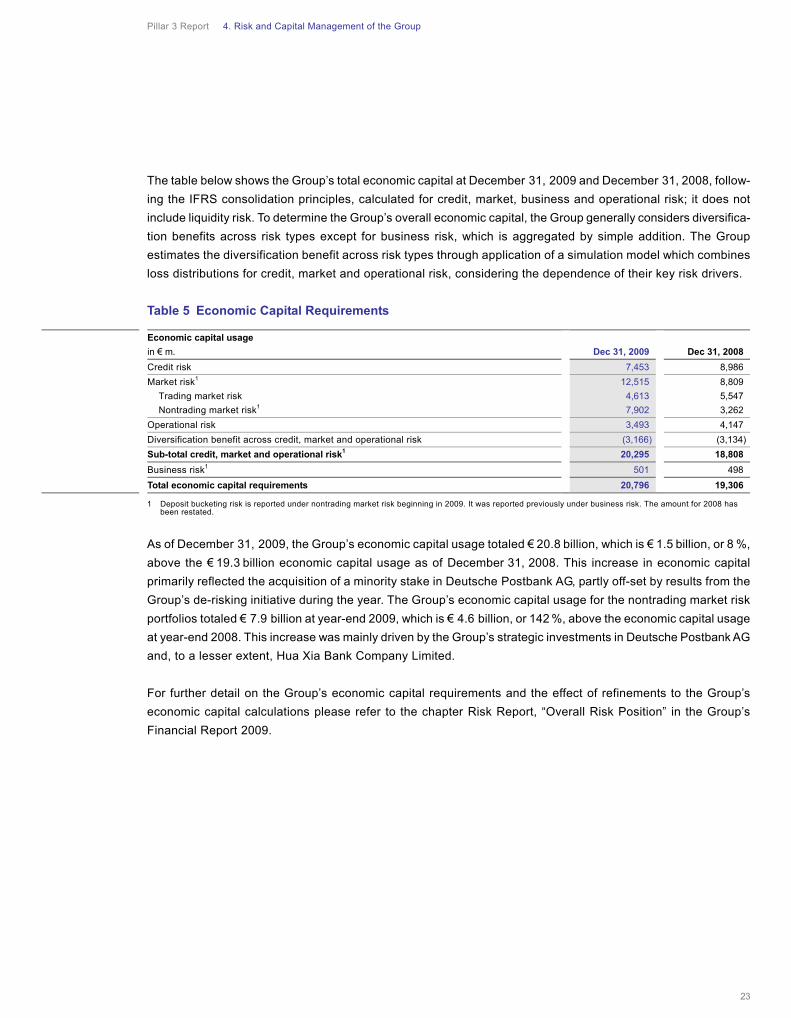
The table below shows the Group’s total economic capital at December 31, 2009 and December 31, 2008, follow-
ing the IFRS consolidation principles, calculated for credit, market, business and operational risk; it does not
include liquidity risk. To determine the Group’s overall economic capital, the Group generally considers diversifica-
tion benefits across risk types except for business risk, which is aggregated by simple addition. The Group
estimates the diversification benefit across risk types through application of a simulation model which combines
loss distributions for credit, market and operational risk, considering the dependence of their key risk drivers.
Table 5 Economic Capital Requirements
1 Deposit bucketing risk is reported under nontrading market risk beginning in 2009. It was reported previously under business risk. The amount for 2008 has been restated.
As of December 31, 2009, the Group’s economic capital usage totaled € 20.8 billion, which is € 1.5 billion, or 8 %,
above the € 19.3 billion economic capital usage as of December 31, 2008. This increase in economic capital
primarily reflected the acquisition of a minority stake in Deutsche Postbank AG, partly off-set by results from the
Group’s de-risking initiative during the year. The Group’s economic capital usage for the nontrading market risk
portfolios totaled € 7.9 billion at year-end 2009, which is € 4.6 billion, or 142 %, above the economic capital usage
at year-end 2008. This increase was mainly driven by the Group’s strategic investments in Deutsche Postbank AG
and, to a lesser extent, Hua Xia Bank Company Limited.
For further detail on the Group’s economic capital requirements and the effect of refinements to the Group’s
economic capital calculations please refer to the chapter Risk Report, “Overall Risk Position” in the Group’s
Financial Report 2009.
Economic capital usage
in € m. Dec 31, 2009 Dec 31, 2008
Credit risk 7,453 8,986
Market risk1 12,515 8,809
Trading market risk 4,613 5,547
Nontrading market risk1 7,902 3,262
Operational risk 3,493 4,147
Diversification benefit across credit, market and operational risk (3,166) (3,134)
Sub-total credit, market and operational risk1 20,295 18,808
Business risk1 501 498
Total economic capital requirements 20,796 19,306
Pillar 3 Report 5. Counterparty Credit Risk: Strategy and Processes
24
5.1 Credit Risk Management Principles and Strategy
The Group manages credit risk in a coordinated manner at all relevant levels within the organization. The follow-
ing principles underpin the Group’s approach to credit risk management:
— In all group divisions consistent standards are applied in the respective credit decision processes.
— The approval of credit limits for counterparties and the management of the Group’s individual credit exposures
must fit within the Group’s portfolio guidelines and credit strategies.
— Every extension of credit or material change to a credit facility (such as its tenor, collateral structure or major
covenants) to any counterparty requires credit approval at the appropriate authority level.
— The Group assigns credit approval authorities to individuals according to their qualifications, experience and
training, and the Group reviews these periodically.
— The Group measures and consolidates all credit exposures to each obligor on a global consolidated basis
that applies across the consolidated Group. The Group defines an “obligor” as a group of individual borrowers
that are linked to one another by any of a number of criteria the Group has established, including capital
ownership, voting rights, demonstrable control, other indication of group affiliation; or are jointly and severally
liable for all or significant portions of the credit extended by the Group.
A portfolio management function within credit risk management oversees and monitors the divisional portfolios
and defines maximum risk appetite guidelines on specific portfolio levels to ensure a diversified portfolio.
5.2 Credit Risk Ratings and Governance
Credit Risk Ratings
Basic and key element of the credit approval process is a detailed risk assessment of every credit exposure
associated with a counterparty. The Group’s risk assessment procedures consider both the creditworthiness of
the counterparty and the risks related to the specific type of credit facility or exposure. This risk assessment not
only affects the structuring of the transaction and the outcome of the credit decision, but also influences the level
of decision-making authority required to extend or materially change the credit and the monitoring procedures
the Group applies to the ongoing exposure.
The Group has its own in-house assessment methodologies, scorecards and rating scale for evaluating the credit-
worthiness of its counterparties. The Group’s granular 26-grade rating scale, which is calibrated on a probability
of default measure based upon a statistical analysis of historical defaults in the Group’s portfolio, enables the
Group to compare its internal ratings with common market practice and ensures comparability between different
sub-portfolios of the Group. Several default ratings therein enable the Group to incorporate the potential recovery
rate of defaulted exposure.
5. Counterparty Credit Risk: Strategy and Processes
Pillar 3 Report 5. Counterparty Credit Risk: Strategy and Processes
25
The Group generally rates all its credit exposures individually, though certain portfolios of securitized receivables
are rated on a pool level. When the Group assigns its internal risk ratings, the Group compares them with external
risk ratings assigned to the Group’s counterparties by the major international rating agencies, where possible.
Governance
All rating methodologies have to be approved by the Group Credit Policy Committee (“GCPC”), a sub-committee
of the Risk Executive Committee, before the methodologies are used for credit decisions and capital calculation
for the first time or before they are significantly changed. Regulatory approval might be required in addition. The
results of the regular validation processes as stipulated by internal policies have to be brought to the attention of
the GCPC, even if the validation results do not lead to a change.
5.3 Credit Risk Mitigation
Various risk mitigation techniques are proactively employed in order to reduce the risk in the Group’s credit
portfolio.
Risk mitigants are predominantly considered in three broad categories:
— Risk transfers, which shift the probability of default risk of an obligor to a third party,
— Collateral, which improves the recovery of obligations and
— Netting, which reduces the credit risk exposure from derivatives and repo- and repo-style transactions.
Risk transfers to third parties form a key part of the Group’s overall risk management process and are executed
in various forms, including outright sales, single name and portfolio hedging, and securitizations. They are con-
ducted by the respective business units and by the Group’s Loan Exposure Management Group (“LEMG”), in
accordance with specifically approved mandates.
LEMG focuses on managing the credit risk of loans and lending-related commitments of the international invest-
ment-grade portfolio and the medium-sized German companies’ portfolio within the Group’s Corporate and
Investment Bank Group Division.
LEMG is concentrating on two primary initiatives within the credit risk framework to further enhance risk manage-
ment discipline, improve returns and use capital more efficiently:
— to reduce single-name and industry credit risk concentrations within the credit portfolio and
— to manage credit exposures actively by utilizing techniques including loan sales, securitization via collatera-
lized loan obligations, default insurance coverage and single-name and portfolio credit default swaps.

Pillar 3 Report 5. Counterparty Credit Risk: Strategy and Processes
26
Collateral is used in various forms in order to mitigate the inherent risk in DB’s credit portfolio by reducing the loss
severity of individual transactions.
The Group aims to secure its credit portfolios via collateral agreements. Divisional risk units review and approve
terms and conditions of related documentation and monitor transactions on an ongoing basis in close interaction
with front and middle office.
All types of collateral are subject to frequent valuation and regular review. The frequency depends on the collater-
al type, associated risks and legal environment.
In addition or as a substitute to risk transfers or use of collateral, various other credit risk mitigation techniques
are employed in order to reduce the risk in the Group’s credit portfolio, in particular for illiquid assets, such as
structural transaction mitigants to improve recoveries in the event of a default.
While all the above mentioned risk mitigants can be an alternative source of repayment, they do not compensate
for high quality underwriting standards.
Concentrations within Credit Risk Mitigation
Concentrations within credit risk mitigations taken may occur if a number of guarantors and credit derivative
providers with similar economic characteristics are engaged in comparable activities with changes in economic or
industry conditions affecting their ability to meet contractual obligations.
The Group uses a comprehensive range of quantitative tools and metrics to monitor its credit risk mitigating
activities. Limits are established across all product categories including guarantees and credit derivative expo-
sures used as risk mitigation. Limits exist at an individual guarantor or credit derivative provider level as part of
the general credit risk management process and are also monitored on a portfolio basis with regard to industries,
countries and other factors.
Guarantees and credit derivative contracts are primarily entered into with banks and insurance companies (includ-
ing exposures to monoline insurers which are discussed in more detail in the chapter Management Report,
“Exposure to Monoline Insurers” in the Group’s Financial Report 2009), principally in Western Europe and the
United States. The majority of these exposures carry a rating within the investment grade band.

Pillar 3 Report 5. Counterparty Credit Risk: Strategy and Processes
27
For the purpose of mitigating credit risk in its lending portfolios the Group also makes use of financial and other
physical collateral. Reflecting the Group’s security financing activity, a significant portion of collateral taken relates
to fixed income and equity securities. Further collateral is taken in form of cash and deposits as well as real
estate. The real estate collateral principally consists of residential properties in Germany.
5.4 Credit Risk Limit Setting and Monitoring
Credit Limits
Credit limits set forth the maximum credit exposures the Group is willing to assume over specified periods. They
relate to products, conditions of the exposure and other factors. Credit limits are established by the Credit Risk
Management function via the execution of assigned credit authorities. Credit authority reflects the mandate to
approve new credit limits as well as increases or the extension of existing credit limits. Credit authority is generally
assigned to individuals as personal credit authority according to the individual’s professional qualification and
experience.
Where an individual’s personal authority is insufficient to establish required credit limits, the transaction is referred
to a higher credit authority holder or where necessary to an appropriate credit committee such as the CRM
Underwriting Committee. Where personal and committee authorities are insufficient to establish appropriate limits
the case is referred to the Management Board for approval.
All assigned credit authorities are reviewed on a periodic basis to ensure that they are adequate. The results of
the review are presented to the Group Credit Policy Committee and reported to the Risk Executive Committee.
Segregation of Credit Exposures
Counterparty credit exposure arises from the Group’s traditional nontrading lending activities which includes
elements such as loans and contingent liabilities. Counterparty credit exposure also arises via the Group’s direct
trading activity with clients in certain instruments which include OTC derivatives, FX forwards and Forward
Rate Agreements.
A default risk also arises from the Group’s positions in traded credit products such as bonds. This risk is managed
using both credit & market risk parameters.
Monitoring Default Risk
Ongoing active monitoring and management of the Group’s credit risk positions is an integral part of credit risk
management. Monitoring tasks are primarily performed by the divisional risk units in close cooperation with the
Group’s portfolio management function. The Group monitors all of its credit exposures on a continuing basis using
the risk management tools described above.

Pillar 3 Report 5. Counterparty Credit Risk: Strategy and Processes
28
Credit counterparties are allocated to credit officers within specified divisional risk units which are aligned to
respective business divisions such as Global Banking, Global Markets or Global Transaction Banking. The indi-
vidual credit officers within these divisional risk units have the most relevant expertise and experience to manage
the credit risks associated with these counterparties and their associated credit related transactions. It is the
responsibility of each credit officer to undertake ongoing credit monitoring for their allocated portfolio of counter-
parties. Monitoring of Credit risk arising from the Group’s trading activities with credit counterparties is undertaken
in accordance with industry best practice by reference to various dedicated measures that quantify the expected
current and future exposure levels, including the exposure levels under adverse market developments. The credit
process for trading instruments requires limits to be established against trading instrument exposures which are
monitored by respective credit officers as part of their ongoing counterparty monitoring activities.
The Group also has procedures in place intended to identify at an early stage credit exposures for which there
may be an increased risk of loss. In instances where the Group has identified counterparties where problems
might arise, the respective exposure is generally placed on a watchlist. The Group aims to identify counterparties
that, on the basis of the application of the Group’s risk management tools, demonstrate the likelihood of problems
well in advance in order to effectively manage the credit exposure and maximize recovery. The objective of this
early warning system is to address potential problems while adequate alternatives for action are still available.
This early risk detection is a tenet of the Group’s credit culture and is intended to ensure that greater attention is
paid to such exposures.
Monitoring Traded Default Risk
Traded credit products such as bonds in the Group’s developed markets’ trading book are managed by a dedicat-
ed risk management unit combining credit and market risk expertise. The Group uses appropriate portfolio limits
and ratings-driven thresholds on single-issuer basis, combined with market risk management tools to risk manage
such positions. Emerging markets traded credit products are risk managed using expertise which resides within
the Group’s respective emerging markets credit risk unit and market risk management.
Economic Capital for Credit Risk
The Group calculates economic capital for default risk, transfer risk and settlement risk as elements of credit risk.
In line with the Group’s economic capital framework, economic capital for credit risk is set at a level to absorb with
a probability of 99.98 % very severe aggregate unexpected losses within one year.
The Group’s economic capital for credit risk is derived from the loss distribution of a portfolio via Monte Carlo
simulation of correlated rating migrations. The loss distribution is modeled in two steps. First, individual credit
exposures are specified based on parameters for the probability of default, exposure at default and loss given
default. In a second step, the probability of joint defaults is modeled through the introduction of economic factors,
which correspond to geographic regions and industries. The simulation of portfolio losses is then performed by
an internally developed model, which takes rating migration and maturity effects into account. The Group allocates
expected losses and economic capital derived from this loss distribution down to transaction level to enable
management on transaction, customer and business level.
Pillar 3 Report 5. Counterparty Credit Risk: Strategy and Processes
29
5.5 Credit Exposure
The Group defines its credit exposure as all transactions where losses might occur due to the fact that counterpar-
ties may not fulfill their contractual payment obligations. The Group calculates the gross amount of the exposure
without taking into account any collateral, other credit enhancement or credit risk mitigating transactions. In the
tables below, the Group shows details about several of its main credit exposure categories, namely loans, irrevoc-
able lending commitments, contingent liabilities, over-the-counter (“OTC”) derivatives, tradable assets and repo
style transactions following the IFRS-principles for consolidation.
— Loans are net loans as reported on the Group’s balance sheet at amortized cost but before deduction of the
Group’s allowance for loan losses.
— Irrevocable lending commitments consist of the undrawn portion of irrevocable lending-related commitments.
— Contingent liabilities consist of financial and performance guarantees, standby letters of credit and indemnity
agreements.
— OTC derivatives are the credit exposures from over-the-counter derivative transactions that the Group has
entered into, after netting and cash collateral received.
— Tradable assets consist of bonds, traded loans and other fixed-income products that are recorded either in
trading assets or securities available for sale for accounting purposes. From a regulatory perspective this cat-
egory principally covers trading book positions.
— Repo- and repo-style transactions consist of repurchase transactions, as well as securities or commodities
lending and borrowing transactions after application of netting as allowed for IFRS accounting purposes.
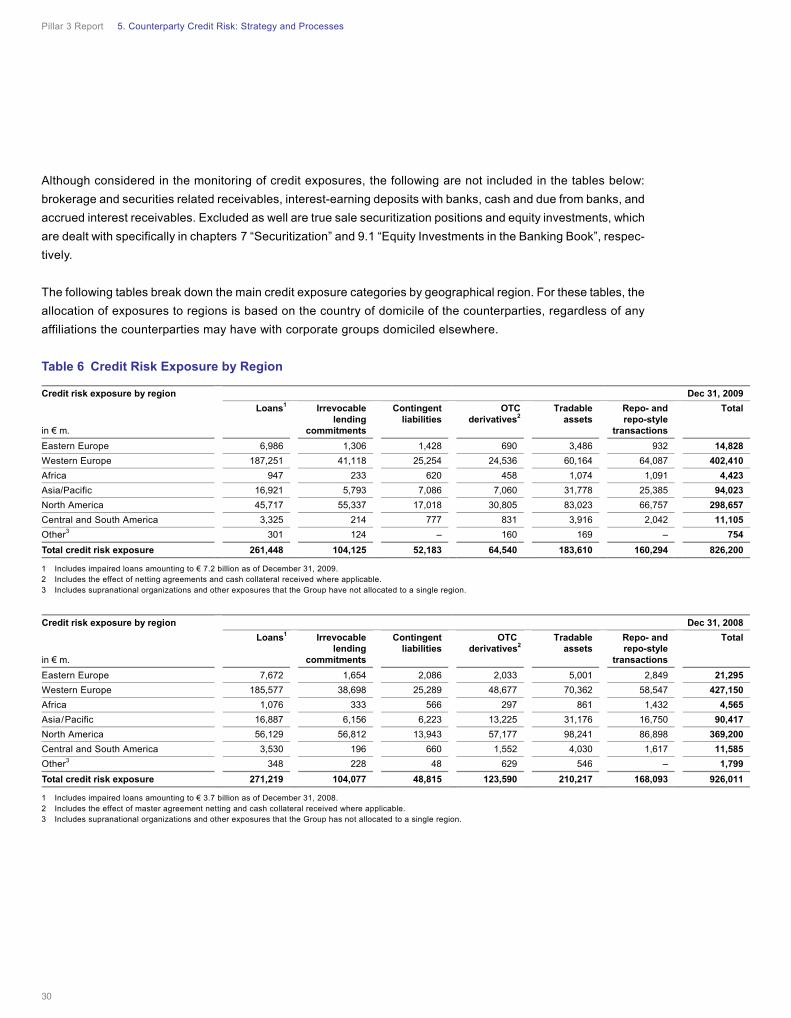
Pillar 3 Report 5. Counterparty Credit Risk: Strategy and Processes
30
Although considered in the monitoring of credit exposures, the following are not included in the tables below:
brokerage and securities related receivables, interest-earning deposits with banks, cash and due from banks, and
accrued interest receivables. Excluded as well are true sale securitization positions and equity investments, which
are dealt with specifically in chapters 7 “Securitization” and 9.1 “Equity Investments in the Banking Book”, respec-
tively.
The following tables break down the main credit exposure categories by geographical region. For these tables, the
allocation of exposures to regions is based on the country of domicile of the counterparties, regardless of any
affiliations the counterparties may have with corporate groups domiciled elsewhere.
Table 6 Credit Risk Exposure by Region
1 Includes impaired loans amounting to € 7.2 billion as of December 31, 2009. 2 Includes the effect of netting agreements and cash collateral received where applicable. 3 Includes supranational organizations and other exposures that the Group have not allocated to a single region.
1 Includes impaired loans amounting to € 3.7 billion as of December 31, 2008. 2 Includes the effect of master agreement netting and cash collateral received where applicable. 3 Includes supranational organizations and other exposures that the Group has not allocated to a single region.
Credit risk exposure by region Dec 31, 2009
in € m.
Loans1 Irrevocable lending
commitments
Contingent liabilities
OTC derivatives2
Tradable assets
Repo- and repo-style
transactions
Total
Eastern Europe 6,986 1,306 1,428 690 3,486 932 14,828
Western Europe 187,251 41,118 25,254 24,536 60,164 64,087 402,410
Africa 947 233 620 458 1,074 1,091 4,423
Asia/Pacific 16,921 5,793 7,086 7,060 31,778 25,385 94,023
North America 45,717 55,337 17,018 30,805 83,023 66,757 298,657
Central and South America 3,325 214 777 831 3,916 2,042 11,105
Other3 301 124 – 160 169 – 754
Total credit risk exposure 261,448 104,125 52,183 64,540 183,610 160,294 826,200
Credit risk exposure by region Dec 31, 2008
in € m.
Loans1 Irrevocable lending
commitments
Contingent liabilities
OTC derivatives2
Tradable assets
Repo- and repo-style
transactions
Total
Eastern Europe 7,672 1,654 2,086 2,033 5,001 2,849 21,295
Western Europe 185,577 38,698 25,289 48,677 70,362 58,547 427,150
Africa 1,076 333 566 297 861 1,432 4,565
Asia/Pacific 16,887 6,156 6,223 13,225 31,176 16,750 90,417
North America 56,129 56,812 13,943 57,177 98,241 86,898 369,200
Central and South America 3,530 196 660 1,552 4,030 1,617 11,585
Other3 348 228 48 629 546 – 1,799
Total credit risk exposure 271,219 104,077 48,815 123,590 210,217 168,093 926,011
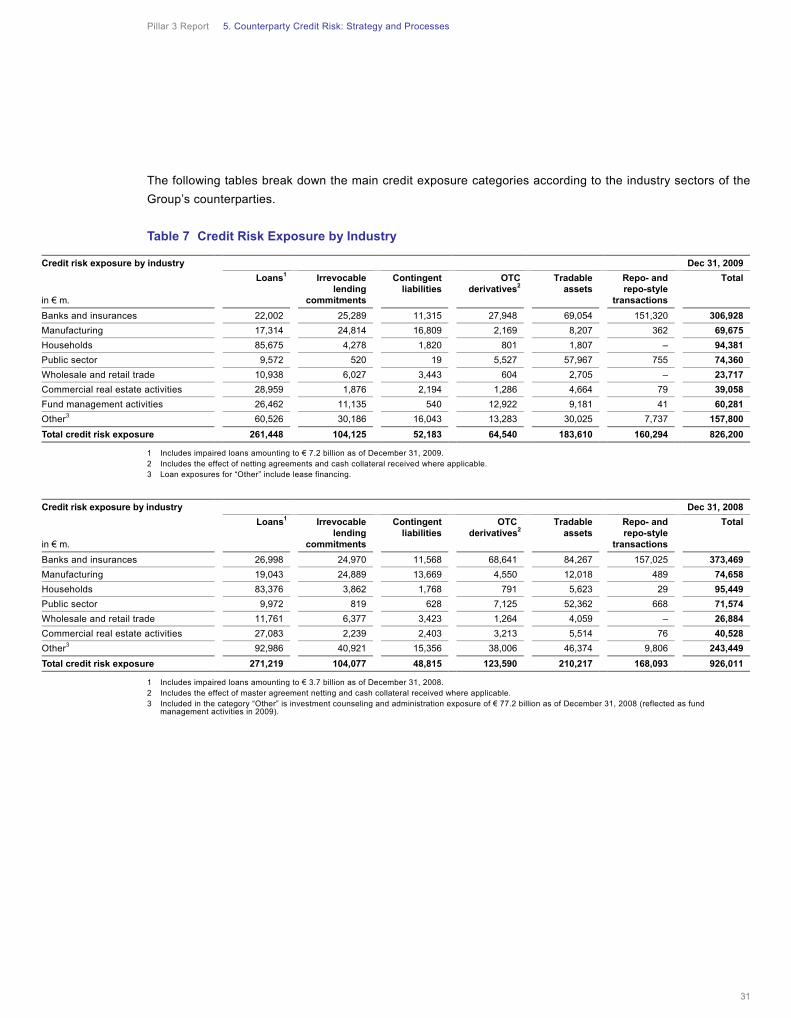
Pillar 3 Report 5. Counterparty Credit Risk: Strategy and Processes
31
The following tables break down the main credit exposure categories according to the industry sectors of the
Group’s counterparties.
Table 7 Credit Risk Exposure by Industry
1 Includes impaired loans amounting to € 7.2 billion as of December 31, 2009. 2 Includes the effect of netting agreements and cash collateral received where applicable. 3 Loan exposures for “Other” include lease financing.
1 Includes impaired loans amounting to € 3.7 billion as of December 31, 2008. 2 Includes the effect of master agreement netting and cash collateral received where applicable. 3 Included in the category “Other” is investment counseling and administration exposure of € 77.2 billion as of December 31, 2008 (reflected as fund
management activities in 2009).
Credit risk exposure by industry Dec 31, 2009
in € m.
Loans1 Irrevocable lending
commitments
Contingent liabilities
OTC derivatives2
Tradable assets
Repo- and repo-style
transactions
Total
Banks and insurances 22,002 25,289 11,315 27,948 69,054 151,320 306,928
Manufacturing 17,314 24,814 16,809 2,169 8,207 362 69,675
Households 85,675 4,278 1,820 801 1,807 – 94,381
Public sector 9,572 520 19 5,527 57,967 755 74,360
Wholesale and retail trade 10,938 6,027 3,443 604 2,705 – 23,717
Commercial real estate activities 28,959 1,876 2,194 1,286 4,664 79 39,058
Fund management activities 26,462 11,135 540 12,922 9,181 41 60,281
Other3 60,526 30,186 16,043 13,283 30,025 7,737 157,800
Total credit risk exposure 261,448 104,125 52,183 64,540 183,610 160,294 826,200
Credit risk exposure by industry Dec 31, 2008
in € m.
Loans1 Irrevocable lending
commitments
Contingent liabilities
OTC derivatives2
Tradable assets
Repo- and repo-style
transactions
Total
Banks and insurances 26,998 24,970 11,568 68,641 84,267 157,025 373,469
Manufacturing 19,043 24,889 13,669 4,550 12,018 489 74,658
Households 83,376 3,862 1,768 791 5,623 29 95,449
Public sector 9,972 819 628 7,125 52,362 668 71,574
Wholesale and retail trade 11,761 6,377 3,423 1,264 4,059 – 26,884
Commercial real estate activities 27,083 2,239 2,403 3,213 5,514 76 40,528
Other3 92,986 40,921 15,356 38,006 46,374 9,806 243,449
Total credit risk exposure 271,219 104,077 48,815 123,590 210,217 168,093 926,011
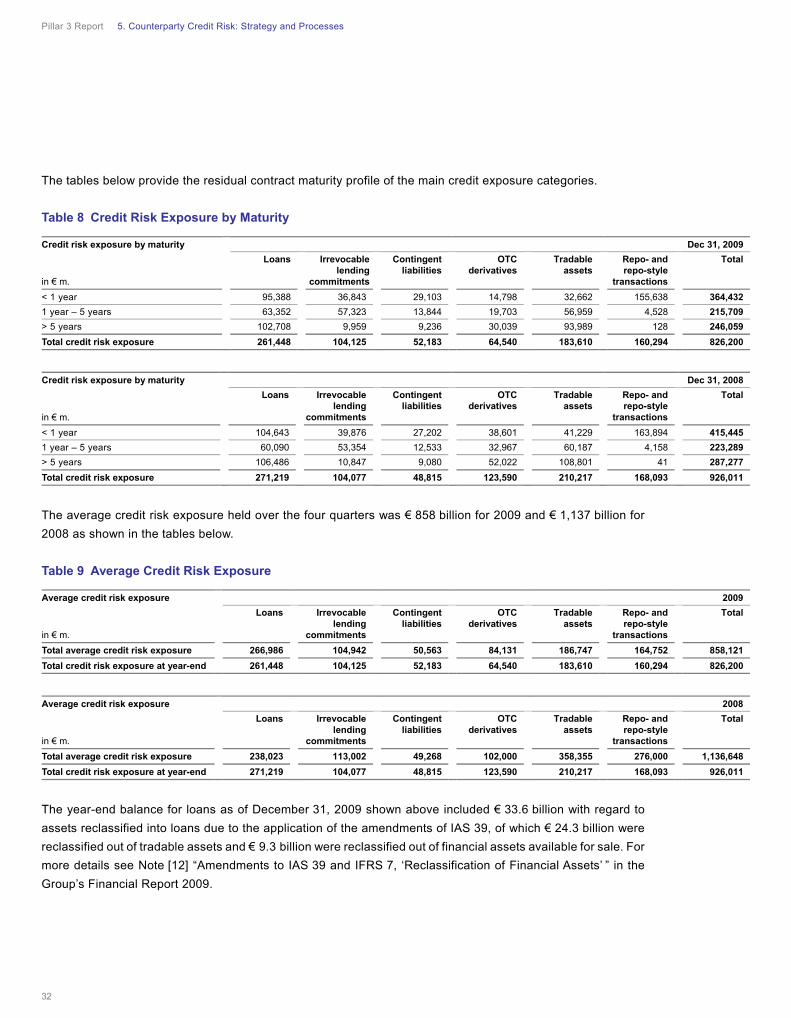
Pillar 3 Report 5. Counterparty Credit Risk: Strategy and Processes
32
The tables below provide the residual contract maturity profile of the main credit exposure categories.
Table 8 Credit Risk Exposure by Maturity
The average credit risk exposure held over the four quarters was € 858 billion for 2009 and € 1,137 billion for
2008 as shown in the tables below.
Table 9 Average Credit Risk Exposure
The year-end balance for loans as of December 31, 2009 shown above included € 33.6 billion with regard to
assets reclassified into loans due to the application of the amendments of IAS 39, of which € 24.3 billion were
reclassified out of tradable assets and € 9.3 billion were reclassified out of financial assets available for sale. For
more details see Note [12] “Amendments to IAS 39 and IFRS 7, ‘Reclassification of Financial Assets’ ” in the
Group’s Financial Report 2009.
Credit risk exposure by maturity Dec 31, 2009
in € m.
Loans Irrevocable lending
commitments
Contingent liabilities
OTC derivatives
Tradable assets
Repo- and repo-style
transactions
Total
< 1 year 95,388 36,843 29,103 14,798 32,662 155,638 364,432
1 year – 5 years 63,352 57,323 13,844 19,703 56,959 4,528 215,709
> 5 years 102,708 9,959 9,236 30,039 93,989 128 246,059
Total credit risk exposure 261,448 104,125 52,183 64,540 183,610 160,294 826,200
Credit risk exposure by maturity Dec 31, 2008
in € m.
Loans Irrevocable lending
commitments
Contingent liabilities
OTC derivatives
Tradable assets
Repo- and repo-style
transactions
Total
< 1 year 104,643 39,876 27,202 38,601 41,229 163,894 415,445
1 year – 5 years 60,090 53,354 12,533 32,967 60,187 4,158 223,289
> 5 years 106,486 10,847 9,080 52,022 108,801 41 287,277
Total credit risk exposure 271,219 104,077 48,815 123,590 210,217 168,093 926,011
Average credit risk exposure 2009
in € m.
Loans Irrevocable lending
commitments
Contingent liabilities
OTC derivatives
Tradable assets
Repo- and repo-style
transactions
Total
Total average credit risk exposure 266,986 104,942 50,563 84,131 186,747 164,752 858,121
Total credit risk exposure at year-end 261,448 104,125 52,183 64,540 183,610 160,294 826,200
Average credit risk exposure 2008
in € m.
Loans Irrevocable lending
commitments
Contingent liabilities
OTC derivatives
Tradable assets
Repo- and repo-style
transactions
Total
Total average credit risk exposure 238,023 113,002 49,268 102,000 358,355 276,000 1,136,648
Total credit risk exposure at year-end 271,219 104,077 48,815 123,590 210,217 168,093 926,011
Pillar 3 Report 5. Counterparty Credit Risk: Strategy and Processes
33
The lower total credit risk exposure as of December 31, 2009 was most visible for OTC derivatives. It reflected
mainly market movements (i.e. interest rate and tightening credit spreads) as well as the Group’s de-leveraging
activities.
The year-end balance for loans as of December 31, 2008 shown above included € 34.4 billion with regard to
assets reclassified into loans due to the application of the amendments of IAS 39, of which € 23.6 billion were
reclassified out of tradable assets and € 10.8 billion were reclassified out of financial assets available for sale. For
more details see Note [12] “Amendments to IAS 39 and IFRS 7, ‘Reclassification of Financial Assets’ ” in the
Group’s Financial Report 2008.
The lower total credit risk exposure at December 31, 2008 reflected the Group’s de-leveraging activities, in
particular with regard to tradable assets and repo- and repo-style transactions.
5.6 Counterparty Credit Risk from Derivatives
Credit Exposure from Derivatives
Exchange-traded derivative transactions (e.g., futures and options) are regularly settled through a central coun-
terparty (e.g., LCH.Clearnet Ltd. or Eurex Clearing AG), the rules and regulations of which provide for daily
margining of all current and future credit risk positions emerging out of such transactions. To the extent possible,
the Group also uses central counterparty clearing services for OTC derivative transactions (“OTC clearing”); the
Group thereby benefits from the credit risk mitigation achieved through the central counterparty’s settlement
system.
In order to reduce the credit risk resulting from OTC derivative transactions, where OTC clearing is not available,
the Group regularly seeks the execution of standard master agreements (such as the International Swaps and
Derivatives Association’s master agreements for derivatives or the German Master Agreement for Financial
Derivative Transactions) with the Group’s clients. A master agreement allows the netting of rights and obligations
arising under derivative transactions that have been entered into under such master agreement upon the counter-
party’s default, resulting in a single net claim owed by or to the counterparty (“close-out netting”). For parts of the
derivatives business (e.g., foreign exchange transactions) the Group also enters into master agreements under
which the Group sets off amounts payable on the same day in the same currency and in respect to transactions
covered by such master agreements (“payment netting”), reducing the Group’s settlement risk.
In its risk measurement and risk assessment processes the Group applies netting only to the extent it has satis-
fied itself of the legal validity and enforceability of the master agreement in all relevant jurisdictions.
Pillar 3 Report 5. Counterparty Credit Risk: Strategy and Processes
34
Also, the Group enters into collateral support annexes (“CSA”) to master agreements in order to further reduce the
Group’s derivatives-related credit risk. These collateral support annexes generally provide risk mitigation through
periodic (usually daily) margining of the covered exposure. The CSA also provides for the right to terminate the
related derivative transactions upon the counterparty’s failure to honor a margin call. As with netting, when the
Group believes the collateral support annex is enforceable, the Group reflects this in its exposure measurement.
As the replacement values of derivatives portfolios fluctuate with movements in market rates and with changes in
the transactions in the portfolios, the Group also estimates the potential future replacement costs of the portfolios
over their lifetimes or, in case of collateralized portfolios, over appropriate unwind periods. The Group measures
the potential future exposure against separate limits. The Group supplements the potential future exposure
analysis with stress tests to estimate the immediate impact of extreme market events on the Group’s exposures
(such as event risk in the Group’s Emerging Markets portfolio).
The potential future exposure measure, which the Group uses, is generally given by a time profile of simulated
positive market values of each counterparty’s derivatives portfolio, for which netting and collateralization are
considered. For limit monitoring the Group employs the 95th quantile of the resulting distribution of market values,
internally referred to as potential future exposure (“PFE”). The average exposure profiles generated by the same
calculation process are used to derive the so-called average expected exposure (“AEE”) measure which the
Group uses to reflect potential future replacement costs within the Group’s credit risk economic capital and
the expected positive exposure (“EPE”) measure driving the Group’s regulatory capital requirements. While AEE
and EPE are generally calculated with respect to a time horizon of one year, the PFE is measured over the entire
lifetime of a transaction or netting set. The Group also employs the aforementioned calculation process to derive
stressed exposure results for input into its credit portfolio stress testing.
Certain collateral support annexes to master agreements provide for rating dependent triggers, where additional
collateral must be pledged if a party’s rating is downgraded. The Group also enters into master agreements that
provide for an additional termination event upon a party’s rating downgrade. The Group analyzes and monitors
potential contingent payment obligations resulting from a rating downgrade in the Group’s stress testing approach
for liquidity risk on an ongoing basis.
Credit Valuation Adjustment
The Group establishes a counterparty credit valuation adjustment for OTC derivative transactions to cover
expected credit losses. The adjustment amount is determined at each reporting date by assessing the potential
credit exposure to all counterparties, taking into account any collateral held, the effect of netting under a master
agreement, expected loss given default and the credit risk for each counterparty based on historic default levels.
Pillar 3 Report 5. Counterparty Credit Risk: Strategy and Processes
35
The credit valuation adjustments are significant for certain monoline counterparties. These credit valuation
adjustments are assessed using a model-based approach with numerous input factors for each counterparty,
including the likelihood of an event (either a restructuring or insolvency), an assessment of any potential settle-
ment in the event of a restructuring, and recovery rates in the event of either restructuring or insolvency. The
Group recorded € 1.2 billion credit valuation adjustments against its aggregate monoline exposures for 2009 and
€ 2.2 billion for 2008).
Treatment of Default Situations under Derivatives
Unlike in the case of the standard loan assets, the Group generally has more options to manage the credit risk in
its OTC derivatives when movement in the current replacement costs of the transactions and the behavior of the
Group’s counterparty indicate that there is the risk that upcoming payment obligations under the transactions
might not be honored. In these situations, the Group is frequently able under prevailing contracts to obtain addi-
tional collateral or terminate the transactions or the related master agreement.
The master agreements executed with the Group’s clients usually provide for a broad set of standard or bespoke
termination rights which allow the Group to respond swiftly to a counterparty’s default or to other circumstances
which indicate a high probability of failure. When the Group’s decision to terminate derivative transactions or the
related master agreement results in a residual net obligation owed by the counterparty, the Group restructures
the obligation into a non-derivative claim and manages it through a regular work-out process. As a consequence,
for accounting purposes the Group typically does not show any nonperforming derivatives.
Wrong way risk occurs when exposure to a counterparty is adversely correlated with the credit quality of that
counterparty. It must be carefully considered together with the correlation between the obligor and risk mitigants
and is actively monitored and reviewed on a regular basis. In compliance with Section 224 (8) and (9) SolvV the
Group has established a monthly wrong way risk monitoring process, whereby transactions subject to wrong way
risk are automatically selected and presented for comment to the responsible credit officer. In addition, the Group
utilizes its newly established process for calibrating its own alpha parameter (as defined in Section 223 (7) SolvV)
to estimate the overall wrong-way risk in the Group’s derivatives and securities financing transaction portfolio.
The following tables show the positive market values or replacement costs of the Group’s OTC and exchange-
traded derivative transactions entered into for trading and non-trading purposes as of December 31, 2009 and
December 31, 2008, following IFRS consolidation and valuation principles. The positive market values are pre-
sented gross, that is, before considering close-out netting and collateral. The benefit resulting from the application
of netting and collateral is displayed separately.
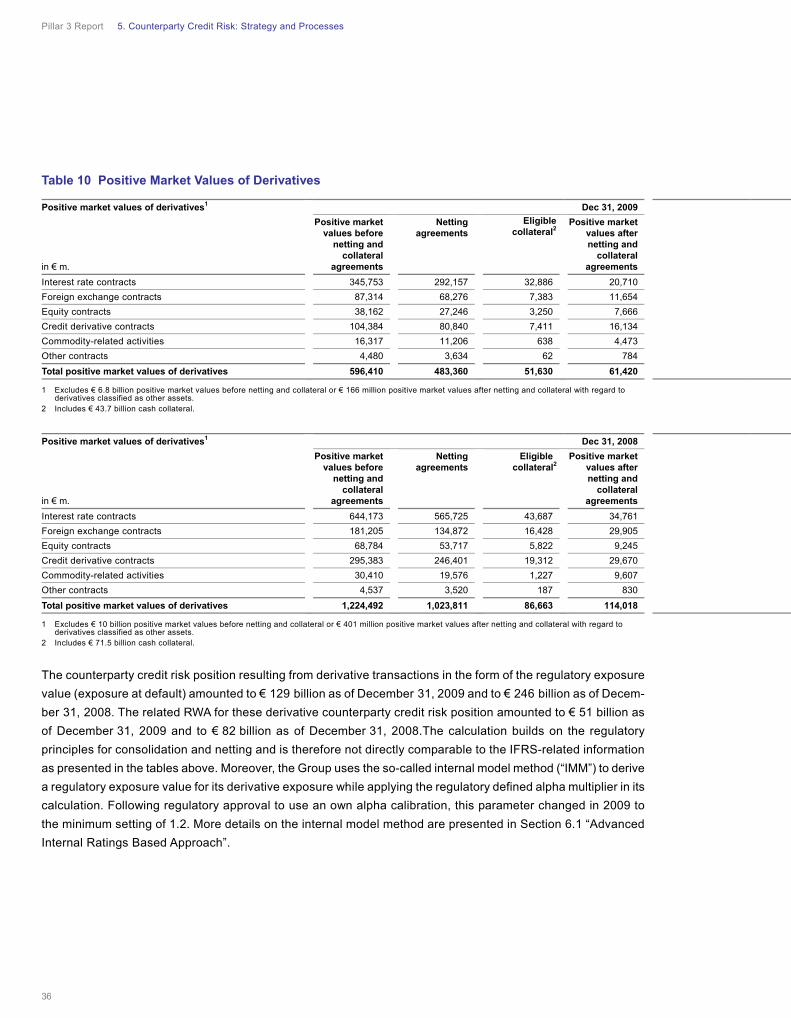
Pillar 3 Report 5. Counterparty Credit Risk: Strategy and Processes
36
Table 10 Positive Market Values of Derivatives
1 Excludes € 6.8 billion positive market values before netting and collateral or € 166 million positive market values after netting and collateral with regard to derivatives classified as other assets.
2 Includes € 43.7 billion cash collateral.
1 Excludes € 10 billion positive market values before netting and collateral or € 401 million positive market values after netting and collateral with regard to derivatives classified as other assets.
2 Includes € 71.5 billion cash collateral.
The counterparty credit risk position resulting from derivative transactions in the form of the regulatory exposure
value (exposure at default) amounted to € 129 billion as of December 31, 2009 and to € 246 billion as of Decem-
ber 31, 2008. The related RWA for these derivative counterparty credit risk position amounted to € 51 billion as
of December 31, 2009 and to € 82 billion as of December 31, 2008.The calculation builds on the regulatory
principles for consolidation and netting and is therefore not directly comparable to the IFRS-related information
as presented in the tables above. Moreover, the Group uses the so-called internal model method (“IMM”) to derive
a regulatory exposure value for its derivative exposure while applying the regulatory defined alpha multiplier in its
calculation. Following regulatory approval to use an own alpha calibration, this parameter changed in 2009 to
the minimum setting of 1.2. More details on the internal model method are presented in Section 6.1 “Advanced
Internal Ratings Based Approach”.
Positive market values of derivatives1 Dec 31, 2009
in € m.
Positive market values before
netting and collateral
agreements
Nettingagreements
Eligible collateral2
Positive market values after netting and
collateral agreements
Interest rate contracts 345,753 292,157 32,886 20,710
Foreign exchange contracts 87,314 68,276 7,383 11,654
Equity contracts 38,162 27,246 3,250 7,666
Credit derivative contracts 104,384 80,840 7,411 16,134
Commodity-related activities 16,317 11,206 638 4,473
Other contracts 4,480 3,634 62 784
Total positive market values of derivatives 596,410 483,360 51,630 61,420
Positive market values of derivatives1 Dec 31, 2008
in € m.
Positive market values before
netting and collateral
agreements
Nettingagreements
Eligible collateral2
Positive market values after netting and
collateral agreements
Interest rate contracts 644,173 565,725 43,687 34,761
Foreign exchange contracts 181,205 134,872 16,428 29,905
Equity contracts 68,784 53,717 5,822 9,245
Credit derivative contracts 295,383 246,401 19,312 29,670
Commodity-related activities 30,410 19,576 1,227 9,607
Other contracts 4,537 3,520 187 830
Total positive market values of derivatives 1,224,492 1,023,811 86,663 114,018
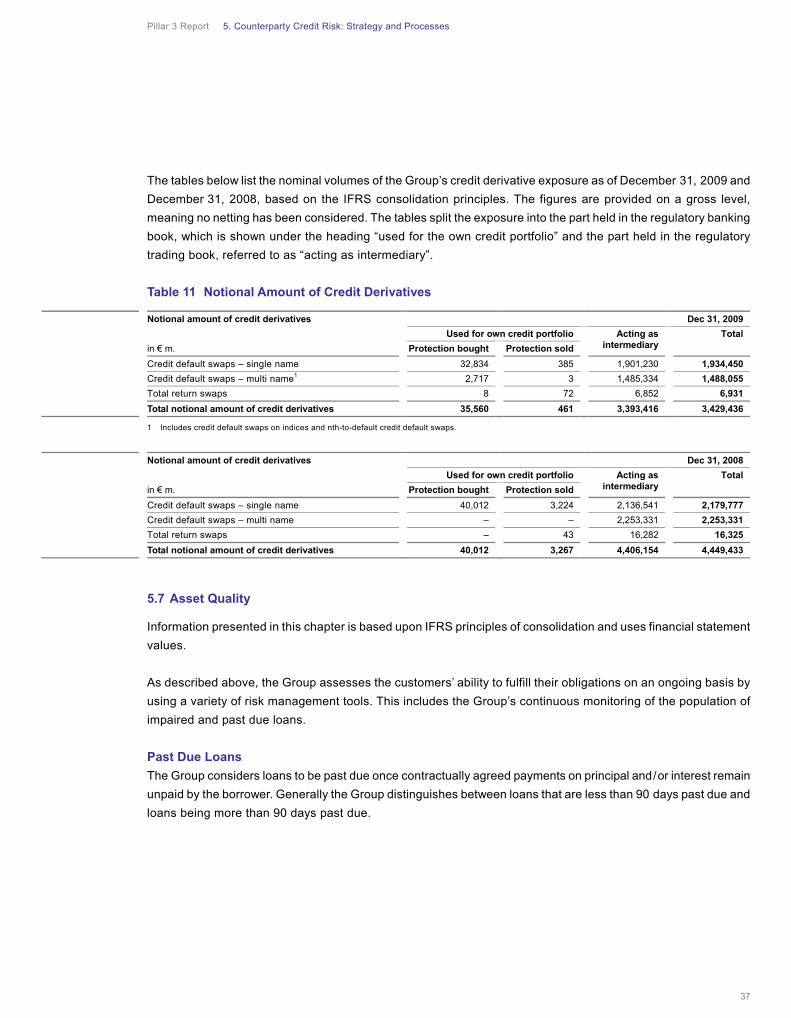
Pillar 3 Report 5. Counterparty Credit Risk: Strategy and Processes
37
The tables below list the nominal volumes of the Group’s credit derivative exposure as of December 31, 2009 and
December 31, 2008, based on the IFRS consolidation principles. The figures are provided on a gross level,
meaning no netting has been considered. The tables split the exposure into the part held in the regulatory banking
book, which is shown under the heading “used for the own credit portfolio” and the part held in the regulatory
trading book, referred to as “acting as intermediary”.
Table 11 Notional Amount of Credit Derivatives
1 Includes credit default swaps on indices and nth-to-default credit default swaps.
5.7 Asset Quality
Information presented in this chapter is based upon IFRS principles of consolidation and uses financial statement
values.
As described above, the Group assesses the customers’ ability to fulfill their obligations on an ongoing basis by
using a variety of risk management tools. This includes the Group’s continuous monitoring of the population of
impaired and past due loans.
Past Due Loans
The Group considers loans to be past due once contractually agreed payments on principal and/or interest remain
unpaid by the borrower. Generally the Group distinguishes between loans that are less than 90 days past due and
loans being more than 90 days past due.
Notional amount of credit derivatives Dec 31, 2009
Used for own credit portfolio Acting as intermediary
Total
in € m. Protection bought Protection sold
Credit default swaps – single name 32,834 385 1,901,230 1,934,450
Credit default swaps – multi name1 2,717 3 1,485,334 1,488,055
Total return swaps 8 72 6,852 6,931
Total notional amount of credit derivatives 35,560 461 3,393,416 3,429,436
Notional amount of credit derivatives Dec 31, 2008
Used for own credit portfolio Acting as intermediary
Total
in € m. Protection bought Protection sold
Credit default swaps – single name 40,012 3,224 2,136,541 2,179,777
Credit default swaps – multi name – – 2,253,331 2,253,331
Total return swaps – 43 16,282 16,325
Total notional amount of credit derivatives 40,012 3,267 4,406,154 4,449,433
Pillar 3 Report 5. Counterparty Credit Risk: Strategy and Processes
38
Impairment of Loans and Allowance for Loan Losses
At each balance sheet date, the Group assesses whether there is objective evidence that a loan or a group of
loans is impaired. A loan or a group of loans is impaired and impairment losses are incurred if:
— there is objective evidence of impairment as a result of a loss event that occurred after the initial recognition of
the loan and up to the balance sheet date (a “loss event”),
— the loss event had an impact on the estimated future cash flows of the loan or the group of loans, and
— a reliable estimate of the loss amount can be made.
The Group first assesses whether objective evidence of impairment exists individually for loans that are individu-
ally significant. It then assesses impairment collectively for loans that are not individually significant and loans
which are significant but for which there is no objective evidence of impairment under the individual assessment.
To allow management to determine whether a loss event has occurred on an individual basis, all significant
counterparty relationships are reviewed periodically. This evaluation considers current information and events
related to the counterparty, such as the counterparty experiencing significant financial difficulty or a breach of
contract, for example, default or delinquency in interest or principal payments.
If there is evidence of impairment leading to an impairment loss for an individual counterparty relationship, then
the amount of the loss is determined as the difference between the carrying amount of the loan(s), including
accrued interest, and the present value of expected future cash flows discounted at the loan’s original effective
interest rate or the effective interest rate established upon reclassification to loans, including cash flows that may
result from foreclosure less costs for obtaining and selling the collateral. The carrying amount of the loans is
reduced by the use of an allowance account and the amount of the loss is recognized in the income statement
as a component of the provision for credit losses.
The collective assessment of impairment is principally to establish an allowance amount relating to loans that are
either individually significant but for which there is no objective evidence of impairment, or are not individually
significant but for which there is, on a portfolio basis, a loss amount that is probable of having occurred and is
reasonably estimable. The loss amount has three components. The first component is an amount for transfer and
currency convertibility risks for loan exposures in countries where there are serious doubts about the ability of
counterparties to comply with the repayment terms due to the economic or political situation prevailing in the
respective country of domicile. This amount is calculated using ratings for country risk and transfer risk which are
established and regularly reviewed for each country in which the Group does business. The second component
is an allowance amount representing the incurred losses on the portfolio of smaller-balance homogeneous loans,
which are loans to individuals and small business customers of the private and retail business. The loans are
grouped according to similar credit risk characteristics and the allowance for each group is determined using
statistical models based on historical experience. The third component represents an estimate of incurred losses
inherent in the group of loans that have not yet been individually identified or measured as part of the smaller-
balance homogeneous loans. Loans that were found not to be impaired when evaluated on an individual basis are
included in the scope of this component of the allowance.

Pillar 3 Report 5. Counterparty Credit Risk: Strategy and Processes
39
Once a loan is identified as impaired, although the accrual of interest in accordance with the contractual terms of
the loan is discontinued, the accretion of the net present value of the written down amount of the loan due to the
passage of time is recognized as interest income based on the original effective interest rate of the loan.
At each balance sheet date, all impaired loans are reviewed for changes to the present value of expected future
cash flows discounted at the loan’s original effective interest rate. Any change to the previously recognized
impairment loss is recognized as a change to the allowance account and recorded in the income statement as a
component of the provision for credit losses.
When it is considered that there is no realistic prospect of recovery and all collateral has been realized or trans-
ferred to the Group, the loan and any associated allowance is written off. Subsequent recoveries, if any, are
credited to the allowance account and recorded in the income statement as a component of the provision for
credit losses.
The process to determine the provision for off-balance sheet positions is similar to the methodology used for
loans. Any loss amounts are recognized as an allowance in the balance sheet within other liabilities and charged
to the income statement as a component of the provision for credit losses.
If in a subsequent period the amount of a previously recognized impairment loss decreases and the decrease can
be related due to an event occurring after the impairment was recognized, the impairment loss is reversed by
reducing the allowance account accordingly. Such reversal is recognized in profit or loss.
Pillar 3 Report 5. Counterparty Credit Risk: Strategy and Processes
40
Quantitative Information on Asset Quality
The following quantitative information on asset quality refers to the IFRS scope of consolidation. As of Decem-
ber 31, 2009, the Group’s impaired loans totaled € 7.2 billion and were comprised of individually assessed im-
paired loans amounting to € 4.9 billion and collectively assessed impaired loans amounting to € 2.3 billion. 75 % of
the Group’s impaired loans were with counterparties domiciled in Western Europe, predominantly with clients
domiciled in Germany, while industry concentrations were with households (23 %) and other (35 %), the latter
being particularly driven by the impaired junior debt portion of one Leveraged Finance exposure which was
reclassified in accordance with IAS 39.
As of December 31, 2009, the Group’s loans past due but not impaired totaled € 8.6 billion, of which 72 % were
less than 30 days past due. Of the loans past due but not impaired 88 % were with counterparties domiciled in
Western Europe, predominantly with clients domiciled in Germany, while industry concentrations were with
households (49 %), fund management activities (17 %) and commercial real estate activities (16 %).
The Group’s allowance for loan losses for impaired loans as of December 31, 2009 was € 2.9 billion, and included
an individually assessed loan loss allowance for impaired loans of € 2.0 billion and a collectively assessed loan
loss allowance for impaired loans of € 900 million. More than 80 % of the Group’s allowance for loan losses was
with counterparties domiciled in Western Europe, predominantly with clients domiciled in Germany, while industry
concentrations were with households (25 %), manufacturing (12 %) and “Other” (33 %). The industry sector “Other”
reflected primarily the impaired junior debt portion of one Leveraged Finance exposure which was reclassified in
accordance with IAS 39.
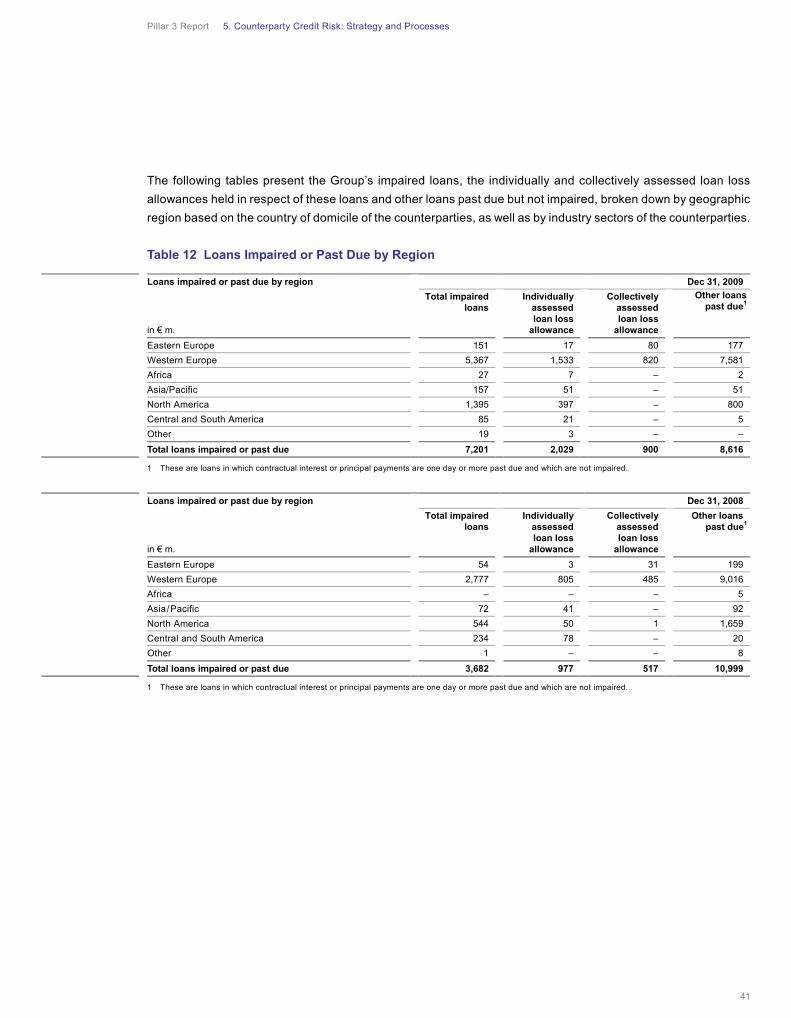
Pillar 3 Report 5. Counterparty Credit Risk: Strategy and Processes
41
The following tables present the Group’s impaired loans, the individually and collectively assessed loan loss
allowances held in respect of these loans and other loans past due but not impaired, broken down by geographic
region based on the country of domicile of the counterparties, as well as by industry sectors of the counterparties.
Table 12 Loans Impaired or Past Due by Region
1 These are loans in which contractual interest or principal payments are one day or more past due and which are not impaired.
1 These are loans in which contractual interest or principal payments are one day or more past due and which are not impaired.
Loans impaired or past due by region Dec 31, 2009
in € m.
Total impaired loans
Individually assessed loan loss
allowance
Collectively assessed loan loss
allowance
Other loans past due1
Eastern Europe 151 17 80 177
Western Europe 5,367 1,533 820 7,581
Africa 27 7 – 2
Asia/Pacific 157 51 – 51
North America 1,395 397 – 800
Central and South America 85 21 – 5
Other 19 3 – –
Total loans impaired or past due 7,201 2,029 900 8,616
Loans impaired or past due by region Dec 31, 2008
in € m.
Total impaired loans
Individually assessed loan loss
allowance
Collectively assessed loan loss
allowance
Other loans past due1
Eastern Europe 54 3 31 199
Western Europe 2,777 805 485 9,016
Africa – – – 5
Asia/Pacific 72 41 – 92
North America 544 50 1 1,659
Central and South America 234 78 – 20
Other 1 – – 8
Total loans impaired or past due 3,682 977 517 10,999
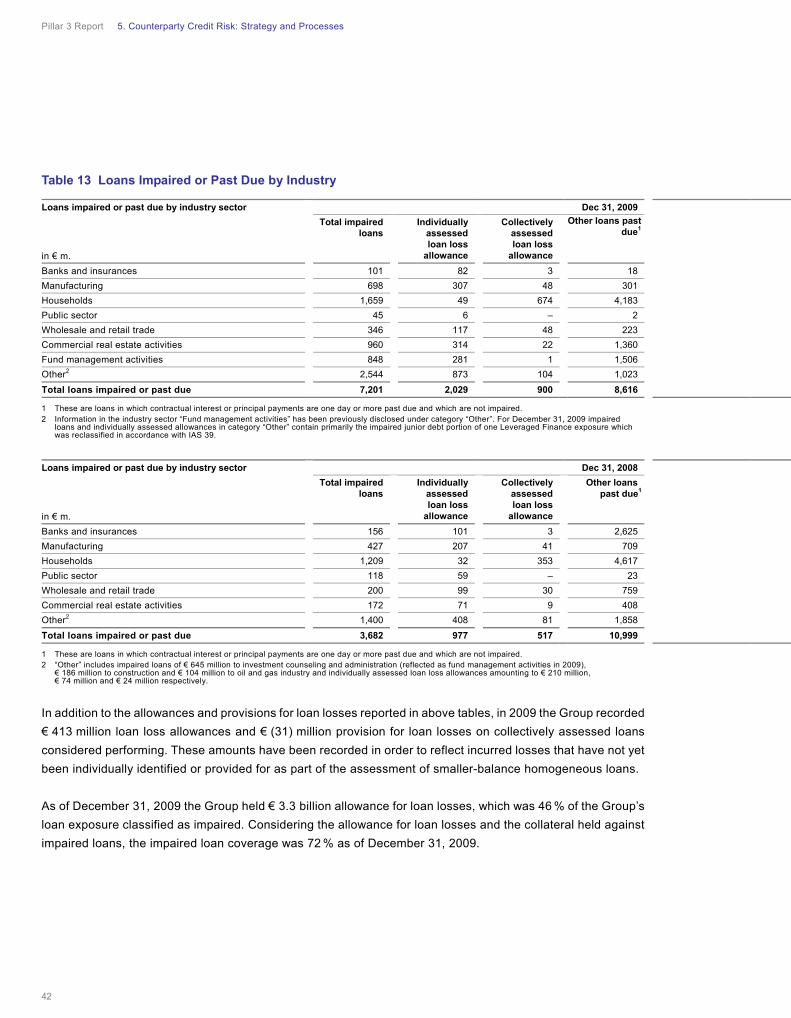
Pillar 3 Report 5. Counterparty Credit Risk: Strategy and Processes
42
Table 13 Loans Impaired or Past Due by Industry
1 These are loans in which contractual interest or principal payments are one day or more past due and which are not impaired. 2 Information in the industry sector “Fund management activities” has been previously disclosed under category “Other”. For December 31, 2009 impaired
loans and individually assessed allowances in category “Other” contain primarily the impaired junior debt portion of one Leveraged Finance exposure which was reclassified in accordance with IAS 39.
1 These are loans in which contractual interest or principal payments are one day or more past due and which are not impaired. 2 “Other” includes impaired loans of € 645 million to investment counseling and administration (reflected as fund management activities in 2009),
€ 186 million to construction and € 104 million to oil and gas industry and individually assessed loan loss allowances amounting to € 210 million, € 74 million and € 24 million respectively.
In addition to the allowances and provisions for loan losses reported in above tables, in 2009 the Group recorded
€ 413 million loan loss allowances and € (31) million provision for loan losses on collectively assessed loans
considered performing. These amounts have been recorded in order to reflect incurred losses that have not yet
been individually identified or provided for as part of the assessment of smaller-balance homogeneous loans.
As of December 31, 2009 the Group held € 3.3 billion allowance for loan losses, which was 46 % of the Group’s
loan exposure classified as impaired. Considering the allowance for loan losses and the collateral held against
impaired loans, the impaired loan coverage was 72 % as of December 31, 2009.
Loans impaired or past due by industry sector Dec 31, 2009
in € m.
Total impaired loans
Individually assessed loan loss
allowance
Collectively assessed loan loss
allowance
Other loans past due1
Banks and insurances 101 82 3 18
Manufacturing 698 307 48 301
Households 1,659 49 674 4,183
Public sector 45 6 – 2
Wholesale and retail trade 346 117 48 223
Commercial real estate activities 960 314 22 1,360
Fund management activities 848 281 1 1,506
Other2 2,544 873 104 1,023
Total loans impaired or past due 7,201 2,029 900 8,616
Loans impaired or past due by industry sector Dec 31, 2008
in € m.
Total impaired loans
Individually assessed loan loss
allowance
Collectively assessed loan loss
allowance
Other loans past due1
Banks and insurances 156 101 3 2,625
Manufacturing 427 207 41 709
Households 1,209 32 353 4,617
Public sector 118 59 – 23
Wholesale and retail trade 200 99 30 759
Commercial real estate activities 172 71 9 408
Other2 1,400 408 81 1,858
Total loans impaired or past due 3,682 977 517 10,999
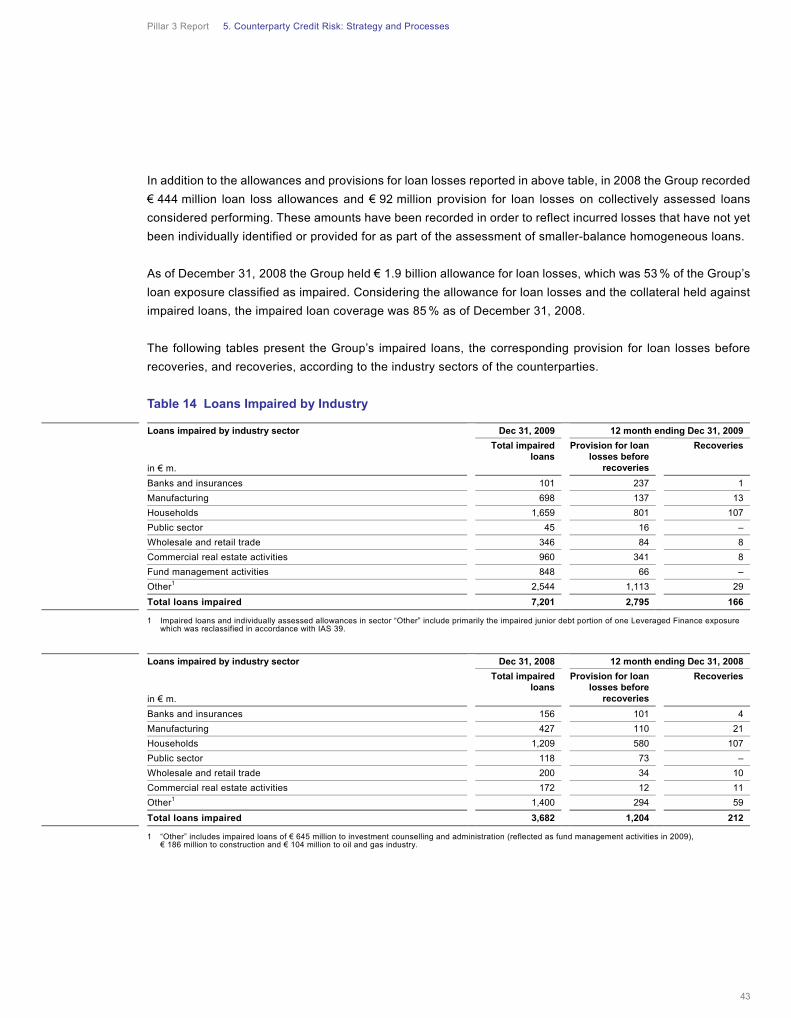
Pillar 3 Report 5. Counterparty Credit Risk: Strategy and Processes
43
In addition to the allowances and provisions for loan losses reported in above table, in 2008 the Group recorded
€ 444 million loan loss allowances and € 92 million provision for loan losses on collectively assessed loans
considered performing. These amounts have been recorded in order to reflect incurred losses that have not yet
been individually identified or provided for as part of the assessment of smaller-balance homogeneous loans.
As of December 31, 2008 the Group held € 1.9 billion allowance for loan losses, which was 53 % of the Group’s
loan exposure classified as impaired. Considering the allowance for loan losses and the collateral held against
impaired loans, the impaired loan coverage was 85 % as of December 31, 2008.
The following tables present the Group’s impaired loans, the corresponding provision for loan losses before
recoveries, and recoveries, according to the industry sectors of the counterparties.
Table 14 Loans Impaired by Industry
1 Impaired loans and individually assessed allowances in sector “Other” include primarily the impaired junior debt portion of one Leveraged Finance exposure which was reclassified in accordance with IAS 39.
1 “Other” includes impaired loans of € 645 million to investment counselling and administration (reflected as fund management activities in 2009), € 186 million to construction and € 104 million to oil and gas industry.
Loans impaired by industry sector Dec 31, 2009 12 month ending Dec 31, 2009
in € m.
Total impaired loans
Provision for loan losses before
recoveries
Recoveries
Banks and insurances 101 237 1
Manufacturing 698 137 13
Households 1,659 801 107
Public sector 45 16 –
Wholesale and retail trade 346 84 8
Commercial real estate activities 960 341 8
Fund management activities 848 66 –
Other1 2,544 1,113 29
Total loans impaired 7,201 2,795 166
Loans impaired by industry sector Dec 31, 2008 12 month ending Dec 31, 2008
in € m.
Total impaired loans
Provision for loan losses before
recoveries
Recoveries
Banks and insurances 156 101 4
Manufacturing 427 110 21
Households 1,209 580 107
Public sector 118 73 –
Wholesale and retail trade 200 34 10
Commercial real estate activities 172 12 11
Other1 1,400 294 59
Total loans impaired 3,682 1,204 212
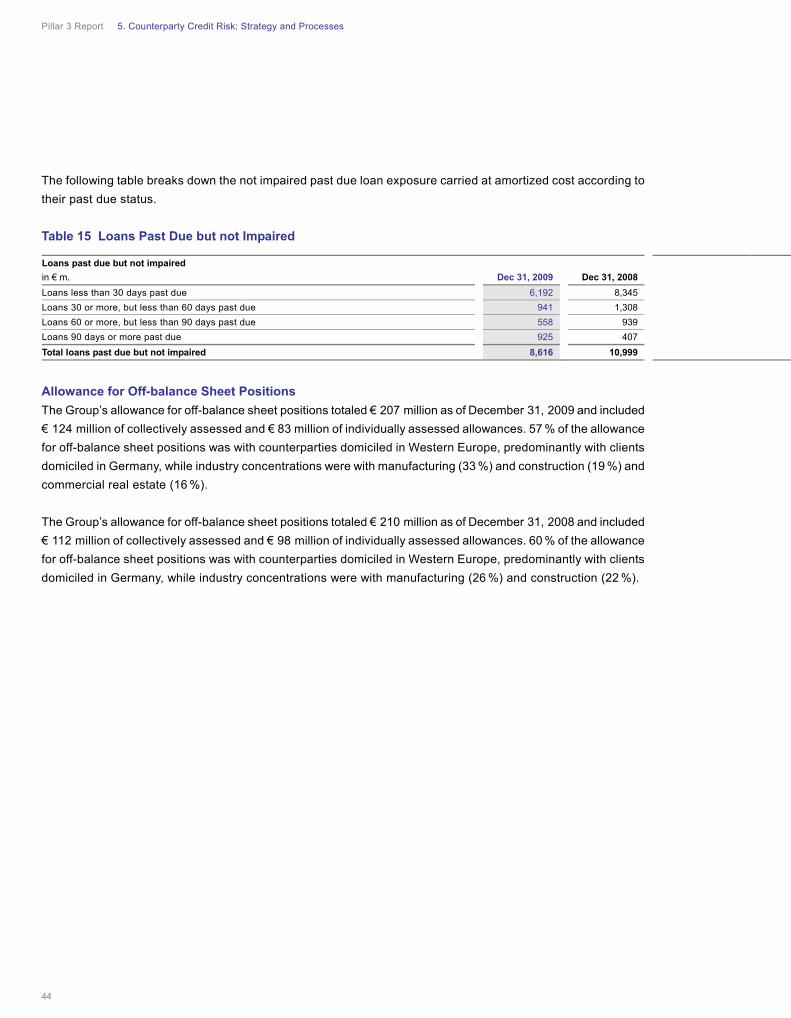
Pillar 3 Report 5. Counterparty Credit Risk: Strategy and Processes
44
The following table breaks down the not impaired past due loan exposure carried at amortized cost according to
their past due status.
Table 15 Loans Past Due but not Impaired
Allowance for Off-balance Sheet Positions
The Group’s allowance for off-balance sheet positions totaled € 207 million as of December 31, 2009 and included
€ 124 million of collectively assessed and € 83 million of individually assessed allowances. 57 % of the allowance
for off-balance sheet positions was with counterparties domiciled in Western Europe, predominantly with clients
domiciled in Germany, while industry concentrations were with manufacturing (33 %) and construction (19 %) and
commercial real estate (16 %).
The Group’s allowance for off-balance sheet positions totaled € 210 million as of December 31, 2008 and included
€ 112 million of collectively assessed and € 98 million of individually assessed allowances. 60 % of the allowance
for off-balance sheet positions was with counterparties domiciled in Western Europe, predominantly with clients
domiciled in Germany, while industry concentrations were with manufacturing (26 %) and construction (22 %).
Loans past due but not impaired
Dec 31, 2009 Dec 31, 2008 in € m.
Loans less than 30 days past due 6,192 8,345
Loans 30 or more, but less than 60 days past due 941 1,308
Loans 60 or more, but less than 90 days past due 558 939
Loans 90 days or more past due 925 407
Total loans past due but not impaired 8,616 10,999
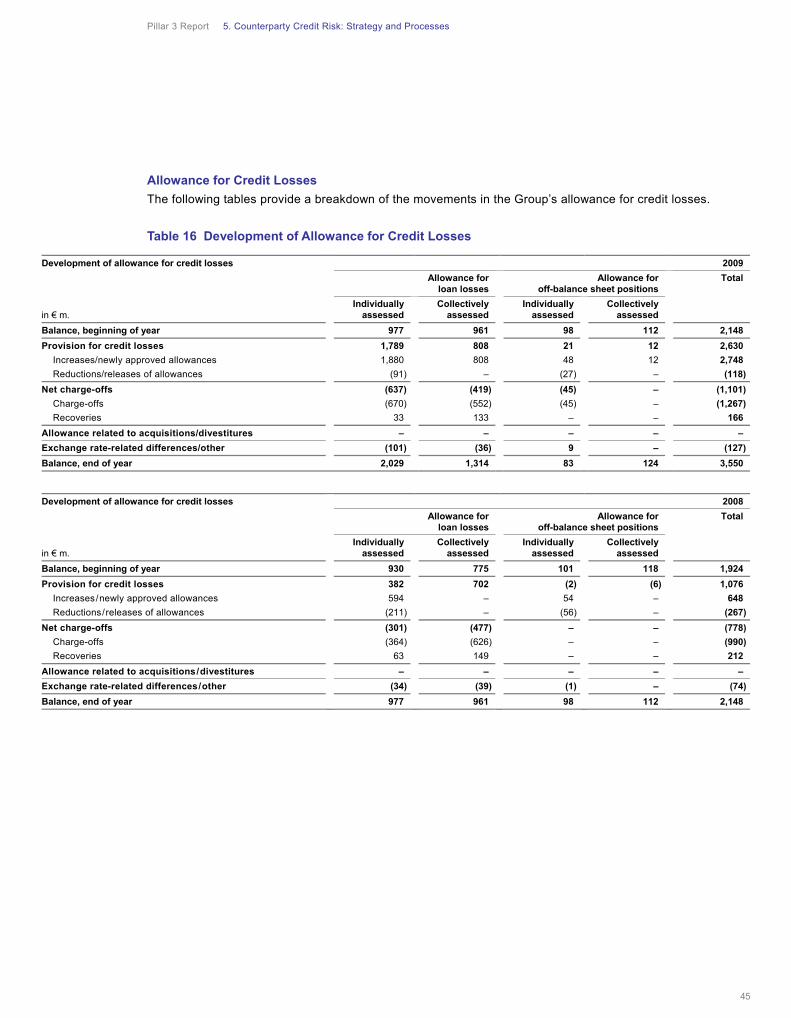
Pillar 3 Report 5. Counterparty Credit Risk: Strategy and Processes
45
Allowance for Credit Losses
The following tables provide a breakdown of the movements in the Group’s allowance for credit losses.
Table 16 Development of Allowance for Credit Losses
Development of allowance for credit losses 2009
Allowance for loan losses
Allowance for off-balance sheet positions
Total
in € m. Individually
assessed Collectively
assessed Individually
assessed Collectively
assessed
Balance, beginning of year 977 961 98 112 2,148
Provision for credit losses 1,789 808 21 12 2,630
Increases/newly approved allowances 1,880 808 48 12 2,748
Reductions/releases of allowances (91) – (27) – (118)
Net charge-offs (637) (419) (45) – (1,101)
Charge-offs (670) (552) (45) – (1,267)
Recoveries 33 133 – – 166
Allowance related to acquisitions/divestitures – – – – –
Exchange rate-related differences/other (101) (36) 9 – (127)
Balance, end of year 2,029 1,314 83 124 3,550
Development of allowance for credit losses 2008
Allowance for loan losses
Allowance for off-balance sheet positions
Total
in € m. Individually
assessed Collectively
assessed Individually
assessed Collectively
assessed
Balance, beginning of year 930 775 101 118 1,924
Provision for credit losses 382 702 (2) (6) 1,076
Increases/newly approved allowances 594 – 54 – 648
Reductions/releases of allowances (211) – (56) – (267)
Net charge-offs (301) (477) – – (778)
Charge-offs (364) (626) – – (990)
Recoveries 63 149 – – 212
Allowance related to acquisitions/divestitures – – – – –
Exchange rate-related differences/other (34) (39) (1) – (74)
Balance, end of year 977 961 98 112 2,148
Pillar 3 Report 6. Counterparty Credit Risk: Regulatory Assessment
46
6.1 Advanced Internal Ratings Based Approach
The Group applies the advanced IRBA for the majority of its advanced IRBA eligible credit portfolios to calculate
its regulatory capital requirements according to the SolvV and received initial approval for using this approach
from the BaFin in December 2007 with approval extensions obtained during 2008 and 2009. The advanced IRBA
is the most sophisticated approach available under the regulatory framework for credit risk allowing the Group to
make use of its internal rating methodologies as well as internal estimates of specific other risk parameters. While
the new regulatory framework allows the first time usage of internal methods and parameters for regulatory
purposes, these methods and parameters represent long-used key components of the internal risk measurement
and management process supporting the credit approval process, the economic capital and expected loss calcula-
tion and the internal monitoring and reporting of credit risk. The relevant parameters include the probability of
default (“PD”) and the loss given default (“LGD”) driving the regulatory risk-weight and the credit conversion factor
(“CCF”) as part of the regulatory exposure at default (“EAD”) estimation.
The probability of default for customers is reflected in the Group’s internal rating systems. The Group assigns a
probability of default to each relevant counterparty credit exposure as a function of a transparent and consistent
26-grid rating scale. The borrower ratings assigned are derived on the grounds of internally developed rating
models which specify consistent and distinct customer-relevant criteria and assign a rating grade based on a
specific set of criteria as given for a certain customer. The set of criteria is generated from information sets
relevant for the respective customer segments like general customer behavior, financial and external data. The
methods in use range from statistical scoring models to expert-based models taking into account the relevant
available quantitative and qualitative information. Expert-based models are usually applied for counterparts in
the asset classes central governments, institutions and corporates with the exception of small- and medium-sized
entities. For the latter as well as for the retail segment statistical scoring or hybrid models combining both
approaches are commonly used. Quantitative rating methodologies are developed based on applicable statistical
modeling techniques, such as logistic regression. In line with Section 118 of SolvV, these models are comple-
mented by human judgment and oversight to review model-based assignments and to ensure that the models are
used appropriately. Although different rating methodologies are applied to the various customer segments in order
to properly reflect customer-specific characteristics, they all adhere to the same risk management principles.
Credit process policies provide guidance on the classification of customers into the various rating systems. For
more information regarding the credit process and the respective rating methods used within that process, please
refer to chapter 5.2 “Credit Risk Ratings and Governance”.
6. Counterparty Credit Risk: Regulatory Assessment
Pillar 3 Report 6. Counterparty Credit Risk: Regulatory Assessment
47
The approvals obtained from the BaFin as a result of the advanced IRBA audit processes allow the usage of
48 internally developed rating systems for regulatory capital calculation purposes out of which 37 rating systems
were authorized in December 2007 and a further 11 less material ones followed in 2008 and 2009. Overall they
cover all of the Group’s material exposures in the advanced IRBA eligible exposure classes “central govern-
ments”, “institutions”, “corporates”, and “retail”.
The advanced IRBA coverage ratio is more than 90 % as of December 31, 2009 using an exposure measure
according to Section 67 SolvV. This ratio excludes the exposures permanently assigned to the standardized
approach (according to Section 70 SolvV) which are discussed in chapter 6.4 “Standardized Approach”, other
IRBA exposure (described in chapter 6.3) as well as securitization positions (please refer to chapter 7 for further
details).
The few remaining advanced IRBA eligible portfolios are temporarily assigned to the standardized approach. With
regard to these, an implementation plan and approval schedule have been set up and agreed with the competent
authorities, the BaFin and the Bundesbank.
The Group applies internally estimated LGD factors as part of the advanced IRBA capital requirement calculation
as approved by the BaFin. LGD is defined as the likely loss intensity in case of a counterparty default. It provides
an estimation of the exposure that cannot be recovered in a default event and therefore captures the severity of a
loss. Conceptually, LGD estimates are independent of a customer’s probability of default. The concept of the
LGD models ensures that the main drivers for losses (e.g., different levels and quality of collateralization and
customer or product types or seniority of facility) are reflected in specific LGD factors.
As part of the application of the advanced IRBA the Group applies specific CCFs in order to calculate an EAD
value. Conceptually the EAD is defined as the expected amount of the credit exposure to a counterparty at the
time of its default. For advanced IRBA calculation purposes the bank applies the general principles as defined in
Section 100 SolvV to determine the EAD of a transaction. In instances, however, where a transaction involves an
unused limit a percentage share of this unused limit is added to the outstanding amount in order to appropriately
reflect the expected outstanding amount in case of a counterparty default. This reflects the assumption that for
commitments the utilization at the time of default might be higher than the current utilization. When a transaction
involves an additional contingent component (e.g., guarantees) a further percentage share (usage factor) is
applied as part of the CCF model in order to estimate the amount of guarantees drawn in case of default. Where
required under the advanced IRBA the CCFs are internally estimated. The calibrations of such parameters are
based on statistical experience as well as internal historical data and consider customer and product type specif-
ics. As part of the approval process, the BaFin assessed the Group’s CCF models and stated their appropriate-
ness for use in the process of regulatory capital requirement calculations.
Pillar 3 Report 6. Counterparty Credit Risk: Regulatory Assessment
48
For derivative counterparty exposures as well as securities financing transactions (“SFT”) the Group makes use
of the internal model method (“IMM”) in accordance with Section 222 et seqq. SolvV. In this respect securities
financing transactions encompass repurchase transactions, securities or commodities lending and borrowing as
well as margin lending transactions (including prime brokerage). The IMM is a more sophisticated approach for
calculating EAD for derivatives and SFT, again requiring prior approval from the BaFin before its first application.
By applying this approach, the Group builds its EAD calculations on a Monte Carlo simulation of the transactions’
future market values. Within this simulation process, interest and FX rates, credit spreads, equity and commodity
prices are modeled by stochastic processes and each derivative and securities financing transaction is revalued
at each point of a pre-defined time grid by the Group’s internally approved valuation routines. As the result of this
process, a distribution of future market values for each transaction at each time grid point is generated. From
these distributions, by considering the appropriate netting and collateral agreements, the Group derives the
exposure measures potential future exposure, average expected exposure and expected positive exposure
(“EPE”) mentioned in chapter 5.6 “Counterparty Credit Risk from Derivatives”. The EPE measure evaluated on
regulatory eligible netting sets defines the EAD for derivative counterparty exposures as well as for securities
financing transactions within the Group’s regulatory capital calculations for the great majority of the Group’s
derivative and SFT portfolio. For the small population of transactions for which a simulation cannot be computed,
the EAD used within the IMM is derived from the current exposure method.
Default Definition and Model Validation
A prerequisite for the development of rating methodologies and the determination of risk parameters is a proper
definition, identification and storage of the default event of a customer. The Group applies a default definition in
accordance with the requirements of Section 125 SolvV as confirmed by the BaFin as part of the IRBA approval
process.
As an important element of the Group’s risk management framework the Group regularly validates its rating
methodologies and credit risk parameters. Whereas the rating methodology validation focuses on the discrimina-
tory power of the models, the risk parameter validation for PD, LGD and CCF analyzes the predictive power of
those parameters when compared against historical default experiences.
According to the Group’s standards, and in line with the SolvV-defined minimum requirements, the parameters
PD, LGD and CCF are reviewed annually and a recalibration of specific parameter settings is triggered if required.
In addition, ad hoc reviews are performed where appropriate as a reaction to quality deterioration at an early
stage due to systematic changes of input factors (e.g., changes in payment behavior) or changes in the structure
of the portfolio. The reviews conducted in 2009 for IRBA rating systems triggered recalibrations of rating metho-
dologies in 16 rating systems as well as 45 additional risk parameter settings (relating to CCFs and LGDs) out of
89 which apply to various IRBA rating systems. None of the recalibrations individually nor the impact of all recali-
brations in the aggregate materially impacted the capital requirements of the Group.
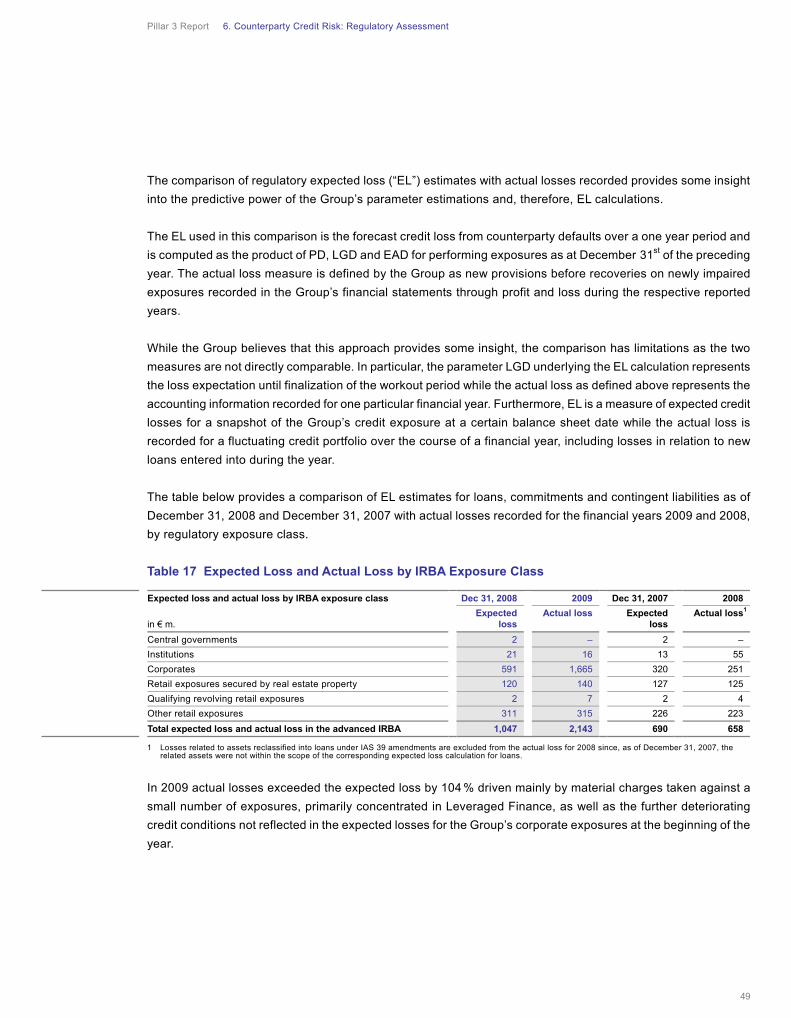
Pillar 3 Report 6. Counterparty Credit Risk: Regulatory Assessment
49
The comparison of regulatory expected loss (“EL”) estimates with actual losses recorded provides some insight
into the predictive power of the Group’s parameter estimations and, therefore, EL calculations.
The EL used in this comparison is the forecast credit loss from counterparty defaults over a one year period and
is computed as the product of PD, LGD and EAD for performing exposures as at December 31st of the preceding
year. The actual loss measure is defined by the Group as new provisions before recoveries on newly impaired
exposures recorded in the Group’s financial statements through profit and loss during the respective reported
years.
While the Group believes that this approach provides some insight, the comparison has limitations as the two
measures are not directly comparable. In particular, the parameter LGD underlying the EL calculation represents
the loss expectation until finalization of the workout period while the actual loss as defined above represents the
accounting information recorded for one particular financial year. Furthermore, EL is a measure of expected credit
losses for a snapshot of the Group’s credit exposure at a certain balance sheet date while the actual loss is
recorded for a fluctuating credit portfolio over the course of a financial year, including losses in relation to new
loans entered into during the year.
The table below provides a comparison of EL estimates for loans, commitments and contingent liabilities as of
December 31, 2008 and December 31, 2007 with actual losses recorded for the financial years 2009 and 2008,
by regulatory exposure class.
Table 17 Expected Loss and Actual Loss by IRBA Exposure Class
1 Losses related to assets reclassified into loans under IAS 39 amendments are excluded from the actual loss for 2008 since, as of December 31, 2007, the related assets were not within the scope of the corresponding expected loss calculation for loans.
In 2009 actual losses exceeded the expected loss by 104 % driven mainly by material charges taken against a
small number of exposures, primarily concentrated in Leveraged Finance, as well as the further deteriorating
credit conditions not reflected in the expected losses for the Group’s corporate exposures at the beginning of the
year.
Expected loss and actual loss by IRBA exposure class Dec 31, 2008 2009 Dec 31, 2007 2008
in € m. Expected
loss Actual loss Expected
loss Actual loss1
Central governments 2 – 2 –
Institutions 21 16 13 55
Corporates 591 1,665 320 251
Retail exposures secured by real estate property 120 140 127 125
Qualifying revolving retail exposures 2 7 2 4
Other retail exposures 311 315 226 223
Total expected loss and actual loss in the advanced IRBA 1,047 2,143 690 658
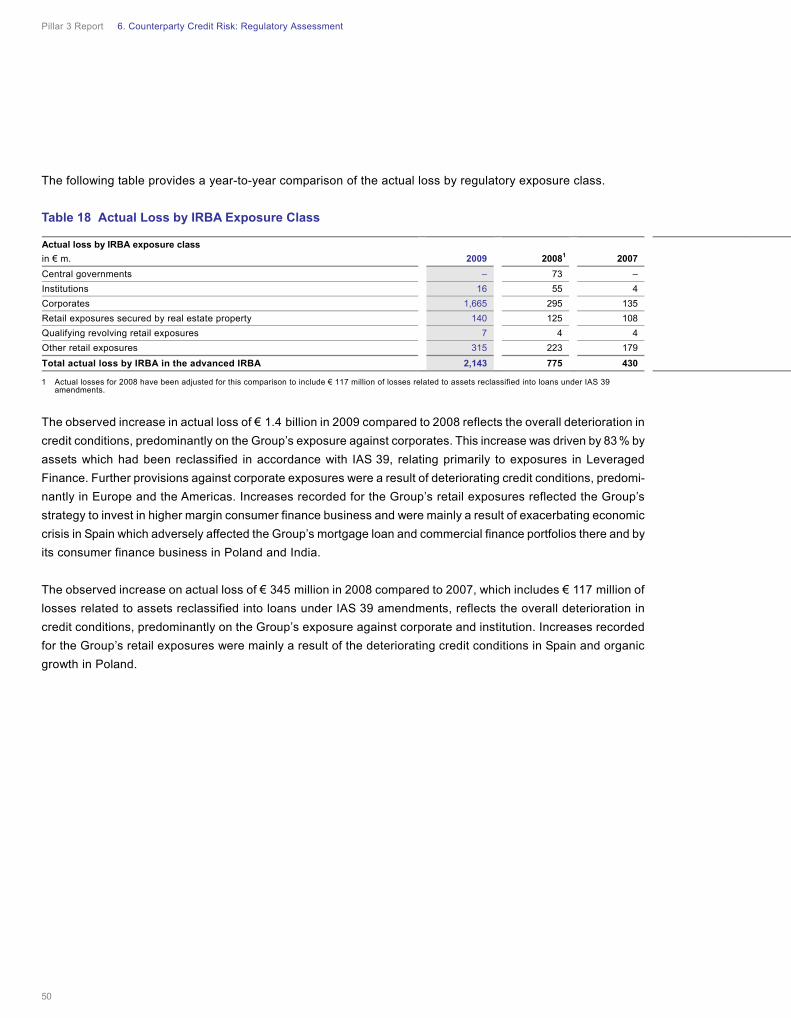
Pillar 3 Report 6. Counterparty Credit Risk: Regulatory Assessment
50
The following table provides a year-to-year comparison of the actual loss by regulatory exposure class.
Table 18 Actual Loss by IRBA Exposure Class
1 Actual losses for 2008 have been adjusted for this comparison to include € 117 million of losses related to assets reclassified into loans under IAS 39 amendments.
The observed increase in actual loss of € 1.4 billion in 2009 compared to 2008 reflects the overall deterioration in
credit conditions, predominantly on the Group’s exposure against corporates. This increase was driven by 83 % by
assets which had been reclassified in accordance with IAS 39, relating primarily to exposures in Leveraged
Finance. Further provisions against corporate exposures were a result of deteriorating credit conditions, predomi-
nantly in Europe and the Americas. Increases recorded for the Group’s retail exposures reflected the Group’s
strategy to invest in higher margin consumer finance business and were mainly a result of exacerbating economic
crisis in Spain which adversely affected the Group’s mortgage loan and commercial finance portfolios there and by
its consumer finance business in Poland and India.
The observed increase on actual loss of € 345 million in 2008 compared to 2007, which includes € 117 million of
losses related to assets reclassified into loans under IAS 39 amendments, reflects the overall deterioration in
credit conditions, predominantly on the Group’s exposure against corporate and institution. Increases recorded
for the Group’s retail exposures were mainly a result of the deteriorating credit conditions in Spain and organic
growth in Poland.
Actual loss by IRBA exposure class
in € m. 2009 20081 2007
Central governments – 73 –
Institutions 16 55 4
Corporates 1,665 295 135
Retail exposures secured by real estate property 140 125 108
Qualifying revolving retail exposures 7 4 4
Other retail exposures 315 223 179
Total actual loss by IRBA in the advanced IRBA 2,143 775 430
Pillar 3 Report 6. Counterparty Credit Risk: Regulatory Assessment
51
6.2 Advanced IRBA Exposure
The advanced IRBA requires differentiating a bank’s credit portfolio into various regulatory defined exposure
classes namely central governments, institutions, corporates and retail clients. The Group identifies the relevant
regulatory exposure class for each exposure by taking into account factors like customer-specific characteristics,
the rating system used as well as certain materiality thresholds which are regulatory defined.
The tables below show the Group’s advanced IRBA exposures distributed on a rating scale and separately for
each regulatory IRBA exposure class. The EAD is presented in conjunction with exposures-weighted average
PD, LGD and risk weight (“RW”) information. The information is shown after credit risk mitigation obtained in the
form of financial, physical and other collateral as well as guarantees and credit derivatives. The effect of double
default, as far as applicable, is considered in the average risk weight. It implies that for a guaranteed exposure a
loss only occurs if the originator and the guarantor fail to meet their obligations at the same time. Regarding the
assignment to the regulatory exposure classes it has to be noted that the exposures covered by guarantees or
credit derivatives are assigned to the exposure class of the protection seller.
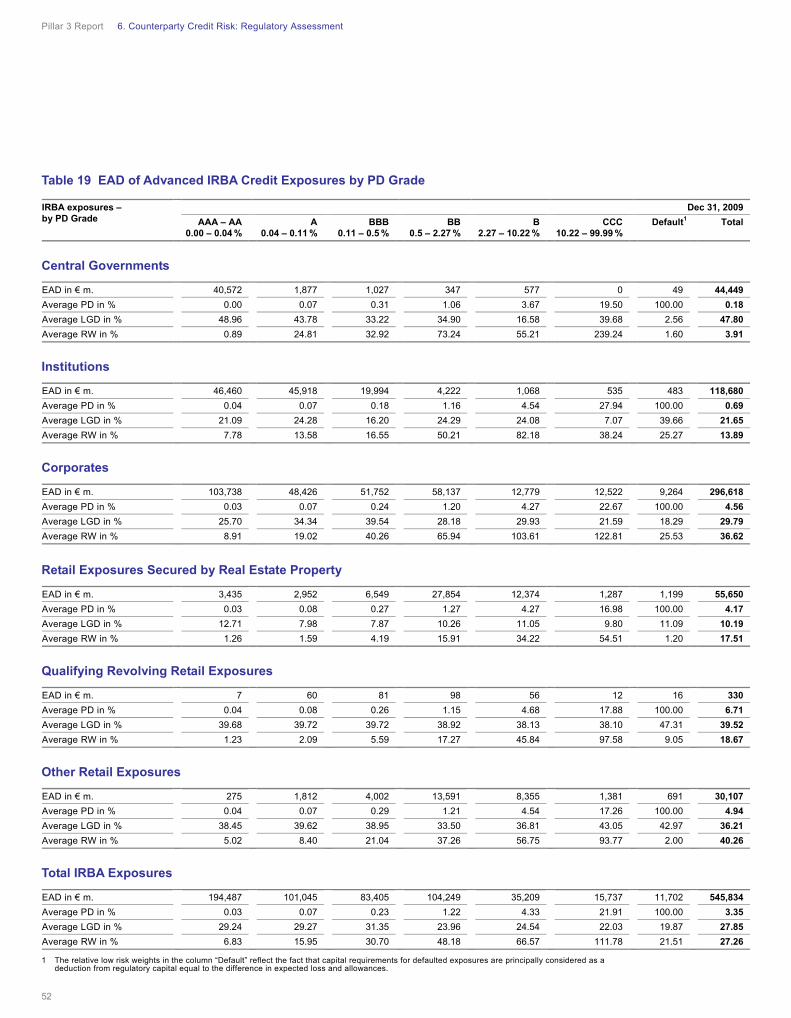
Pillar 3 Report 6. Counterparty Credit Risk: Regulatory Assessment
52
Table 19 EAD of Advanced IRBA Credit Exposures by PD Grade
Central Governments
Institutions
Corporates
Retail Exposures Secured by Real Estate Property
Qualifying Revolving Retail Exposures
Other Retail Exposures
Total IRBA Exposures
1 The relative low risk weights in the column “Default” reflect the fact that capital requirements for defaulted exposures are principally considered as a deduction from regulatory capital equal to the difference in expected loss and allowances.
IRBA exposures – by PD Grade
Dec 31, 2009
AAA – AA0.00 – 0.04 %
A 0.04 – 0.11 %
BBB0.11 – 0.5 %
BB0.5 – 2.27 %
B2.27 – 10.22 %
CCC 10.22 – 99.99 %
Default1 Total
EAD in € m. 40,572 1,877 1,027 347 577 0 49 44,449
Average PD in % 0.00 0.07 0.31 1.06 3.67 19.50 100.00 0.18
Average LGD in % 48.96 43.78 33.22 34.90 16.58 39.68 2.56 47.80
Average RW in % 0.89 24.81 32.92 73.24 55.21 239.24 1.60 3.91
EAD in € m. 46,460 45,918 19,994 4,222 1,068 535 483 118,680
Average PD in % 0.04 0.07 0.18 1.16 4.54 27.94 100.00 0.69
Average LGD in % 21.09 24.28 16.20 24.29 24.08 7.07 39.66 21.65
Average RW in % 7.78 13.58 16.55 50.21 82.18 38.24 25.27 13.89
EAD in € m. 103,738 48,426 51,752 58,137 12,779 12,522 9,264 296,618
Average PD in % 0.03 0.07 0.24 1.20 4.27 22.67 100.00 4.56
Average LGD in % 25.70 34.34 39.54 28.18 29.93 21.59 18.29 29.79
Average RW in % 8.91 19.02 40.26 65.94 103.61 122.81 25.53 36.62
EAD in € m. 3,435 2,952 6,549 27,854 12,374 1,287 1,199 55,650
Average PD in % 0.03 0.08 0.27 1.27 4.27 16.98 100.00 4.17
Average LGD in % 12.71 7.98 7.87 10.26 11.05 9.80 11.09 10.19
Average RW in % 1.26 1.59 4.19 15.91 34.22 54.51 1.20 17.51
EAD in € m. 7 60 81 98 56 12 16 330
Average PD in % 0.04 0.08 0.26 1.15 4.68 17.88 100.00 6.71
Average LGD in % 39.68 39.72 39.72 38.92 38.13 38.10 47.31 39.52
Average RW in % 1.23 2.09 5.59 17.27 45.84 97.58 9.05 18.67
EAD in € m. 275 1,812 4,002 13,591 8,355 1,381 691 30,107
Average PD in % 0.04 0.07 0.29 1.21 4.54 17.26 100.00 4.94
Average LGD in % 38.45 39.62 38.95 33.50 36.81 43.05 42.97 36.21
Average RW in % 5.02 8.40 21.04 37.26 56.75 93.77 2.00 40.26
EAD in € m. 194,487 101,045 83,405 104,249 35,209 15,737 11,702 545,834
Average PD in % 0.03 0.07 0.23 1.22 4.33 21.91 100.00 3.35
Average LGD in % 29.24 29.27 31.35 23.96 24.54 22.03 19.87 27.85
Average RW in % 6.83 15.95 30.70 48.18 66.57 111.78 21.51 27.26
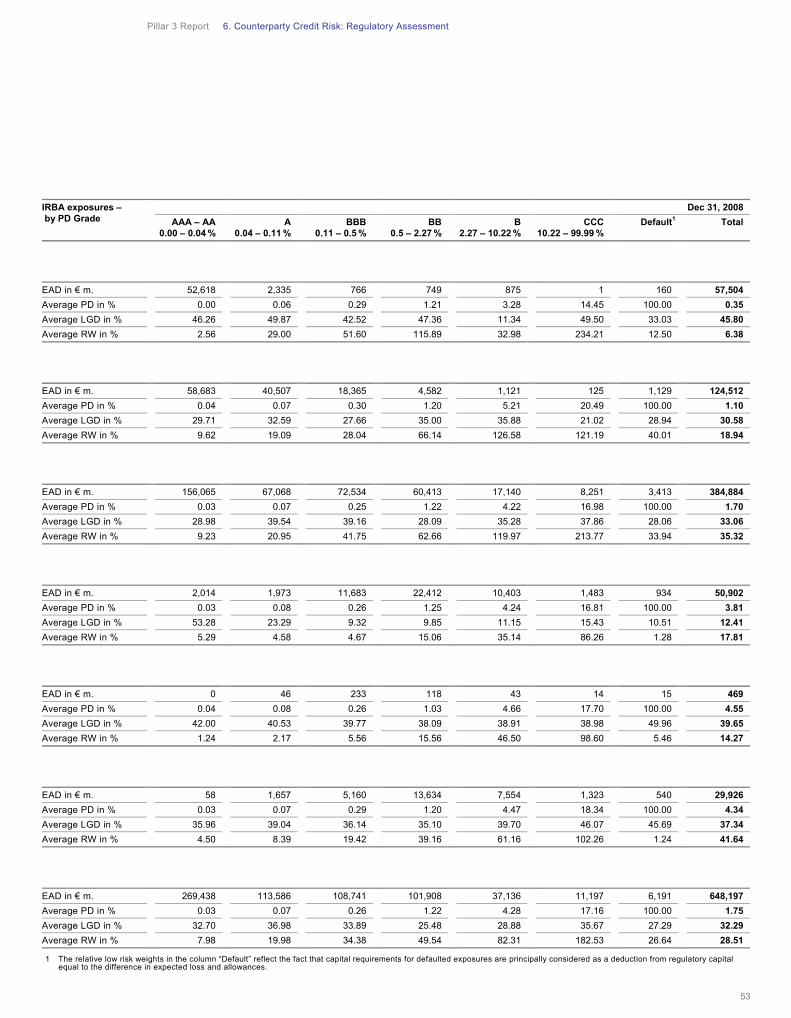
Pillar 3 Report 6. Counterparty Credit Risk: Regulatory Assessment
53
1 The relative low risk weights in the column “Default” reflect the fact that capital requirements for defaulted exposures are principally considered as a deduction from regulatory capital equal to the difference in expected loss and allowances.
IRBA exposures – by PD Grade
Dec 31, 2008
AAA – AA 0.00 – 0.04 %
A 0.04 – 0.11 %
BBB0.11 – 0.5 %
BB0.5 – 2.27 %
B2.27 – 10.22 %
CCC 10.22 – 99.99 %
Default1 Total
EAD in € m. 52,618 2,335 766 749 875 1 160 57,504
Average PD in % 0.00 0.06 0.29 1.21 3.28 14.45 100.00 0.35
Average LGD in % 46.26 49.87 42.52 47.36 11.34 49.50 33.03 45.80
Average RW in % 2.56 29.00 51.60 115.89 32.98 234.21 12.50 6.38
EAD in € m. 58,683 40,507 18,365 4,582 1,121 125 1,129 124,512
Average PD in % 0.04 0.07 0.30 1.20 5.21 20.49 100.00 1.10
Average LGD in % 29.71 32.59 27.66 35.00 35.88 21.02 28.94 30.58
Average RW in % 9.62 19.09 28.04 66.14 126.58 121.19 40.01 18.94
EAD in € m. 156,065 67,068 72,534 60,413 17,140 8,251 3,413 384,884
Average PD in % 0.03 0.07 0.25 1.22 4.22 16.98 100.00 1.70
Average LGD in % 28.98 39.54 39.16 28.09 35.28 37.86 28.06 33.06
Average RW in % 9.23 20.95 41.75 62.66 119.97 213.77 33.94 35.32
EAD in € m. 2,014 1,973 11,683 22,412 10,403 1,483 934 50,902
Average PD in % 0.03 0.08 0.26 1.25 4.24 16.81 100.00 3.81
Average LGD in % 53.28 23.29 9.32 9.85 11.15 15.43 10.51 12.41
Average RW in % 5.29 4.58 4.67 15.06 35.14 86.26 1.28 17.81
EAD in € m. 0 46 233 118 43 14 15 469
Average PD in % 0.04 0.08 0.26 1.03 4.66 17.70 100.00 4.55
Average LGD in % 42.00 40.53 39.77 38.09 38.91 38.98 49.96 39.65
Average RW in % 1.24 2.17 5.56 15.56 46.50 98.60 5.46 14.27
EAD in € m. 58 1,657 5,160 13,634 7,554 1,323 540 29,926
Average PD in % 0.03 0.07 0.29 1.20 4.47 18.34 100.00 4.34
Average LGD in % 35.96 39.04 36.14 35.10 39.70 46.07 45.69 37.34
Average RW in % 4.50 8.39 19.42 39.16 61.16 102.26 1.24 41.64
EAD in € m. 269,438 113,586 108,741 101,908 37,136 11,197 6,191 648,197
Average PD in % 0.03 0.07 0.26 1.22 4.28 17.16 100.00 1.75
Average LGD in % 32.70 36.98 33.89 25.48 28.88 35.67 27.29 32.29
Average RW in % 7.98 19.98 34.38 49.54 82.31 182.53 26.64 28.51
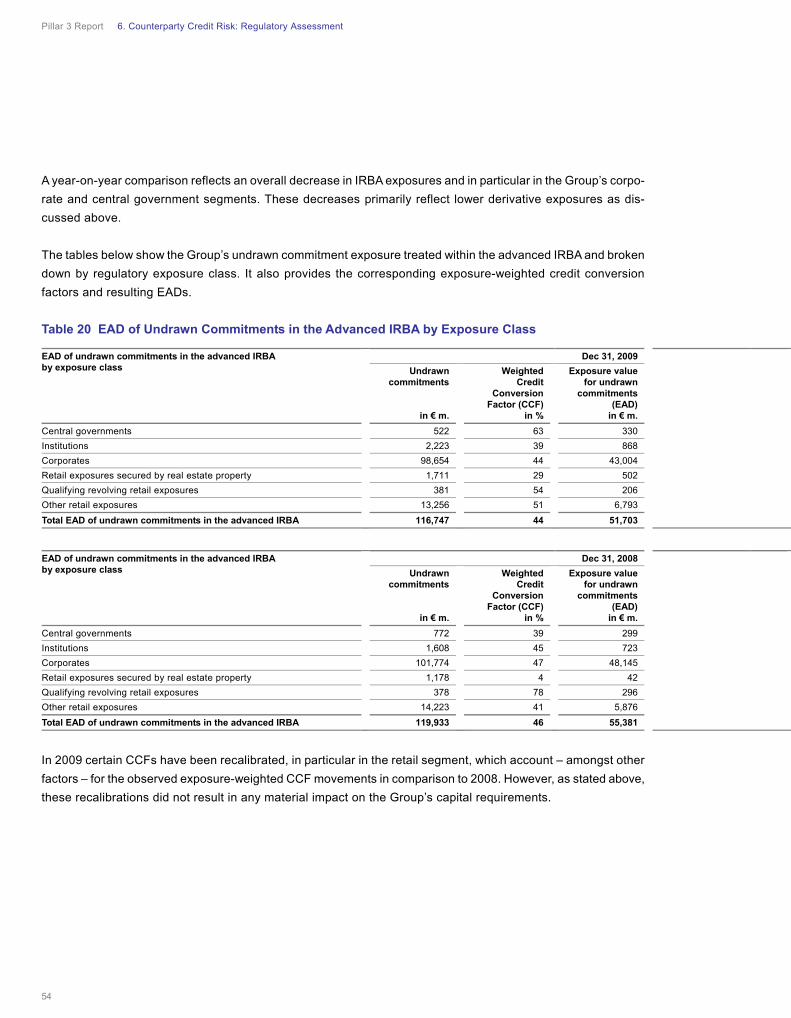
Pillar 3 Report 6. Counterparty Credit Risk: Regulatory Assessment
54
A year-on-year comparison reflects an overall decrease in IRBA exposures and in particular in the Group’s corpo-
rate and central government segments. These decreases primarily reflect lower derivative exposures as dis-
cussed above.
The tables below show the Group’s undrawn commitment exposure treated within the advanced IRBA and broken
down by regulatory exposure class. It also provides the corresponding exposure-weighted credit conversion
factors and resulting EADs.
Table 20 EAD of Undrawn Commitments in the Advanced IRBA by Exposure Class
In 2009 certain CCFs have been recalibrated, in particular in the retail segment, which account – amongst other
factors – for the observed exposure-weighted CCF movements in comparison to 2008. However, as stated above,
these recalibrations did not result in any material impact on the Group’s capital requirements.
EAD of undrawn commitments in the advanced IRBA by exposure class
Dec 31, 2009
Undrawncommitments
in € m.
Weighted Credit
Conversion Factor (CCF)
in %
Exposure value for undrawn
commitments (EAD)
in € m.
Central governments 522 63 330
Institutions 2,223 39 868
Corporates 98,654 44 43,004
Retail exposures secured by real estate property 1,711 29 502
Qualifying revolving retail exposures 381 54 206
Other retail exposures 13,256 51 6,793
Total EAD of undrawn commitments in the advanced IRBA 116,747 44 51,703
EAD of undrawn commitments in the advanced IRBA by exposure class
Dec 31, 2008
Undrawncommitments
in € m.
Weighted Credit
Conversion Factor (CCF)
in %
Exposure value for undrawn
commitments (EAD)
in € m.
Central governments 772 39 299
Institutions 1,608 45 723
Corporates 101,774 47 48,145
Retail exposures secured by real estate property 1,178 4 42
Qualifying revolving retail exposures 378 78 296
Other retail exposures 14,223 41 5,876
Total EAD of undrawn commitments in the advanced IRBA 119,933 46 55,381
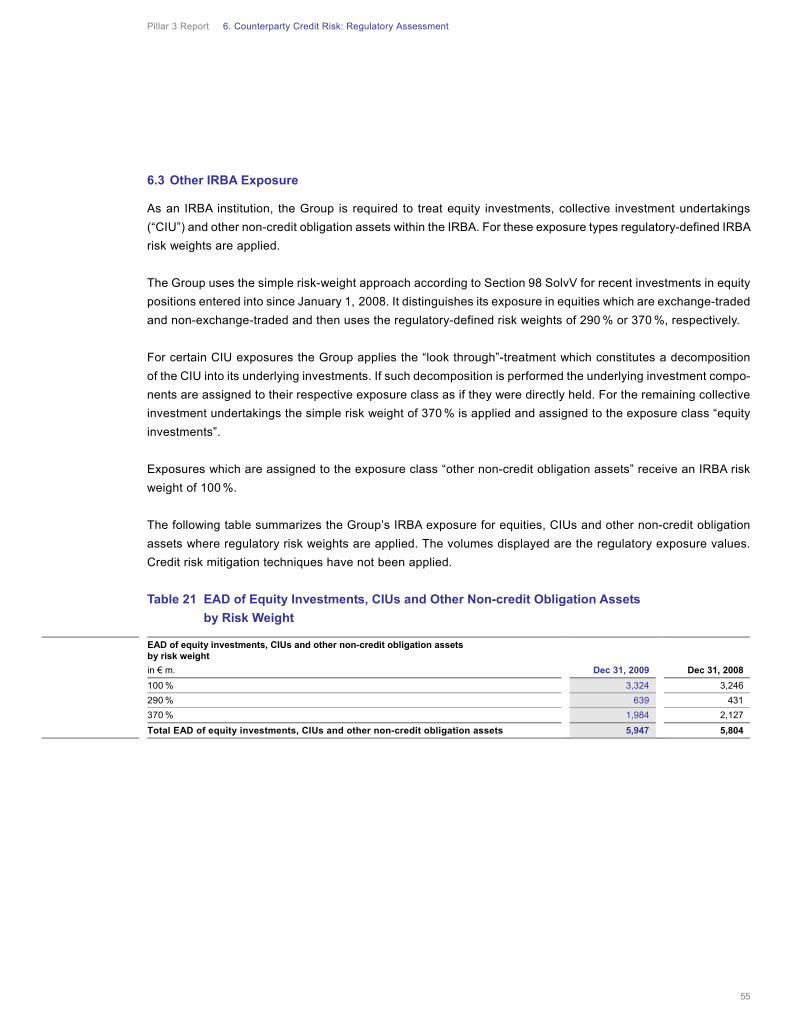
Pillar 3 Report 6. Counterparty Credit Risk: Regulatory Assessment
55
6.3 Other IRBA Exposure
As an IRBA institution, the Group is required to treat equity investments, collective investment undertakings
(“CIU”) and other non-credit obligation assets within the IRBA. For these exposure types regulatory-defined IRBA
risk weights are applied.
The Group uses the simple risk-weight approach according to Section 98 SolvV for recent investments in equity
positions entered into since January 1, 2008. It distinguishes its exposure in equities which are exchange-traded
and non-exchange-traded and then uses the regulatory-defined risk weights of 290 % or 370 %, respectively.
For certain CIU exposures the Group applies the “look through”-treatment which constitutes a decomposition
of the CIU into its underlying investments. If such decomposition is performed the underlying investment compo-
nents are assigned to their respective exposure class as if they were directly held. For the remaining collective
investment undertakings the simple risk weight of 370 % is applied and assigned to the exposure class “equity
investments”.
Exposures which are assigned to the exposure class “other non-credit obligation assets” receive an IRBA risk
weight of 100 %.
The following table summarizes the Group’s IRBA exposure for equities, CIUs and other non-credit obligation
assets where regulatory risk weights are applied. The volumes displayed are the regulatory exposure values.
Credit risk mitigation techniques have not been applied.
Table 21 EAD of Equity Investments, CIUs and Other Non-credit Obligation Assets
by Risk Weight
EAD of equity investments, CIUs and other non-credit obligation assets by risk weight
in € m. Dec 31, 2009 Dec 31, 2008
100 % 3,324 3,246
290 % 639 431
370 % 1,984 2,127
Total EAD of equity investments, CIUs and other non-credit obligation assets 5,947 5,804

Pillar 3 Report 6. Counterparty Credit Risk: Regulatory Assessment
56
6.4 Standardized Approach
The Group treats a small subset of its credit risk portfolio within the standardized approach. The standardized
approach measures credit risk either pursuant to fixed risk weights, which are regulatory predefined, or through
the application of external ratings.
The Group assigns certain credit exposures permanently to the standardized approach in accordance with Sec-
tion 70 SolvV. These are predominantly exposures to the Federal Republic of Germany and other German public
sector entities as well as to central governments of other European Member States that meet the required condi-
tions. These exposures make up approximately half of the exposures carried in the standardized approach and
receive predominantly a risk weight of zero percent. For internal purposes, however, these exposures are
assessed via an internal credit assessment and fully integrated in the risk management and economic capital
processes.
Moreover, in line with Section 66 SolvV, the Group assigns further – generally advanced IRBA eligible – expo-
sures permanently to the standardized approach. This population comprises several small-sized portfolios, which
are considered to be immaterial on a stand-alone basis for inclusion in the advanced IRBA.
Other credit exposures are temporarily assigned to the standardized approach and the Group plans to transfer
them to the advanced IRBA over time. The prioritization and the corresponding transition plan is discussed and
agreed with the competent authorities, the BaFin and the Bundesbank.
Equity positions entered into before January 1, 2008, are subject to the transitional arrangement to exempt them
from the IRBA and a risk weight of 100 % is applied according to the standardized approach treatment.
In order to calculate the regulatory capital requirements under the standardized approach, the Group uses eligible
external ratings from Standard & Poor’s, Moody’s, Fitch Ratings and in some cases from DBRS. These latter
ratings have been newly applied in the standardized approach for a small number of exposures in 2009. Ratings
are applied to all relevant exposure classes in the standardized approach. If more than one rating is available for
a specific counterparty, the selection criteria as set out in Section 44 SolvV are applied in order to determine the
relevant risk weight for the capital calculation. Moreover, given the low volume of exposures covered under the
standardized approach and the high percentage of (externally rated) central government exposures therein, the
Group does not infer borrower ratings from issuer ratings.
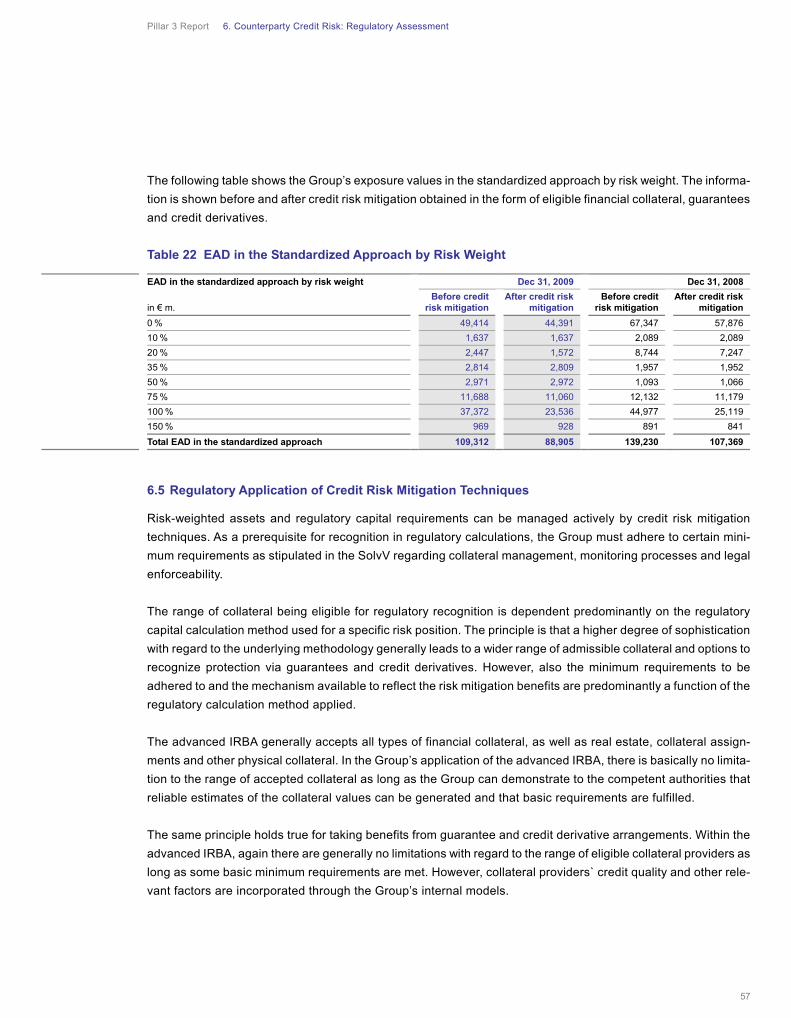
Pillar 3 Report 6. Counterparty Credit Risk: Regulatory Assessment
57
The following table shows the Group’s exposure values in the standardized approach by risk weight. The informa-
tion is shown before and after credit risk mitigation obtained in the form of eligible financial collateral, guarantees
and credit derivatives.
Table 22 EAD in the Standardized Approach by Risk Weight
6.5 Regulatory Application of Credit Risk Mitigation Techniques
Risk-weighted assets and regulatory capital requirements can be managed actively by credit risk mitigation
techniques. As a prerequisite for recognition in regulatory calculations, the Group must adhere to certain mini-
mum requirements as stipulated in the SolvV regarding collateral management, monitoring processes and legal
enforceability.
The range of collateral being eligible for regulatory recognition is dependent predominantly on the regulatory
capital calculation method used for a specific risk position. The principle is that a higher degree of sophistication
with regard to the underlying methodology generally leads to a wider range of admissible collateral and options to
recognize protection via guarantees and credit derivatives. However, also the minimum requirements to be
adhered to and the mechanism available to reflect the risk mitigation benefits are predominantly a function of the
regulatory calculation method applied.
The advanced IRBA generally accepts all types of financial collateral, as well as real estate, collateral assign-
ments and other physical collateral. In the Group’s application of the advanced IRBA, there is basically no limita-
tion to the range of accepted collateral as long as the Group can demonstrate to the competent authorities that
reliable estimates of the collateral values can be generated and that basic requirements are fulfilled.
The same principle holds true for taking benefits from guarantee and credit derivative arrangements. Within the
advanced IRBA, again there are generally no limitations with regard to the range of eligible collateral providers as
long as some basic minimum requirements are met. However, collateral providers` credit quality and other rele-
vant factors are incorporated through the Group’s internal models.
EAD in the standardized approach by risk weight Dec 31, 2009 Dec 31, 2008
in € m. Before credit
risk mitigation After credit risk
mitigation Before credit
risk mitigation After credit risk
mitigation
0 % 49,414 44,391 67,347 57,876
10 % 1,637 1,637 2,089 2,089
20 % 2,447 1,572 8,744 7,247
35 % 2,814 2,809 1,957 1,952
50 % 2,971 2,972 1,093 1,066
75 % 11,688 11,060 12,132 11,179
100 % 37,372 23,536 44,977 25,119
150 % 969 928 891 841
Total EAD in the standardized approach 109,312 88,905 139,230 107,369
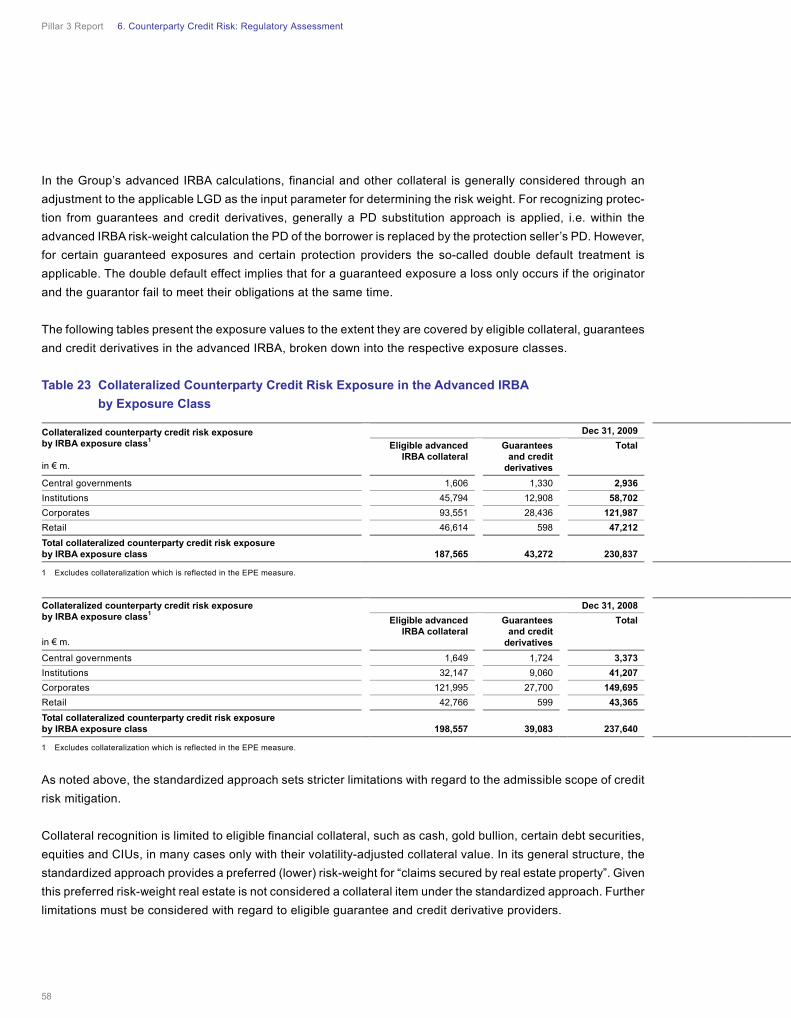
Pillar 3 Report 6. Counterparty Credit Risk: Regulatory Assessment
58
In the Group’s advanced IRBA calculations, financial and other collateral is generally considered through an
adjustment to the applicable LGD as the input parameter for determining the risk weight. For recognizing protec-
tion from guarantees and credit derivatives, generally a PD substitution approach is applied, i.e. within the
advanced IRBA risk-weight calculation the PD of the borrower is replaced by the protection seller’s PD. However,
for certain guaranteed exposures and certain protection providers the so-called double default treatment is
applicable. The double default effect implies that for a guaranteed exposure a loss only occurs if the originator
and the guarantor fail to meet their obligations at the same time.
The following tables present the exposure values to the extent they are covered by eligible collateral, guarantees
and credit derivatives in the advanced IRBA, broken down into the respective exposure classes.
Table 23 Collateralized Counterparty Credit Risk Exposure in the Advanced IRBA
by Exposure Class
1 Excludes collateralization which is reflected in the EPE measure.
1 Excludes collateralization which is reflected in the EPE measure.
As noted above, the standardized approach sets stricter limitations with regard to the admissible scope of credit
risk mitigation.
Collateral recognition is limited to eligible financial collateral, such as cash, gold bullion, certain debt securities,
equities and CIUs, in many cases only with their volatility-adjusted collateral value. In its general structure, the
standardized approach provides a preferred (lower) risk-weight for “claims secured by real estate property”. Given
this preferred risk-weight real estate is not considered a collateral item under the standardized approach. Further
limitations must be considered with regard to eligible guarantee and credit derivative providers.
Collateralized counterparty credit risk exposure by IRBA exposure class1 in € m.
Dec 31, 2009
Eligible advanced IRBA collateral
Guarantees and credit
derivatives
Total
Central governments 1,606 1,330 2,936
Institutions 45,794 12,908 58,702
Corporates 93,551 28,436 121,987
Retail 46,614 598 47,212
Total collateralized counterparty credit risk exposure by IRBA exposure class 187,565 43,272 230,837
Collateralized counterparty credit risk exposure by IRBA exposure class1
in € m.
Dec 31, 2008
Eligible advanced IRBA collateral
Guarantees and credit
derivatives
Total
Central governments 1,649 1,724 3,373
Institutions 32,147 9,060 41,207
Corporates 121,995 27,700 149,695
Retail 42,766 599 43,365
Total collateralized counterparty credit risk exposure by IRBA exposure class 198,557 39,083 237,640
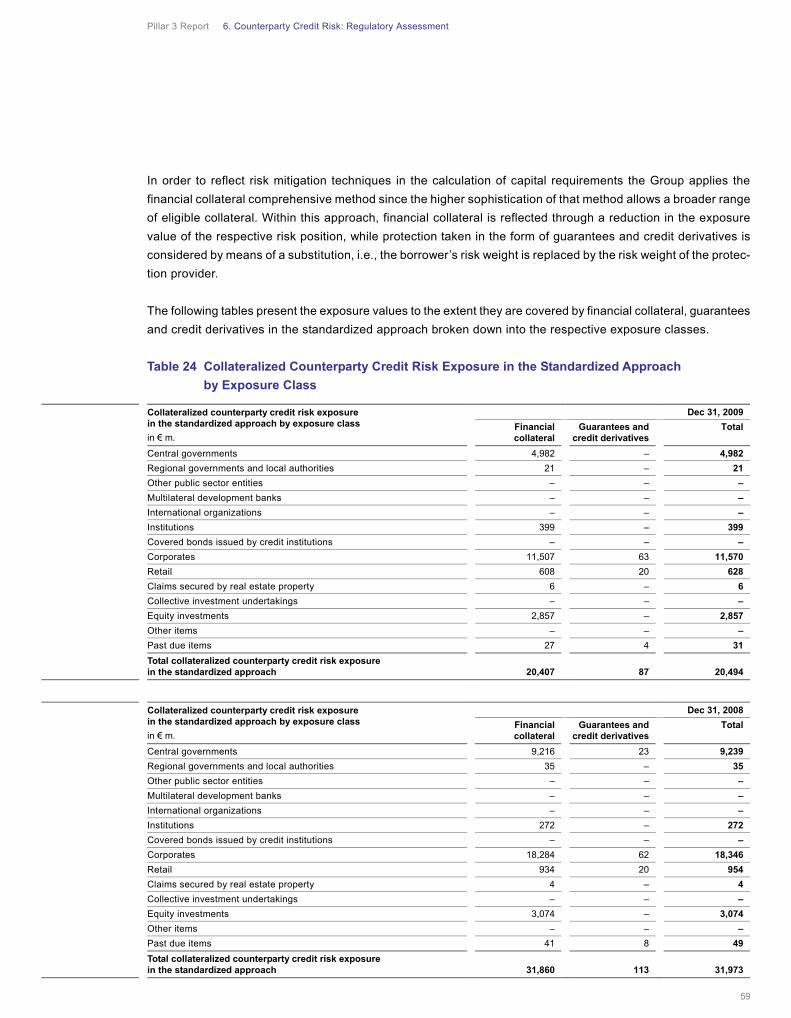
Pillar 3 Report 6. Counterparty Credit Risk: Regulatory Assessment
59
In order to reflect risk mitigation techniques in the calculation of capital requirements the Group applies the
financial collateral comprehensive method since the higher sophistication of that method allows a broader range
of eligible collateral. Within this approach, financial collateral is reflected through a reduction in the exposure
value of the respective risk position, while protection taken in the form of guarantees and credit derivatives is
considered by means of a substitution, i.e., the borrower’s risk weight is replaced by the risk weight of the protec-
tion provider.
The following tables present the exposure values to the extent they are covered by financial collateral, guarantees
and credit derivatives in the standardized approach broken down into the respective exposure classes.
Table 24 Collateralized Counterparty Credit Risk Exposure in the Standardized Approach
by Exposure Class
Collateralized counterparty credit risk exposure in the standardized approach by exposure class
in € m.
Dec 31, 2009
Financial collateral
Guarantees and credit derivatives
Total
Central governments 4,982 – 4,982
Regional governments and local authorities 21 – 21
Other public sector entities – – –
Multilateral development banks – – –
International organizations – – –
Institutions 399 – 399
Covered bonds issued by credit institutions – – –
Corporates 11,507 63 11,570
Retail 608 20 628
Claims secured by real estate property 6 – 6
Collective investment undertakings – – –
Equity investments 2,857 – 2,857
Other items – – –
Past due items 27 4 31
Total collateralized counterparty credit risk exposure in the standardized approach 20,407 87 20,494
Collateralized counterparty credit risk exposure in the standardized approach by exposure class
in € m.
Dec 31, 2008
Financial collateral
Guarantees and credit derivatives
Total
Central governments 9,216 23 9,239
Regional governments and local authorities 35 – 35
Other public sector entities – – –
Multilateral development banks – – –
International organizations – – –
Institutions 272 – 272
Covered bonds issued by credit institutions – – –
Corporates 18,284 62 18,346
Retail 934 20 954
Claims secured by real estate property 4 – 4
Collective investment undertakings – – –
Equity investments 3,074 – 3,074
Other items – – –
Past due items 41 8 49
Total collateralized counterparty credit risk exposure in the standardized approach 31,860 113 31,973
Pillar 3 Report 7. Securitization
60
7.1 Overview of Activities Undertaken by the Group
The Group engages in various business activities that use securitization structures. The principal purposes are to
provide clients with access to risk and returns related to specific portfolios of assets, to provide clients with access
to funding and to manage the Group’s credit risk exposure.
A participant in the securitization market is typically an originator, sponsor or investor. An originator is an institu-
tion which is involved, either itself or through its’ related entities directly or indirectly, in the origination or purchase
of exposures with the intention to securitize. In a sponsorship role, an institution establishes and manages an
asset-backed commercial paper program (“ABCP”) or other securitization transaction. All other securitization
would be in the capacity as an investor.
As an originator, the Group uses securitizations primarily as a strategy to reduce credit risk. The Loan Exposure
Management Group uses, amongst others, synthetic securitizations to manage the credit risk of loans and
lending-related commitments of the international investment-grade portfolio and the medium-sized German
companies’ portfolio within the Corporate and Investment Bank group division. The credit risk is predominantly
transferred to counterparties synthetically through financial guarantees and, to a lesser extent, with first loss
credit derivatives. Other methods used to mitigate credit risk are the issuance of credit-linked notes and synthetic
collateralized loan obligations supported by financial guarantees. Using the above mentioned techniques, LEMG
transferred a risk volume of € 19.2 billion in 2009 which is recognized for regulatory purposes. The transferred risk
volume in 2008 amounted to € 18.5 billion. The observed increase of the volume transferred relates mainly to the
replacement of two securitizations expired in 2009 with two new ones.
During 2008 the Group also entered into securitization transactions with special purpose entities (“SPEs”) for
leveraged loans and commercial real estate loans in the amount of € 10.4 billion. The SPEs issued two tranches
of notes, and the junior (equity) notes are substantially held by third parties. The Group holds all the senior notes
issued by the SPEs, which are reported as loan assets in the financial accounts, and as securitization positions
for regulatory capital calculations. Additional amounts of leveraged loans and commercial real estate loans
securitized in 2009 through the use of similar structures were not substantial.
During 2009 the Group has entered into two securitization transactions involving the purchase of first-loss credit
default swap protection on portfolios of derivative counterparty credit risk exposures in the amount of € 5.5 billion
and $ 20.0 billion, respectively. The Group reports the unprotected senior tranches as securitization positions for
the purpose of regulatory capital calculations.
7. Securitization
Pillar 3 Report 7. Securitization
61
On a limited basis the Group has entered into securitization transactions as part of an active liquidity risk man-
agement strategy. During 2008 and 2009 those securitizations transferred assets with a total volume of € 38 billion
to SPEs, with the Group retaining all positions of the structures. These transactions do not transfer risk, so there
is no securitization benefit for regulatory capital or financial reporting. The sole purpose of the structure is to
provide a mechanism by which assets can be transformed into pledgeable securities. The activities are therefore
not disclosed in the quantitative part of this chapter.
The Group sets up, sponsors and administers a number of ABCP programs. These programs provide customers
with access to liquidity in the commercial paper market and create investment products for clients. As an adminis-
trative agent for the commercial paper programs, the Group facilitates the purchase of non-Deutsche Bank Group
loans, securities and other receivables by the commercial paper conduit (“conduit”), which then issues to the
market high-grade, short-term commercial paper, collateralized by the underlying assets, to fund the purchase.
The conduits require sufficient collateral, credit enhancements and liquidity support to maintain an investment
grade rating for the commercial paper. The Group is the liquidity provider to these conduits and therefore exposed
to changes in the carrying value of their assets. The collateral in the conduits includes a range of asset-backed
loans and securities, including aircraft leasing, student loans, trust preferred securities and residential- and
commercial-mortgage-backed securities. The credit enhancement and liquidity facilities with these conduits are
part of the Group’s regulatory banking book. There are also instances in which the Group will face the conduit on
foreign exchange and interest rate swaps which are recorded in the trading book.
Furthermore, the Group is an investor in third party securitizations through investments in third party issued
securitizations tranches or provides liquidity/credit support to which it, and in some instances other parties,
provide financing.
The Group sponsors SPEs for which it originates or purchases assets with an intention to securitize these assets,
providing clients with access to assets and risks to meet their needs. These assets are predominantly commercial
and residential whole loans or mortgage-backed securities. The SPEs fund these purchases by issuing multiple
tranches of securities, the repayment of which is linked to the performance of the assets in the SPEs.
Additionally, the Group assists third party securitizations by providing derivatives related to securitization struc-
tures. These include currency, interest rate, equity and credit derivatives. In its securities trading capacity or as a
result of current market disruptions, the Group may also retain certain tranches of an SPE’s capital structure,
which are recorded in the regulatory banking book and attract capital requirements according to the regulatory
securitization framework.
Pillar 3 Report 7. Securitization
62
The Group also performs trading activities relating to securitization exposures, which in particular include the
Group’s Credit Correlation Trading business. This business offers complex credit products to clients and dynami-
cally hedges its trading market risk exposures. The traded instruments in the Credit Correlation business mainly
comprise CDO tranches referencing synthetic pools of credit exposures, including standard tranches of credit
indices, first-to-default credit derivatives, single-name credit derivatives and indices based on credit default
swaps.
During 2008 and 2009, the Group reclassified eligible assets to loans from either trading or available for sale for
financial reporting. This reclassification also resulted in some reclassifications of assets from the regulatory
trading to banking book. Some of these exposures are considered securitization positions for regulatory capital
purposes; they amounted to € 9.5 billion as of December 31, 2009. For further detail on reclassified assets, please
refer to Note [12] “Amendments to IAS 39 and IFRS 7, ‘Reclassification of Financial Assets’ ” in the Group’s
Financial Report 2009. In addition, the Management Report of the Group’s Financial Report 2009 includes a
discussion of reclassified assets.
7.2 Accounting and Valuation Policies for Securitizations
The Group securitizes various consumer and commercial financial assets, by selling these assets to an SPE,
which in turn issues securities to investors. The transferred assets may qualify for derecognition in full or in part,
under the Group’s IFRS policy on derecognition of financial assets. Synthetic securitization structures typically
involve derivative financial instruments. Transfers that do not qualify for derecognition may be reported as secured
financing or result in the recognition of continuing involvement liabilities. The investors and the securitization
vehicles generally have no recourse to the Group’s other assets in cases where the issuers of the financial assets
fail to perform under the original terms of those assets.
The Group may consolidate SPEs for financial statement purposes that it establishes, sponsors or with which it
has a contractual relationship. The Group will consolidate an SPE when it has the power to govern the financial
and operating policies, generally accompanying a shareholding, either directly or indirectly, of more than one half
of the voting rights according to the Standing Interpretations Committee Interpretation No. 12 (SIC-12) “Consolida-
tion – Special Purpose Vehicles”. When the activities are so narrowly defined, or if it is not evident who controls
the financial and operating policies of the SPE, a range of other factors are considered. These factors include
whether (1) the activities are being conducted on the Group’s behalf according to specific business needs so that
benefits are obtained from the entity’s operations, (2) through decision-making powers the majority of the benefits
are obtained, (3) the majority of the benefits of the activities of the entity will be obtained, and (4) the majority
of the residual ownership risks related to the assets is retained in order to obtain the benefits from its activities.
The Group consolidates an SPE if an assessment of the relevant factors indicates that the Group controls it. The
Group reassesses the treatment of SPE’s for consolidation when there is a change in the SPE’s arrangements or
the substance of the relationship between the Group and an SPE changes.
Pillar 3 Report 7. Securitization
63
When these assets are held at fair value, consistent with the valuation of similar financial instruments, fair value of
retained tranches or the financial assets is initially and subsequently determined using market price quotations
where available or internal pricing models that utilize variables such as yield curves, prepayment speeds, default
rates, loss severities, interest rate volatilities and spreads. The assumptions used for valuation are based on
observable transactions in similar securities and are verified by external pricing sources, where available.
For further detail on the Group’s accounting and valuation policies please refer to Note [1] “Significant Accounting
Policies” and [13] “Financial Instruments carried at Fair Value” in the Group’s Financial Report 2009. In addition,
the Management Report of the Group’s Financial Report 2009 includes a discussion of SPEs.
7.3 Regulatory Securitization Framework
The Solvency Regulations, pursuant to Section 225 et seqq. SolvV, establish the regulatory capital calculation
rules for securitization positions. The SolvV also specifically defines a securitization transaction for regulatory
reporting and the capacity in which an institution could acquire a position and the appropriate capital requirement.
A securitization transaction is defined as a transaction in which payments depend on the performance of an
underlying pool of exposures and investments in the securitization are tranched. Tranching results in a ranking
among investments in the securitization. This determines the order and the amount of payments or losses to be
directed to the holder of the position, that is, the waterfall structure. A securitization position can be acquired in
various forms including investments in securitization tranches, derivative transactions for hedging interest rate and
currency risks included in the waterfall, liquidity facilities, credit enhancements, unfunded credit protection or
collateral for securitization tranches.
The current regulatory securitization framework requires the disclosure of banking book securitization positions
as well as interest rate and currency derivative transactions related to securitizations whether related to banking
or trading book.
Pillar 3 Report 7. Securitization
64
Regulatory Capital Calculation Methods
The methodologies applied to securitization positions for regulatory capital calculation purposes are defined in
the SolvV. For originator transactions, an IRBA rating system must be in place for the underlying pool, in order to
apply the IRBA securitization approach. If not in place, the securitization standardized approach is used. For
securitization positions resulting from sponsor or investor activities, IRBA eligibility is required.
Within the securitization IRBA the Group applies the ratings based approach (“RBA”) if public external ratings are
available. Eligible external issue ratings are taken from Standard & Poor’s, Moody’s and Fitch Ratings and in
some cases from DBRS. If more than one rating is available for a specific securitization position, the selection
criteria following a hierarchy structure as set forth in Section 236 et seqq. SolvV are applied to determine the
relevant risk weight for the capital calculation. The regulatory capital requirement for ABCP conduit securitization
positions is calculated using the internal assessment approach (“IAA”) for non-externally-rated exposure when
applicable. The Group has received approval from the BaFin to apply the IAA to approximately 80 % of its ABCP
conduit securitization exposure.
For securitization positions which do not have an eligible external rating or do not qualify for the IAA, the Group
applies the inferred ratings method according to Section 256 SolvV, or the supervisory formula approach (SFA),
according to Section 258 SolvV. In all other cases, the exposures are deducted from the Group’s own funds.
When applying the SFA, the Group estimates the risk parameters PD and LGD for the assets of the securitization
portfolio, by using its internally developed rating systems approved for such assets. In 2009 the Group developed
new rating systems for homogenous pools of assets to be applied to assets that have not been originated by the
Group. The rating systems are based on historical default and loss information from comparable assets. Risk
parameters PD and LGD are derived on risk pool level.
In situations where the standardized approach is applied for the capital calculation, the Group applies the RBA
using the standardized risk weights as defined in the regulatory securitization framework. Qualifying external
ratings are obtained from the rating agencies, Standard & Poor’s, Moody’s and Fitch Ratings and in some cases
from DBRS. The Group applies the alternative risk weight calculation to unrated securitization positions, as
outlined in Section 243 SolvV.
Regulatory Good Practice Guidelines
The European Banking Federation, the Association for Financial Markets in Europe (formerly London Investment
Banking Association), the European Savings Banks Group and the European Association of Public Banks and
Funding Agencies published the “Industry good practice guidelines on Pillar 3 disclosure requirements for securiti-
zation” in December 2008, which was slightly revised in 2009/2010. The Group’s Pillar 3 disclosures are materially
in compliance with these guidelines.
Pillar 3 Report 7. Securitization
65
7.4 Securitization Details
The amounts reported in the following tables are based on the regulatory securitization framework. These
amounts differ from, and are not directly comparable to, the amounts reported in the chapter Management Report,
“Special Purpose Entities” in the Group’s Financial Report 2009, in particular due to the differences in the respec-
tive consolidation principles discussed above.
The Group is only exposed to credit risks related to the exposures securitized, as shown below, to the extent it
has retained or purchased any of the related securitization positions and the risk of the retained or purchased
positions depends on the relative position in the waterfall of the securitization transaction.
The following tables detail the total outstanding exposure the Group has securitized in its capacity as an originator
through traditional or synthetic securitization transactions. The tables provide information on the underlying
securitization asset pool which was either originated from the Group’s balance sheet or acquired from third
parties. The amounts reported are either the carrying values as reported in the Group’s consolidated financial
statements, best estimates of their fair value or the current amount of underlying exposures outstanding. The
latter two are typically used in cases where the underlying asset pool is no longer recorded on the Group’s
balance sheet.
For sponsor relationships, the total outstanding exposures securitized reported in the tables below represent the
total outstanding exposure of the third party entities issuing the securities and other receivables. The Group’s
maximum exposure as of December 31, 2009 with regard to the € 237 billion exposures securitized shown under
the “sponsor” columns below was € 23.5 billion, excluding the Groups exposure also shown in the “originator”
columns. The remaining exposure is held by third parties. In 2008 the Group’s maximum exposure with regard to
€ 296 billion exposures securitized resulting from sponsoring activities amounted to € 35 billion, again excluding
the Group’s exposure also shown in the “originator” columns. The decrease resulted primarily from a reduction in
the exposure types of credit card receivables and consumer loans. The carrying values reported in the tables are
derived using information received from servicer reports of the third parties that the conduits have the relation-
ships with or, in certain instances, based on the Group’s best estimate of their value using a number of assump-
tions.
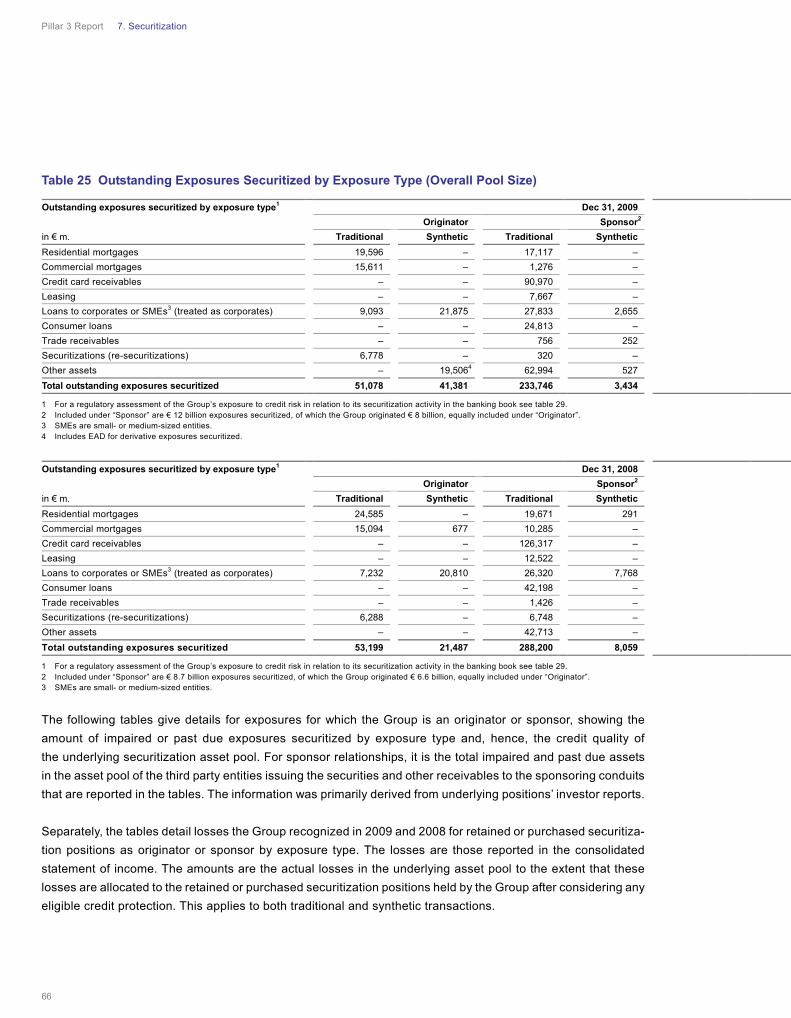
Pillar 3 Report 7. Securitization
66
Table 25 Outstanding Exposures Securitized by Exposure Type (Overall Pool Size)
1 For a regulatory assessment of the Group’s exposure to credit risk in relation to its securitization activity in the banking book see table 29. 2 Included under “Sponsor” are € 12 billion exposures securitized, of which the Group originated € 8 billion, equally included under “Originator”. 3 SMEs are small- or medium-sized entities. 4 Includes EAD for derivative exposures securitized.
1 For a regulatory assessment of the Group’s exposure to credit risk in relation to its securitization activity in the banking book see table 29. 2 Included under “Sponsor” are € 8.7 billion exposures securitized, of which the Group originated € 6.6 billion, equally included under “Originator”. 3 SMEs are small- or medium-sized entities.
The following tables give details for exposures for which the Group is an originator or sponsor, showing the
amount of impaired or past due exposures securitized by exposure type and, hence, the credit quality of
the underlying securitization asset pool. For sponsor relationships, it is the total impaired and past due assets
in the asset pool of the third party entities issuing the securities and other receivables to the sponsoring conduits
that are reported in the tables. The information was primarily derived from underlying positions’ investor reports.
Separately, the tables detail losses the Group recognized in 2009 and 2008 for retained or purchased securitiza-
tion positions as originator or sponsor by exposure type. The losses are those reported in the consolidated
statement of income. The amounts are the actual losses in the underlying asset pool to the extent that these
losses are allocated to the retained or purchased securitization positions held by the Group after considering any
eligible credit protection. This applies to both traditional and synthetic transactions.
Outstanding exposures securitized by exposure type1
Dec 31, 2009
Originator Sponsor2
in € m. Traditional Synthetic Traditional Synthetic
Residential mortgages 19,596 – 17,117 –
Commercial mortgages 15,611 – 1,276 –
Credit card receivables – – 90,970 –
Leasing – – 7,667 –
Loans to corporates or SMEs3 (treated as corporates) 9,093 21,875 27,833 2,655
Consumer loans – – 24,813 –
Trade receivables – – 756 252
Securitizations (re-securitizations) 6,778 – 320 –
Other assets – 19,5064 62,994 527
Total outstanding exposures securitized 51,078 41,381 233,746 3,434
Outstanding exposures securitized by exposure type1
Dec 31, 2008
Originator Sponsor2
in € m. Traditional Synthetic Traditional Synthetic
Residential mortgages 24,585 – 19,671 291
Commercial mortgages 15,094 677 10,285 –
Credit card receivables – – 126,317 –
Leasing – – 12,522 –
Loans to corporates or SMEs3 (treated as corporates) 7,232 20,810 26,320 7,768
Consumer loans – – 42,198 –
Trade receivables – – 1,426 –
Securitizations (re-securitizations) 6,288 – 6,748 –
Other assets – – 42,713 –
Total outstanding exposures securitized 53,199 21,487 288,200 8,059
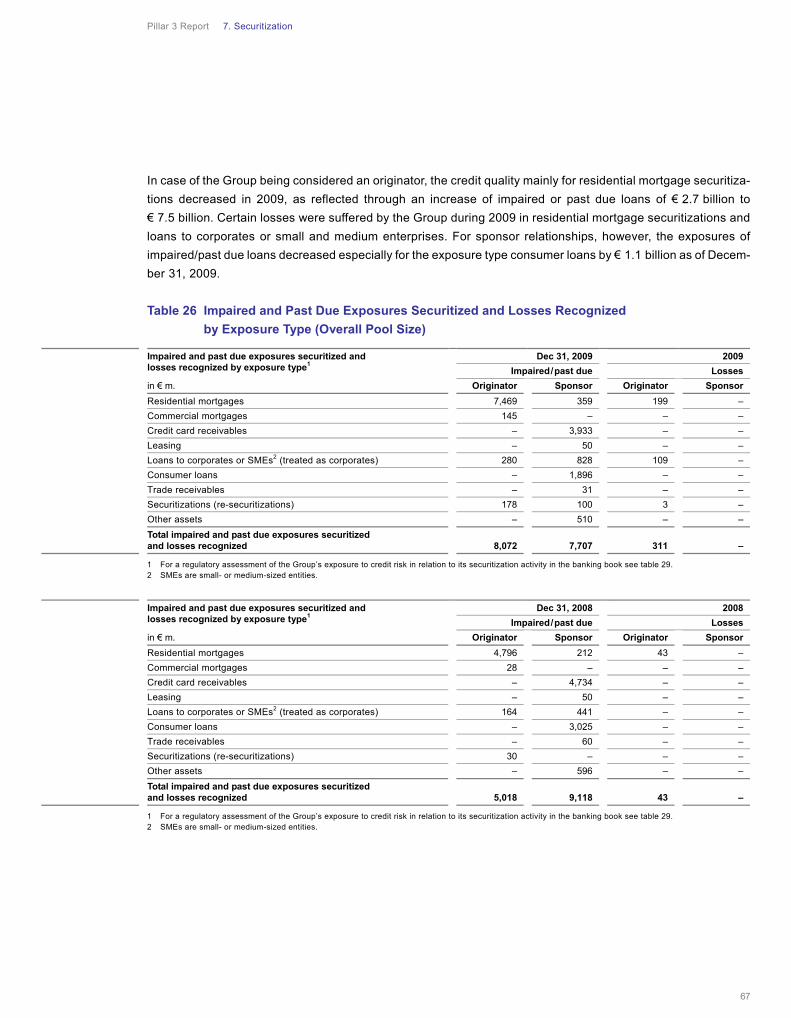
Pillar 3 Report 7. Securitization
67
In case of the Group being considered an originator, the credit quality mainly for residential mortgage securitiza-
tions decreased in 2009, as reflected through an increase of impaired or past due loans of € 2.7 billion to
€ 7.5 billion. Certain losses were suffered by the Group during 2009 in residential mortgage securitizations and
loans to corporates or small and medium enterprises. For sponsor relationships, however, the exposures of
impaired/past due loans decreased especially for the exposure type consumer loans by € 1.1 billion as of Decem-
ber 31, 2009.
Table 26 Impaired and Past Due Exposures Securitized and Losses Recognized
by Exposure Type (Overall Pool Size)
1 For a regulatory assessment of the Group’s exposure to credit risk in relation to its securitization activity in the banking book see table 29. 2 SMEs are small- or medium-sized entities.
1 For a regulatory assessment of the Group’s exposure to credit risk in relation to its securitization activity in the banking book see table 29. 2 SMEs are small- or medium-sized entities.
Impaired and past due exposures securitized and losses recognized by exposure type1
Dec 31, 2009 2009
Impaired/past due Losses
in € m. Originator Sponsor Originator Sponsor
Residential mortgages 7,469 359 199 –
Commercial mortgages 145 – – –
Credit card receivables – 3,933 – –
Leasing – 50 – –
Loans to corporates or SMEs2 (treated as corporates) 280 828 109 –
Consumer loans – 1,896 – –
Trade receivables – 31 – –
Securitizations (re-securitizations) 178 100 3 –
Other assets – 510 – –
Total impaired and past due exposures securitized and losses recognized 8,072 7,707 311 –
Impaired and past due exposures securitized and losses recognized by exposure type1
Dec 31, 2008 2008
Impaired/past due Losses
in € m. Originator Sponsor Originator Sponsor
Residential mortgages 4,796 212 43 –
Commercial mortgages 28 – – –
Credit card receivables – 4,734 – –
Leasing – 50 – –
Loans to corporates or SMEs2 (treated as corporates) 164 441 – –
Consumer loans – 3,025 – –
Trade receivables – 60 – –
Securitizations (re-securitizations) 30 – – –
Other assets – 596 – –
Total impaired and past due exposures securitized and losses recognized 5,018 9,118 43 –
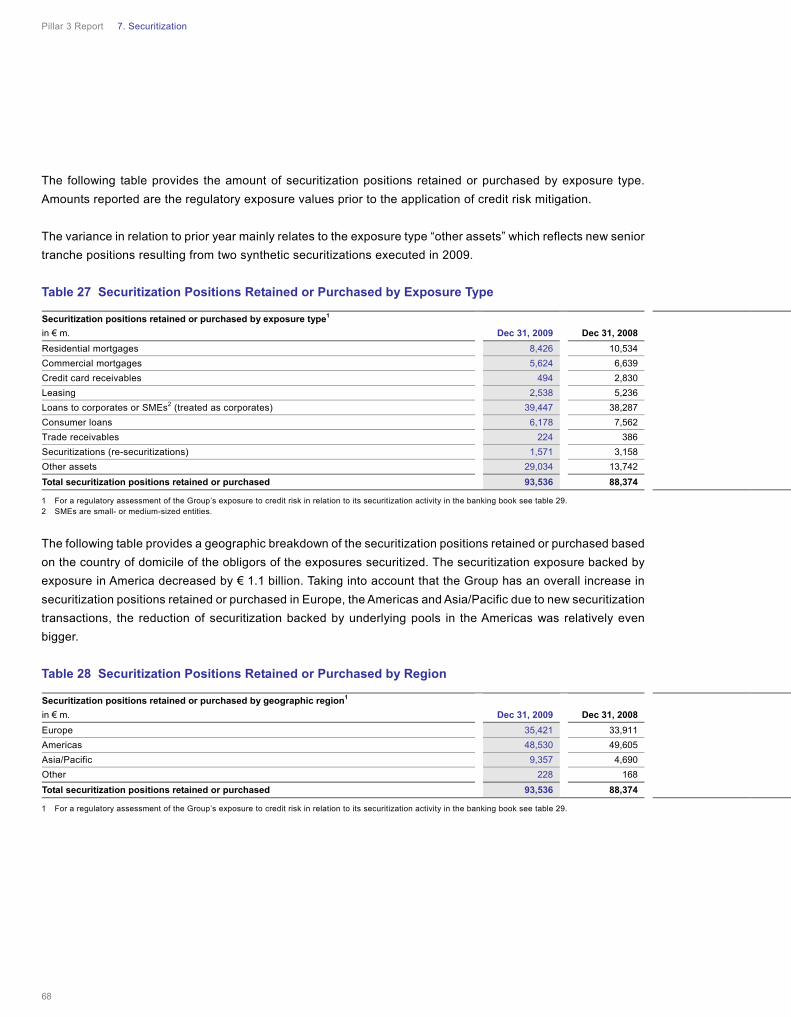
Pillar 3 Report 7. Securitization
68
The following table provides the amount of securitization positions retained or purchased by exposure type.
Amounts reported are the regulatory exposure values prior to the application of credit risk mitigation.
The variance in relation to prior year mainly relates to the exposure type “other assets” which reflects new senior
tranche positions resulting from two synthetic securitizations executed in 2009.
Table 27 Securitization Positions Retained or Purchased by Exposure Type
1 For a regulatory assessment of the Group’s exposure to credit risk in relation to its securitization activity in the banking book see table 29. 2 SMEs are small- or medium-sized entities.
The following table provides a geographic breakdown of the securitization positions retained or purchased based
on the country of domicile of the obligors of the exposures securitized. The securitization exposure backed by
exposure in America decreased by € 1.1 billion. Taking into account that the Group has an overall increase in
securitization positions retained or purchased in Europe, the Americas and Asia/Pacific due to new securitization
transactions, the reduction of securitization backed by underlying pools in the Americas was relatively even
bigger.
Table 28 Securitization Positions Retained or Purchased by Region
1 For a regulatory assessment of the Group’s exposure to credit risk in relation to its securitization activity in the banking book see table 29.
Securitization positions retained or purchased by exposure type1
in € m. Dec 31, 2009 Dec 31, 2008
Residential mortgages 8,426 10,534
Commercial mortgages 5,624 6,639
Credit card receivables 494 2,830
Leasing 2,538 5,236
Loans to corporates or SMEs2 (treated as corporates) 39,447 38,287
Consumer loans 6,178 7,562
Trade receivables 224 386
Securitizations (re-securitizations) 1,571 3,158
Other assets 29,034 13,742
Total securitization positions retained or purchased 93,536 88,374
Securitization positions retained or purchased by geographic region1
in € m. Dec 31, 2009 Dec 31, 2008
Europe 35,421 33,911
Americas 48,530 49,605
Asia/Pacific 9,357 4,690
Other 228 168
Total securitization positions retained or purchased 93,536 88,374
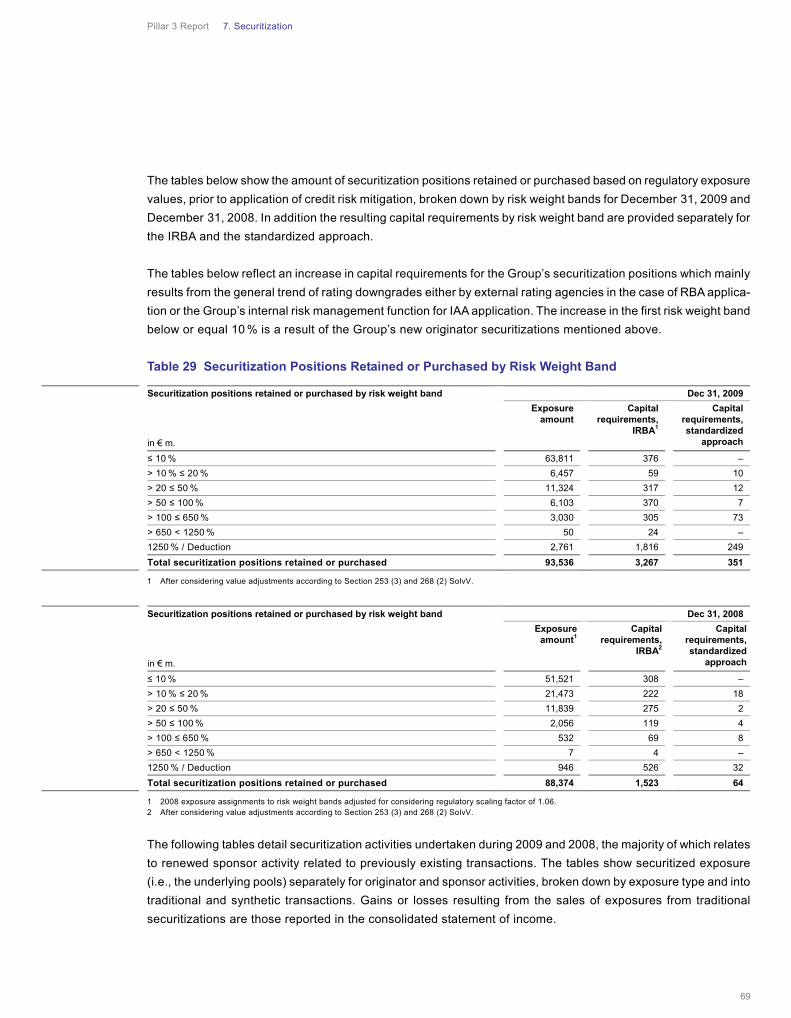
Pillar 3 Report 7. Securitization
69
The tables below show the amount of securitization positions retained or purchased based on regulatory exposure
values, prior to application of credit risk mitigation, broken down by risk weight bands for December 31, 2009 and
December 31, 2008. In addition the resulting capital requirements by risk weight band are provided separately for
the IRBA and the standardized approach.
The tables below reflect an increase in capital requirements for the Group’s securitization positions which mainly
results from the general trend of rating downgrades either by external rating agencies in the case of RBA applica-
tion or the Group’s internal risk management function for IAA application. The increase in the first risk weight band
below or equal 10 % is a result of the Group’s new originator securitizations mentioned above.
Table 29 Securitization Positions Retained or Purchased by Risk Weight Band
1 After considering value adjustments according to Section 253 (3) and 268 (2) SolvV.
1 2008 exposure assignments to risk weight bands adjusted for considering regulatory scaling factor of 1.06. 2 After considering value adjustments according to Section 253 (3) and 268 (2) SolvV.
The following tables detail securitization activities undertaken during 2009 and 2008, the majority of which relates
to renewed sponsor activity related to previously existing transactions. The tables show securitized exposure
(i.e., the underlying pools) separately for originator and sponsor activities, broken down by exposure type and into
traditional and synthetic transactions. Gains or losses resulting from the sales of exposures from traditional
securitizations are those reported in the consolidated statement of income.
Securitization positions retained or purchased by risk weight band
in € m.
Dec 31, 2009
Exposure amount
Capital requirements,
IRBA1
Capital requirements, standardized
approach
≤ 10 % 63,811 376 –
> 10 % ≤ 20 % 6,457 59 10
> 20 ≤ 50 % 11,324 317 12
> 50 ≤ 100 % 6,103 370 7
> 100 ≤ 650 % 3,030 305 73
> 650 < 1250 % 50 24 –
1250 % / Deduction 2,761 1,816 249
Total securitization positions retained or purchased 93,536 3,267 351
Securitization positions retained or purchased by risk weight band
in € m.
Dec 31, 2008
Exposure amount1
Capital requirements,
IRBA2
Capital requirements, standardized
approach
≤ 10 % 51,521 308 –
> 10 % ≤ 20 % 21,473 222 18
> 20 ≤ 50 % 11,839 275 2
> 50 ≤ 100 % 2,056 119 4
> 100 ≤ 650 % 532 69 8
> 650 < 1250 % 7 4 –
1250 % / Deduction 946 526 32
Total securitization positions retained or purchased 88,374 1,523 64
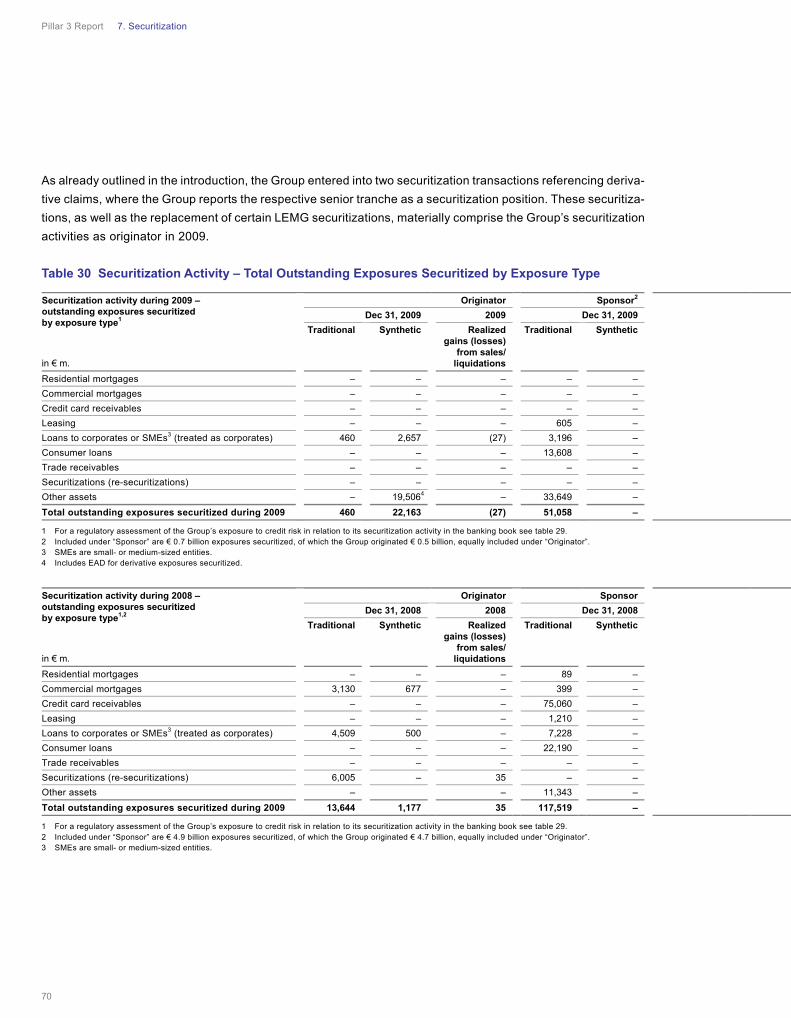
Pillar 3 Report 7. Securitization
70
As already outlined in the introduction, the Group entered into two securitization transactions referencing deriva-
tive claims, where the Group reports the respective senior tranche as a securitization position. These securitiza-
tions, as well as the replacement of certain LEMG securitizations, materially comprise the Group’s securitization
activities as originator in 2009.
Table 30 Securitization Activity – Total Outstanding Exposures Securitized by Exposure Type
1 For a regulatory assessment of the Group’s exposure to credit risk in relation to its securitization activity in the banking book see table 29. 2 Included under “Sponsor” are € 0.7 billion exposures securitized, of which the Group originated € 0.5 billion, equally included under “Originator”. 3 SMEs are small- or medium-sized entities. 4 Includes EAD for derivative exposures securitized.
1 For a regulatory assessment of the Group’s exposure to credit risk in relation to its securitization activity in the banking book see table 29. 2 Included under “Sponsor” are € 4.9 billion exposures securitized, of which the Group originated € 4.7 billion, equally included under “Originator”. 3 SMEs are small- or medium-sized entities.
Securitization activity during 2009 – outstanding exposures securitized by exposure type1
in € m.
Originator Sponsor2
Dec 31, 2009 2009 Dec 31, 2009
Traditional Synthetic Realized gains (losses)
from sales/liquidations
Traditional Synthetic
Residential mortgages – – – – –
Commercial mortgages – – – – –
Credit card receivables – – – – –
Leasing – – – 605 –
Loans to corporates or SMEs3 (treated as corporates) 460 2,657 (27) 3,196 –
Consumer loans – – – 13,608 –
Trade receivables – – – – –
Securitizations (re-securitizations) – – – – –
Other assets – 19,5064 – 33,649 –
Total outstanding exposures securitized during 2009 460 22,163 (27) 51,058 –
Securitization activity during 2008 – outstanding exposures securitized by exposure type1,2
in € m.
Originator Sponsor
Dec 31, 2008 2008 Dec 31, 2008
Traditional Synthetic Realized gains (losses)
from sales/liquidations
Traditional Synthetic
Residential mortgages – – – 89 –
Commercial mortgages 3,130 677 – 399 –
Credit card receivables – – – 75,060 –
Leasing – – – 1,210 –
Loans to corporates or SMEs3 (treated as corporates) 4,509 500 – 7,228 –
Consumer loans – – – 22,190 –
Trade receivables – – – – –
Securitizations (re-securitizations) 6,005 – 35 – –
Other assets – – 11,343 –
Total outstanding exposures securitized during 2009 13,644 1,177 35 117,519 –
Pillar 3 Report 8. Trading Market Risk
71
The vast majority of the Group’s businesses are subject to market risk, defined as the potential for change in the
market value of the Group’s trading and investing positions. Risk can arise from adverse changes in interest rates,
credit spreads, foreign exchange rates, equity prices, commodity prices and other relevant parameters, such as
market volatility.
The primary objective of Market Risk Management is to ensure that the Group’s business units optimize the risk-
reward relationship and do not expose it to unacceptable losses. To achieve this objective, Market Risk Manage-
ment works closely together with risk takers (the business units) and other control and support groups.
The Group differentiates between two substantially different types of market risk:
— Trading market risk arises primarily through the market-making activities of the Corporate and Investment
Bank division. This involves taking positions in debt, equity, foreign exchange, other securities and commodi-
ties as well as in equivalent derivatives.
— Nontrading market risk in the form of equity risk arises primarily from non-consolidated strategic investments in
the Corporate Investment portfolio, alternative asset investments and equity compensation. Interest risk stems
from the Group’s nontrading asset and liability positions. Other nontrading market risk elements are risks aris-
ing from asset management and fund related activities, pension risks as well as model risks in PBC, GTB and
PWM, which are derived by shocking assumptions on client behavior in combination with interest rate move-
ments. In addition foreign currency risks may arise from capital and retained earnings positions held in non-
euro currencies for those currencies for which hedge exemptions are in place.
Trading Market Risk Management Framework
The Group’s primary instrument to manage trading market risk is the limit setting process. The Group’s Manage-
ment Board, supported by Market Risk Management, which is part of the Group’s independent legal, risk & capital
function, sets a Group-wide value-at-risk and economic capital limits for the market risk in the trading book.
Market Risk Management sub-allocates this overall limit to the group divisions (e.g., Global Markets and Corpo-
rate Finance) and individual business areas (e.g., Global Rates, Global Markets Equity, etc.) based on anticipated
business plans and risk appetite. Within the individual business areas, the business heads or Chief Operating
Officers may establish business limits by sub-allocating the Market Risk Management limit down to individual
portfolios or geographical regions.
Value-at-risk and economic capital limits are not sufficient for managing all types of market risk on their own.
In addition, Market Risk Management operates sensitivity and concentration/liquidity limits. A distinction is made
between Market Risk Management limits and business limits for sensitivities and concentration/liquidity. In prac-
tice, the Market Risk Management limits are likely to be a relatively small number of key limits necessary to
capture an exposure to a particular risk factor and will tend to be global in nature rather than for any particular
geographical region.
8. Trading Market Risk

Pillar 3 Report 8. Trading Market Risk
72
To manage the exposures inside the limits, the risk takers apply several risk mitigating measures, most notably
the use of:
— Diversification effects. Diversification is a portfolio strategy designed to reduce exposure by combining a
variety of positions. Because some investments rise in value while others decline, diversification can help to
lower the overall level of risk for a given portfolio.
— Hedging. Hedging involves taking positions in related securities, including derivative products, such as futures,
swaps and options. Hedging activities may not always provide effective mitigation against losses due to differ-
ences in the terms, specific characteristics or other basis risks that may exist between the hedge instrument
and the exposure being hedged.
Trading Market Risk Management: Refined Framework and De-risking Discipline in 2009
In 2009, Market Risk Management implemented new processes to improve the monitoring and reporting of key
risks. These processes included creating a list of exposures which had been targeted for de-risking. The identifi-
cation of such positions was guided by a four step de-risking framework:
Reduce risk concentrations:
— Adapt position size to liquidity environment
— Invest in unwinding most illiquid risk positions
Continued use of active hedging:
— Active program of macro hedging
— Improve hedging efficiency of individual strategies
De-lever balance sheet:
— Manage down gross and net exposure
— Align market risk appetite to new balance sheet and leverage targets
Reduce uncertainty:
— Avoid exposure to difficult to value products
— Reduce reliance on complex, highly structured products

Pillar 3 Report 8. Trading Market Risk
73
As a result of the continued focus, the majority of these key exposures have been reduced to appropriate levels.
For a minority of exposures, de-risking progress has been slowed by the current market conditions, and potential
for future loss remains. Action has been taken to reduce this potential. The positions have been segregated from
the ‘Ongoing’ trading books, and are managed in separate ‘Legacy’ books. Hedges have also been purchased to
limit the downside risk. The Group continues to seek and take market opportunities to reduce these risks.
The plan was part of a wider recalibration of the business model. This aims to increase the proportion of revenues
earned from the most liquid flow markets, and to reduce reliance on exotic and structured businesses which may
lack liquidity.
Quantitative Risk Management Tools
Value-at-Risk
Value-at-risk is a quantitative measure of the potential loss (in value) of trading positions due to market move-
ments that will not be exceeded in a defined period of time and with a defined confidence level.
The Group’s value-at-risk for the trading businesses is based on its own internal value-at-risk model. In Octo-
ber 1998, the German Banking Supervisory Authority (now the BaFin) approved the internal value-at-risk model
for calculating the regulatory market risk capital for the Group’s general and specific market risks. Since then the
model has been periodically refined and approval has been maintained.
The Group calculates value-at-risk using a 99 % confidence level and a holding period of one day. This means
the Group estimates that there is a 1 in 100 chance that a mark-to-market loss from the Group’s trading positions
will be at least as large as the reported value-at-risk. For regulatory reporting, the holding period is ten days.
The Group uses historical market data to estimate value-at-risk, with an equally-weighted 261 trading day history.
The calculation employs a Monte Carlo simulation technique, and the Group assumes that changes in risk factors
follow a certain distribution, e.g., normal or logarithmic normal distribution. To determine the Group’s aggregated
value-at-risk, the Group uses observed correlations between the risk factors during this 261 trading day period.
Pillar 3 Report 8. Trading Market Risk
74
The Group’s value-at-risk model is designed to take into account the following risk factors: interest rates, credit
spreads, equity prices, foreign exchange rates and commodity prices, as well as their implied volatilities and
common basis risk. The model incorporates both linear and, especially for derivatives, nonlinear effects of the risk
factors on the portfolio value.
The value-at-risk measure enables the Group to apply a constant and uniform measure across all of the Group’s
trading businesses and products. It allows a comparison of risk in different businesses, and also provides a
means of aggregating and netting positions within a portfolio to reflect correlations and offsets between different
asset classes. Furthermore, it facilitates comparisons of the Group’s market risk both over time and against the
daily trading results.
When using value-at-risk estimates a number of considerations should be taken into account. The model is
subject to known limitations, many of which manifested themselves in 2008, resulting in a high number of outliers.
These include the following:
— The use of historical data may not be a good indicator of potential future events, particularly those that are
extreme in nature. This ‘backward-looking’ limitation can cause value-at-risk to understate risk (as in 2008),
but can also cause it to be overstated. In 2009 the Group observed fewer outliers than would be predicted by
the model. In a strict statistical sense, the value-at-risk in 2009 was over-conservative, and had over-estimated
the risk in the trading books. As discussed, the Group’s value-at-risk model bases estimates of future volatility
on market data observed over the previous year. For much of 2009, this estimate incorporated the extreme
market volatility observed in the fourth quarter of 2008 following the bankruptcy of Lehman Brothers. As
markets normalized in 2009, estimated volatility exceeded actual volatility, and fewer outliers occurred than
expected.
— Assumptions concerning the distribution of changes in risk factors, and the correlation between different risk
factors, may not hold true, particularly during market events that are extreme in nature. While the Group
believes its assumptions are reasonable, there is no standard value-at-risk methodology to follow. Different
assumptions would produce different results.
— The one day holding period does not fully capture the market risk arising during periods of illiquidity, when
positions cannot be closed out or hedged within one day
— Value-at-risk does not indicate the potential loss beyond the 99th quantile
— Intra-day risk is not captured
— Although the Group considers the material risks to be covered by the Group’s value-at-risk model and the
Group further enhance it, there still may be risks in the trading book that are not covered by the value-at-risk
model.

Pillar 3 Report 8. Trading Market Risk
75
The Group continuously analyzes potential weaknesses of the Group’s value-at-risk model using statistical
techniques such as back-testing, but also rely on risk management experience and expert opinion. Back-testing
provides an analysis of the predictive power of the value-at-risk calculations based on actual experience. The
Group compares the hypothetical daily profits and losses under the buy-and-hold assumption (in accordance with
German regulatory requirements) with the estimates from the Group’s value-at-risk model.
A committee, chaired by Market Risk Management and with participation from Market Risk Operations, Risk
Analytics and Instruments, and Finance and others, meets on a quarterly basis to discuss back-testing results of
the Group as a whole and of individual businesses. The committee analyzes performance fluctuations and
assesses the predictive power of the value-at-risk model, which in turn allows the Group to improve the risk
estimation process.
The Group is committed to the ongoing development of its proprietary risk models, and allocates substantial
resources to reviewing and improving them. Special attention is given to improving those parts of the value-at-risk
model that relate to the areas where losses have been experienced in the recent past. During 2008 and 2009,
significant methodology improvements were made to the value-at-risk calculation, including the following:
— Introduction of option-adjusted spread sensitivity for mortgage backed securities. This measure of credit
spread more accurately captures prepayment risk, which arises from mortgage holders’ option to prepay their
mortgage if interest rates fall
— Introduction of credit spread implied volatility sensitivity
— Inclusion of basis risk between different money market instruments and swaps based on them
— Inclusion of basis risk between credit default spreads and bond spreads
Economic Capital for Market Risk
As for other risk categories, economic capital for market risk measures the amount of capital the Group needs to
absorb very severe unexpected losses arising from the Group’s exposures. “Very severe” in this context means
that economic capital is set at a level to cover with a probability of 99.98 % the aggregated unexpected losses
within one year.
Some firms calculate economic capital for market risk using their value-at-risk model, by applying a higher confi-
dence level and longer holding period. A key limitation of this approach is that value-at-risk models are based
on relatively recent historical data, and therefore typically only reflect losses under normal market conditions. To
address this, the Group calculates economic capital using stress tests and scenario analyses. The stress tests
are derived from historically observed severe market shocks. The resulting losses from these stress scenarios
are then aggregated using correlations observed during periods of market crises, to reflect the increase in correla-
tions which occurs during severe downturns.

Pillar 3 Report 8. Trading Market Risk
76
The stress tests are augmented by subjective assessments where only limited historical data is available, or where
market developments are viewed to make historical data a poor indicator of possible future market scenarios.
The calculation of economic capital for market risk from the trading units is performed weekly. The model incorpo-
rates the following risk factors: interest rates, credit spreads, equity prices, foreign exchange rates and commodity
prices. Volatility, credit correlation and common basis risks are also captured.
During the course of 2009 the economic capital stress tests were recalibrated to reflect the extreme market
moves observed in the later part of 2008. This included extension of the assumed holding periods on credit
positions, and significant increases to the shocks applied to equity indices and credit spreads, especially for
securitized products.
In addition to the recalibration, there were improvements to the economic capital model. These included the
addition of stress tests for leveraged exchange traded funds and for gap risk in non-recourse finance in emerging
markets.
The Group’s stress testing results and economic capital estimations are necessarily limited by the number of
stress tests executed and the fact that not all downside scenarios can be predicted and simulated. While the
Group’s risk managers have used their best judgment to define worst case scenarios based upon the knowledge
of past extreme market moves, it is possible for the market risk positions to lose more value than even the
Group’s economic capital estimates. The Group also continuously assesses and refines its stress tests in an
effort to ensure they capture material risks as well as reflect possible extreme market moves.
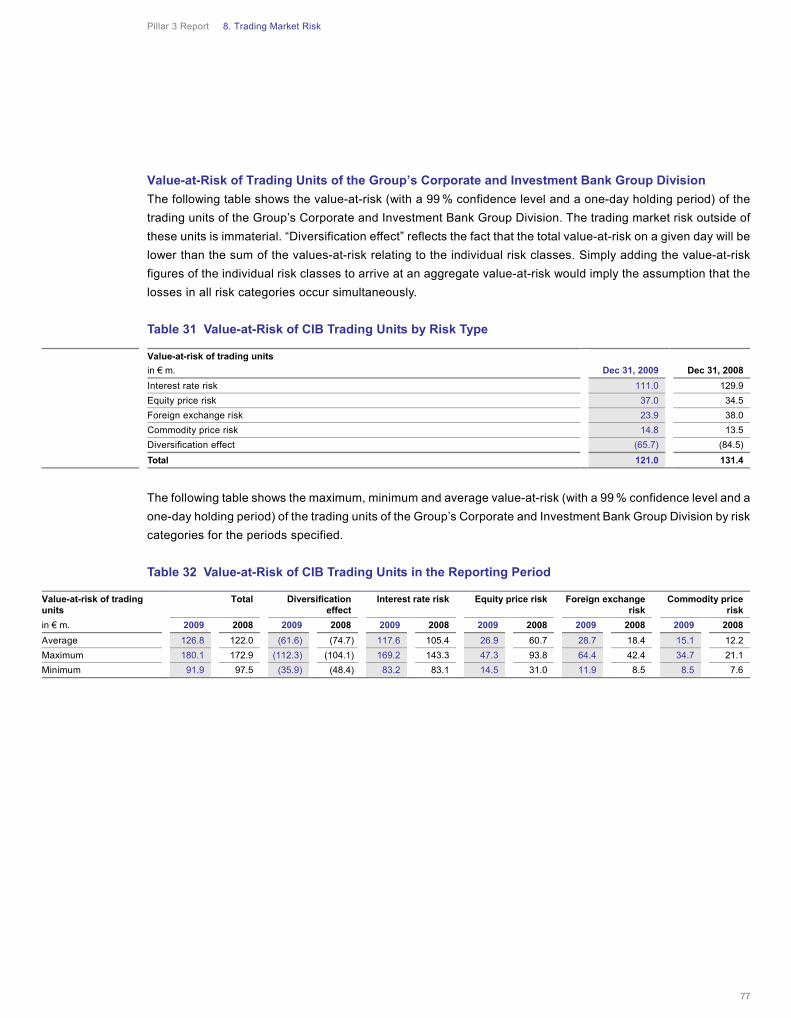
Pillar 3 Report 8. Trading Market Risk
77
Value-at-Risk of Trading Units of the Group’s Corporate and Investment Bank Group Division
The following table shows the value-at-risk (with a 99 % confidence level and a one-day holding period) of the
trading units of the Group’s Corporate and Investment Bank Group Division. The trading market risk outside of
these units is immaterial. “Diversification effect” reflects the fact that the total value-at-risk on a given day will be
lower than the sum of the values-at-risk relating to the individual risk classes. Simply adding the value-at-risk
figures of the individual risk classes to arrive at an aggregate value-at-risk would imply the assumption that the
losses in all risk categories occur simultaneously.
Table 31 Value-at-Risk of CIB Trading Units by Risk Type
The following table shows the maximum, minimum and average value-at-risk (with a 99 % confidence level and a
one-day holding period) of the trading units of the Group’s Corporate and Investment Bank Group Division by risk
categories for the periods specified.
Table 32 Value-at-Risk of CIB Trading Units in the Reporting Period
Value-at-risk of trading units
in € m. Dec 31, 2009 Dec 31, 2008
Interest rate risk 111.0 129.9
Equity price risk 37.0 34.5
Foreign exchange risk 23.9 38.0
Commodity price risk 14.8 13.5
Diversification effect (65.7) (84.5)
Total 121.0 131.4
Value-at-risk of trading units
Total Diversification effect
Interest rate risk Equity price risk Foreign exchange risk
Commodity price risk
in € m. 2009 2008 2009 2008 2009 2008 2009 2008 2009 2008 2009 2008
Average 126.8 122.0 (61.6) (74.7) 117.6 105.4 26.9 60.7 28.7 18.4 15.1 12.2
Maximum 180.1 172.9 (112.3) (104.1) 169.2 143.3 47.3 93.8 64.4 42.4 34.7 21.1
Minimum 91.9 97.5 (35.9) (48.4) 83.2 83.1 14.5 31.0 11.9 8.5 8.5 7.6
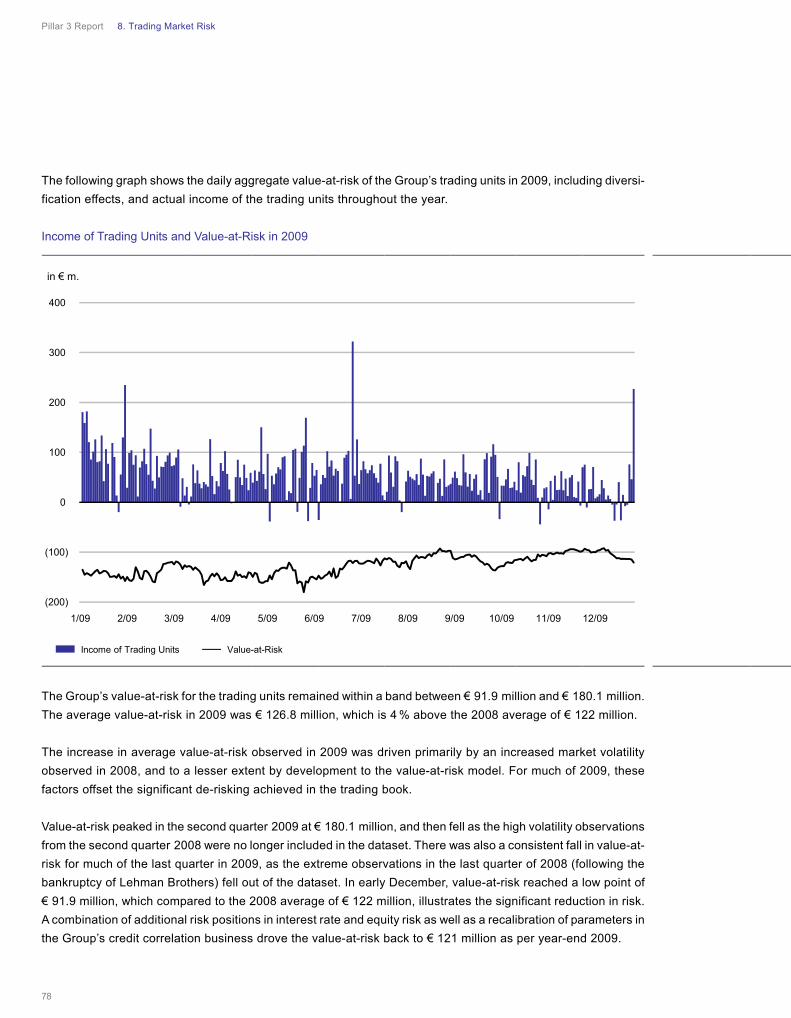
Pillar 3 Report 8. Trading Market Risk
78
The following graph shows the daily aggregate value-at-risk of the Group’s trading units in 2009, including diversi-
fication effects, and actual income of the trading units throughout the year.
Income of Trading Units and Value-at-Risk in 2009
The Group’s value-at-risk for the trading units remained within a band between € 91.9 million and € 180.1 million.
The average value-at-risk in 2009 was € 126.8 million, which is 4 % above the 2008 average of € 122 million.
The increase in average value-at-risk observed in 2009 was driven primarily by an increased market volatility
observed in 2008, and to a lesser extent by development to the value-at-risk model. For much of 2009, these
factors offset the significant de-risking achieved in the trading book.
Value-at-risk peaked in the second quarter 2009 at € 180.1 million, and then fell as the high volatility observations
from the second quarter 2008 were no longer included in the dataset. There was also a consistent fall in value-at-
risk for much of the last quarter in 2009, as the extreme observations in the last quarter of 2008 (following the
bankruptcy of Lehman Brothers) fell out of the dataset. In early December, value-at-risk reached a low point of
€ 91.9 million, which compared to the 2008 average of € 122 million, illustrates the significant reduction in risk.
A combination of additional risk positions in interest rate and equity risk as well as a recalibration of parameters in
the Group’s credit correlation business drove the value-at-risk back to € 121 million as per year-end 2009.
in € m.
Income of Trading Units Value-at-Risk
(200)
(100)
0
100
200
300
400
1/09 2/09 3/09 4/09 5/09 6/09 7/09 8/09 9/09 10/09 11/09 12/09
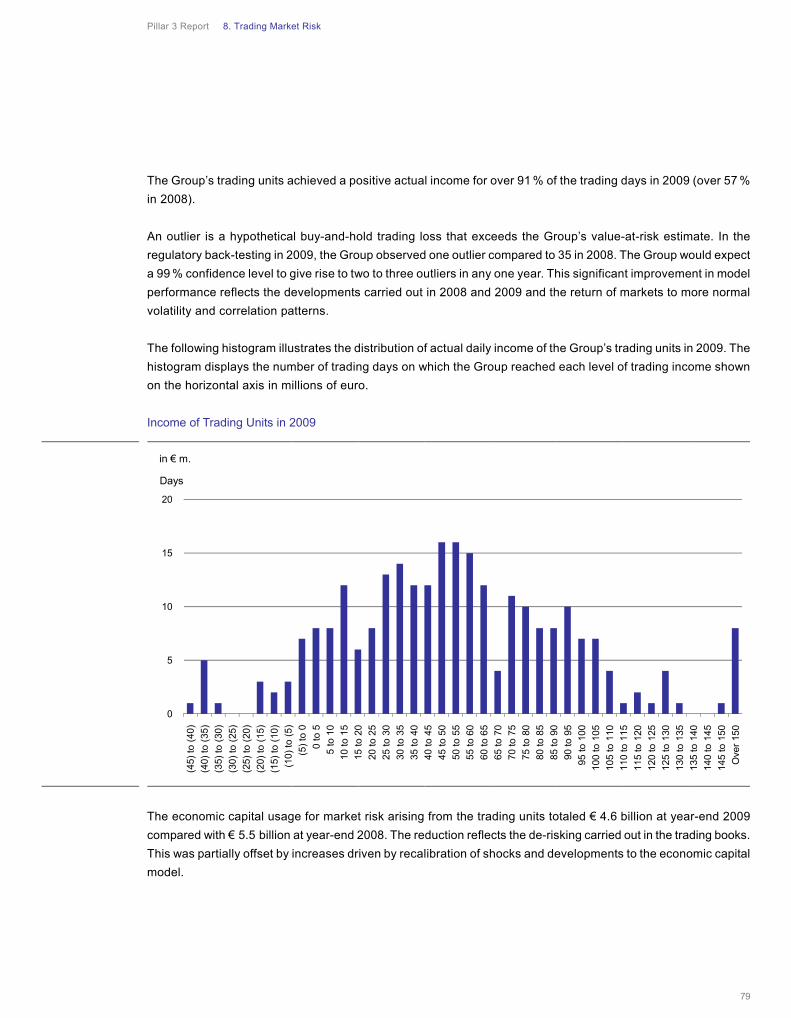
Pillar 3 Report 8. Trading Market Risk
79
The Group’s trading units achieved a positive actual income for over 91 % of the trading days in 2009 (over 57 %
in 2008).
An outlier is a hypothetical buy-and-hold trading loss that exceeds the Group’s value-at-risk estimate. In the
regulatory back-testing in 2009, the Group observed one outlier compared to 35 in 2008. The Group would expect
a 99 % confidence level to give rise to two to three outliers in any one year. This significant improvement in model
performance reflects the developments carried out in 2008 and 2009 and the return of markets to more normal
volatility and correlation patterns.
The following histogram illustrates the distribution of actual daily income of the Group’s trading units in 2009. The
histogram displays the number of trading days on which the Group reached each level of trading income shown
on the horizontal axis in millions of euro.
Income of Trading Units in 2009
The economic capital usage for market risk arising from the trading units totaled € 4.6 billion at year-end 2009
compared with € 5.5 billion at year-end 2008. The reduction reflects the de-risking carried out in the trading books.
This was partially offset by increases driven by recalibration of shocks and developments to the economic capital
model.
in € m.
0
5
10
15
20
(45)
to (
40)
(40)
to (
35)
(35)
to (
30)
(30)
to (
25)
(25)
to (
20)
(20)
to (
15)
(15)
to (
10)
(10)
to (
5)
(5)
to 0
0 to
5
5 to
10
10 to
15
15 to
20
20 to
25
25 to
30
30 to
35
35 to
40
40 to
45
45 to
50
50 to
55
55 to
60
60 to
65
65 to
70
70 to
75
75 to
80
80 to
85
85 to
90
90 to
95
95 to
100
100
to 1
05
105
to 1
10
110
to 1
15
115
to 1
20
120
to 1
25
125
to 1
30
130
to 1
35
135
to 1
40
140
to 1
45
145
to 1
50
Ove
r 15
0
Days

Pillar 3 Report 8. Trading Market Risk
80
Valuation of Market Risk Positions
A substantial percentage of the Group’s financial assets and liabilities carried at fair value are based on, or
derived from, observable prices or inputs. The availability of observable prices or inputs varies by product and
market, and may change over time. For example, observable prices or inputs are usually available for: liquid
securities; exchange traded derivatives; over the counter (OTC) derivatives transacted in liquid trading markets
such as interest rate swaps, foreign exchange forward and option contracts in G7 currencies; and equity swap and
option contracts on listed securities or indices. If observable prices or inputs are available, they are utilized in the
determination of fair value and, as such, fair value can be determined without significant judgment. This includes
instruments for which the fair value is derived from a valuation model that is standard across the industry and the
inputs are directly observable. This is the case for many generic swap and option contracts.
In other markets or for certain instruments, observable prices or inputs are not available, and fair value is deter-
mined using valuation techniques appropriate for the particular instrument. For example, instruments subject to
valuation techniques include: trading loans and other loans or loan commitments designated at fair value through
profit or loss, under the fair value option; new, complex and long-dated OTC derivatives; transactions in immature
or limited markets; distressed debt securities and loans; private equity securities and retained interests in securiti-
zations of financial assets. The application of valuation techniques to determine fair value involves estimation and
management judgment, the extent of which will vary with the degree of complexity and liquidity in the market.
Valuation techniques include industry standard models based on discounted cash flow analysis, which are depen-
dent upon estimated future cash flows and the discount rate used. For more complex products, the valuation
models include more complex modeling techniques, parameters and assumptions, such as volatility, correlation,
prepayment speeds, default rates and loss severity. Management judgment is required in the selection and
application of the appropriate parameters, assumptions and modeling techniques. Because the objective of using
a valuation technique is to establish the price at which market participants would currently transact, the valuation
techniques incorporate all factors that the Group believes market participants would consider in setting a trans-
action price.
Valuation adjustments are an integral part of the fair value process that requires the exercise of judgment. In
making appropriate valuation adjustments, the Group follows methodologies that consider factors such as bid-
offer spread valuation adjustments, liquidity, and credit risk (both counterparty credit risk in relation to financial
assets and the Group’s own credit risk in relation to financial liabilities) which are at fair value through profit or
loss.
Pillar 3 Report 8. Trading Market Risk
81
The fair value of the Group’s financial liabilities which are at fair value through profit or loss (e.g., OTC derivative
liabilities and structured note liabilities designated at fair value through profit or loss) incorporates the change in
the Group’s own credit risk of the financial liability. For derivative liabilities the Group considers its own creditwor-
thiness by assessing all counterparties’ potential future exposure to us, taking into account any collateral held, the
effect of any master netting agreements, expected loss given default and the Group’s own credit risk based on
historic default levels. The change in the Group’s own credit risk for structured note liabilities is calculated
by discounting the contractual cash flows of the instrument using the rate at which similar instruments would be
issued at the measurement date. The resulting fair value is an estimate of the price at which the specific liability
would be exchanged at the measurement date with another market participant.
Under IFRS, if there are significant unobservable inputs used in the valuation technique as of the trade date the
financial instrument is recognized at the transaction price and any trade date profit is deferred. Management
judgment is required in determining whether there exist significant unobservable inputs in the valuation technique.
Once deferred the decision to subsequently recognize the trade date profit requires a careful assessment of the
then current facts and circumstances supporting observability of parameters and/or risk mitigation.
The Group has established internal control procedures over the valuation process to provide assurance over the
appropriateness of the fair values applied. If fair value is determined by valuation models, the assumptions and
techniques within the models are independently validated by a specialist group. Price and parameter inputs,
assumptions and valuation adjustments are subject to verification and review processes. If the price and parame-
ter inputs are observable, they are verified against independent sources.
If prices and parameter inputs or assumptions are not observable, the appropriateness of fair value is subject to
additional procedures to assess its reasonableness. Such procedures include performing revaluations using
independently generated models, assessing the valuations against appropriate proxy instruments, performing
sensitivity analysis and extrapolation techniques, and considering other benchmarks. Assessment is made as to
whether the valuation techniques yield fair value estimates that are reflective of the way the market operates by
calibrating the results of the valuation models against market transactions. These procedures require the applica-
tion of management judgment.
Other valuation controls include review and analysis of daily profit and loss, validation of valuation through close
out profit and loss and value-at-risk back-testing.
Pillar 3 Report 9. Nontrading Market Risk
82
9.1 Equity Investments in the Banking Book
Equity investments which are neither consolidated for regulatory purposes nor deducted from the Group’s own
funds are held as equity positions in the regulatory banking book. In the Group’s consolidated balance sheet,
these equity investments are either classified as “Financial assets available for sale (“AFS”)” or “Equity method
investments”. An immaterial amount of financial assets designated at fair value through profit and loss which are
equity interests is included in the banking book. These investments are not addressed in the following sections.
Accounting and Valuation Policies for Equity Investments
AFS equity instruments are initially recognized at fair value plus transaction costs that are directly attributable to
the acquisition of that financial asset. Financial assets classified as AFS are carried at fair value with the changes
in fair value generally reported in equity unless the asset is subject to a fair value hedge or is impaired. At each
balance sheet date, management assesses whether there is objective evidence that an individual asset is
impaired. Objective evidence of impairment includes a significant or prolonged decline in the fair value of the
investment below cost. The amount of impairment is the difference between the acquisition cost and current fair
value of the asset less any previously recognized impairment. Impairments of equity investments cannot be
reversed. Increases in their fair value after impairment are recognized in equity.
Consistent with the valuation of financial instruments, fair value of equity securities is initially and subsequently
determined using, where available, quoted prices in active markets or valuation techniques, where prices quoted
in active markets are not available.
The Group reports investments in associates and joint ventures under the equity method of accounting. Equity
method investments are initially recorded at cost, and subsequently increased (or decreased) to reflect both the
Group’s pro-rata share of the post-acquisition net income (or loss) and other movements included directly in
the equity of the entity. Goodwill arising on the acquisition is included in the carrying value of the investment (net
of any accumulated impairment loss). At each balance sheet date, the Group assesses whether there is any
objective evidence that the investment in an associate or jointly controlled entity is impaired. If there is objective
evidence of an impairment, an impairment test is performed by comparing the investment’s recoverable amount,
which is the higher of its value in use and fair value less costs to sell, with its carrying amount. Equity method
losses in excess of the Group’s carrying value of the investment in the entity are charged against other assets
held by the Group related to the investee. If those assets are written down to zero, a determination is made
whether to report additional losses based on the Group’s obligation to fund such losses.
For further detail on the Group’s accounting and valuation policies related to equity investments please refer to
Notes [1] “Significant Accounting Policies” and [13] “Financial Instruments carried at Fair Value” in the Group’s
Financial Report 2009.
9. Nontrading Market Risk
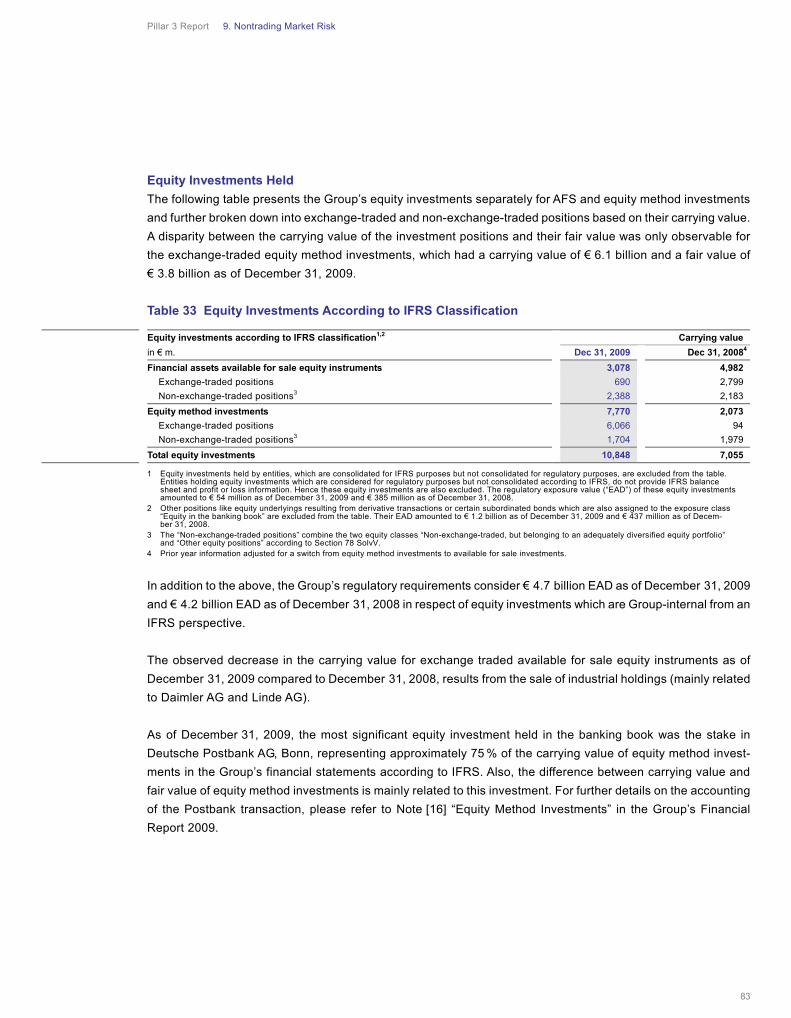
Pillar 3 Report 9. Nontrading Market Risk
83
Equity Investments Held
The following table presents the Group’s equity investments separately for AFS and equity method investments
and further broken down into exchange-traded and non-exchange-traded positions based on their carrying value.
A disparity between the carrying value of the investment positions and their fair value was only observable for
the exchange-traded equity method investments, which had a carrying value of € 6.1 billion and a fair value of
€ 3.8 billion as of December 31, 2009.
Table 33 Equity Investments According to IFRS Classification
1 Equity investments held by entities, which are consolidated for IFRS purposes but not consolidated for regulatory purposes, are excluded from the table. Entities holding equity investments which are considered for regulatory purposes but not consolidated according to IFRS, do not provide IFRS balance sheet and profit or loss information. Hence these equity investments are also excluded. The regulatory exposure value (“EAD”) of these equity investments amounted to € 54 million as of December 31, 2009 and € 385 million as of December 31, 2008.
2 Other positions like equity underlyings resulting from derivative transactions or certain subordinated bonds which are also assigned to the exposure class “Equity in the banking book” are excluded from the table. Their EAD amounted to € 1.2 billion as of December 31, 2009 and € 437 million as of Decem-ber 31, 2008.
3 The “Non-exchange-traded positions” combine the two equity classes “Non-exchange-traded, but belonging to an adequately diversified equity portfolio” and “Other equity positions” according to Section 78 SolvV.
4 Prior year information adjusted for a switch from equity method investments to available for sale investments.
In addition to the above, the Group’s regulatory requirements consider € 4.7 billion EAD as of December 31, 2009
and € 4.2 billion EAD as of December 31, 2008 in respect of equity investments which are Group-internal from an
IFRS perspective.
The observed decrease in the carrying value for exchange traded available for sale equity instruments as of
December 31, 2009 compared to December 31, 2008, results from the sale of industrial holdings (mainly related
to Daimler AG and Linde AG).
As of December 31, 2009, the most significant equity investment held in the banking book was the stake in
Deutsche Postbank AG, Bonn, representing approximately 75 % of the carrying value of equity method invest-
ments in the Group’s financial statements according to IFRS. Also, the difference between carrying value and
fair value of equity method investments is mainly related to this investment. For further details on the accounting
of the Postbank transaction, please refer to Note [16] “Equity Method Investments” in the Group’s Financial
Report 2009.
Equity investments according to IFRS classification1,2 Carrying value
in € m. Dec 31, 2009 Dec 31, 20084
Financial assets available for sale equity instruments 3,078 4,982
Exchange-traded positions 690 2,799
Non-exchange-traded positions3 2,388 2,183
Equity method investments 7,770 2,073
Exchange-traded positions 6,066 94
Non-exchange-traded positions3 1,704 1,979
Total equity investments 10,848 7,055
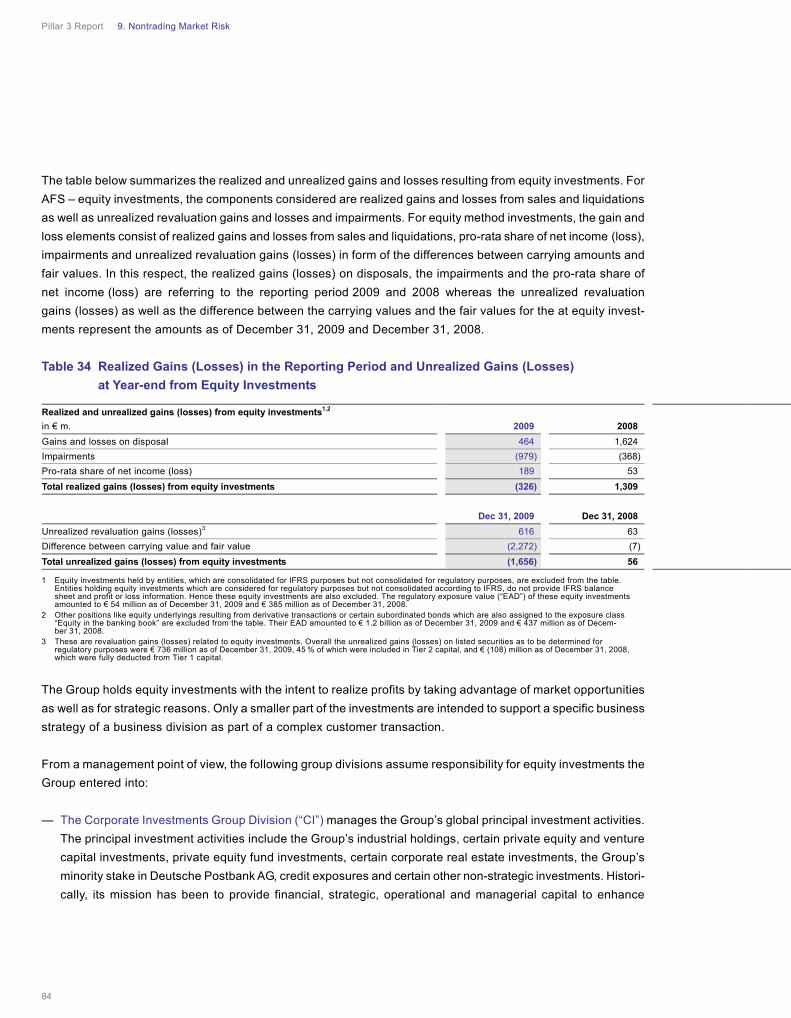
Pillar 3 Report 9. Nontrading Market Risk
84
The table below summarizes the realized and unrealized gains and losses resulting from equity investments. For
AFS – equity investments, the components considered are realized gains and losses from sales and liquidations
as well as unrealized revaluation gains and losses and impairments. For equity method investments, the gain and
loss elements consist of realized gains and losses from sales and liquidations, pro-rata share of net income (loss),
impairments and unrealized revaluation gains (losses) in form of the differences between carrying amounts and
fair values. In this respect, the realized gains (losses) on disposals, the impairments and the pro-rata share of
net income (loss) are referring to the reporting period 2009 and 2008 whereas the unrealized revaluation
gains (losses) as well as the difference between the carrying values and the fair values for the at equity invest-
ments represent the amounts as of December 31, 2009 and December 31, 2008.
Table 34 Realized Gains (Losses) in the Reporting Period and Unrealized Gains (Losses)
at Year-end from Equity Investments
1 Equity investments held by entities, which are consolidated for IFRS purposes but not consolidated for regulatory purposes, are excluded from the table. Entities holding equity investments which are considered for regulatory purposes but not consolidated according to IFRS, do not provide IFRS balance sheet and profit or loss information. Hence these equity investments are also excluded. The regulatory exposure value (“EAD”) of these equity investments amounted to € 54 million as of December 31, 2009 and € 385 million as of December 31, 2008.
2 Other positions like equity underlyings resulting from derivative transactions or certain subordinated bonds which are also assigned to the exposure class “Equity in the banking book” are excluded from the table. Their EAD amounted to € 1.2 billion as of December 31, 2009 and € 437 million as of Decem-ber 31, 2008.
3 These are revaluation gains (losses) related to equity investments. Overall the unrealized gains (losses) on listed securities as to be determined for regulatory purposes were € 736 million as of December 31, 2009, 45 % of which were included in Tier 2 capital, and € (108) million as of December 31, 2008, which were fully deducted from Tier 1 capital.
The Group holds equity investments with the intent to realize profits by taking advantage of market opportunities
as well as for strategic reasons. Only a smaller part of the investments are intended to support a specific business
strategy of a business division as part of a complex customer transaction.
From a management point of view, the following group divisions assume responsibility for equity investments the
Group entered into:
— The Corporate Investments Group Division (“CI”) manages the Group’s global principal investment activities.
The principal investment activities include the Group’s industrial holdings, certain private equity and venture
capital investments, private equity fund investments, certain corporate real estate investments, the Group’s
minority stake in Deutsche Postbank AG, credit exposures and certain other non-strategic investments. Histori-
cally, its mission has been to provide financial, strategic, operational and managerial capital to enhance
Realized and unrealized gains (losses) from equity investments1,2
in € m. 2009 2008
Gains and losses on disposal 464 1,624
Impairments (979) (368)
Pro-rata share of net income (loss) 189 53
Total realized gains (losses) from equity investments (326) 1,309
Dec 31, 2009 Dec 31, 2008
Unrealized revaluation gains (losses)3 616 63
Difference between carrying value and fair value (2,272) (7)
Total unrealized gains (losses) from equity investments (1,656) 56
Pillar 3 Report 9. Nontrading Market Risk
85
the values of the portfolio of companies in which the group division has invested. The Group believes that CI
enhances the Group’s portfolio management and risk management capability.
— The group divisions Corporate and Investment Bank and Private Clients and Asset Management mainly hold
investments in the banks alternative asset portfolio for profit realization as well as for strategic reasons.
9.2 Interest Rate Risk in the Banking Book
Assessment of Market Risk in Nontrading Portfolios – Interest Rate Risk
With the exception of some entities in the Private and Business Clients corporate division in Germany, the Private
Wealth Management mortgage business in the U.S., and financing structures of strategic acquisitions in Corpo-
rate Investments the Group’s interest rate risk arising from nontrading asset and liability positions has been
transferred through internal transactions to the Global Markets Business division within the Corporate and Invest-
ment Bank group division, and is managed on the basis of value-at-risk, as reflected in trading value-at-risk
numbers. The treatment of interest rate risk in the Group’s trading portfolios and the application of the value-at-
risk model are discussed in chapter 8 “Trading Market Risk”.
The Group’s Private and Business Clients corporate division, a nontrading division, and the business division
Private Wealth Management manage interest rate risk for the above mentioned entities separately through
dedicated Asset and Liability Management departments. The measurement of the interest rate risk by Asset and
Liability Management Private and Business Clients is performed daily and for Private Wealth Management weekly.
Interest Rate Risk from strategic acquisition financing structures within the Corporate Investment division is
monitored quarterly.
The nature of interest rate risks in the banking book stems from residual asset/liability mismatches. The changes
of present values of the banking book positions when applying parallel yield curve shifts of – 190 and +130 basis
points are below 1 % of the Group’s total regulatory capital. Consequently, interest rate risk in the banking book is
considered immaterial.
Measuring interest rate risks in the banking book is based upon key assumptions regarding client behaviour,
future availability of deposit balances and sensitivities of deposit rates versus market interest rates resulting in a
longer than contractual effective duration. Those assumptions are being stressed within the Group’s economic
capital framework. Further assumptions are being made regarding early pre-payment behaviour for loan products.
The assumptions are based on historical observations, statistical analyses and expert assessments. If the future
evolution of balances, rates or client behaviour differ from these assumptions, then this could have an impact
on the Group’s interest rate risks in the banking book.
Pillar 3 Report 9. Nontrading Market Risk
86
9.3 Nontrading Market Risk Management
The market risk component of the Group’s nontrading activities is overseen by dedicated Nontrading Market Risk
Management units. These teams assume responsibility in particular for the management of equity and interest
rate risk in the banking book which is described in more detail in chapter 9.1 and 9.2. above.
A further area of focus is the structural foreign exchange risk exposure – a significant contribution to the Group’s
foreign exchange risk in its nontrading portfolio – resulting from unhedged capital and retained earnings in non-€
currencies in certain subsidiaries, mainly U.S. and UK entities.
Apart from these more conventional risk topics, the Group’s Nontrading Market Risk Management function also
has the mandate to monitor and manage risks arising from equity compensation and asset management and fund
related activities resulting primarily from guaranteed funds. Moreover, the Group’s PBC, GTB and PWM busi-
nesses are subject to modeling risk with regard to client deposits. This risk materializes if assumptions on client
behavior are shocked in combination with interest rate movements.
The Capital and Risk Committee supervises the Group’s nontrading market risk exposures. Investment proposals
for strategic investments are analyzed by the Group Investment Committee. Depending on size of the strategic
investment the investment requires approval from the Group Investment Committee, the Management Board or
even the Supervisory Board. The development of Strategic Investments is monitored by the Group Investment
Committee on a regular basis. Multiple members of the Capital and Risk Committee are also members of the
Group Investment Committee, ensuring a close link between both committees.
Due to the complexity and variety of risk characteristics in the area of nontrading market risks, the responsibility of
risk management is split into three teams:
— The Nontrading Market Risk Management team within the Group’s Market Risk Management function covers
market risks in PBC, GTB, PWM and Corporate Investments as well as Structural FX Risks, Equity Compen-
sation Risks and Pension Risks.
— The Principal Investments team within the Group’s Credit Risk Management function is specialized in risk-
related aspects of its nontrading alternative asset activities and performs monthly reviews of the risk profile of
the nontrading alternative asset portfolios.
— The Asset Management Risk unit within the Group’s Credit Risk Management function is specialized in risk-
related aspects of its asset and fund management business. Noteworthy risks in this area arise, for example,
from performance and/or principal guarantees and reputational risk related to managing client funds.
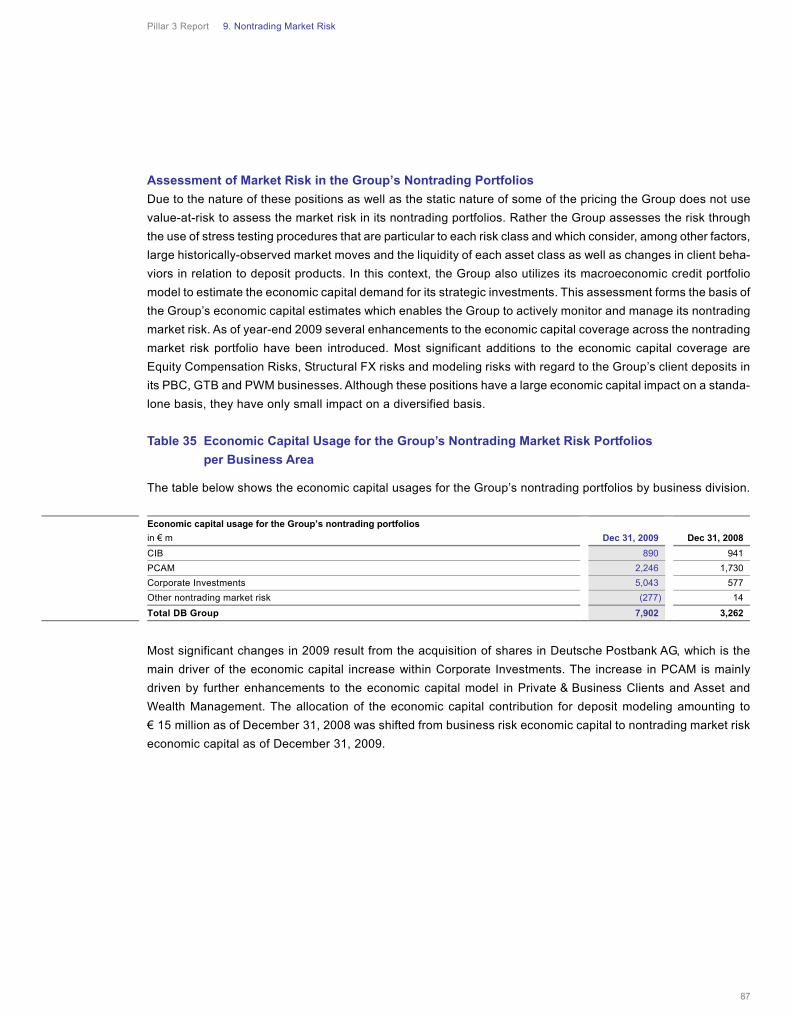
Pillar 3 Report 9. Nontrading Market Risk
87
Assessment of Market Risk in the Group’s Nontrading Portfolios
Due to the nature of these positions as well as the static nature of some of the pricing the Group does not use
value-at-risk to assess the market risk in its nontrading portfolios. Rather the Group assesses the risk through
the use of stress testing procedures that are particular to each risk class and which consider, among other factors,
large historically-observed market moves and the liquidity of each asset class as well as changes in client beha-
viors in relation to deposit products. In this context, the Group also utilizes its macroeconomic credit portfolio
model to estimate the economic capital demand for its strategic investments. This assessment forms the basis of
the Group’s economic capital estimates which enables the Group to actively monitor and manage its nontrading
market risk. As of year-end 2009 several enhancements to the economic capital coverage across the nontrading
market risk portfolio have been introduced. Most significant additions to the economic capital coverage are
Equity Compensation Risks, Structural FX risks and modeling risks with regard to the Group’s client deposits in
its PBC, GTB and PWM businesses. Although these positions have a large economic capital impact on a standa-
lone basis, they have only small impact on a diversified basis.
Table 35 Economic Capital Usage for the Group’s Nontrading Market Risk Portfolios
per Business Area
The table below shows the economic capital usages for the Group’s nontrading portfolios by business division.
Most significant changes in 2009 result from the acquisition of shares in Deutsche Postbank AG, which is the
main driver of the economic capital increase within Corporate Investments. The increase in PCAM is mainly
driven by further enhancements to the economic capital model in Private & Business Clients and Asset and
Wealth Management. The allocation of the economic capital contribution for deposit modeling amounting to
€ 15 million as of December 31, 2008 was shifted from business risk economic capital to nontrading market risk
economic capital as of December 31, 2009.
Economic capital usage for the Group’s nontrading portfolios
in € m Dec 31, 2009 Dec 31, 2008
CIB 890 941
PCAM 2,246 1,730
Corporate Investments 5,043 577
Other nontrading market risk (277) 14
Total DB Group 7,902 3,262
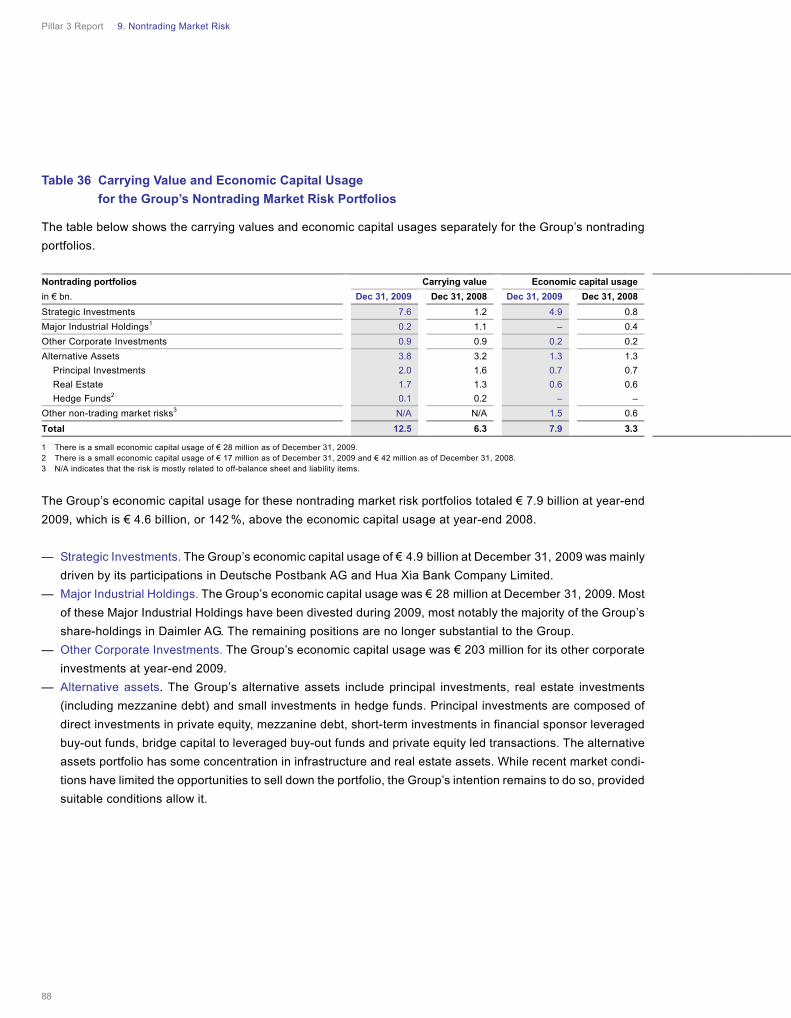
Pillar 3 Report 9. Nontrading Market Risk
88
Table 36 Carrying Value and Economic Capital Usage
for the Group’s Nontrading Market Risk Portfolios
The table below shows the carrying values and economic capital usages separately for the Group’s nontrading
portfolios.
1 There is a small economic capital usage of € 28 million as of December 31, 2009. 2 There is a small economic capital usage of € 17 million as of December 31, 2009 and € 42 million as of December 31, 2008. 3 N/A indicates that the risk is mostly related to off-balance sheet and liability items.
The Group’s economic capital usage for these nontrading market risk portfolios totaled € 7.9 billion at year-end
2009, which is € 4.6 billion, or 142 %, above the economic capital usage at year-end 2008.
— Strategic Investments. The Group’s economic capital usage of € 4.9 billion at December 31, 2009 was mainly
driven by its participations in Deutsche Postbank AG and Hua Xia Bank Company Limited.
— Major Industrial Holdings. The Group’s economic capital usage was € 28 million at December 31, 2009. Most
of these Major Industrial Holdings have been divested during 2009, most notably the majority of the Group’s
share-holdings in Daimler AG. The remaining positions are no longer substantial to the Group.
— Other Corporate Investments. The Group’s economic capital usage was € 203 million for its other corporate
investments at year-end 2009.
— Alternative assets. The Group’s alternative assets include principal investments, real estate investments
(including mezzanine debt) and small investments in hedge funds. Principal investments are composed of
direct investments in private equity, mezzanine debt, short-term investments in financial sponsor leveraged
buy-out funds, bridge capital to leveraged buy-out funds and private equity led transactions. The alternative
assets portfolio has some concentration in infrastructure and real estate assets. While recent market condi-
tions have limited the opportunities to sell down the portfolio, the Group’s intention remains to do so, provided
suitable conditions allow it.
Nontrading portfolios Carrying value Economic capital usage
in € bn. Dec 31, 2009 Dec 31, 2008 Dec 31, 2009 Dec 31, 2008
Strategic Investments 7.6 1.2 4.9 0.8
Major Industrial Holdings1 0.2 1.1 – 0.4
Other Corporate Investments 0.9 0.9 0.2 0.2
Alternative Assets 3.8 3.2 1.3 1.3
Principal Investments 2.0 1.6 0.7 0.7
Real Estate 1.7 1.3 0.6 0.6
Hedge Funds2 0.1 0.2 – –
Other non-trading market risks3 N/A N/A 1.5 0.6
Total 12.5 6.3 7.9 3.3
Pillar 3 Report 9. Nontrading Market Risk
89
— Other nontrading market risks:
— Deposit bucketing. Economic capital derived from stressing modeling assumptions for the effective dura-
tion of overnight deposits. The Group’s economic capital usage was € 247 million at December 31, 2009
and was mainly driven by PBC with a contribution of € 228 million.
— Equity compensation. Risk arising from structural short position in the Group’s own share price arising from
restricted equity units. The Group’s economic capital usage was € (597) million at December 31, 2009 on
a diversified basis. The negative contribution to the Group’s diversified economic capital is derived from
the fact that a reduction of its share price in a downside scenario as expressed by economic capital would
lead to reduced negative impact on the Group’s capital position from the equity compensation liabilities.
— Structural foreign exchange risk. The Group’s foreign exchange exposure arising from unhedged capital
and retained earnings in non-€ currencies in certain subsidiaries. The Group’s economic capital usage
was € 307 million at December 31, 2009 on a diversified basis.
— Asset Management. Guaranteed Funds: The Group’s economic capital usage was € 1.3 billion at Decem-
ber 31, 2009, an increase of 139 % over its economic capital usage at year-end 2008, driven by a recali-
bration of economic capital calculation parameters (shocks, correlations) in July 2009 reflecting changed
market conditions.
The Group’s total economic capital figures does not currently take into account diversification benefits between
the asset categories except for those of equity compensation and structural FX risks.
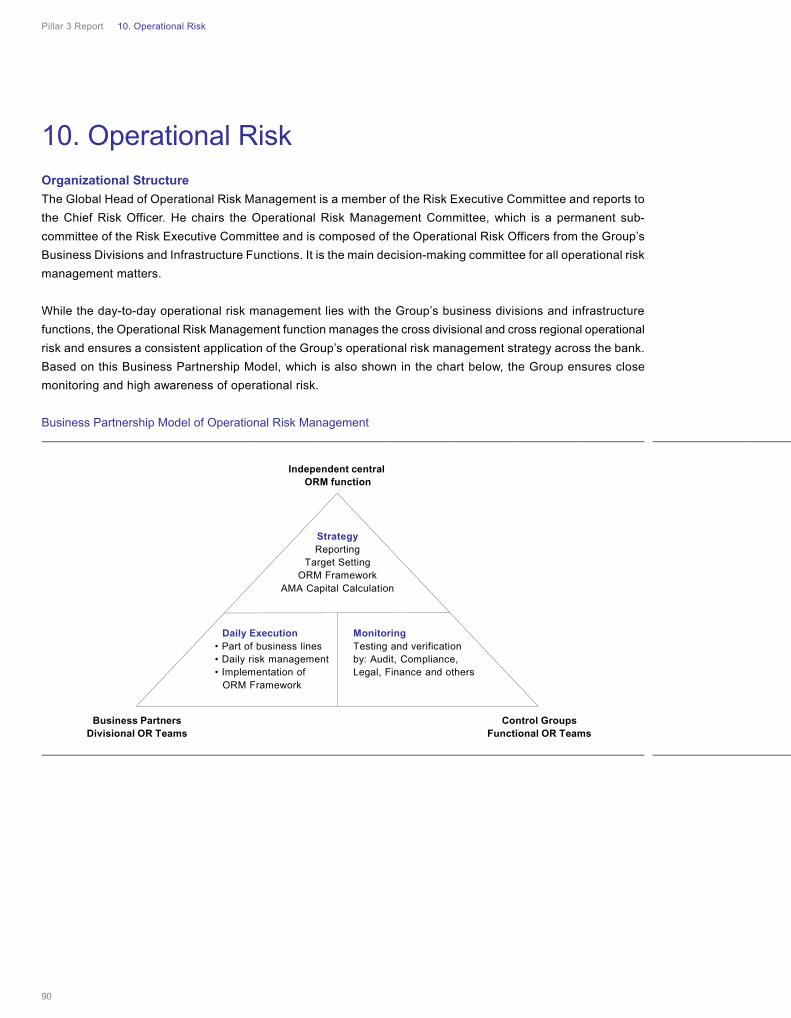
Pillar 3 Report 10. Operational Risk
90
Organizational Structure
The Global Head of Operational Risk Management is a member of the Risk Executive Committee and reports to
the Chief Risk Officer. He chairs the Operational Risk Management Committee, which is a permanent sub-
committee of the Risk Executive Committee and is composed of the Operational Risk Officers from the Group’s
Business Divisions and Infrastructure Functions. It is the main decision-making committee for all operational risk
management matters.
While the day-to-day operational risk management lies with the Group’s business divisions and infrastructure
functions, the Operational Risk Management function manages the cross divisional and cross regional operational
risk and ensures a consistent application of the Group’s operational risk management strategy across the bank.
Based on this Business Partnership Model, which is also shown in the chart below, the Group ensures close
monitoring and high awareness of operational risk.
Business Partnership Model of Operational Risk Management
10. Operational Risk
StrategyReporting
Target SettingORM Framework
AMA Capital Calculation
Daily Execution• Part of business lines• Daily risk management • Implementation of
ORM Framework
MonitoringTesting and verification by: Audit, Compliance, Legal, Finance and others
Independent central ORM function
Business PartnersDivisional OR Teams
Control GroupsFunctional OR Teams
Pillar 3 Report 10. Operational Risk
91
Managing The Group’s Operational Risk
The Group manages operational risk based on a Group-wide consistent framework that enables the Group to
determine the operational risk profile in comparison to the Group’s risk appetite and systematically identify opera-
tional risks themes to define risk mitigating measures and priorities.
The Group applies a number of techniques to efficiently manage the operational risk in its business, for example:
— The Group performs systematic risk analyses, root cause analyses and lessons learned activities for events
above € 2 million to identify inherent areas of risk and to define appropriate risk mitigating actions which are
monitored for resolution. The prerequisite for these detailed analyses and the timely information of the Group’s
senior management on the development of the operational risk events and on single larger events is the conti-
nuous collection of all losses above € 10.000 arising from operational risk events in the Group’s “db-Incident
Reporting System”.
— The Group systematically utilizes information on external events occurring in the banking industry to ensure
that similar incidents will not happen to the Group.
— Key Risk Indicators (“KRI”) are used to alert the organization to impending problems in a timely fashion. They
allow the monitoring of the Group’s control culture as well as the operational risk profile and trigger risk
mitigating actions. Within the KRI program the Group captures data at a granular level allowing for business
environment monitoring and facilitating the forward looking management of operational risk based on early
warning signals returned by the KRIs. The Group captures and monitors key operational risk indicators in the
tool “db-Score”.
— In the Group’s bottom-up Risk and Control Self Assessment (“RCSA”) process, which is conducted at least
annually, areas with high risk potential are highlighted and risk mitigating measures to resolve issue are identi-
fied. In general, RCSAs are performed in the Group’s tool “db-SAT”. On a regular basis the Group conducts
country risk workshop aiming to evaluate risks specific to countries and local legal entities the Group is operat-
ing in and take appropriate risk mitigating actions.
— Regular operational risk profile reports for the Group’s business divisions, the countries the Group is operating
in and selected infrastructure groups are reviewed and discussed with the department’s senior management.
The regular performance of the risk profile reviews enables the Group to early detect changes to the units risk
profile and to take corrective actions.
— Within the Group’s tracking tool “db-Track” the Group monitors risk mitigating measures identified via these
techniques for resolution.
— Due to the heterogeneous nature of operational risks in certain cases operational risks cannot be fully miti-
gated. In such cases operational risks are mitigated following the “as low as reasonable possible” principle
and the residual risk is formally accepted.
— The Group performs top risk analyses in which the results of the aforementioned activities are considered. The top
risk analyses mainly contribute into the annual operational risk management strategy and planning process.
Besides the operational risk management strategic and tactical planning the Group defines capital and expected
loss targets which are monitored on a regular basis within the quarterly forecasting process.
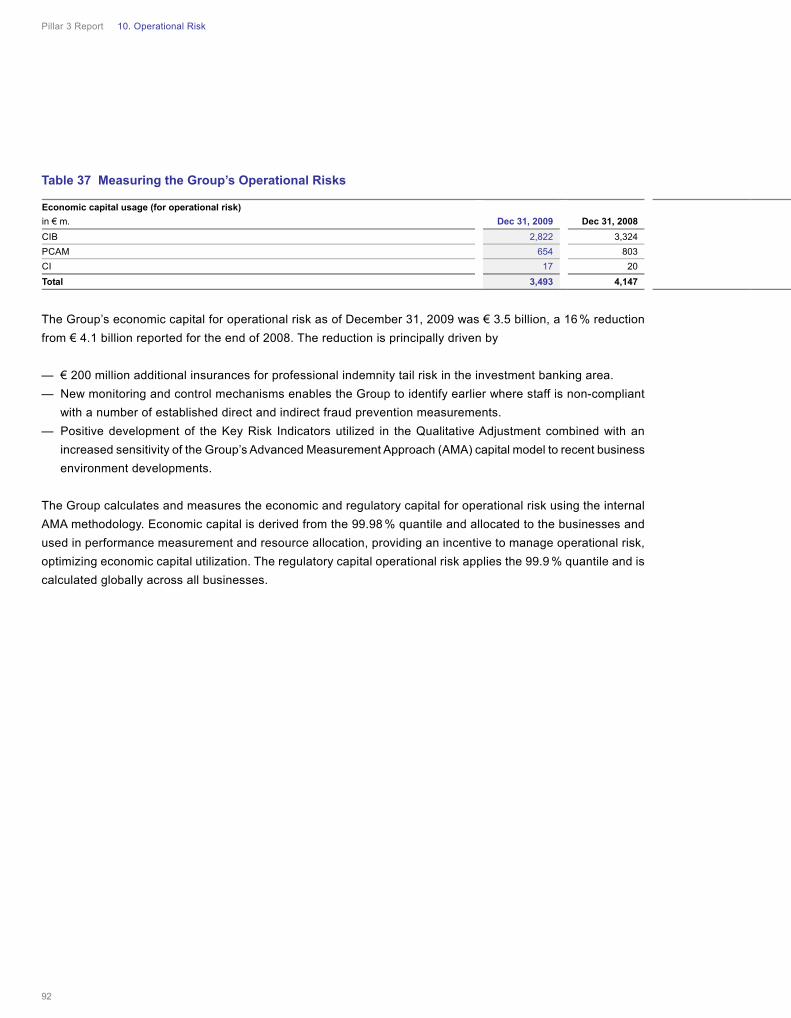
Pillar 3 Report 10. Operational Risk
92
Table 37 Measuring the Group’s Operational Risks
The Group’s economic capital for operational risk as of December 31, 2009 was € 3.5 billion, a 16 % reduction
from € 4.1 billion reported for the end of 2008. The reduction is principally driven by
— € 200 million additional insurances for professional indemnity tail risk in the investment banking area.
— New monitoring and control mechanisms enables the Group to identify earlier where staff is non-compliant
with a number of established direct and indirect fraud prevention measurements.
— Positive development of the Key Risk Indicators utilized in the Qualitative Adjustment combined with an
increased sensitivity of the Group’s Advanced Measurement Approach (AMA) capital model to recent business
environment developments.
The Group calculates and measures the economic and regulatory capital for operational risk using the internal
AMA methodology. Economic capital is derived from the 99.98 % quantile and allocated to the businesses and
used in performance measurement and resource allocation, providing an incentive to manage operational risk,
optimizing economic capital utilization. The regulatory capital operational risk applies the 99.9 % quantile and is
calculated globally across all businesses.
Economic capital usage (for operational risk)
Dec 31, 2009 Dec 31, 2008 in € m.
CIB 2,822 3,324
PCAM 654 803
CI 17 20
Total 3,493 4,147
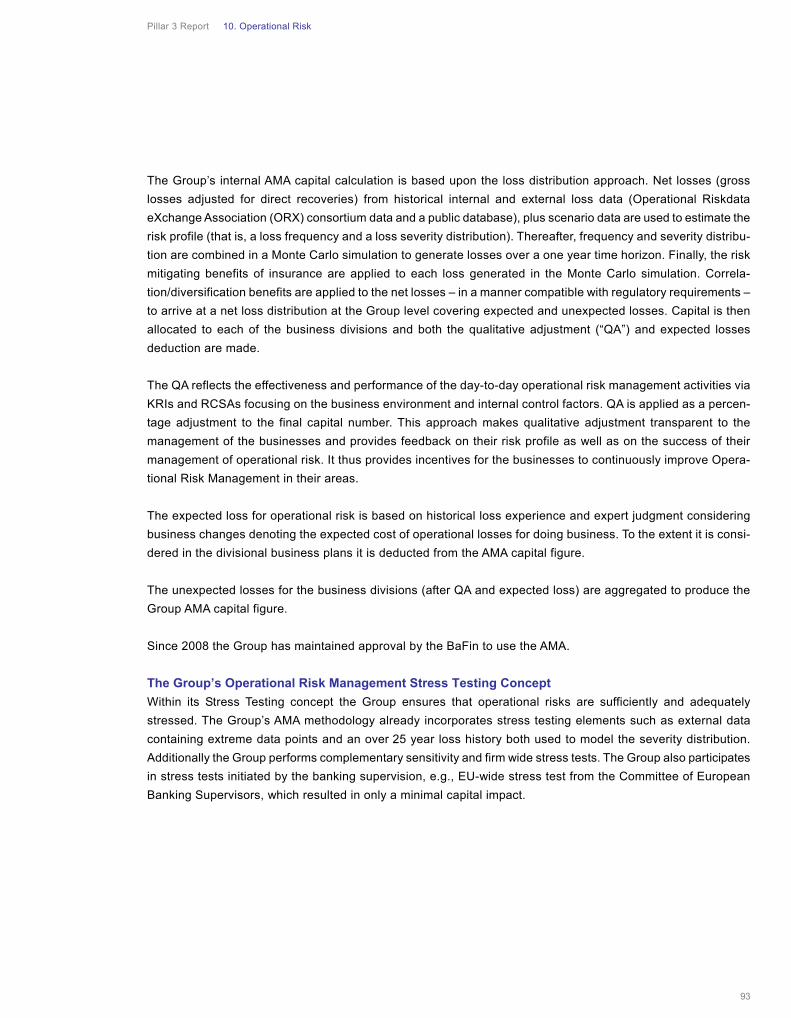
Pillar 3 Report 10. Operational Risk
93
The Group’s internal AMA capital calculation is based upon the loss distribution approach. Net losses (gross
losses adjusted for direct recoveries) from historical internal and external loss data (Operational Riskdata
eXchange Association (ORX) consortium data and a public database), plus scenario data are used to estimate the
risk profile (that is, a loss frequency and a loss severity distribution). Thereafter, frequency and severity distribu-
tion are combined in a Monte Carlo simulation to generate losses over a one year time horizon. Finally, the risk
mitigating benefits of insurance are applied to each loss generated in the Monte Carlo simulation. Correla-
tion/diversification benefits are applied to the net losses – in a manner compatible with regulatory requirements –
to arrive at a net loss distribution at the Group level covering expected and unexpected losses. Capital is then
allocated to each of the business divisions and both the qualitative adjustment (“QA”) and expected losses
deduction are made.
The QA reflects the effectiveness and performance of the day-to-day operational risk management activities via
KRIs and RCSAs focusing on the business environment and internal control factors. QA is applied as a percen-
tage adjustment to the final capital number. This approach makes qualitative adjustment transparent to the
management of the businesses and provides feedback on their risk profile as well as on the success of their
management of operational risk. It thus provides incentives for the businesses to continuously improve Opera-
tional Risk Management in their areas.
The expected loss for operational risk is based on historical loss experience and expert judgment considering
business changes denoting the expected cost of operational losses for doing business. To the extent it is consi-
dered in the divisional business plans it is deducted from the AMA capital figure.
The unexpected losses for the business divisions (after QA and expected loss) are aggregated to produce the
Group AMA capital figure.
Since 2008 the Group has maintained approval by the BaFin to use the AMA.
The Group’s Operational Risk Management Stress Testing Concept
Within its Stress Testing concept the Group ensures that operational risks are sufficiently and adequately
stressed. The Group’s AMA methodology already incorporates stress testing elements such as external data
containing extreme data points and an over 25 year loss history both used to model the severity distribution.
Additionally the Group performs complementary sensitivity and firm wide stress tests. The Group also participates
in stress tests initiated by the banking supervision, e.g., EU-wide stress test from the Committee of European
Banking Supervisors, which resulted in only a minimal capital impact.

Pillar 3 Report 10. Operational Risk
94
Role of Corporate Insurance/Deukona
The definition of the Group’s insurance strategy and supporting insurance policy and guidelines is the responsi-
bility of its specialized unit Corporate Insurance/Deukona (“CI/D”). CI/D is responsible for the Group’s global
corporate insurance policy which is approved by the Group’s Management Board.
Within the Group, CI/D is responsible for acquiring insurance coverage and for negotiating contract terms and
premiums. CI/D also has a role in the allocation of insurance premiums to the businesses. CI/D specialists assist
in devising the method for reflecting insurance in the capital calculations and in arriving at parameters to reflect
the regulatory requirements. CI/D is actively involved in industry efforts to reflect the effect of insurance in the
results of the capital calculations.
The Group buys insurance in order to protect itself against unexpected and substantial unforeseeable losses. The
identification, definition of magnitude and estimation procedures used are based on the recognized insurance
terms of “common sense”, “state-of-the-art” and/or “benchmarking”. The maximum limit per insured risk takes into
account the reliability of the insurer and a cost/benefit ratio, especially in cases in which the insurance market
tries to reduce coverage by restricted/limited policy wordings and specific exclusions.
The Group maintains a number of captive insurance companies, both primary and re-insurance companies.
However, insurance contracts provided are only considered in the modeling/calculation of insurance-related
reductions of operational risk capital requirements where the risk is re-insured in the external insurance market.
Other insurance contracts from captive companies will only be considered if and when they have been explicitly
approved by the BaFin in compliance with the relevant Solvency Regulations requirements.
CI/D selects insurance partners in strict compliance with the regulatory requirements specified in the Solvency
Regulations and the “Operational Risks Experts Group recommendation on the recognition of insurance in
advanced measurement approaches”. The insurance portfolio, as well as CI/D activities, are audited by Group
Audit on a periodic basis.
Pillar 3 Report 11. Liquidity Risk
95
Liquidity risk management safeguards the Group’s ability to meet all payment obligations when they come due.
The Group’s liquidity risk management framework has been an important factor in maintaining adequate liquidity
and in managing the funding profile during 2009.
Liquidity Risk Management Framework
The Group’s Treasury function is responsible for the management of liquidity risk. The Group’s liquidity risk
management framework is designed to identify, measure and manage the liquidity risk position of the Group. The
underlying policy, including the Group’s risk tolerance, is reviewed and approved regularly by the Management
Board. The policy defines the liquidity risk limits which are applied to the Group.
The Group’s liquidity risk management approach starts at the intraday level (operational liquidity) managing the
daily payments queue, forecasting cash flows and factoring in the Group’s access to Central Banks. It then covers
tactical liquidity risk management dealing with the access to secured and unsecured funding sources. Finally, the
strategic perspective comprises the maturity profile of all assets and liabilities (Funding Matrix) on the balance
sheet and issuance strategy.
The Group’s cash-flow based reporting system provides daily liquidity risk information to global and regional
management.
Stress testing and scenario analysis plays a central role in the liquidity risk management framework. This also
incorporates an assessment of asset liquidity, i.e. the characteristics of the asset inventory, under various stress
scenarios.
Short-term Liquidity and Wholesale Funding
The Group’s reporting system tracks cash flows on a daily basis over an 18-month horizon. This system allows
management to assess the Group’s short-term liquidity position in each location, region and globally on a by-
currency, by-product and by-division basis. The system captures all of the Group’s cash flows from transactions
on its balance sheet, as well as liquidity risks resulting from off-balance sheet transactions. The Group models
products that have no specific contractual maturities using statistical methods to reflect the behavioral characte-
ristics of their cash flows. Liquidity outflow limits (Maximum Cash Outflow Limits), which have been set to limit
cumulative global and local cash outflows, are monitored on a daily basis to safeguard the Group’s access to
liquidity.
As of year-end 2009 the Group has implemented a new reporting system which focuses on contractual cash
flows from wholesale funding sources on a daily basis over a 12-month horizon. The system captures all
cash flows from unsecured as well as from secured funding transactions. Wholesale funding limits, which are
calibrated against the Group’s stress testing results and approved by the Management Board describes the
Group’s maximum tolerance for liquidity risk. These limits apply to the cumulative global cash outflows and are
monitored on a daily basis.
11. Liquidity Risk
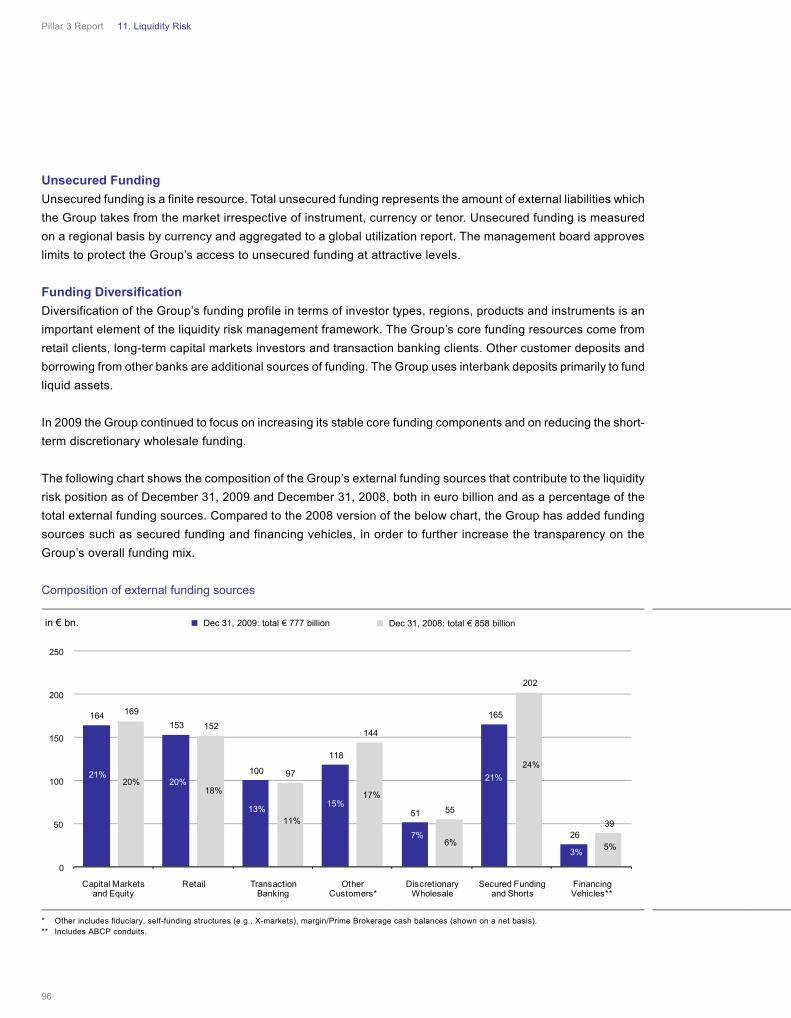
Pillar 3 Report 11. Liquidity Risk
96
Unsecured Funding
Unsecured funding is a finite resource. Total unsecured funding represents the amount of external liabilities which
the Group takes from the market irrespective of instrument, currency or tenor. Unsecured funding is measured
on a regional basis by currency and aggregated to a global utilization report. The management board approves
limits to protect the Group’s access to unsecured funding at attractive levels.
Funding Diversification
Diversification of the Group’s funding profile in terms of investor types, regions, products and instruments is an
important element of the liquidity risk management framework. The Group’s core funding resources come from
retail clients, long-term capital markets investors and transaction banking clients. Other customer deposits and
borrowing from other banks are additional sources of funding. The Group uses interbank deposits primarily to fund
liquid assets.
In 2009 the Group continued to focus on increasing its stable core funding components and on reducing the short-
term discretionary wholesale funding.
The following chart shows the composition of the Group’s external funding sources that contribute to the liquidity
risk position as of December 31, 2009 and December 31, 2008, both in euro billion and as a percentage of the
total external funding sources. Compared to the 2008 version of the below chart, the Group has added funding
sources such as secured funding and financing vehicles, in order to further increase the transparency on the
Group’s overall funding mix.
Composition of external funding sources
* Other includes fiduciary, self-funding structures (e.g., X-markets), margin/Prime Brokerage cash balances (shown on a net basis). ** Includes ABCP conduits.
in € bn.
164153
100
118
51
165
26
169
152
97
144
55
202
39
20%18%
11%
17%
6%
24%
5%
21%20%
13%15%
7%
21%
3%
0
50
100
150
200
250
Capital Marketsand Equity
Retail TransactionBanking
Other Customers*
DiscretionaryWholesale
Secured Funding and Shorts
Financing Vehicles**
Dec 31, 2008: total € 858 billionDec 31, 2009: total € 777 billion

Pillar 3 Report 11. Liquidity Risk
97
Funding Matrix
The Group maps all funding-relevant assets and all liabilities into time buckets corresponding to their maturities
to compile a maturity profile (funding matrix). Given that trading assets are typically more liquid than their contrac-
tual maturities suggest, the Group determines individual liquidity profiles reflecting their relative liquidity value.
The Group takes assets and liabilities from the retail bank that shows a behavior of being renewed or prolonged
regardless of capital market conditions (mortgage loans and retail deposits) and assigns them to time buckets
reflecting the expected prolongation. Wholesale banking products are included with their contractual maturities.
The funding matrix identifies the excess or shortfall of assets over liabilities in each time bucket, facilitating man-
agement of open liquidity exposures. The funding matrix is a key input parameter for the Group’s annual capital
market issuance plan, which, upon approval by the Capital and Risk Committee, establishes issuing targets for
securities by tenor, volume and instrument. As per the year-end 2009, the Group was long funded in each of the
annual time buckets of the funding matrix (2-10 years).
In 2009, Treasury issued capital market instruments with a total value of approximately € 19.9 billion, € 3.9 billion
more than the original issuance plan.
For information regarding the maturity profile of the Group’s long-term debt, please refer to Note [29] “Long-Term
Debt and Trust Preferred Securities” of the consolidated financial statements.
Stress Testing and Scenario Analysis
The Group uses stress testing and scenario analysis to evaluate the impact of sudden stress events on its liquidity
position. The scenarios have been based on historic events, such as the 1987 stock market crash, the 1990 U.S.
liquidity crunch and the September 2001 terrorist attacks, liquidity crisis case studies and hypothetical events.
Also incorporated are new liquidity risk drivers revealed by the latest financial markets crisis: prolonged term
money-market freeze, collateral repudiation, limited fungibility of currencies, stranded syndications, systemic
knock-on effects and further liquidity risk drivers such as intraday liquidity risk. As of year-end 2009 the Group
also has introduced a scenario, which combines a systemic market shock with a multi notch rating downgrade.
Under each of these scenarios the Group assumes that all maturing loans to customers will need to be rolled over
and require funding whereas rollover of liabilities will be partially impaired resulting in a funding gap. The Group
then models the steps the Group would take to counterbalance the resulting net shortfall in funding. Counter-
measures would include the Group’s long cash balance and unencumbered asset inventory as well as the Group’s
Strategic Liquidity Reserve.
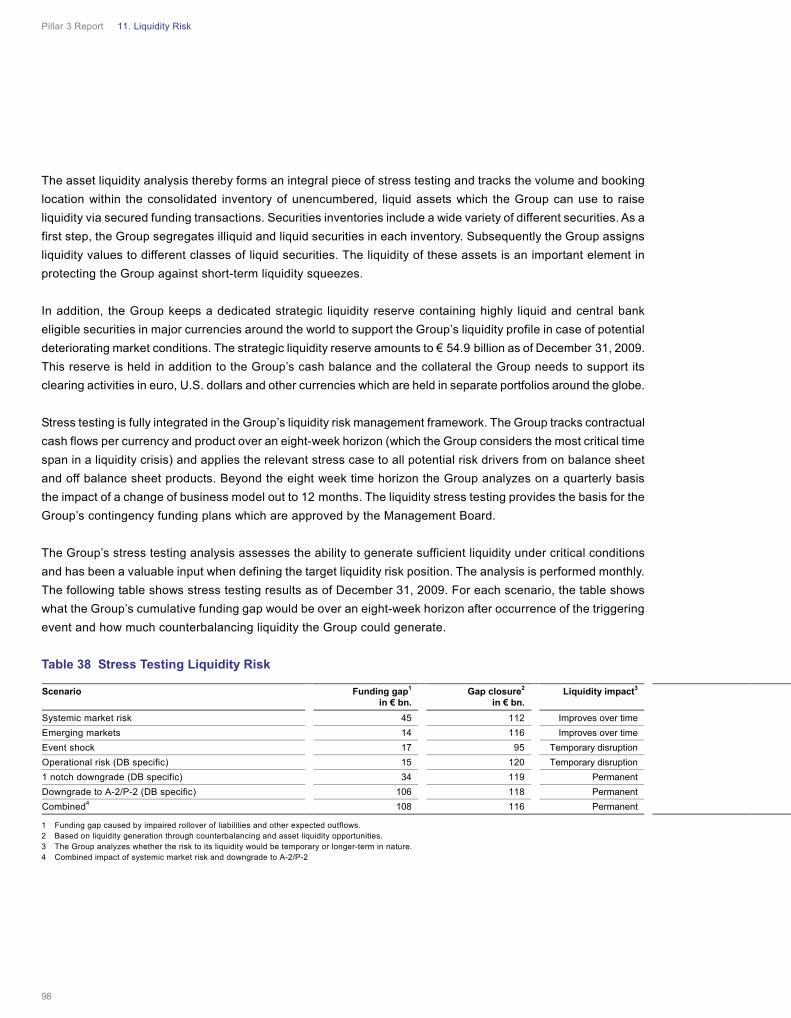
Pillar 3 Report 11. Liquidity Risk
98
The asset liquidity analysis thereby forms an integral piece of stress testing and tracks the volume and booking
location within the consolidated inventory of unencumbered, liquid assets which the Group can use to raise
liquidity via secured funding transactions. Securities inventories include a wide variety of different securities. As a
first step, the Group segregates illiquid and liquid securities in each inventory. Subsequently the Group assigns
liquidity values to different classes of liquid securities. The liquidity of these assets is an important element in
protecting the Group against short-term liquidity squeezes.
In addition, the Group keeps a dedicated strategic liquidity reserve containing highly liquid and central bank
eligible securities in major currencies around the world to support the Group’s liquidity profile in case of potential
deteriorating market conditions. The strategic liquidity reserve amounts to € 54.9 billion as of December 31, 2009.
This reserve is held in addition to the Group’s cash balance and the collateral the Group needs to support its
clearing activities in euro, U.S. dollars and other currencies which are held in separate portfolios around the globe.
Stress testing is fully integrated in the Group’s liquidity risk management framework. The Group tracks contractual
cash flows per currency and product over an eight-week horizon (which the Group considers the most critical time
span in a liquidity crisis) and applies the relevant stress case to all potential risk drivers from on balance sheet
and off balance sheet products. Beyond the eight week time horizon the Group analyzes on a quarterly basis
the impact of a change of business model out to 12 months. The liquidity stress testing provides the basis for the
Group’s contingency funding plans which are approved by the Management Board.
The Group’s stress testing analysis assesses the ability to generate sufficient liquidity under critical conditions
and has been a valuable input when defining the target liquidity risk position. The analysis is performed monthly.
The following table shows stress testing results as of December 31, 2009. For each scenario, the table shows
what the Group’s cumulative funding gap would be over an eight-week horizon after occurrence of the triggering
event and how much counterbalancing liquidity the Group could generate.
Table 38 Stress Testing Liquidity Risk
1 Funding gap caused by impaired rollover of liabilities and other expected outflows. 2 Based on liquidity generation through counterbalancing and asset liquidity opportunities. 3 The Group analyzes whether the risk to its liquidity would be temporary or longer-term in nature. 4 Combined impact of systemic market risk and downgrade to A-2/P-2
Scenario Funding gap1 in € bn.
Gap closure2
in € bn. Liquidity impact3
Systemic market risk 45 112 Improves over time
Emerging markets 14 116 Improves over time
Event shock 17 95 Temporary disruption
Operational risk (DB specific) 15 120 Temporary disruption
1 notch downgrade (DB specific) 34 119 Permanent
Downgrade to A-2/P-2 (DB specific) 106 118 Permanent
Combined4 108 116 Permanent

Pillar 3 Report 11. Liquidity Risk
99
With the increasing importance of liquidity management in the financial industry, the Group considers it important
to confer with central banks, supervisors, rating agencies and market participants on liquidity risk-related topics.
The Group participates in a number of working groups regarding liquidity and participates in efforts to create
industry-wide standards that are appropriate to evaluate and manage liquidity risk at financial institutions.
In addition to the Group’s internal liquidity management systems, the liquidity exposure of German banks is
regulated by the Banking Act and regulations issued by the BaFin. The Group is in compliance with all applicable
liquidity regulations.

Pillar 3 Report Glossary
100
Advanced Measurement
Approach (AMA)
An operational risk measurement
technique proposed under Basel II
capital adequacy rules using an
internal modeling methodology
as a basis.
Active Book Equity (ABE)
Active Book Equity is calculated by
the Group in order to make it easier
to compare itself with competitors as
well as in order to refer to active book
equity for several ratios. The share-
holders’ equity is adjusted for unrea-
lized net gains on assets available for
sale, fair value adjustments on cash
flow hedges (both components net
of applicable taxes), as well as
dividends, for which a proposal is
accrued on a quarterly basis and for
which payments occur once a year
following the approval by the Annual
General Meeting.
Alternative Assets
A portfolio of assets including principal
investments, real estate investments
(including mezzanine debt) and small
investments in hedge funds. Principal
investments are composed of direct
investments in private equity, mezza-
nine debt, short-term investments in
financial sponsor leveraged buy-out
funds, bridge capital to leveraged
buy-out funds and private equity led
transactions.
Average Expected Exposure (AEE)
One year time average of the average
simulated positive future market
values for a given portfolio of deriva-
tives and/or securities financing
transactions. This exposure measure
follows internal credit line netting rules
and credit risk mitigation via margin-
ing and collateralization and is used
as exposure measure within the
calculation of economic capital.
Back testing
A procedure used to verify the
predictive power of the value-
at-risk calculations involving the
comparison of hypothetical daily
profits and losses under the
buy-and-hold assumption with the
estimates from the value-at-risk
model.
Basel II
Revised recommendations for
international capital adequacy
standards adopted by the Basel
Committee on Banking Supervision,
widely referred to as Basel II capital
framework, which align capital
requirements more closely with
the underlying risks.
Business Risk
Risk that arises from potential
changes in general business condi-
tions, such as market environment,
client behavior and technological
progress, which can affect the
Group’s earnings if the Group is
unable to adjust quickly to them.
Collateral Support Annexes (CSA)
Annexes to master netting agree-
ments that are used for documenting
collateral arrangements between
parties trading OTC (over-the-counter)
derivatives. CSA’s provide derivatives-
related credit risk mitigation through
periodic margining of the covered
exposure.
Confidence Level
In the framework of value-at-risk
and economic capital the level of
probability that the actual loss will
not exceed the potential loss
estimated by the value-at-risk or
economic capital number.
Country Risk
The risk that the Group may suffer
a loss, in any given country, due to
deterioration in economic conditions,
political and social unrest, nationaliza-
tion and expropriation of assets,
government repudiation of external
indebtedness, exchange controls and
currency depreciation or devaluation.
Credit Conversion Factor (CCF)
A multiplier that is used to convert
off-balance-sheet items into credit
exposure equivalents. Within the
advanced IRBA the Group applies
specific CCFs in order to calculate
an Exposure at Default (EAD)
value. In instances, in which
a transaction involves an unused
limit, a percentage share of this
unused limit is added to the outstand-
ing amount in order to appropriately
reflect the expected outstanding
amount in case of a counterparty
default. This reflects the assumption
that for commitments the utilization
at the time of default might be higher
than the current utilization.
Credit Risk
Risk that customers may not be able
to meet their contractual payment
obligations. Credit risk includes
default risk, country risk and
settlement risk.
Credit Risk Exposure
All transactions in which losses
might occur due to the fact that
counterparties may not fulfill their
contractual payment obligations.
The Group generally calculates credit
risk exposure as the gross amount
of the exposure without taking into
account any collateral, other credit
enhancement or credit risk mitigating
transactions.
Glossary

Pillar 3 Report Glossary
101
Default Risk
The risk that counterparties fail to
meet contractual payment obligations.
Economic Capital
A figure which states with a high
degree of certainty the amount of
equity capital the Group needs at any
given time to absorb unexpected
losses arising from current exposures.
Equity Method
Valuation method
for investments in companies over
which significant influence can be
exercised. The pro-rata share of
the company’s net income (loss)
increases (decreases) the carrying
value of the investment affecting net
income. Distributions decrease
the carrying value of the investment
without affecting net income.
Expected Loss (EL)
Measurement of loss that can be
expected from a default event during
a one-year period from credit risk
and operational risk based on
historical loss experience.
Expected Positive Exposure (EPE)
One year time average of the mono-
tonically increasing average simulated
positive future market values for a
given portfolio of derivatives and/or
securities financing transactions.
This exposure measure follows
external regulatory netting rules and
credit risk mitigation via margining
and collateralization and is used as
exposure measure within the calcula-
tion of regulatory capital under the
Basel II Internal Model Method.
Exposure at Default (EAD)
The expected amount of the credit
exposure to a counterparty at the
time of a default.
Exposure Class
Asset classes such as governments,
corporates or retail, which are defined
by the Solvency Regulation within
each credit risk measurement
approach, that is standardized and
internal ratings based approach.
Fair Value
Amount at which an asset or liability
would be exchanged in a current
transaction between knowledgeable,
willing parties, other than in a forced
or liquidation sale.
German Solvency Regulation
(Solvabilitätsverordnung, SolvV)
German regulation governing the
capital adequacy of institutions,
groups of institutions and financial
holding groups which adopted the
revised capital framework of the Basel
Committee from 2004, widely referred
to as Basel II, into German law.
IFRS (International Financial
Reporting Standards)/Previously IAS
(International Accounting Standards)
Financial Reporting Rules of the
International Accounting Standards
Board designed to ensure globally
transparent and comparable account-
ing and disclosure. Main objective is
to present information that is useful
in making economic decisions,
mainly for investors.
Internal Assessment Approach (IAA)
Internal credit assessment approach
used in the calculation of regulatory
capital requirements for non-externally
rated securitization positions in
relation to ABCP conduits.
Internal Model Approach
Subject to regulatory permission, the
usage of internal value-at-risk models
to calculate the regulatory capital
requirement for market risk positions.
Internal Model Method (IMM)
A more sophisticated approach for
calculating a regulatory exposure
value (Exposure at Default) for
derivative counterparty exposures
as well as securities financing trans-
actions by building the calculations
on a Monte Carlo simulation of the
transactions’ potential future market
values.
Internal Ratings Based Approach
(IRBA)
The most sophisticated approach
available under the German
Solvency Regulation for calculation
of the regulatory capital requirements
for risk positions allowing the Group
to make use of its internal rating
methodologies as well as internal
estimates of specific other risk
parameters.
Liquidity Risk
The risk arising from the Group’s
potential inability to meet all payment
obligations when they come due or
only being able to meet these
obligations at excessive costs.
Loss Distribution Approach
A risk profile modelling technique,
which mainly uses loss data to
construct aggregate loss distributions
based on Monte Carlo simulations.
Loss Given Default (LGD)
The likely loss intensity in case of a
counterparty default. Its estimation
represents, expressed as a percen-
tage, the part of the exposure that
cannot be recovered in a default
event and therefore captures the
severity of a loss.

Pillar 3 Report Glossary
102
Market Risk
The risk that arises from the uncer-
tainty concerning changes in market
prices and rates (including interest
rates, equity prices, foreign exchange
rates and commodity prices), the
correlations among them and their
levels of volatility.
Mark-to-market Approach
An approach to calculate the regula-
tory Exposure of default value of
derivative counterparty credit risk
exposures as the current market value
of the derivative plus an add-on
amount which takes into account the
potential future increase of the market
value.
Netting Agreements
Bilateral agreements between the
Group and its counterparties with
regard to the included transactions
which ensure that, if solvency or
bankruptcy proceedings are initiated,
only a single net amount is owed by
one party to the other from the netting
of all claims and liabilities with the
Group having the right to terminate
all transactions under the agreement
unilaterally if the counterparty fails
to perform an obligation owed under
an individual transaction.
Operational Risk
Potential for incurring losses in
relation to employees, contractual
specifications and documentation,
technology, infrastructure failure and
disasters, projects, external influences
and customer relationships. This
definition includes legal and regula-
tory risk, but excludes business
and reputational risk.
Potential Future Exposure
Time profile of the 95th percentile of
simulated positive market values for
a given portfolio of derivatives and/or
securities financing transactions
including the effect of netting
agreements and collateral – calcu-
lated over the portfolio’s entire
lifetime.
Probability of Default (PD)
The likelihood or probability of default
(PD) of a counterparty is assessed
over the next twelve months time
horizon and expressed as a percen-
tage. The Group does not rate
through the cycle. PD is the primary
measure of creditworthiness of a
counterparty. The numerical probabili-
ties of default are mapped into a
26-grade rating scale that is similar
to rating scales widely used by
international rating agencies.
Rating
The result of the objective assess-
ment of the future economic situation
– namely the probability of default
– of counterparties based on present
characteristics and assumptions.
The methodology for the rating
assignment strongly depends on the
customer type and the available data.
A broad range of methodologies for
the assessment of the credit risk
is applied, such as expert systems
and econometric approaches.
Regulatory Trading Book and
Banking Book
The regulatory trading book is defined
in Section 1a of the German Banking
Act. It consists of financial instruments
and commodities held with trading
intent or held for the purpose of
hedging the market risk of other
trading book positions; repurchase
transactions, lending transactions
and similar transactions which relate
to trading book positions; name-to-
follow transactions; and receivables
directly related to trading book
positions. Financial instruments and
commodities assigned to the trading
book must be tradable or able to be
hedged.
The regulatory banking book compris-
es of all positions that are not
assigned to the trading book.
Risk-weighted Assets (RWA)
Risk-weighted assets are positions
that carry credit, market and/or
operational risk, weighted accord-
ing to regulatory requirements. RWAs
are regulatory capital requirements
multiplied by 12.5, or in other words,
capital requirements equal 8 % of
RWA.
Securitization
A securitization transaction is defined
as a transaction where payments
depend on the performance of an
underlying pool of exposures and
investments in the securitization are
subordinated. Subordination results
in a ranking among investments in the
securitization. This determines the
order and the amount of payments
or losses to be directed to the holder
of the position, the waterfall structure.

Pillar 3 Report Glossary
103
Standardized Approach
The least sophisticated approach
available under the German
Solvency Regulation for the calcula-
tion of the regulatory capital require-
ments. It measures Credit risk
either pursuant to fixed risk weights,
which are predefined by regulation
or through the application of external
ratings.
Value-at-risk
For a given portfolio, the value-at-risk
is an estimate of the potential future
loss (in terms of market value) that,
under normal market conditions, will
not be exceeded in a defined period
of time and with a defined
Confidence level.
Wrong Way Risk
Risk that occurs when exposure to
a counterparty is adversely correlated
with the credit quality of that counter-
party.

Pillar 3 Report Impressum
104
Deutsche Bank Aktiengesellschaft
Theodor-Heuss-Allee 70
60262 Frankfurt am Main
Germany
Telephone: +49 69 9 10-00
Investor Relations:
+49 69 9 10-3 80 80
Basel II Pillar 3 Report,
Annual Review 2009 and
Financial Report 2009 on the Internet:
www.deutsche-bank.com/09
Cautionary statement regarding
forward-looking statements
This report contains forward-looking
statements. Forward-looking statements
are statements that are not historical facts;
they include statements about the Group’s
beliefs and expectations and the assump-
tions underlying them. These statements
are based on plans, estimates and
projections as they are currently available
to the management of Deutsche Bank.
Forward-looking statements therefore
speak only as of the date they are made,
and the Group undertakes no obligation
to update publicly any of them in light of
new information or future events.
By their very nature, forward-looking
statements involve risks and uncertainties.
A number of important factors could
therefore cause actual results to differ
materially from those contained in any
forward-looking statement. Such factors
include the conditions in the financial
markets in Germany, in Europe, in the
United States and elsewhere from which
the Group derives a substantial portion of
the Group’s trading revenues, potential
defaults of borrowers or trading counter-
parties, the implementation of the Group’s
management agenda, the reliability of the
Group’s risk management policies,
procedures and methods, and other risks
referenced in the Group’s filings with the
U.S. Securities and Exchange Commission.
Such factors are described in detail in
the SEC Form 20-F of 16 March 2010 in
the section “Risk Factors”. Copies of
this document are available upon
request or can be downloaded from
www.deutsche-bank.com/ir
Impressum


Bas
el II
Pill
ar 3
Rep
ort
2009
Deu
tsch
e B
ank
Deutsche Bank
Basel II Pillar 3 Report 2009