Embed Size (px)
Citation preview
BASEL IIIPILLAR 3 DISCLOSURE
APS 330: CAPITAL ADEQUACY
& RISK MANAGEMENT IN ANZ
HALF YEAR ENDED 31 MARCH 2013
2013
ANZ Basel III Pillar 3 disclosure March 2013
1
Important notice This document has been prepared by Australia and New Zealand Banking Group Limited (ANZ) to meet its disclosure obligations under the Australian Prudential Regulation Authority (APRA) Australian Prudential Standard (APS) 330 Capital Adequacy: Public Disclosure of Prudential Information. This disclosure was prepared as at 31 March 2013. ANZ has a continuous disclosure policy, under which ANZ will immediately notify the market of any material price sensitive information concerning the Group, in accordance with legislative and regulatory disclosure requirements.
ANZ Basel III Pillar 3 disclosure March 2013
2
TABLE OF CONTENTS 1
Chapter 1 – Highlights ........................................................................................................ 3
Chapter 2 – Introduction .................................................................................................... 5
Chapter 3 – Group structure and capital adequacy ................................................................. 6
Table 1 Capital deficiencies in non-consolidated subsidiaries ......................................... 6
Table 2 Capital structure .......................................................................................... 6
Table 3 Capital ratio and risk weighted assets ............................................................. 7
Chapter 4 – Credit risk ....................................................................................................... 8
Table 4 Credit risk – General disclosures .................................................................... 8
Table 5 Credit risk – Disclosures for portfolios subject to the Standardised approach and
supervisory risk weighting in the IRB approach .............................................. 21
Table 6 Credit risk – Disclosures for portfolios subject to Advanced IRB approaches ...... 22
Table 7 Credit risk mitigation disclosures.................................................................. 30
Chapter 5 – Securitisation ................................................................................................. 33
Table 9 Banking Book - Securitisation disclosures ...................................................... 33
Trading Book - Securitisation disclosures ...................................................... 42
Chapter 6 – Market risk .................................................................................................... 46
Table 10 Market risk – Standard approach ................................................................. 46
Table 11 Market risk – Internal models approach ....................................................... 47
Chapter 7 – Equities ........................................................................................................ 48
Table 13 Equities – Disclosures for banking book positions ........................................... 48
Chapter 8 – Interest Rate Risk in the Banking Book ............................................................. 49
Table 14 Interest Rate Risk in the Banking Book ......................................................... 49
Appendix 1 – Detail of capital structure .............................................................................. 50
Appendix 2 – ANZ Bank (Europe) Limited ........................................................................... 52
Glossary.......... ............................................................................................................... 53
1 Each table reference adopted in this document aligns to those required by APS 330 to be disclosed at half year.
ANZ Basel III Pillar 3 disclosure March 2013
3
Chapter 1 – Highlights
2.5% Capital Conservation
Buffer
4.5% CET1 Minimum
774.6741.3706.9
0
100
200
300
400
500
600
700
800
900
Mar 12 Sep 12 Mar 13
$bn
Corporate Bank & Sovereign
Residential Mortgage QRR & Other Retail
Specialised Lending Other
Standardised
200
210
220
230
240
250
260
270
280
Sep 12 Growth Data
Review
FX
Impact
Risk Basel III
Introduction
Mar 13
14.1
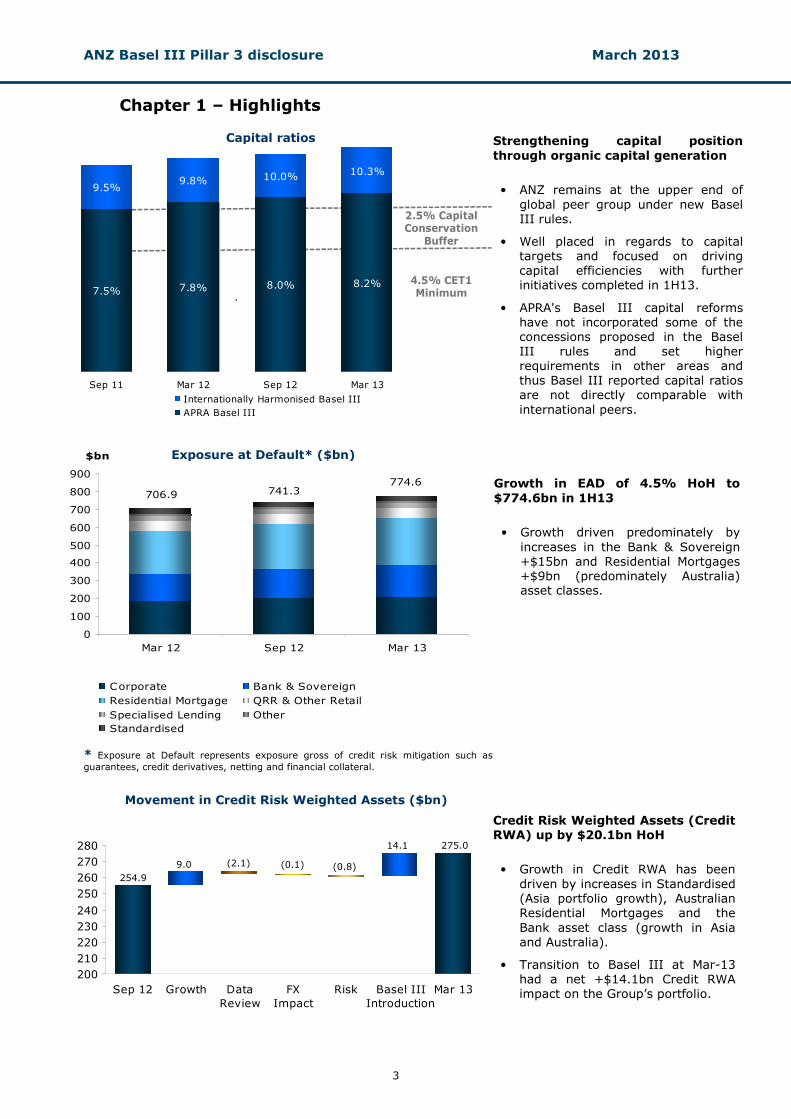
Strengthening capital position
through organic capital generation
• ANZ remains at the upper end of
global peer group under new Basel III rules.
• Well placed in regards to capital targets and focused on driving capital efficiencies with further initiatives completed in 1H13.
• APRA's Basel III capital reforms have not incorporated some of the concessions proposed in the Basel III rules and set higher requirements in other areas and thus Basel III reported capital ratios are not directly comparable with
international peers.
Capital ratios
7.5% 7.8% 8.0% 8.2%
10.3%10.0%9.8%
9.5%
Sep 11 Mar 12 Sep 12 Mar 13
Internationally Harmonised Basel III
APRA Basel III
.
Growth in EAD of 4.5% HoH to
$774.6bn in 1H13
• Growth driven predominately by
increases in the Bank & Sovereign +$15bn and Residential Mortgages +$9bn (predominately Australia) asset classes.
* Exposure at Default represents exposure gross of credit risk mitigation such as
guarantees, credit derivatives, netting and financial collateral.
Exposure at Default* ($bn)
Movement in Credit Risk Weighted Assets ($bn)
Credit Risk Weighted Assets (Credit RWA) up by $20.1bn HoH
• Growth in Credit RWA has been
driven by increases in Standardised (Asia portfolio growth), Australian Residential Mortgages and the
Bank asset class (growth in Asia and Australia).
• Transition to Basel III at Mar-13 had a net +$14.1bn Credit RWA impact on the Group’s portfolio.
254.9
9.0 (2.1) (0.1) (0.8)
14.1 275.0
ANZ Basel III Pillar 3 disclosure March 2013
4
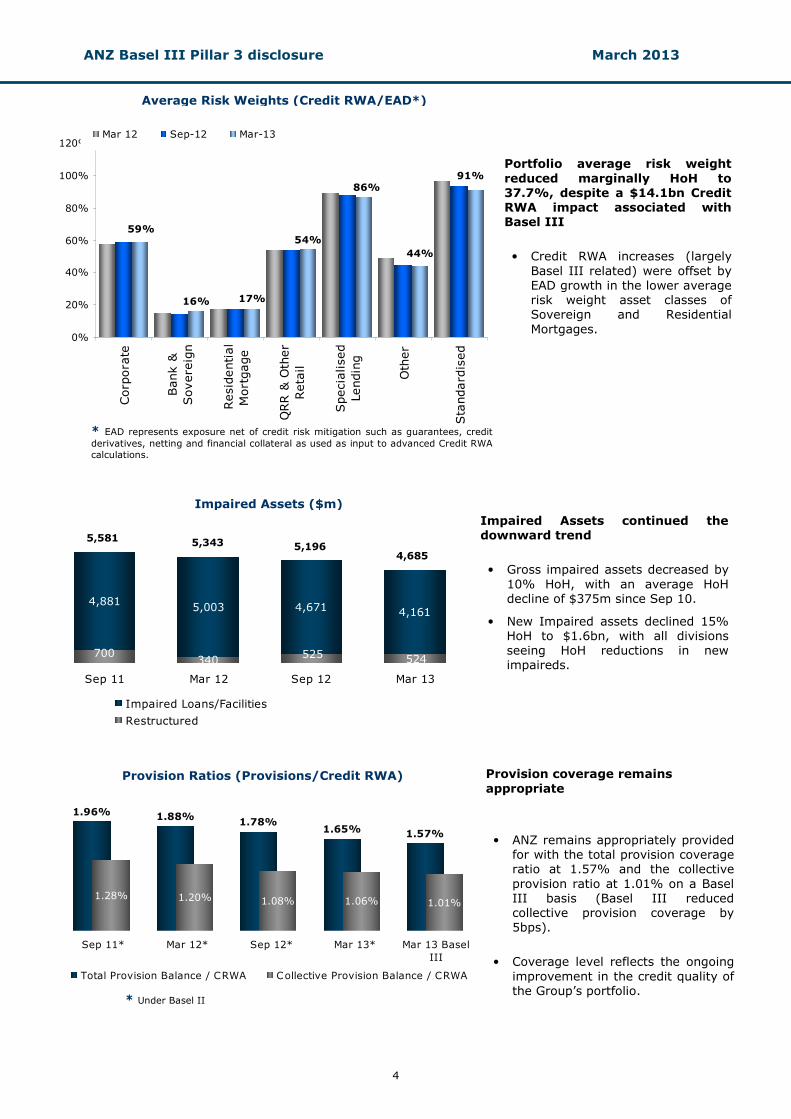
59%
44%
91%86%
54%
16% 17%
0%
20%
40%
60%
80%
100%
120%
Corp
ora
te
Bank &
Sovere
ign
Residential
Mortgage
QRR &
Other
Retail
Specialised
Lending
Other
Standard
ised
Mar 12 Sep-12 Mar-13
4,8815,003 4,671 4,161
525340 524
700
Sep 11 Mar 12 Sep 12 Mar 13
Impaired Loans/Facilities
Restructured
Provision Ratios (Provisions/Credit RWA)
Impaired Assets ($m)
Portfolio average risk weight
reduced marginally HoH to 37.7%, despite a $14.1bn Credit RWA impact associated with Basel III
• Credit RWA increases (largely
Basel III related) were offset by EAD growth in the lower average risk weight asset classes of Sovereign and Residential
Mortgages.
Impaired Assets continued the downward trend
• Gross impaired assets decreased by
10% HoH, with an average HoH decline of $375m since Sep 10.
• New Impaired assets declined 15% HoH to $1.6bn, with all divisions seeing HoH reductions in new impaireds.
5,196 5,343
4,685
* EAD represents exposure net of credit risk mitigation such as guarantees, credit
derivatives, netting and financial collateral as used as input to advanced Credit RWA
calculations.
Average Risk Weights (Credit RWA/EAD*)
5,581
1.96% 1.88%1.78%
1.57%
1.28% 1.20% 1.08% 1.01%
1.65%
1.06%
Sep 11* Mar 12* Sep 12* Mar 13* Mar 13 Basel
III
Total Provision Balance / CRWA Collective Provision Balance / CRWA
Provision coverage remains
appropriate
• ANZ remains appropriately provided for with the total provision coverage ratio at 1.57% and the collective
provision ratio at 1.01% on a Basel III basis (Basel III reduced collective provision coverage by 5bps).
• Coverage level reflects the ongoing
improvement in the credit quality of the Group’s portfolio.
* Under Basel II
ANZ Basel III Pillar 3 disclosure March 2013
5
Chapter 2 – Introduction Purpose of this document This document has been prepared in accordance with the Australian Prudential Regulation Authority (APRA) Australian Prudential Standard (APS) 330 Capital Adequacy: Public Disclosure of Prudential Information (APS 330). APS 330 mandates the release to the investment community and general public of information relating to capital adequacy and risk management practices. APS 330 was established to implement Pillar 3 of the Basel Committee on Banking Supervision’s framework for bank capital adequacy’2. In simple terms, the Basel framework consists of three mutually reinforcing ‘Pillars’:
Pillar 1
Minimum capital requirement
Pillar 2
Supervisory review process
Pillar 3
Market discipline
Minimum capital requirements
for Credit Risk, Operational Risk, Market Risk and Interest Rate Risk in the Banking Book
Firm-wide risk oversight,
Internal Capital Adequacy Assessment Process (ICAAP), consideration of additional risks, capital buffers and targets and risk concentrations, etc
Regular disclosure to the
market of qualitative and quantitative aspects of risk management, capital adequacy and underlying risk metrics
APS 330 requires the publication of various levels of information on a quarterly, semi-annual and annual basis. This document is the semi-annual disclosure. Basel in ANZ In December 2007, ANZ received accreditation for the most advanced approaches permitted under Basel for credit risk and operational risk, complementing its accreditation for market risk. Effective January 2013 ANZ adopted APRA requirements for Basel III with respect to the measurement and monitoring of regulatory capital. Prior period comparatives in this disclosure are under Basel II approach. Verification of disclosures These Pillar 3 disclosures have been verified in accordance with Board approved policy, including ensuring consistency with information contained in ANZ’s Annual Report and in Pillar 1 returns provided to APRA. This Pillar 3 disclosure is not audited by ANZ’s external auditor.
Comparison to ANZ’s Annual Report These disclosures have been produced in accordance with regulatory capital adequacy concepts and rules, rather than in accordance with accounting policies adopted in ANZ’s Annual Report. As such, there are differences in some common areas of disclosures. These differences are most pronounced in the credit risk disclosures, for instance: • The principal method for measuring the amount at risk is Exposure at Default (EAD), which is the
estimated amount of exposure likely to be owed on a credit obligation at the time of default. Under the Advanced Internal Ratings Based (IRB) approach in APS 113 Capital Adequacy: Internal Ratings-based Approach to Credit Risk, banks are accredited to provide their own estimates of EAD for all exposures (drawn, commitments or contingents) reflecting the current balance as well as the likelihood of additional drawings prior to default.
• Loss Given Default (LGD) is an estimate of the amount of losses expected in the event of default. LGD is essentially calculated as the amount at risk (EAD) less expected net recoveries from realisation of collateral as well as any post default repayments of principal and interest.
• Most credit risk disclosures split ANZ’s portfolio into regulatory asset classes, which span areas of ANZ’s internal divisional and business unit organisational structure.
Unless otherwise stated, all amounts are rounded to AUD millions.
2 Basel Committee on Banking Supervision, International Convergence of Capital Measurement and Capital
Standards: A Revised Framework, 2004.
ANZ Basel III Pillar 3 disclosure March 2013
6
Chapter 3 – Group structure and capital adequacy
Top Corporate Entity The top corporate entity in the Group is Australia and New Zealand Banking Group Limited.
Table 1 Capital deficiencies in non-consolidated subsidiaries
The aggregate amount of any under-capitalisation of a non-consolidated subsidiary (or subsidiaries) that is required to be deducted from capital is nil (September 2012: nil; March 2012: nil).
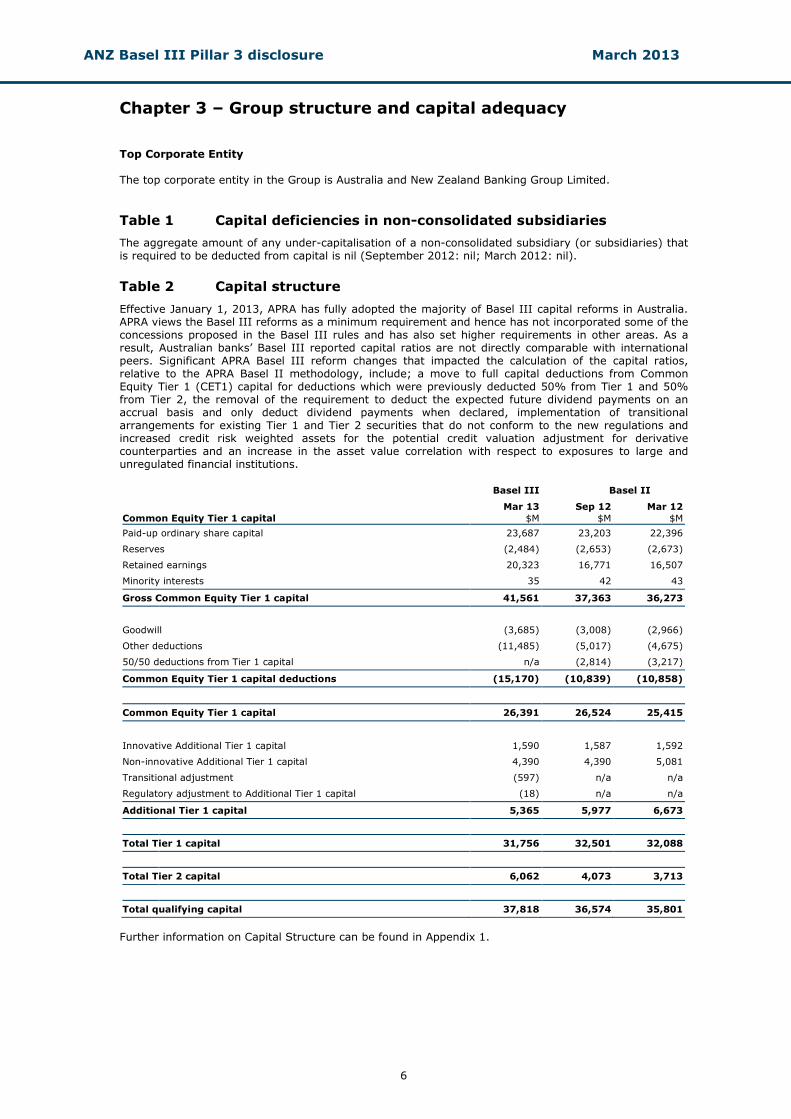
Table 2 Capital structure
Effective January 1, 2013, APRA has fully adopted the majority of Basel III capital reforms in Australia. APRA views the Basel III reforms as a minimum requirement and hence has not incorporated some of the concessions proposed in the Basel III rules and has also set higher requirements in other areas. As a result, Australian banks’ Basel III reported capital ratios are not directly comparable with international peers. Significant APRA Basel III reform changes that impacted the calculation of the capital ratios, relative to the APRA Basel II methodology, include; a move to full capital deductions from Common Equity Tier 1 (CET1) capital for deductions which were previously deducted 50% from Tier 1 and 50% from Tier 2, the removal of the requirement to deduct the expected future dividend payments on an accrual basis and only deduct dividend payments when declared, implementation of transitional arrangements for existing Tier 1 and Tier 2 securities that do not conform to the new regulations and increased credit risk weighted assets for the potential credit valuation adjustment for derivative counterparties and an increase in the asset value correlation with respect to exposures to large and unregulated financial institutions.
Basel III Basel II
Mar 13 Sep 12 Mar 12
Common Equity Tier 1 capital $M $M $M
Paid-up ordinary share capital 23,687 23,203 22,396
Reserves (2,484) (2,653) (2,673)
Retained earnings 20,323 16,771 16,507
Minority interests 35 42 43
Gross Common Equity Tier 1 capital 41,561 37,363 36,273
Goodwill (3,685) (3,008) (2,966)
Other deductions (11,485) (5,017) (4,675)
50/50 deductions from Tier 1 capital n/a (2,814) (3,217)
Common Equity Tier 1 capital deductions (15,170) (10,839) (10,858)
Common Equity Tier 1 capital 26,391 26,524 25,415
Innovative Additional Tier 1 capital 1,590 1,587 1,592
Non-innovative Additional Tier 1 capital 4,390 4,390 5,081
Transitional adjustment (597) n/a n/a
Regulatory adjustment to Additional Tier 1 capital (18) n/a n/a
Additional Tier 1 capital 5,365 5,977 6,673
Total Tier 1 capital 31,756 32,501 32,088
Total Tier 2 capital 6,062 4,073 3,713
Total qualifying capital 37,818 36,574 35,801
Further information on Capital Structure can be found in Appendix 1.
ANZ Basel III Pillar 3 disclosure March 2013
7
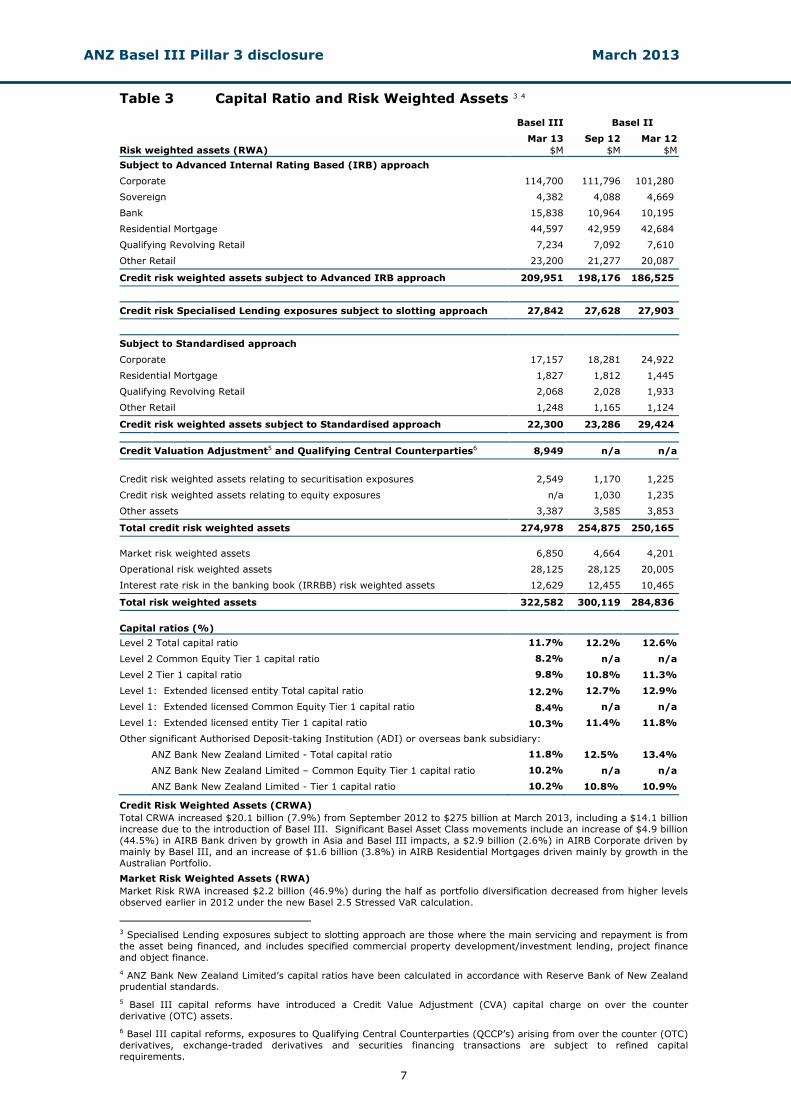
Table 3 Capital Ratio and Risk Weighted Assets 3 4
Basel III Basel II
Mar 13 Sep 12 Mar 12
Risk weighted assets (RWA) $M $M $M
Subject to Advanced Internal Rating Based (IRB) approach
Corporate 114,700 111,796 101,280
Sovereign 4,382 4,088 4,669
Bank 15,838 10,964 10,195
Residential Mortgage 44,597 42,959 42,684
Qualifying Revolving Retail 7,234 7,092 7,610
Other Retail 23,200 21,277 20,087
Credit risk weighted assets subject to Advanced IRB approach 209,951 198,176 186,525
Credit risk Specialised Lending exposures subject to slotting approach 27,842 27,628 27,903
Subject to Standardised approach
Corporate 17,157 18,281 24,922
Residential Mortgage 1,827 1,812 1,445
Qualifying Revolving Retail 2,068 2,028 1,933
Other Retail 1,248 1,165 1,124
Credit risk weighted assets subject to Standardised approach 22,300 23,286 29,424
Credit Valuation Adjustment5 and Qualifying Central Counterparties6 8,949 n/a n/a
Credit risk weighted assets relating to securitisation exposures 2,549 1,170 1,225
Credit risk weighted assets relating to equity exposures n/a 1,030 1,235
Other assets 3,387 3,585 3,853
Total credit risk weighted assets 274,978 254,875 250,165
Market risk weighted assets 6,850 4,664 4,201
Operational risk weighted assets 28,125 28,125 20,005
Interest rate risk in the banking book (IRRBB) risk weighted assets 12,629 12,455 10,465
Total risk weighted assets 322,582 300,119 284,836
Capital ratios (%)
Level 2 Total capital ratio 11.7% 12.2% 12.6%
Level 2 Common Equity Tier 1 capital ratio 8.2% n/a n/a
Level 2 Tier 1 capital ratio 9.8% 10.8% 11.3%
Level 1: Extended licensed entity Total capital ratio 12.2% 12.7% 12.9%
Level 1: Extended licensed Common Equity Tier 1 capital ratio 8.4% n/a n/a
Level 1: Extended licensed entity Tier 1 capital ratio 10.3% 11.4% 11.8%
Other significant Authorised Deposit-taking Institution (ADI) or overseas bank subsidiary:
ANZ Bank New Zealand Limited - Total capital ratio 11.8% 12.5% 13.4%
ANZ Bank New Zealand Limited – Common Equity Tier 1 capital ratio 10.2% n/a n/a
ANZ Bank New Zealand Limited - Tier 1 capital ratio 10.2% 10.8% 10.9%
Credit Risk Weighted Assets (CRWA)
Total CRWA increased $20.1 billion (7.9%) from September 2012 to $275 billion at March 2013, including a $14.1 billion
increase due to the introduction of Basel III. Significant Basel Asset Class movements include an increase of $4.9 billion
(44.5%) in AIRB Bank driven by growth in Asia and Basel III impacts, a $2.9 billion (2.6%) in AIRB Corporate driven by
mainly by Basel III, and an increase of $1.6 billion (3.8%) in AIRB Residential Mortgages driven mainly by growth in the
Australian Portfolio.
Market Risk Weighted Assets (RWA)
Market Risk RWA increased $2.2 billion (46.9%) during the half as portfolio diversification decreased from higher levels
observed earlier in 2012 under the new Basel 2.5 Stressed VaR calculation.
3 Specialised Lending exposures subject to slotting approach are those where the main servicing and repayment is from
the asset being financed, and includes specified commercial property development/investment lending, project finance
and object finance.
4 ANZ Bank New Zealand Limited’s capital ratios have been calculated in accordance with Reserve Bank of New Zealand prudential standards.
5 Basel III capital reforms have introduced a Credit Value Adjustment (CVA) capital charge on over the counter
derivative (OTC) assets.
6 Basel III capital reforms, exposures to Qualifying Central Counterparties (QCCP’s) arising from over the counter (OTC)
derivatives, exchange-traded derivatives and securities financing transactions are subject to refined capital
requirements.
ANZ Basel III Pillar 3 disclosure March 2013
8
Chapter 4 – Credit risk
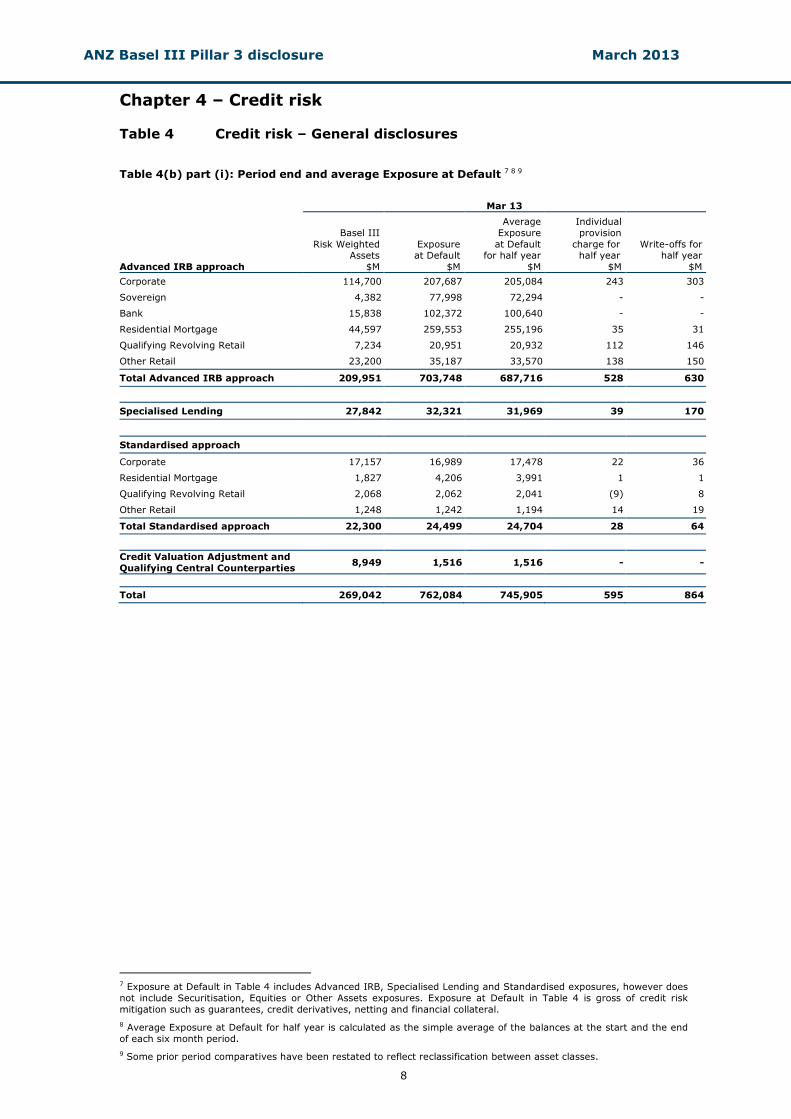
Table 4 Credit risk – General disclosures
Table 4(b) part (i): Period end and average Exposure at Default 7 8 9
Mar 13
Advanced IRB approach
Basel III
Risk Weighted Assets
$M
Exposure at Default
$M
Average
Exposure
at Default for half year
$M
Individual
provision
charge for half year
$M
Write-offs for half year
$M
Corporate 114,700 207,687 205,084 243 303
Sovereign 4,382 77,998 72,294 - -
Bank 15,838 102,372 100,640 - -
Residential Mortgage 44,597 259,553 255,196 35 31
Qualifying Revolving Retail 7,234 20,951 20,932 112 146
Other Retail 23,200 35,187 33,570 138 150
Total Advanced IRB approach 209,951 703,748 687,716 528 630
Specialised Lending 27,842 32,321 31,969 39 170
Standardised approach
Corporate 17,157 16,989 17,478 22 36
Residential Mortgage 1,827 4,206 3,991 1 1
Qualifying Revolving Retail 2,068 2,062 2,041 (9) 8
Other Retail 1,248 1,242 1,194 14 19
Total Standardised approach 22,300 24,499 24,704 28 64
Credit Valuation Adjustment and
Qualifying Central Counterparties 8,949 1,516 1,516 - -
Total 269,042 762,084 745,905 595 864
7 Exposure at Default in Table 4 includes Advanced IRB, Specialised Lending and Standardised exposures, however does
not include Securitisation, Equities or Other Assets exposures. Exposure at Default in Table 4 is gross of credit risk
mitigation such as guarantees, credit derivatives, netting and financial collateral.
8 Average Exposure at Default for half year is calculated as the simple average of the balances at the start and the end
of each six month period.
9 Some prior period comparatives have been restated to reflect reclassification between asset classes.
ANZ Basel III Pillar 3 disclosure March 2013
9
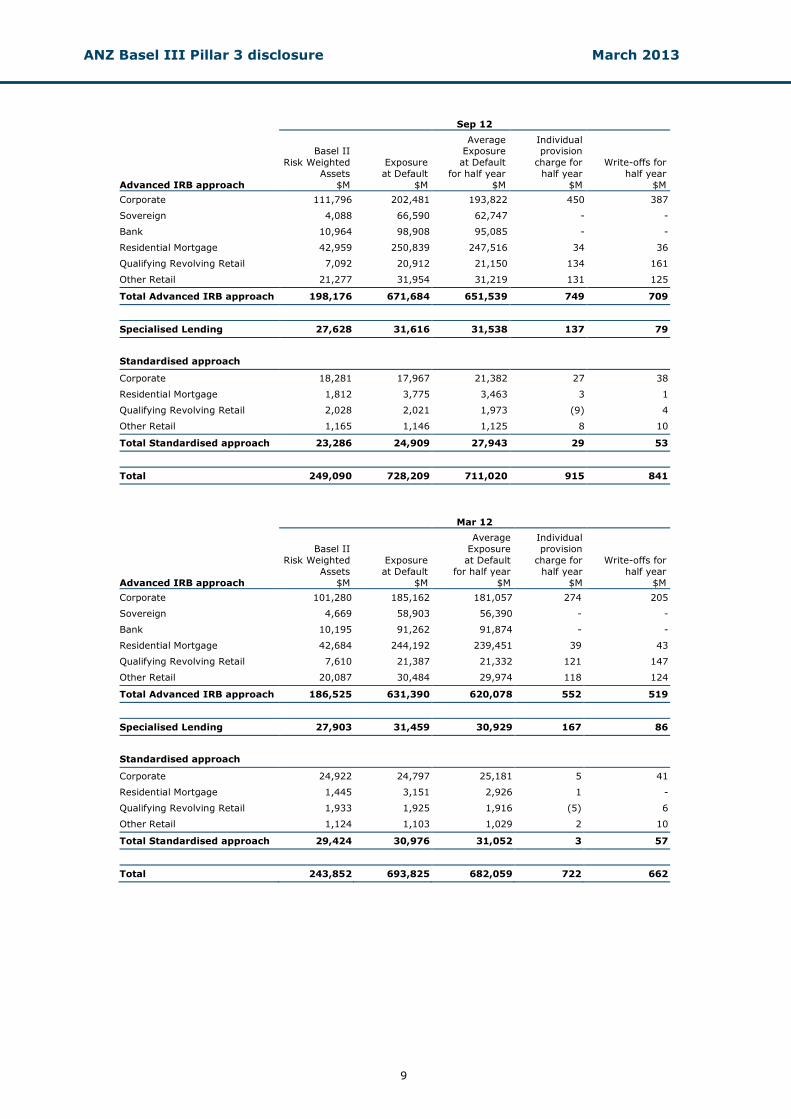
Sep 12
Advanced IRB approach
Basel II
Risk Weighted
Assets
$M
Exposure
at Default
$M
Average Exposure
at Default
for half year
$M
Individual provision
charge for
half year
$M
Write-offs for
half year
$M
Corporate 111,796 202,481 193,822 450 387
Sovereign 4,088 66,590 62,747 - -
Bank 10,964 98,908 95,085 - -
Residential Mortgage 42,959 250,839 247,516 34 36
Qualifying Revolving Retail 7,092 20,912 21,150 134 161
Other Retail 21,277 31,954 31,219 131 125
Total Advanced IRB approach 198,176 671,684 651,539 749 709
Specialised Lending 27,628 31,616 31,538 137 79
Standardised approach
Corporate 18,281 17,967 21,382 27 38
Residential Mortgage 1,812 3,775 3,463 3 1
Qualifying Revolving Retail 2,028 2,021 1,973 (9) 4
Other Retail 1,165 1,146 1,125 8 10
Total Standardised approach 23,286 24,909 27,943 29 53
Total 249,090 728,209 711,020 915 841
Mar 12
Advanced IRB approach
Basel II
Risk Weighted
Assets
$M
Exposure
at Default
$M
Average
Exposure
at Default
for half year
$M
Individual
provision
charge for
half year
$M
Write-offs for
half year
$M
Corporate 101,280 185,162 181,057 274 205
Sovereign 4,669 58,903 56,390 - -
Bank 10,195 91,262 91,874 - -
Residential Mortgage 42,684 244,192 239,451 39 43
Qualifying Revolving Retail 7,610 21,387 21,332 121 147
Other Retail 20,087 30,484 29,974 118 124
Total Advanced IRB approach 186,525 631,390 620,078 552 519
Specialised Lending 27,903 31,459 30,929 167 86
Standardised approach
Corporate 24,922 24,797 25,181 5 41
Residential Mortgage 1,445 3,151 2,926 1 -
Qualifying Revolving Retail 1,933 1,925 1,916 (5) 6
Other Retail 1,124 1,103 1,029 2 10
Total Standardised approach 29,424 30,976 31,052 3 57
Total 243,852 693,825 682,059 722 662
ANZ Basel III Pillar 3 disclosure March 2013
10
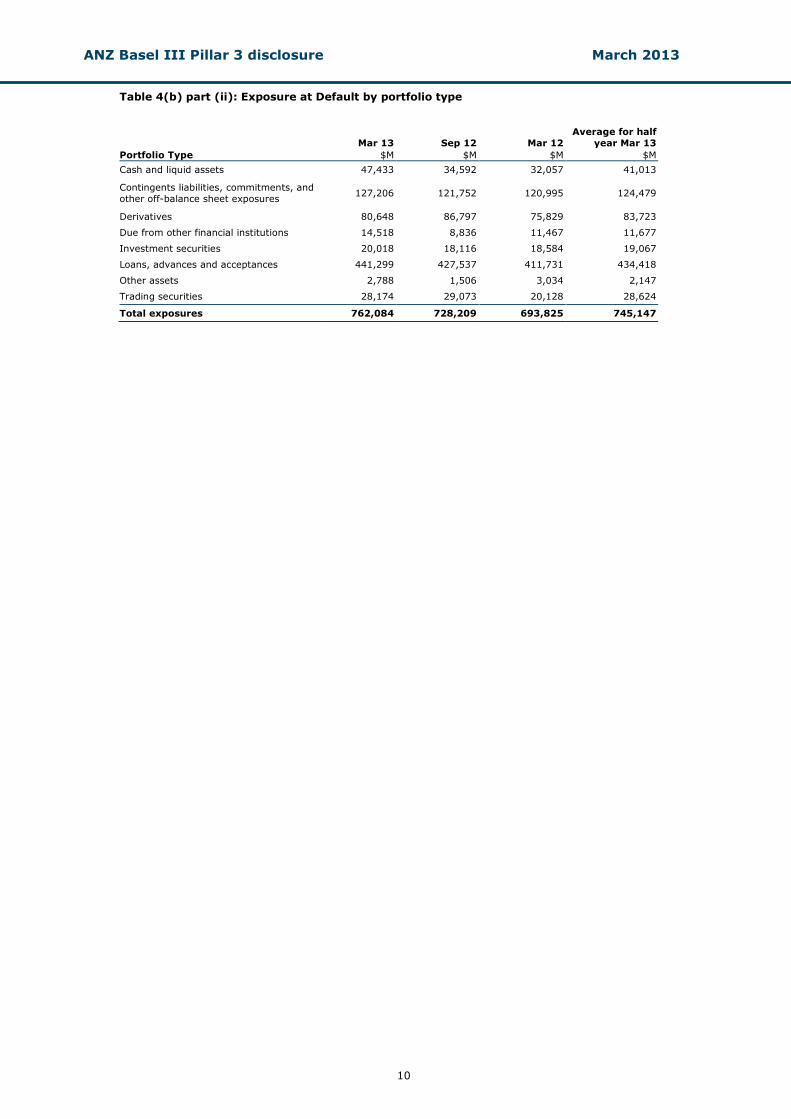
Table 4(b) part (ii): Exposure at Default by portfolio type
Mar 13
Sep 12
Mar 12
Average for half
year Mar 13
Portfolio Type $M $M $M $M
Cash and liquid assets 47,433 34,592 32,057 41,013
Contingents liabilities, commitments, and
other off-balance sheet exposures 127,206 121,752 120,995 124,479
Derivatives 80,648 86,797 75,829 83,723
Due from other financial institutions 14,518 8,836 11,467 11,677
Investment securities 20,018 18,116 18,584 19,067
Loans, advances and acceptances 441,299 427,537 411,731 434,418
Other assets 2,788 1,506 3,034 2,147
Trading securities 28,174 29,073 20,128 28,624
Total exposures 762,084 728,209 693,825 745,147
ANZ Basel III Pillar 3 disclosure March 2013
11
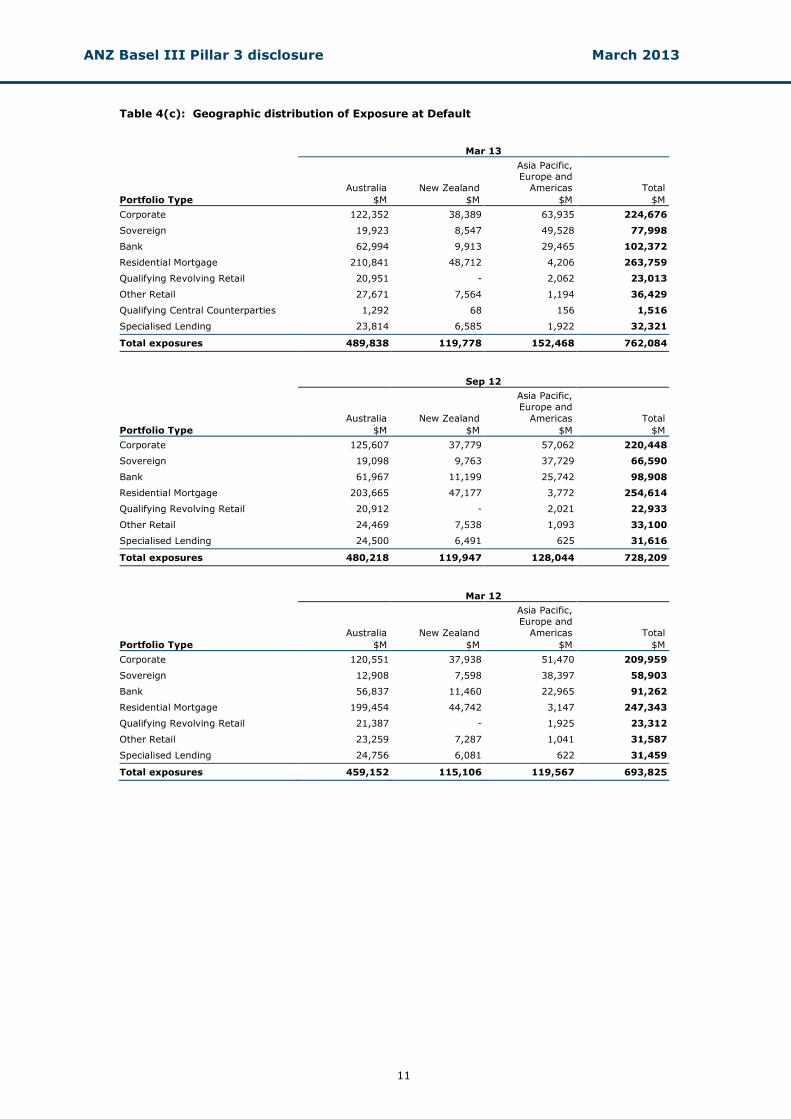
Table 4(c): Geographic distribution of Exposure at Default
Mar 13
Australia New Zealand
Asia Pacific, Europe and
Americas Total
Portfolio Type $M $M $M $M
Corporate 122,352 38,389 63,935 224,676
Sovereign 19,923 8,547 49,528 77,998
Bank 62,994 9,913 29,465 102,372
Residential Mortgage 210,841 48,712 4,206 263,759
Qualifying Revolving Retail 20,951 - 2,062 23,013
Other Retail 27,671 7,564 1,194 36,429
Qualifying Central Counterparties 1,292 68 156 1,516
Specialised Lending 23,814 6,585 1,922 32,321
Total exposures 489,838 119,778 152,468 762,084
Sep 12
Australia New Zealand
Asia Pacific,
Europe and
Americas Total
Portfolio Type $M $M $M $M
Corporate 125,607 37,779 57,062 220,448
Sovereign 19,098 9,763 37,729 66,590
Bank 61,967 11,199 25,742 98,908
Residential Mortgage 203,665 47,177 3,772 254,614
Qualifying Revolving Retail 20,912 - 2,021 22,933
Other Retail 24,469 7,538 1,093 33,100
Specialised Lending 24,500 6,491 625 31,616
Total exposures 480,218 119,947 128,044 728,209
Mar 12
Australia New Zealand
Asia Pacific,
Europe and
Americas Total
Portfolio Type $M $M $M $M
Corporate 120,551 37,938 51,470 209,959
Sovereign 12,908 7,598 38,397 58,903
Bank 56,837 11,460 22,965 91,262
Residential Mortgage 199,454 44,742 3,147 247,343
Qualifying Revolving Retail 21,387 - 1,925 23,312
Other Retail 23,259 7,287 1,041 31,587
Specialised Lending 24,756 6,081 622 31,459
Total exposures 459,152 115,106 119,567 693,825
ANZ Basel III Pillar 3 disclosure March 2013
12
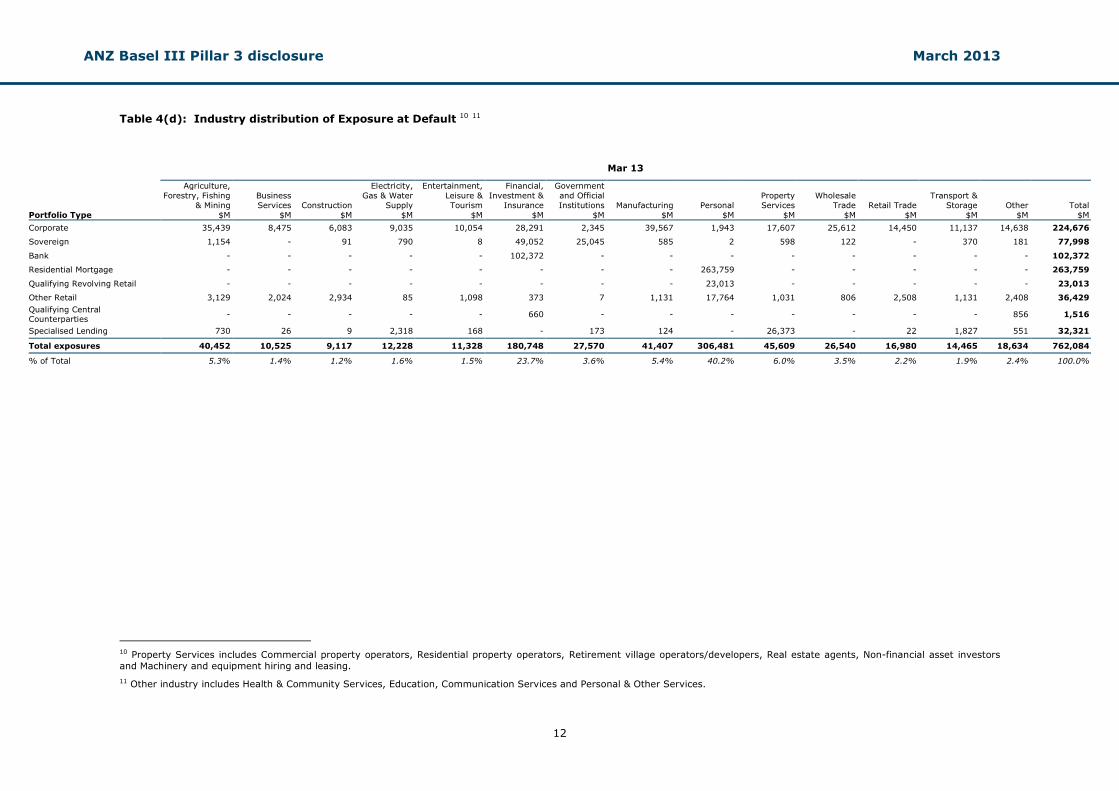
Table 4(d): Industry distribution of Exposure at Default 10 11
10 Property Services includes Commercial property operators, Residential property operators, Retirement village operators/developers, Real estate agents, Non-financial asset investors
and Machinery and equipment hiring and leasing.
11 Other industry includes Health & Community Services, Education, Communication Services and Personal & Other Services.
Mar 13
Portfolio Type
Agriculture,
Forestry, Fishing
& Mining
$M
Business
Services
$M
Construction
$M
Electricity,
Gas & Water
Supply
$M
Entertainment,
Leisure &
Tourism
$M
Financial,
Investment &
Insurance
$M
Government
and Official
Institutions
$M
Manufacturing
$M
Personal
$M
Property
Services
$M
Wholesale
Trade
$M
Retail Trade
$M
Transport &
Storage
$M
Other
$M
Total
$M
Corporate 35,439 8,475 6,083 9,035 10,054 28,291 2,345 39,567 1,943 17,607 25,612 14,450 11,137 14,638 224,676
Sovereign 1,154 - 91 790 8 49,052 25,045 585 2 598 122 - 370 181 77,998
Bank - - - - - 102,372 - - - - - - - - 102,372
Residential Mortgage - - - - - - - - 263,759 - - - - - 263,759
Qualifying Revolving Retail - - - - - - - - 23,013 - - - - - 23,013
Other Retail 3,129 2,024 2,934 85 1,098 373 7 1,131 17,764 1,031 806 2,508 1,131 2,408 36,429
Qualifying Central Counterparties
- - - - - 660 - - - - - - - 856 1,516
Specialised Lending 730 26 9 2,318 168 - 173 124 - 26,373 - 22 1,827 551 32,321
Total exposures 40,452 10,525 9,117 12,228 11,328 180,748 27,570 41,407 306,481 45,609 26,540 16,980 14,465 18,634 762,084
% of Total 5.3% 1.4% 1.2% 1.6% 1.5% 23.7% 3.6% 5.4% 40.2% 6.0% 3.5% 2.2% 1.9% 2.4% 100.0%
ANZ Basel III Pillar 3 disclosure March 2013
13
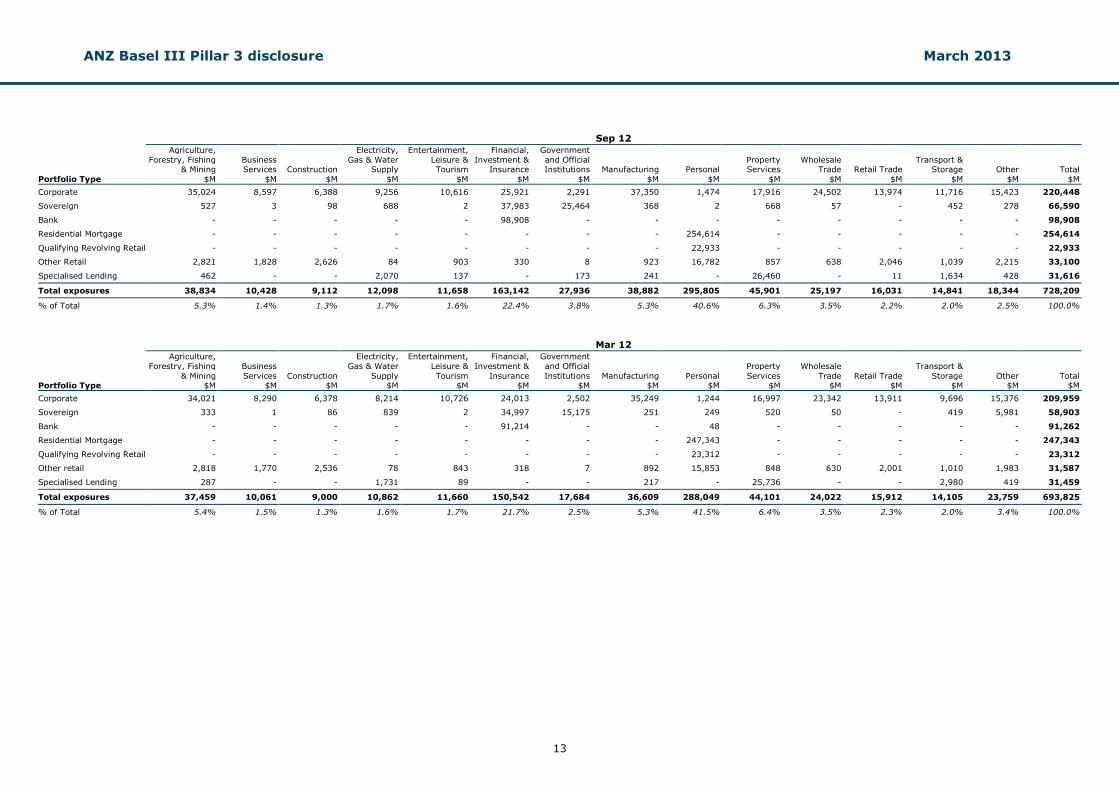
Sep 12
Portfolio Type
Agriculture,
Forestry, Fishing & Mining
$M
Business Services
$M
Construction
$M
Electricity,
Gas & Water Supply
$M
Entertainment,
Leisure & Tourism
$M
Financial,
Investment & Insurance
$M
Government
and Official Institutions
$M
Manufacturing
$M
Personal
$M
Property Services
$M
Wholesale Trade
$M
Retail Trade
$M
Transport & Storage
$M
Other
$M
Total
$M
Corporate 35,024 8,597 6,388 9,256 10,616 25,921 2,291 37,350 1,474 17,916 24,502 13,974 11,716 15,423 220,448
Sovereign 527 3 98 688 2 37,983 25,464 368 2 668 57 - 452 278 66,590
Bank - - - - - 98,908 - - - - - - - - 98,908
Residential Mortgage - - - - - - - - 254,614 - - - - - 254,614
Qualifying Revolving Retail - - - - - - - - 22,933 - - - - - 22,933
Other Retail 2,821 1,828 2,626 84 903 330 8 923 16,782 857 638 2,046 1,039 2,215 33,100
Specialised Lending 462 - - 2,070 137 - 173 241 - 26,460 - 11 1,634 428 31,616
Total exposures 38,834 10,428 9,112 12,098 11,658 163,142 27,936 38,882 295,805 45,901 25,197 16,031 14,841 18,344 728,209
% of Total 5.3% 1.4% 1.3% 1.7% 1.6% 22.4% 3.8% 5.3% 40.6% 6.3% 3.5% 2.2% 2.0% 2.5% 100.0%
Mar 12
Portfolio Type
Agriculture,
Forestry, Fishing
& Mining $M
Business
Services $M
Construction $M
Electricity,
Gas & Water
Supply $M
Entertainment,
Leisure &
Tourism $M
Financial,
Investment &
Insurance $M
Government
and Official
Institutions $M
Manufacturing $M
Personal $M
Property
Services $M
Wholesale
Trade $M
Retail Trade $M
Transport &
Storage $M
Other $M
Total $M
Corporate 34,021 8,290 6,378 8,214 10,726 24,013 2,502 35,249 1,244 16,997 23,342 13,911 9,696 15,376 209,959
Sovereign 333 1 86 839 2 34,997 15,175 251 249 520 50 - 419 5,981 58,903
Bank - - - - - 91,214 - - 48 - - - - - 91,262
Residential Mortgage - - - - - - - - 247,343 - - - - - 247,343
Qualifying Revolving Retail - - - - - - - - 23,312 - - - - - 23,312
Other retail 2,818 1,770 2,536 78 843 318 7 892 15,853 848 630 2,001 1,010 1,983 31,587
Specialised Lending 287 - - 1,731 89 - - 217 - 25,736 - - 2,980 419 31,459
Total exposures 37,459 10,061 9,000 10,862 11,660 150,542 17,684 36,609 288,049 44,101 24,022 15,912 14,105 23,759 693,825
% of Total 5.4% 1.5% 1.3% 1.6% 1.7% 21.7% 2.5% 5.3% 41.5% 6.4% 3.5% 2.3% 2.0% 3.4% 100.0%
ANZ Basel III Pillar 3 disclosure March 2013
14
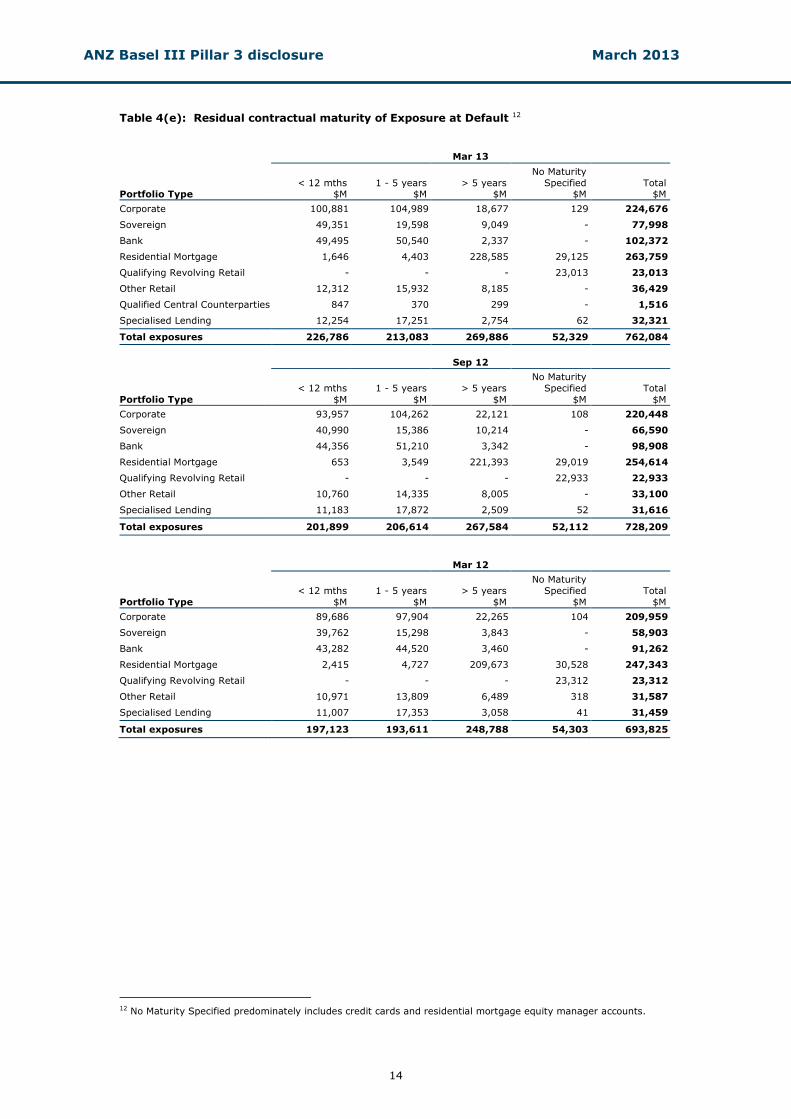
Table 4(e): Residual contractual maturity of Exposure at Default 12 Mar 13
Portfolio Type < 12 mths
$M 1 - 5 years
$M > 5 years
$M
No Maturity
Specified $M
Total $M
Corporate 100,881 104,989 18,677 129 224,676
Sovereign 49,351 19,598 9,049 - 77,998
Bank 49,495 50,540 2,337 - 102,372
Residential Mortgage 1,646 4,403 228,585 29,125 263,759
Qualifying Revolving Retail - - - 23,013 23,013
Other Retail 12,312 15,932 8,185 - 36,429
Qualified Central Counterparties 847 370 299 - 1,516
Specialised Lending 12,254 17,251 2,754 62 32,321
Total exposures 226,786 213,083 269,886 52,329 762,084
Sep 12
Portfolio Type
< 12 mths
$M
1 - 5 years
$M
> 5 years
$M
No Maturity
Specified
$M
Total
$M
Corporate 93,957 104,262 22,121 108 220,448
Sovereign 40,990 15,386 10,214 - 66,590
Bank 44,356 51,210 3,342 - 98,908
Residential Mortgage 653 3,549 221,393 29,019 254,614
Qualifying Revolving Retail - - - 22,933 22,933
Other Retail 10,760 14,335 8,005 - 33,100
Specialised Lending 11,183 17,872 2,509 52 31,616
Total exposures 201,899 206,614 267,584 52,112 728,209
Mar 12
Portfolio Type
< 12 mths
$M
1 - 5 years
$M
> 5 years
$M
No Maturity
Specified
$M
Total
$M
Corporate 89,686 97,904 22,265 104 209,959
Sovereign 39,762 15,298 3,843 - 58,903
Bank 43,282 44,520 3,460 - 91,262
Residential Mortgage 2,415 4,727 209,673 30,528 247,343
Qualifying Revolving Retail - - - 23,312 23,312
Other Retail 10,971 13,809 6,489 318 31,587
Specialised Lending 11,007 17,353 3,058 41 31,459
Total exposures 197,123 193,611 248,788 54,303 693,825
12 No Maturity Specified predominately includes credit cards and residential mortgage equity manager accounts.
ANZ Basel III Pillar 3 disclosure March 2013
15
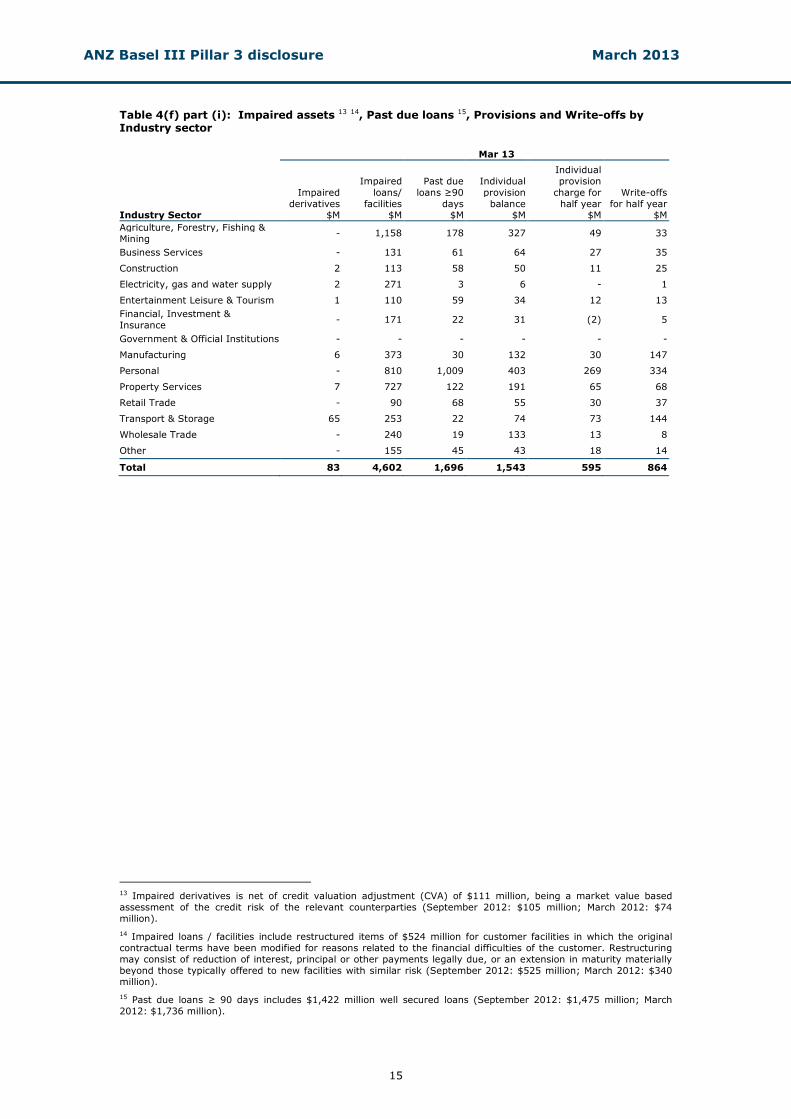
Table 4(f) part (i): Impaired assets 13 14, Past due loans 15, Provisions and Write-offs by Industry sector
Mar 13
Industry Sector
Impaired
derivatives $M
Impaired
loans/
facilities $M
Past due
loans ≥90
days $M
Individual
provision
balance $M
Individual
provision
charge for
half year $M
Write-offs
for half year $M
Agriculture, Forestry, Fishing &
Mining - 1,158 178 327 49 33
Business Services - 131 61 64 27 35
Construction 2 113 58 50 11 25
Electricity, gas and water supply 2 271 3 6 - 1
Entertainment Leisure & Tourism 1 110 59 34 12 13
Financial, Investment &
Insurance - 171 22 31 (2) 5
Government & Official Institutions - - - - - -
Manufacturing 6 373 30 132 30 147
Personal - 810 1,009 403 269 334
Property Services 7 727 122 191 65 68
Retail Trade - 90 68 55 30 37
Transport & Storage 65 253 22 74 73 144
Wholesale Trade - 240 19 133 13 8
Other - 155 45 43 18 14
Total 83 4,602 1,696 1,543 595 864
13 Impaired derivatives is net of credit valuation adjustment (CVA) of $111 million, being a market value based
assessment of the credit risk of the relevant counterparties (September 2012: $105 million; March 2012: $74
million).
14 Impaired loans / facilities include restructured items of $524 million for customer facilities in which the original
contractual terms have been modified for reasons related to the financial difficulties of the customer. Restructuring
may consist of reduction of interest, principal or other payments legally due, or an extension in maturity materially
beyond those typically offered to new facilities with similar risk (September 2012: $525 million; March 2012: $340 million).
15 Past due loans ≥ 90 days includes $1,422 million well secured loans (September 2012: $1,475 million; March
2012: $1,736 million).
ANZ Basel III Pillar 3 disclosure March 2013
16
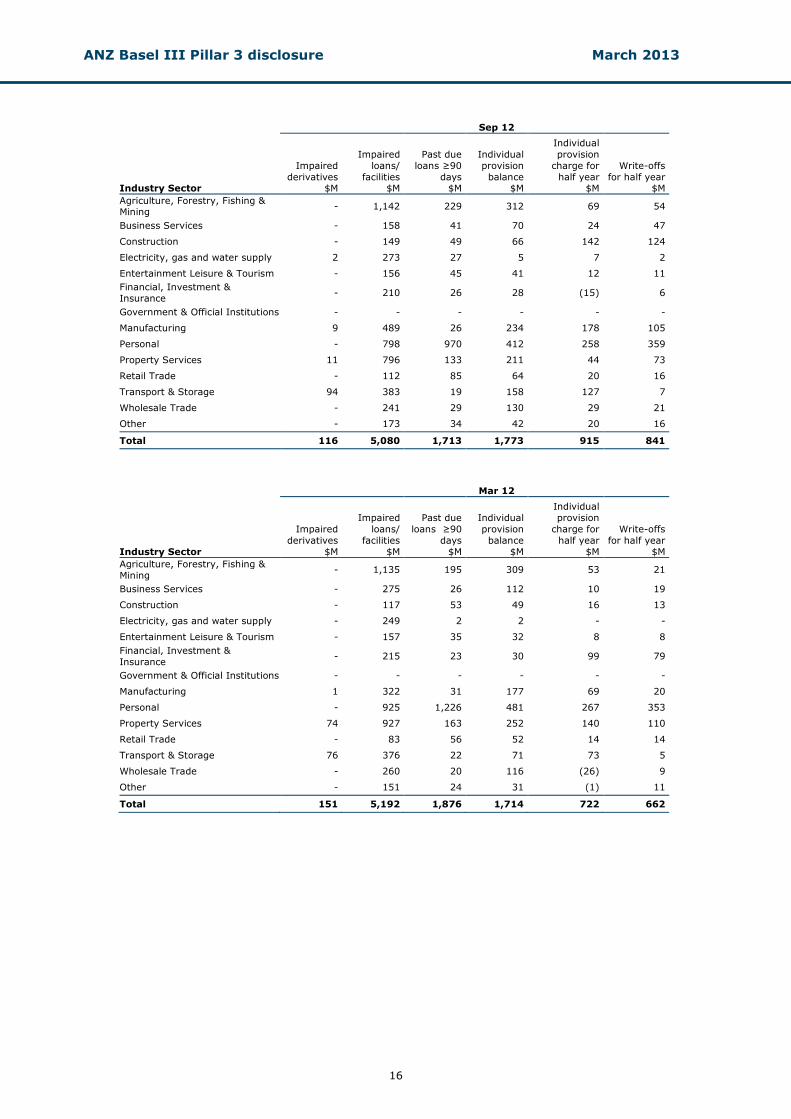
Sep 12
Industry Sector
Impaired
derivatives $M
Impaired
loans/
facilities $M
Past due
loans ≥90
days $M
Individual
provision
balance $M
Individual
provision
charge for
half year $M
Write-offs
for half year $M
Agriculture, Forestry, Fishing & Mining
- 1,142 229 312 69 54
Business Services - 158 41 70 24 47
Construction - 149 49 66 142 124
Electricity, gas and water supply 2 273 27 5 7 2
Entertainment Leisure & Tourism - 156 45 41 12 11
Financial, Investment &
Insurance - 210 26 28 (15) 6
Government & Official Institutions - - - - - -
Manufacturing 9 489 26 234 178 105
Personal - 798 970 412 258 359
Property Services 11 796 133 211 44 73
Retail Trade - 112 85 64 20 16
Transport & Storage 94 383 19 158 127 7
Wholesale Trade - 241 29 130 29 21
Other - 173 34 42 20 16
Total 116 5,080 1,713 1,773 915 841
Mar 12
Industry Sector
Impaired
derivatives
$M
Impaired
loans/
facilities
$M
Past due
loans ≥90
days
$M
Individual
provision
balance
$M
Individual
provision
charge for
half year
$M
Write-offs
for half year
$M
Agriculture, Forestry, Fishing &
Mining - 1,135 195 309 53 21
Business Services - 275 26 112 10 19
Construction - 117 53 49 16 13
Electricity, gas and water supply - 249 2 2 - -
Entertainment Leisure & Tourism - 157 35 32 8 8
Financial, Investment &
Insurance - 215 23 30 99 79
Government & Official Institutions - - - - - -
Manufacturing 1 322 31 177 69 20
Personal - 925 1,226 481 267 353
Property Services 74 927 163 252 140 110
Retail Trade - 83 56 52 14 14
Transport & Storage 76 376 22 71 73 5
Wholesale Trade - 260 20 116 (26) 9
Other - 151 24 31 (1) 11
Total 151 5,192 1,876 1,714 722 662
ANZ Basel III Pillar 3 disclosure March 2013
17
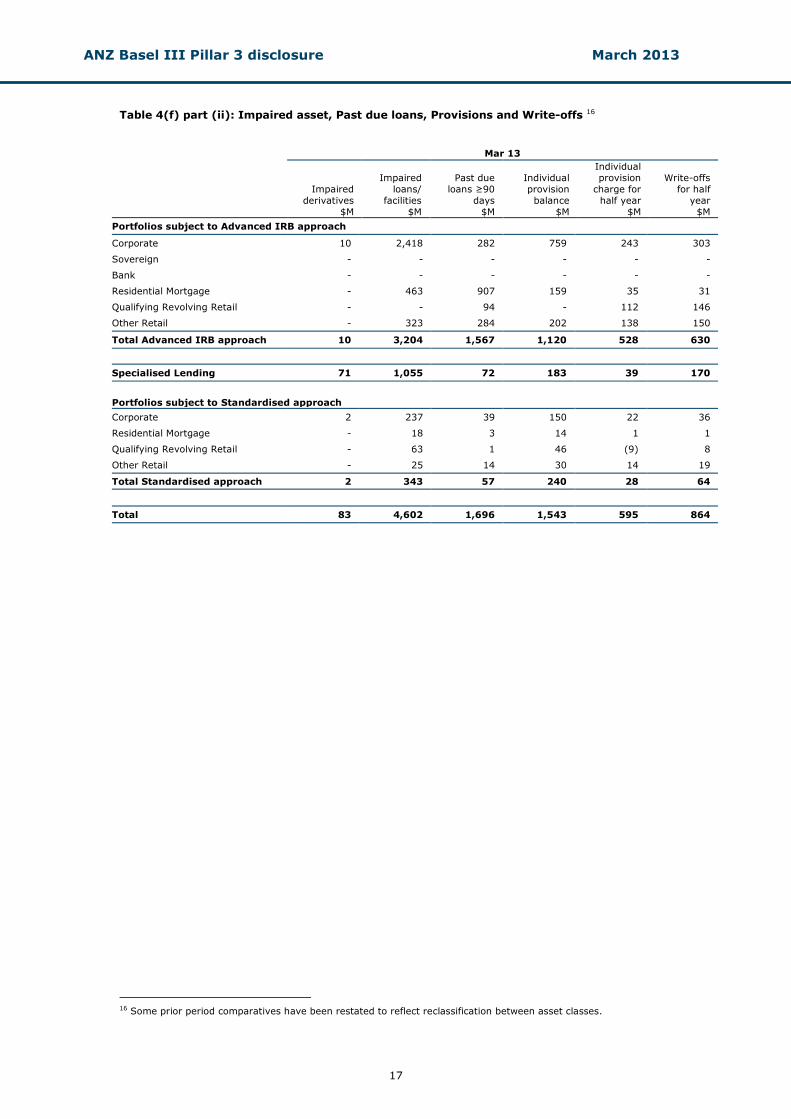
Table 4(f) part (ii): Impaired asset, Past due loans, Provisions and Write-offs 16 Mar 13
Impaired
derivatives
$M
Impaired
loans/
facilities
$M
Past due
loans ≥90
days
$M
Individual
provision
balance
$M
Individual
provision
charge for
half year
$M
Write-offs
for half
year
$M
Portfolios subject to Advanced IRB approach
Corporate 10 2,418 282 759 243 303
Sovereign - - - - - -
Bank - - - - - -
Residential Mortgage - 463 907 159 35 31
Qualifying Revolving Retail - - 94 - 112 146
Other Retail - 323 284 202 138 150
Total Advanced IRB approach 10 3,204 1,567 1,120 528 630
Specialised Lending 71 1,055 72 183 39 170
Portfolios subject to Standardised approach
Corporate 2 237 39 150 22 36
Residential Mortgage - 18 3 14 1 1
Qualifying Revolving Retail - 63 1 46 (9) 8
Other Retail - 25 14 30 14 19
Total Standardised approach 2 343 57 240 28 64
Total 83 4,602 1,696 1,543 595 864
16 Some prior period comparatives have been restated to reflect reclassification between asset classes.
ANZ Basel III Pillar 3 disclosure March 2013
18
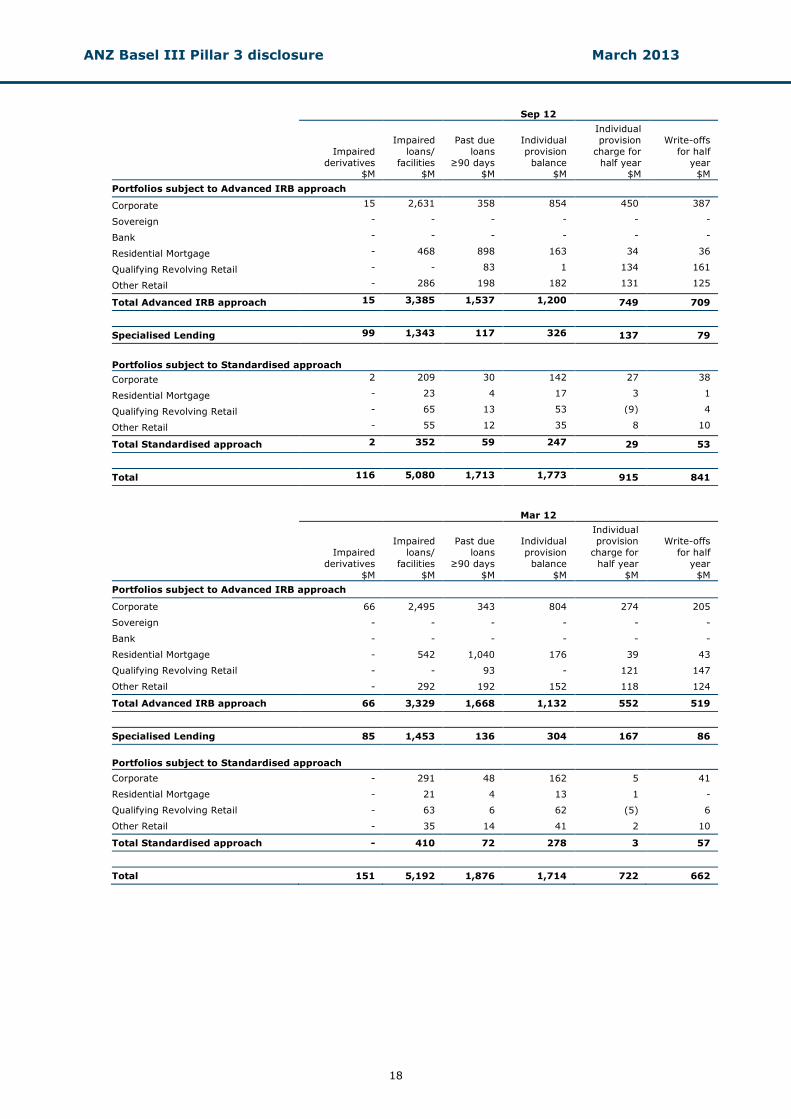
Sep 12
Impaired
derivatives $M
Impaired
loans/
facilities $M
Past due
loans
≥90 days $M
Individual
provision
balance $M
Individual
provision
charge for
half year $M
Write-offs
for half
year $M
Portfolios subject to Advanced IRB approach
Corporate 15 2,631 358 854 450 387
Sovereign - - - - - -
Bank - - - - - -
Residential Mortgage - 468 898 163 34 36
Qualifying Revolving Retail - - 83 1 134 161
Other Retail - 286 198 182 131 125
Total Advanced IRB approach 15 3,385 1,537 1,200 749 709
Specialised Lending 99 1,343 117 326 137 79
Portfolios subject to Standardised approach
Corporate 2 209 30 142 27 38
Residential Mortgage - 23 4 17 3 1
Qualifying Revolving Retail - 65 13 53 (9) 4
Other Retail - 55 12 35 8 10
Total Standardised approach 2 352 59 247 29 53
Total 116 5,080 1,713 1,773 915 841
Mar 12
Impaired
derivatives
$M
Impaired
loans/
facilities
$M
Past due
loans
≥90 days
$M
Individual
provision
balance
$M
Individual
provision
charge for
half year
$M
Write-offs
for half
year
$M
Portfolios subject to Advanced IRB approach
Corporate 66 2,495 343 804 274 205
Sovereign - - - - - -
Bank - - - - - -
Residential Mortgage - 542 1,040 176 39 43
Qualifying Revolving Retail - - 93 - 121 147
Other Retail - 292 192 152 118 124
Total Advanced IRB approach 66 3,329 1,668 1,132 552 519
Specialised Lending 85 1,453 136 304 167 86
Portfolios subject to Standardised approach
Corporate - 291 48 162 5 41
Residential Mortgage - 21 4 13 1 -
Qualifying Revolving Retail - 63 6 62 (5) 6
Other Retail - 35 14 41 2 10
Total Standardised approach - 410 72 278 3 57
Total 151 5,192 1,876 1,714 722 662
ANZ Basel III Pillar 3 disclosure March 2013
19
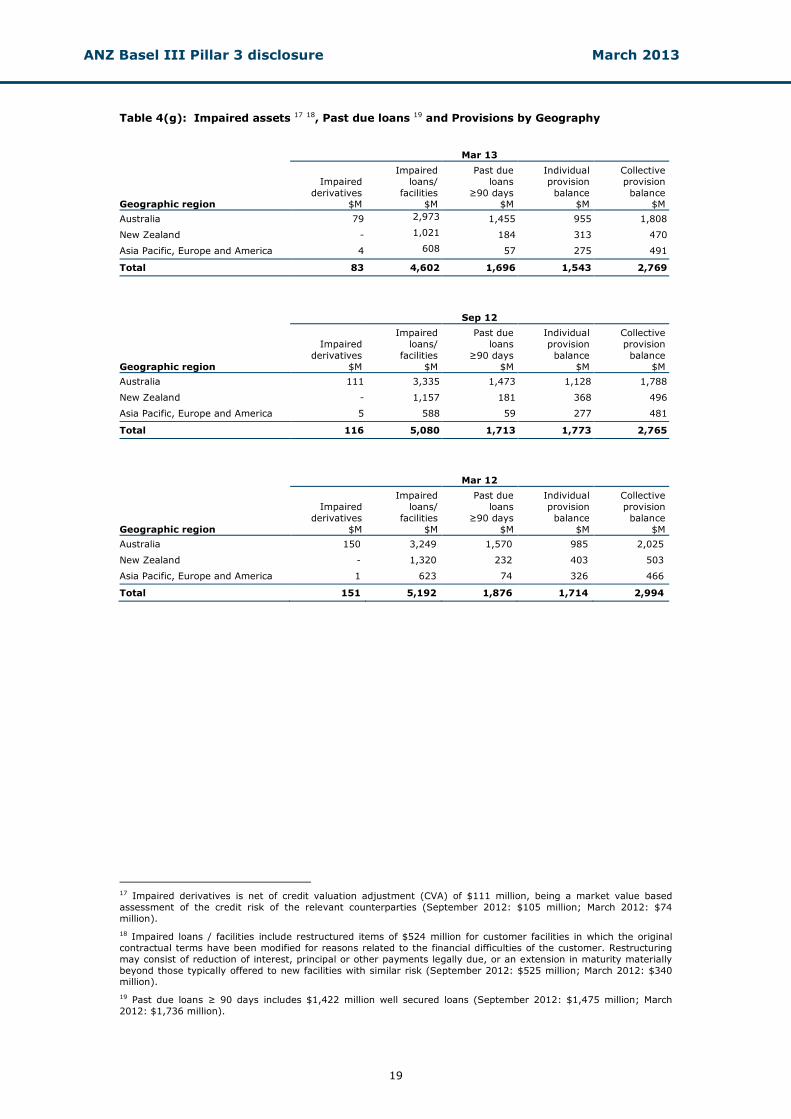
Table 4(g): Impaired assets 17 18, Past due loans 19 and Provisions by Geography Mar 13
Geographic region
Impaired
derivatives $M
Impaired
loans/
facilities $M
Past due
loans
≥90 days $M
Individual
provision
balance $M
Collective
provision
balance $M
Australia 79 2,973 1,455 955 1,808
New Zealand - 1,021 184 313 470
Asia Pacific, Europe and America 4 608 57 275 491
Total 83 4,602 1,696 1,543 2,769
Sep 12
Geographic region
Impaired
derivatives
$M
Impaired
loans/
facilities
$M
Past due
loans
≥90 days
$M
Individual
provision
balance
$M
Collective
provision
balance
$M
Australia 111 3,335 1,473 1,128 1,788
New Zealand - 1,157 181 368 496
Asia Pacific, Europe and America 5 588 59 277 481
Total 116 5,080 1,713 1,773 2,765
Mar 12
Geographic region
Impaired
derivatives
$M
Impaired
loans/
facilities
$M
Past due
loans
≥90 days
$M
Individual
provision
balance
$M
Collective
provision
balance
$M
Australia 150 3,249 1,570 985 2,025
New Zealand - 1,320 232 403 503
Asia Pacific, Europe and America 1 623 74 326 466
Total 151 5,192 1,876 1,714 2,994
17 Impaired derivatives is net of credit valuation adjustment (CVA) of $111 million, being a market value based
assessment of the credit risk of the relevant counterparties (September 2012: $105 million; March 2012: $74
million).
18 Impaired loans / facilities include restructured items of $524 million for customer facilities in which the original
contractual terms have been modified for reasons related to the financial difficulties of the customer. Restructuring
may consist of reduction of interest, principal or other payments legally due, or an extension in maturity materially
beyond those typically offered to new facilities with similar risk (September 2012: $525 million; March 2012: $340 million).
19 Past due loans ≥ 90 days includes $1,422 million well secured loans (September 2012: $1,475 million; March
2012: $1,736 million).
ANZ Basel III Pillar 3 disclosure March 2013
20
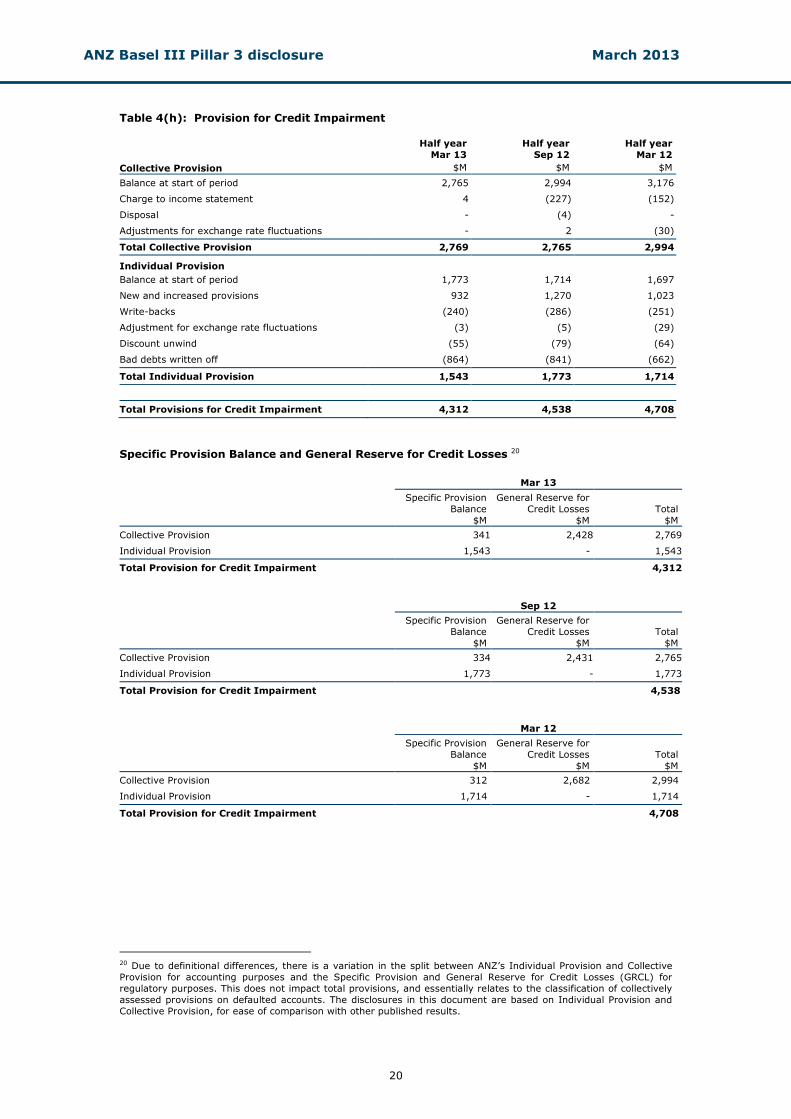
Table 4(h): Provision for Credit Impairment
Half year
Mar 13
Half year
Sep 12
Half year
Mar 12
Collective Provision $M $M $M
Balance at start of period 2,765 2,994 3,176
Charge to income statement 4 (227) (152)
Disposal - (4) -
Adjustments for exchange rate fluctuations - 2 (30)
Total Collective Provision 2,769 2,765 2,994
Individual Provision
Balance at start of period 1,773 1,714 1,697
New and increased provisions 932 1,270 1,023
Write-backs (240) (286) (251)
Adjustment for exchange rate fluctuations (3) (5) (29)
Discount unwind (55) (79) (64)
Bad debts written off (864) (841) (662)
Total Individual Provision 1,543 1,773 1,714
Total Provisions for Credit Impairment 4,312 4,538 4,708
Specific Provision Balance and General Reserve for Credit Losses 20
S
Mar 13
Specific Provision
Balance
$M
General Reserve for
Credit Losses
$M
Total
$M
Collective Provision 341 2,428 2,769
Individual Provision 1,543 - 1,543
Total Provision for Credit Impairment 4,312
Sep 12
Specific Provision
Balance
$M
General Reserve for
Credit Losses
$M
Total
$M
Collective Provision 334 2,431 2,765
Individual Provision 1,773 - 1,773
Total Provision for Credit Impairment 4,538
Mar 12
Specific Provision
Balance
$M
General Reserve for
Credit Losses
$M
Total
$M
Collective Provision 312 2,682 2,994
Individual Provision 1,714 - 1,714
Total Provision for Credit Impairment 4,708
20 Due to definitional differences, there is a variation in the split between ANZ’s Individual Provision and Collective
Provision for accounting purposes and the Specific Provision and General Reserve for Credit Losses (GRCL) for
regulatory purposes. This does not impact total provisions, and essentially relates to the classification of collectively
assessed provisions on defaulted accounts. The disclosures in this document are based on Individual Provision and
Collective Provision, for ease of comparison with other published results.
ANZ Basel III Pillar 3 disclosure March 2013
21
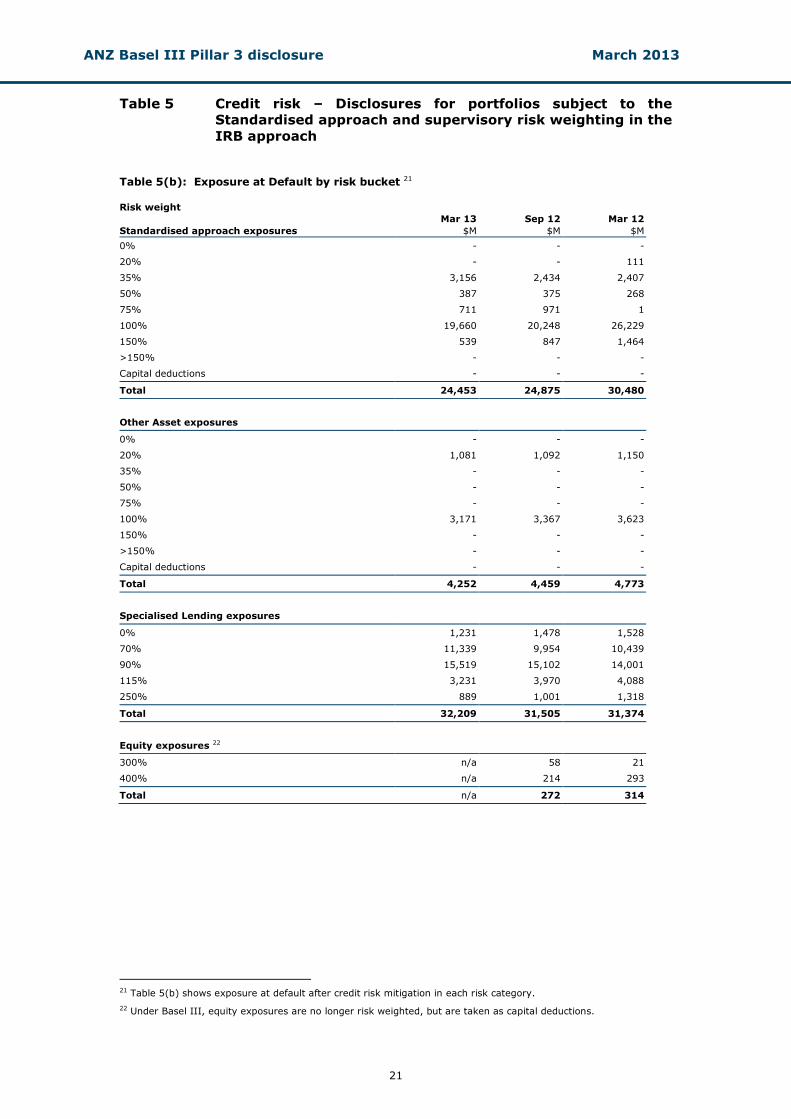
Table 5 Credit risk – Disclosures for portfolios subject to the Standardised approach and supervisory risk weighting in the
IRB approach
Table 5(b): Exposure at Default by risk bucket 21 Risk weight Mar 13 Sep 12 Mar 12
Standardised approach exposures $M $M $M
0% - - -
20% - - 111
35% 3,156 2,434 2,407
50% 387 375 268
75% 711 971 1
100% 19,660 20,248 26,229
150% 539 847 1,464
>150% - - -
Capital deductions - - -
Total 24,453 24,875 30,480
Other Asset exposures
0% - - -
20% 1,081 1,092 1,150
35% - - -
50% - - -
75% - - -
100% 3,171 3,367 3,623
150% - - -
>150% - - -
Capital deductions - - -
Total 4,252 4,459 4,773
Specialised Lending exposures
0% 1,231 1,478 1,528
70% 11,339 9,954 10,439
90% 15,519 15,102 14,001
115% 3,231 3,970 4,088
250% 889 1,001 1,318
Total 32,209 31,505 31,374
Equity exposures 22
300% n/a 58 21
400% n/a 214 293
Total n/a 272 314
21 Table 5(b) shows exposure at default after credit risk mitigation in each risk category.
22 Under Basel III, equity exposures are no longer risk weighted, but are taken as capital deductions.
ANZ Basel III Pillar 3 disclosure March 2013
22
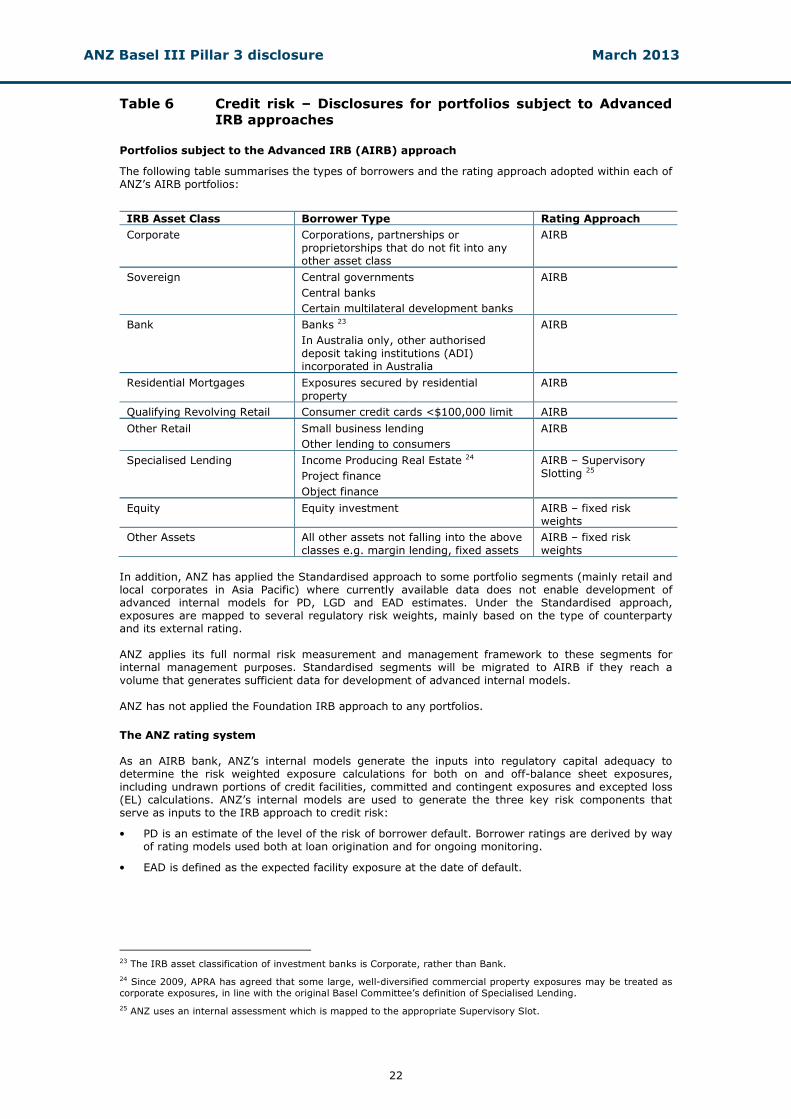
Table 6 Credit risk – Disclosures for portfolios subject to Advanced IRB approaches
Portfolios subject to the Advanced IRB (AIRB) approach
The following table summarises the types of borrowers and the rating approach adopted within each of ANZ’s AIRB portfolios:
IRB Asset Class Borrower Type Rating Approach
Corporate Corporations, partnerships or
proprietorships that do not fit into any other asset class
AIRB
Sovereign Central governments
Central banks
Certain multilateral development banks
AIRB
Bank Banks 23
In Australia only, other authorised
deposit taking institutions (ADI) incorporated in Australia
AIRB
Residential Mortgages Exposures secured by residential
property
AIRB
Qualifying Revolving Retail Consumer credit cards <$100,000 limit AIRB
Other Retail Small business lending
Other lending to consumers
AIRB
Specialised Lending Income Producing Real Estate 24
Project finance
Object finance
AIRB – Supervisory
Slotting 25
Equity Equity investment AIRB – fixed risk weights
Other Assets All other assets not falling into the above
classes e.g. margin lending, fixed assets
AIRB – fixed risk
weights
In addition, ANZ has applied the Standardised approach to some portfolio segments (mainly retail and local corporates in Asia Pacific) where currently available data does not enable development of advanced internal models for PD, LGD and EAD estimates. Under the Standardised approach, exposures are mapped to several regulatory risk weights, mainly based on the type of counterparty and its external rating. ANZ applies its full normal risk measurement and management framework to these segments for internal management purposes. Standardised segments will be migrated to AIRB if they reach a
volume that generates sufficient data for development of advanced internal models. ANZ has not applied the Foundation IRB approach to any portfolios.
The ANZ rating system As an AIRB bank, ANZ’s internal models generate the inputs into regulatory capital adequacy to determine the risk weighted exposure calculations for both on and off-balance sheet exposures, including undrawn portions of credit facilities, committed and contingent exposures and excepted loss (EL) calculations. ANZ’s internal models are used to generate the three key risk components that serve as inputs to the IRB approach to credit risk:
• PD is an estimate of the level of the risk of borrower default. Borrower ratings are derived by way of rating models used both at loan origination and for ongoing monitoring.
• EAD is defined as the expected facility exposure at the date of default.
23 The IRB asset classification of investment banks is Corporate, rather than Bank.
24 Since 2009, APRA has agreed that some large, well-diversified commercial property exposures may be treated as
corporate exposures, in line with the original Basel Committee’s definition of Specialised Lending.
25 ANZ uses an internal assessment which is mapped to the appropriate Supervisory Slot.
ANZ Basel III Pillar 3 disclosure March 2013
23
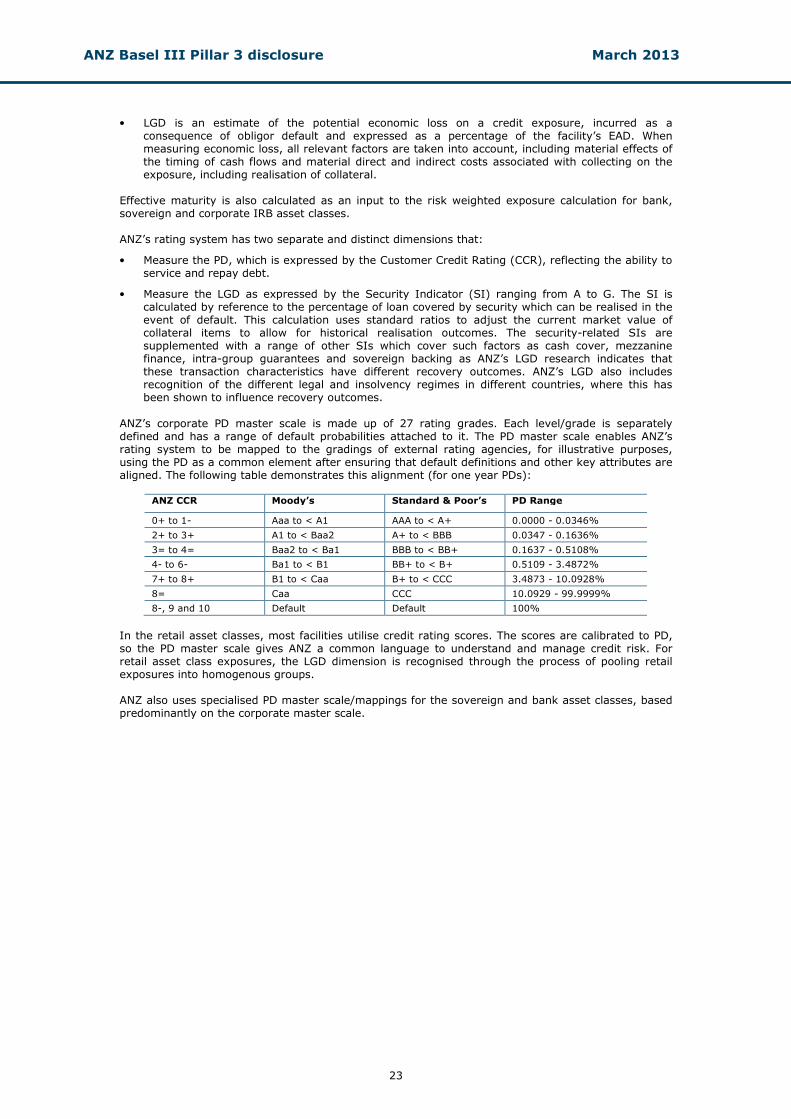
• LGD is an estimate of the potential economic loss on a credit exposure, incurred as a consequence of obligor default and expressed as a percentage of the facility’s EAD. When measuring economic loss, all relevant factors are taken into account, including material effects of the timing of cash flows and material direct and indirect costs associated with collecting on the exposure, including realisation of collateral.
Effective maturity is also calculated as an input to the risk weighted exposure calculation for bank, sovereign and corporate IRB asset classes. ANZ’s rating system has two separate and distinct dimensions that:
• Measure the PD, which is expressed by the Customer Credit Rating (CCR), reflecting the ability to service and repay debt.
• Measure the LGD as expressed by the Security Indicator (SI) ranging from A to G. The SI is calculated by reference to the percentage of loan covered by security which can be realised in the event of default. This calculation uses standard ratios to adjust the current market value of collateral items to allow for historical realisation outcomes. The security-related SIs are supplemented with a range of other SIs which cover such factors as cash cover, mezzanine finance, intra-group guarantees and sovereign backing as ANZ’s LGD research indicates that these transaction characteristics have different recovery outcomes. ANZ’s LGD also includes recognition of the different legal and insolvency regimes in different countries, where this has been shown to influence recovery outcomes.
ANZ’s corporate PD master scale is made up of 27 rating grades. Each level/grade is separately defined and has a range of default probabilities attached to it. The PD master scale enables ANZ’s rating system to be mapped to the gradings of external rating agencies, for illustrative purposes, using the PD as a common element after ensuring that default definitions and other key attributes are aligned. The following table demonstrates this alignment (for one year PDs):
ANZ CCR Moody’s Standard & Poor’s PD Range
0+ to 1- Aaa to < A1 AAA to < A+ 0.0000 - 0.0346%
2+ to 3+ A1 to < Baa2 A+ to < BBB 0.0347 - 0.1636%
3= to 4= Baa2 to < Ba1 BBB to < BB+ 0.1637 - 0.5108%
4- to 6- Ba1 to < B1 BB+ to < B+ 0.5109 - 3.4872%
7+ to 8+ B1 to < Caa B+ to < CCC 3.4873 - 10.0928%
8= Caa CCC 10.0929 - 99.9999%
8-, 9 and 10 Default Default 100%
In the retail asset classes, most facilities utilise credit rating scores. The scores are calibrated to PD, so the PD master scale gives ANZ a common language to understand and manage credit risk. For retail asset class exposures, the LGD dimension is recognised through the process of pooling retail exposures into homogenous groups. ANZ also uses specialised PD master scale/mappings for the sovereign and bank asset classes, based predominantly on the corporate master scale.
ANZ Basel III Pillar 3 disclosure March 2013
24
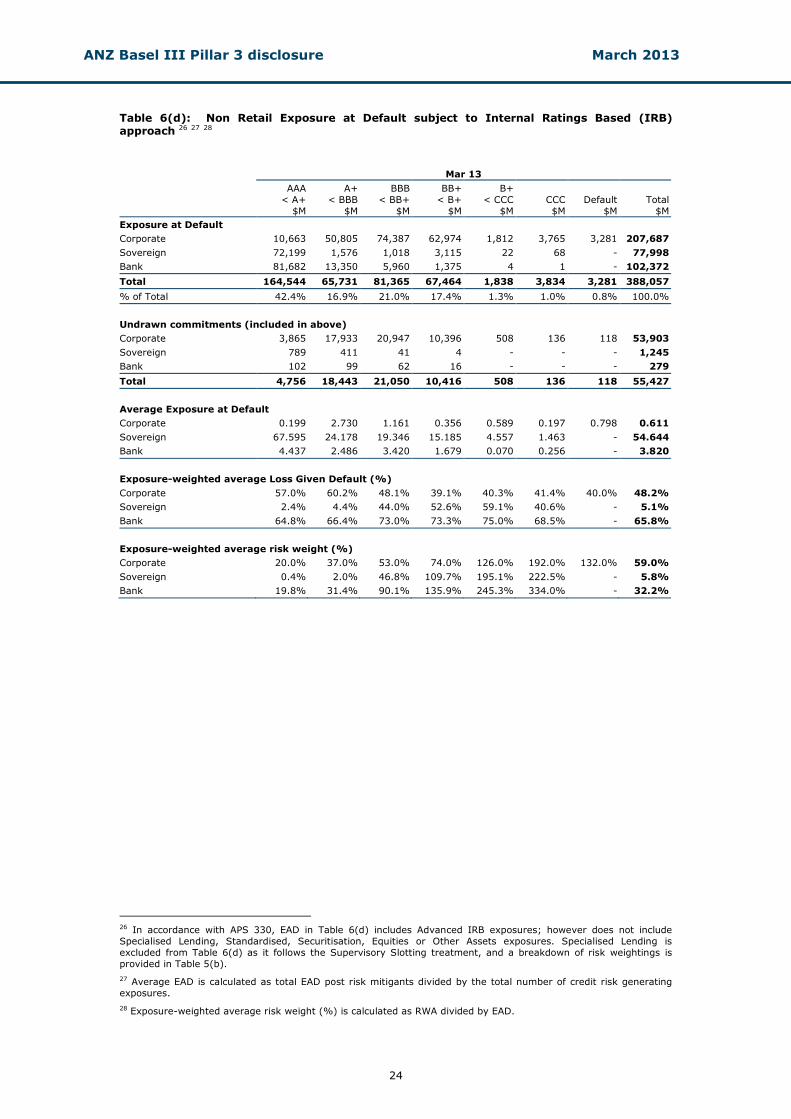
Table 6(d): Non Retail Exposure at Default subject to Internal Ratings Based (IRB) approach 26 27 28
Mar 13
AAA
< A+
$M
A+
< BBB
$M
BBB
< BB+
$M
BB+
< B+
$M
B+
< CCC
$M
CCC
$M
Default
$M
Total
$M
Exposure at Default
Corporate 10,663 50,805 74,387 62,974 1,812 3,765 3,281 207,687
Sovereign 72,199 1,576 1,018 3,115 22 68 - 77,998
Bank 81,682 13,350 5,960 1,375 4 1 - 102,372
Total 164,544 65,731 81,365 67,464 1,838 3,834 3,281 388,057
% of Total 42.4% 16.9% 21.0% 17.4% 1.3% 1.0% 0.8% 100.0%
Undrawn commitments (included in above)
Corporate 3,865 17,933 20,947 10,396 508 136 118 53,903
Sovereign 789 411 41 4 - - - 1,245
Bank 102 99 62 16 - - - 279
Total 4,756 18,443 21,050 10,416 508 136 118 55,427
Average Exposure at Default
Corporate 0.199 2.730 1.161 0.356 0.589 0.197 0.798 0.611
Sovereign 67.595 24.178 19.346 15.185 4.557 1.463 - 54.644
Bank 4.437 2.486 3.420 1.679 0.070 0.256 - 3.820
Exposure-weighted average Loss Given Default (%)
Corporate 57.0% 60.2% 48.1% 39.1% 40.3% 41.4% 40.0% 48.2%
Sovereign 2.4% 4.4% 44.0% 52.6% 59.1% 40.6% - 5.1%
Bank 64.8% 66.4% 73.0% 73.3% 75.0% 68.5% - 65.8%
Exposure-weighted average risk weight (%)
Corporate 20.0% 37.0% 53.0% 74.0% 126.0% 192.0% 132.0% 59.0%
Sovereign 0.4% 2.0% 46.8% 109.7% 195.1% 222.5% - 5.8%
Bank 19.8% 31.4% 90.1% 135.9% 245.3% 334.0% - 32.2%
26 In accordance with APS 330, EAD in Table 6(d) includes Advanced IRB exposures; however does not include
Specialised Lending, Standardised, Securitisation, Equities or Other Assets exposures. Specialised Lending is
excluded from Table 6(d) as it follows the Supervisory Slotting treatment, and a breakdown of risk weightings is
provided in Table 5(b).
27 Average EAD is calculated as total EAD post risk mitigants divided by the total number of credit risk generating
exposures.
28 Exposure-weighted average risk weight (%) is calculated as RWA divided by EAD.
ANZ Basel III Pillar 3 disclosure March 2013
25
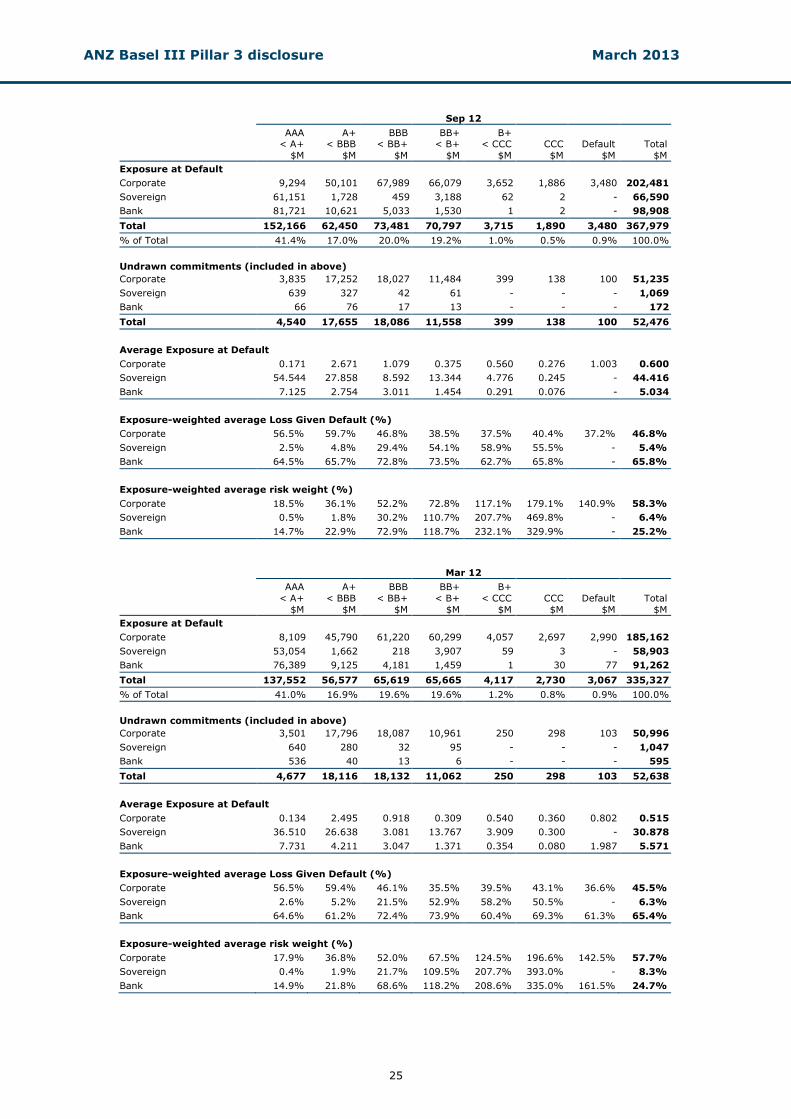
Sep 12
AAA < A+
$M
A+ < BBB
$M
BBB < BB+
$M
BB+ < B+
$M
B+ < CCC
$M
CCC
$M
Default
$M
Total
$M
Exposure at Default
Corporate 9,294 50,101 67,989 66,079 3,652 1,886 3,480 202,481
Sovereign 61,151 1,728 459 3,188 62 2 - 66,590
Bank 81,721 10,621 5,033 1,530 1 2 - 98,908
Total 152,166 62,450 73,481 70,797 3,715 1,890 3,480 367,979
% of Total 41.4% 17.0% 20.0% 19.2% 1.0% 0.5% 0.9% 100.0%
Undrawn commitments (included in above)
Corporate 3,835 17,252 18,027 11,484 399 138 100 51,235
Sovereign 639 327 42 61 - - - 1,069
Bank 66 76 17 13 - - - 172
Total 4,540 17,655 18,086 11,558 399 138 100 52,476
Average Exposure at Default
Corporate 0.171 2.671 1.079 0.375 0.560 0.276 1.003 0.600
Sovereign 54.544 27.858 8.592 13.344 4.776 0.245 - 44.416
Bank 7.125 2.754 3.011 1.454 0.291 0.076 - 5.034
Exposure-weighted average Loss Given Default (%)
Corporate 56.5% 59.7% 46.8% 38.5% 37.5% 40.4% 37.2% 46.8%
Sovereign 2.5% 4.8% 29.4% 54.1% 58.9% 55.5% - 5.4%
Bank 64.5% 65.7% 72.8% 73.5% 62.7% 65.8% - 65.8%
Exposure-weighted average risk weight (%)
Corporate 18.5% 36.1% 52.2% 72.8% 117.1% 179.1% 140.9% 58.3%
Sovereign 0.5% 1.8% 30.2% 110.7% 207.7% 469.8% - 6.4%
Bank 14.7% 22.9% 72.9% 118.7% 232.1% 329.9% - 25.2%
Mar 12
AAA
< A+
$M
A+
< BBB
$M
BBB
< BB+
$M
BB+
< B+
$M
B+
< CCC
$M
CCC
$M
Default
$M
Total
$M
Exposure at Default
Corporate 8,109 45,790 61,220 60,299 4,057 2,697 2,990 185,162
Sovereign 53,054 1,662 218 3,907 59 3 - 58,903
Bank 76,389 9,125 4,181 1,459 1 30 77 91,262
Total 137,552 56,577 65,619 65,665 4,117 2,730 3,067 335,327
% of Total 41.0% 16.9% 19.6% 19.6% 1.2% 0.8% 0.9% 100.0%
Undrawn commitments (included in above)
Corporate 3,501 17,796 18,087 10,961 250 298 103 50,996
Sovereign 640 280 32 95 - - - 1,047
Bank 536 40 13 6 - - - 595
Total 4,677 18,116 18,132 11,062 250 298 103 52,638
Average Exposure at Default
Corporate 0.134 2.495 0.918 0.309 0.540 0.360 0.802 0.515
Sovereign 36.510 26.638 3.081 13.767 3.909 0.300 - 30.878
Bank 7.731 4.211 3.047 1.371 0.354 0.080 1.987 5.571
Exposure-weighted average Loss Given Default (%)
Corporate 56.5% 59.4% 46.1% 35.5% 39.5% 43.1% 36.6% 45.5%
Sovereign 2.6% 5.2% 21.5% 52.9% 58.2% 50.5% - 6.3%
Bank 64.6% 61.2% 72.4% 73.9% 60.4% 69.3% 61.3% 65.4%
Exposure-weighted average risk weight (%)
Corporate 17.9% 36.8% 52.0% 67.5% 124.5% 196.6% 142.5% 57.7%
Sovereign 0.4% 1.9% 21.7% 109.5% 207.7% 393.0% - 8.3%
Bank 14.9% 21.8% 68.6% 118.2% 208.6% 335.0% 161.5% 24.7%
ANZ Basel III Pillar 3 disclosure March 2013
26
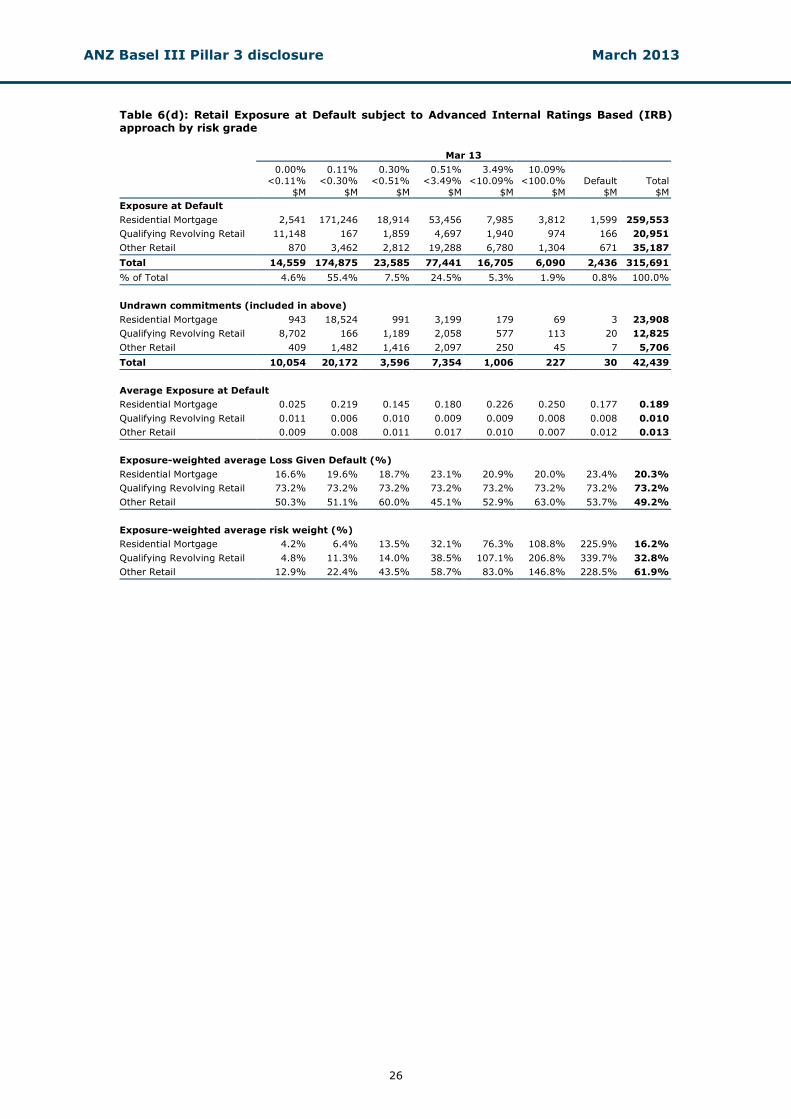
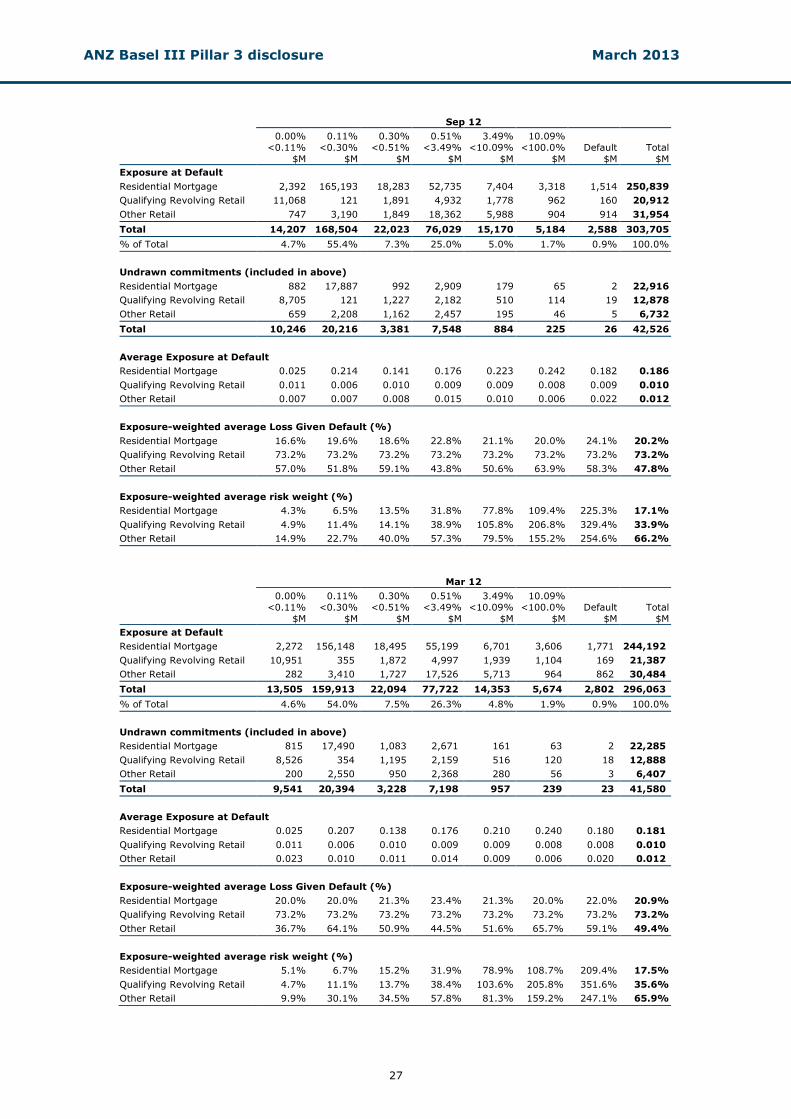
Table 6(d): Retail Exposure at Default subject to Advanced Internal Ratings Based (IRB) approach by risk grade
Mar 13
0.00%
<0.11%
$M
0.11%
<0.30%
$M
0.30%
<0.51%
$M
0.51%
<3.49%
$M
3.49%
<10.09%
$M
10.09%
<100.0%
$M
Default
$M
Total
$M
Exposure at Default
Residential Mortgage 2,541 171,246 18,914 53,456 7,985 3,812 1,599 259,553
Qualifying Revolving Retail 11,148 167 1,859 4,697 1,940 974 166 20,951
Other Retail 870 3,462 2,812 19,288 6,780 1,304 671 35,187
Total 14,559 174,875 23,585 77,441 16,705 6,090 2,436 315,691
% of Total 4.6% 55.4% 7.5% 24.5% 5.3% 1.9% 0.8% 100.0%
Undrawn commitments (included in above)
Residential Mortgage 943 18,524 991 3,199 179 69 3 23,908
Qualifying Revolving Retail 8,702 166 1,189 2,058 577 113 20 12,825
Other Retail 409 1,482 1,416 2,097 250 45 7 5,706
Total 10,054 20,172 3,596 7,354 1,006 227 30 42,439
Average Exposure at Default
Residential Mortgage 0.025 0.219 0.145 0.180 0.226 0.250 0.177 0.189
Qualifying Revolving Retail 0.011 0.006 0.010 0.009 0.009 0.008 0.008 0.010
Other Retail 0.009 0.008 0.011 0.017 0.010 0.007 0.012 0.013
Exposure-weighted average Loss Given Default (%)
Residential Mortgage 16.6% 19.6% 18.7% 23.1% 20.9% 20.0% 23.4% 20.3%
Qualifying Revolving Retail 73.2% 73.2% 73.2% 73.2% 73.2% 73.2% 73.2% 73.2%
Other Retail 50.3% 51.1% 60.0% 45.1% 52.9% 63.0% 53.7% 49.2%
Exposure-weighted average risk weight (%)
Residential Mortgage 4.2% 6.4% 13.5% 32.1% 76.3% 108.8% 225.9% 16.2%
Qualifying Revolving Retail 4.8% 11.3% 14.0% 38.5% 107.1% 206.8% 339.7% 32.8%
Other Retail 12.9% 22.4% 43.5% 58.7% 83.0% 146.8% 228.5% 61.9%
ANZ Basel III Pillar 3 disclosure March 2013
27
Sep 12
0.00%
<0.11%
$M
0.11%
<0.30%
$M
0.30%
<0.51%
$M
0.51%
<3.49%
$M
3.49%
<10.09%
$M
10.09%
<100.0%
$M
Default
$M
Total
$M
Exposure at Default
Residential Mortgage 2,392 165,193 18,283 52,735 7,404 3,318 1,514 250,839
Qualifying Revolving Retail 11,068 121 1,891 4,932 1,778 962 160 20,912
Other Retail 747 3,190 1,849 18,362 5,988 904 914 31,954
Total 14,207 168,504 22,023 76,029 15,170 5,184 2,588 303,705
% of Total 4.7% 55.4% 7.3% 25.0% 5.0% 1.7% 0.9% 100.0%
Undrawn commitments (included in above)
Residential Mortgage 882 17,887 992 2,909 179 65 2 22,916
Qualifying Revolving Retail 8,705 121 1,227 2,182 510 114 19 12,878
Other Retail 659 2,208 1,162 2,457 195 46 5 6,732
Total 10,246 20,216 3,381 7,548 884 225 26 42,526
Average Exposure at Default
Residential Mortgage 0.025 0.214 0.141 0.176 0.223 0.242 0.182 0.186
Qualifying Revolving Retail 0.011 0.006 0.010 0.009 0.009 0.008 0.009 0.010
Other Retail 0.007 0.007 0.008 0.015 0.010 0.006 0.022 0.012
Exposure-weighted average Loss Given Default (%)
Residential Mortgage 16.6% 19.6% 18.6% 22.8% 21.1% 20.0% 24.1% 20.2%
Qualifying Revolving Retail 73.2% 73.2% 73.2% 73.2% 73.2% 73.2% 73.2% 73.2%
Other Retail 57.0% 51.8% 59.1% 43.8% 50.6% 63.9% 58.3% 47.8%
Exposure-weighted average risk weight (%)
Residential Mortgage 4.3% 6.5% 13.5% 31.8% 77.8% 109.4% 225.3% 17.1%
Qualifying Revolving Retail 4.9% 11.4% 14.1% 38.9% 105.8% 206.8% 329.4% 33.9%
Other Retail 14.9% 22.7% 40.0% 57.3% 79.5% 155.2% 254.6% 66.2%
Mar 12
0.00%
<0.11%
$M
0.11%
<0.30%
$M
0.30%
<0.51%
$M
0.51%
<3.49%
$M
3.49%
<10.09%
$M
10.09%
<100.0%
$M
Default
$M
Total
$M
Exposure at Default
Residential Mortgage 2,272 156,148 18,495 55,199 6,701 3,606 1,771 244,192
Qualifying Revolving Retail 10,951 355 1,872 4,997 1,939 1,104 169 21,387
Other Retail 282 3,410 1,727 17,526 5,713 964 862 30,484
Total 13,505 159,913 22,094 77,722 14,353 5,674 2,802 296,063
% of Total 4.6% 54.0% 7.5% 26.3% 4.8% 1.9% 0.9% 100.0%
Undrawn commitments (included in above)
Residential Mortgage 815 17,490 1,083 2,671 161 63 2 22,285
Qualifying Revolving Retail 8,526 354 1,195 2,159 516 120 18 12,888
Other Retail 200 2,550 950 2,368 280 56 3 6,407
Total 9,541 20,394 3,228 7,198 957 239 23 41,580
Average Exposure at Default
Residential Mortgage 0.025 0.207 0.138 0.176 0.210 0.240 0.180 0.181
Qualifying Revolving Retail 0.011 0.006 0.010 0.009 0.009 0.008 0.008 0.010
Other Retail 0.023 0.010 0.011 0.014 0.009 0.006 0.020 0.012
Exposure-weighted average Loss Given Default (%)
Residential Mortgage 20.0% 20.0% 21.3% 23.4% 21.3% 20.0% 22.0% 20.9%
Qualifying Revolving Retail 73.2% 73.2% 73.2% 73.2% 73.2% 73.2% 73.2% 73.2%
Other Retail 36.7% 64.1% 50.9% 44.5% 51.6% 65.7% 59.1% 49.4%
Exposure-weighted average risk weight (%)
Residential Mortgage 5.1% 6.7% 15.2% 31.9% 78.9% 108.7% 209.4% 17.5%
Qualifying Revolving Retail 4.7% 11.1% 13.7% 38.4% 103.6% 205.8% 351.6% 35.6%
Other Retail 9.9% 30.1% 34.5% 57.8% 81.3% 159.2% 247.1% 65.9%
ANZ Basel III Pillar 3 disclosure March 2013
28
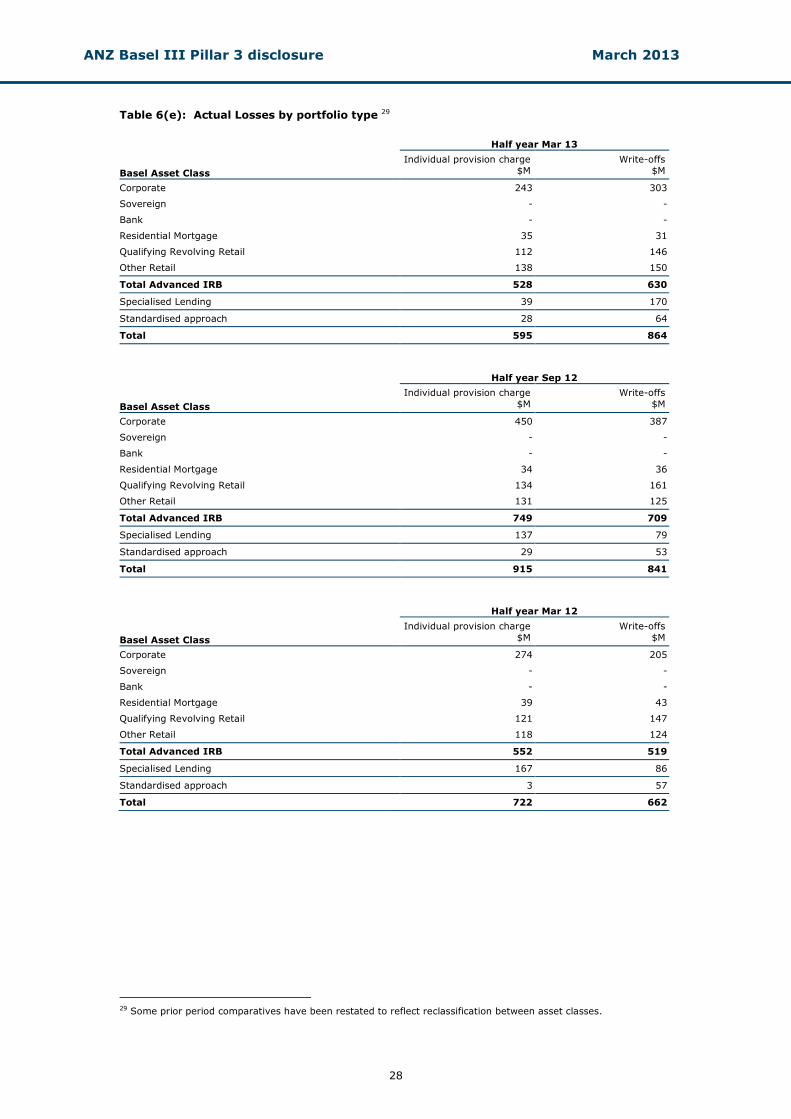
Table 6(e): Actual Losses by portfolio type 29 Half year Mar 13
Basel Asset Class
Individual provision charge
$M
Write-offs
$M
Corporate 243 303
Sovereign - -
Bank - -
Residential Mortgage 35 31
Qualifying Revolving Retail 112 146
Other Retail 138 150
Total Advanced IRB 528 630
Specialised Lending 39 170
Standardised approach 28 64
Total 595 864
Half year Sep 12
Basel Asset Class
Individual provision charge
$M
Write-offs
$M
Corporate 450 387
Sovereign - -
Bank - -
Residential Mortgage 34 36
Qualifying Revolving Retail 134 161
Other Retail 131 125
Total Advanced IRB 749 709
Specialised Lending 137 79
Standardised approach 29 53
Total 915 841
Half year Mar 12
Basel Asset Class
Individual provision charge
$M
Write-offs
$M
Corporate 274 205
Sovereign - -
Bank - -
Residential Mortgage 39 43
Qualifying Revolving Retail 121 147
Other Retail 118 124
Total Advanced IRB 552 519
Specialised Lending 167 86
Standardised approach 3 57
Total 722 662
29 Some prior period comparatives have been restated to reflect reclassification between asset classes.
ANZ Basel III Pillar 3 disclosure March 2013
29
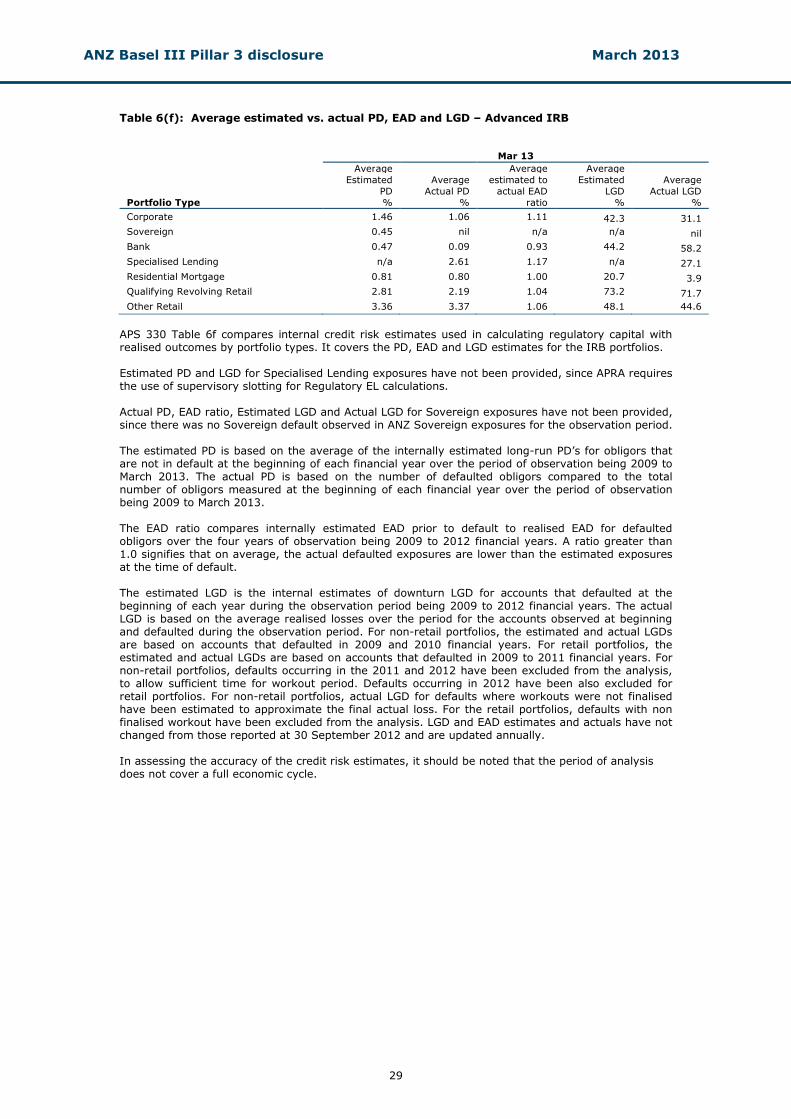
Table 6(f): Average estimated vs. actual PD, EAD and LGD – Advanced IRB Mar 13
Portfolio Type
Average
Estimated
PD
%
Average
Actual PD
%
Average
estimated to
actual EAD
ratio
Average
Estimated
LGD
%
Average
Actual LGD
%
Corporate 1.46 1.06 1.11 42.3 31.1
Sovereign 0.45 nil n/a n/a nil
Bank 0.47 0.09 0.93 44.2 58.2
Specialised Lending n/a 2.61 1.17 n/a 27.1
Residential Mortgage 0.81 0.80 1.00 20.7 3.9
Qualifying Revolving Retail 2.81 2.19 1.04 73.2 71.7
Other Retail 3.36 3.37 1.06 48.1 44.6
APS 330 Table 6f compares internal credit risk estimates used in calculating regulatory capital with realised outcomes by portfolio types. It covers the PD, EAD and LGD estimates for the IRB portfolios. Estimated PD and LGD for Specialised Lending exposures have not been provided, since APRA requires the use of supervisory slotting for Regulatory EL calculations. Actual PD, EAD ratio, Estimated LGD and Actual LGD for Sovereign exposures have not been provided, since there was no Sovereign default observed in ANZ Sovereign exposures for the observation period. The estimated PD is based on the average of the internally estimated long-run PD’s for obligors that are not in default at the beginning of each financial year over the period of observation being 2009 to March 2013. The actual PD is based on the number of defaulted obligors compared to the total number of obligors measured at the beginning of each financial year over the period of observation being 2009 to March 2013. The EAD ratio compares internally estimated EAD prior to default to realised EAD for defaulted obligors over the four years of observation being 2009 to 2012 financial years. A ratio greater than 1.0 signifies that on average, the actual defaulted exposures are lower than the estimated exposures at the time of default. The estimated LGD is the internal estimates of downturn LGD for accounts that defaulted at the beginning of each year during the observation period being 2009 to 2012 financial years. The actual LGD is based on the average realised losses over the period for the accounts observed at beginning and defaulted during the observation period. For non-retail portfolios, the estimated and actual LGDs are based on accounts that defaulted in 2009 and 2010 financial years. For retail portfolios, the estimated and actual LGDs are based on accounts that defaulted in 2009 to 2011 financial years. For non-retail portfolios, defaults occurring in the 2011 and 2012 have been excluded from the analysis, to allow sufficient time for workout period. Defaults occurring in 2012 have been also excluded for retail portfolios. For non-retail portfolios, actual LGD for defaults where workouts were not finalised have been estimated to approximate the final actual loss. For the retail portfolios, defaults with non finalised workout have been excluded from the analysis. LGD and EAD estimates and actuals have not changed from those reported at 30 September 2012 and are updated annually. In assessing the accuracy of the credit risk estimates, it should be noted that the period of analysis does not cover a full economic cycle.
ANZ Basel III Pillar 3 disclosure March 2013
30
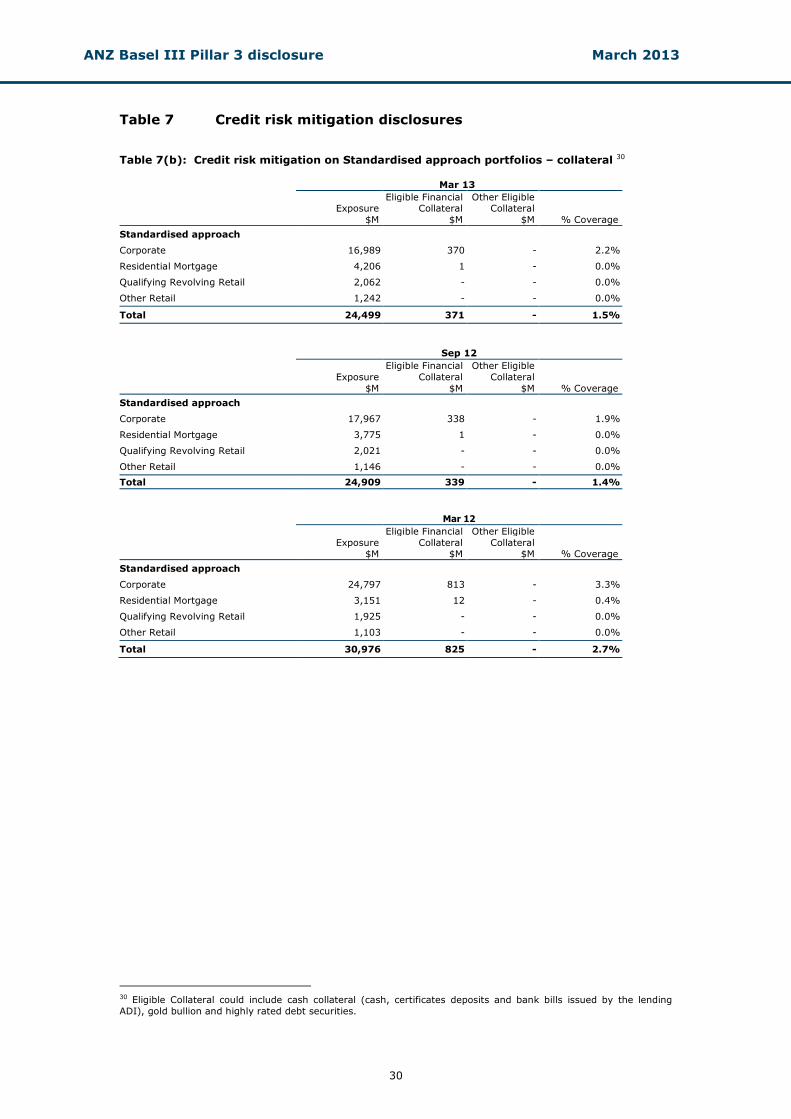
Table 7 Credit risk mitigation disclosures Table 7(b): Credit risk mitigation on Standardised approach portfolios – collateral 30 Mar 13
Exposure
$M
Eligible Financial Collateral
$M
Other Eligible Collateral
$M % Coverage
Standardised approach
Corporate 16,989 370 - 2.2%
Residential Mortgage 4,206 1 - 0.0%
Qualifying Revolving Retail 2,062 - - 0.0%
Other Retail 1,242 - - 0.0%
Total 24,499 371 - 1.5%
Sep 12
Exposure
$M
Eligible Financial
Collateral
$M
Other Eligible
Collateral
$M % Coverage
Standardised approach
Corporate 17,967 338 - 1.9%
Residential Mortgage 3,775 1 - 0.0%
Qualifying Revolving Retail 2,021 - - 0.0%
Other Retail 1,146 - - 0.0%
Total 24,909 339 - 1.4%
Mar 12
Exposure $M
Eligible Financial
Collateral $M
Other Eligible
Collateral $M % Coverage
Standardised approach
Corporate 24,797 813 - 3.3%
Residential Mortgage 3,151 12 - 0.4%
Qualifying Revolving Retail 1,925 - - 0.0%
Other Retail 1,103 - - 0.0%
Total 30,976 825 - 2.7%
30 Eligible Collateral could include cash collateral (cash, certificates deposits and bank bills issued by the lending
ADI), gold bullion and highly rated debt securities.
ANZ Basel III Pillar 3 disclosure March 2013
31
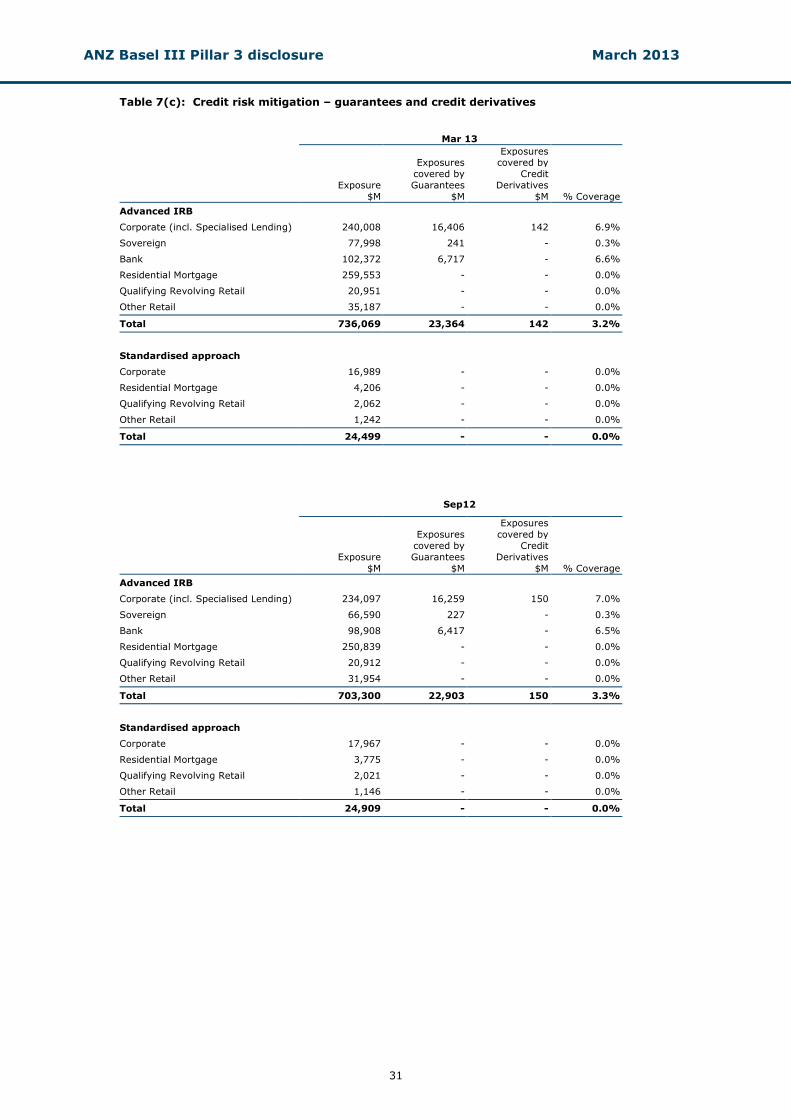
Table 7(c): Credit risk mitigation – guarantees and credit derivatives
Mar 13
Exposure
$M
Exposures
covered by
Guarantees
$M
Exposures covered by
Credit
Derivatives
$M % Coverage
Advanced IRB
Corporate (incl. Specialised Lending) 240,008 16,406 142 6.9%
Sovereign 77,998 241 - 0.3%
Bank 102,372 6,717 - 6.6%
Residential Mortgage 259,553 - - 0.0%
Qualifying Revolving Retail 20,951 - - 0.0%
Other Retail 35,187 - - 0.0%
Total 736,069 23,364 142 3.2%
Standardised approach
Corporate 16,989 - - 0.0%
Residential Mortgage 4,206 - - 0.0%
Qualifying Revolving Retail 2,062 - - 0.0%
Other Retail 1,242 - - 0.0%
Total 24,499 - - 0.0%
Sep12
Exposure
$M
Exposures
covered by
Guarantees
$M
Exposures
covered by
Credit
Derivatives
$M % Coverage
Advanced IRB
Corporate (incl. Specialised Lending) 234,097 16,259 150 7.0%
Sovereign 66,590 227 - 0.3%
Bank 98,908 6,417 - 6.5%
Residential Mortgage 250,839 - - 0.0%
Qualifying Revolving Retail 20,912 - - 0.0%
Other Retail 31,954 - - 0.0%
Total 703,300 22,903 150 3.3%
Standardised approach
Corporate 17,967 - - 0.0%
Residential Mortgage 3,775 - - 0.0%
Qualifying Revolving Retail 2,021 - - 0.0%
Other Retail 1,146 - - 0.0%
Total 24,909 - - 0.0%
ANZ Basel III Pillar 3 disclosure March 2013
32
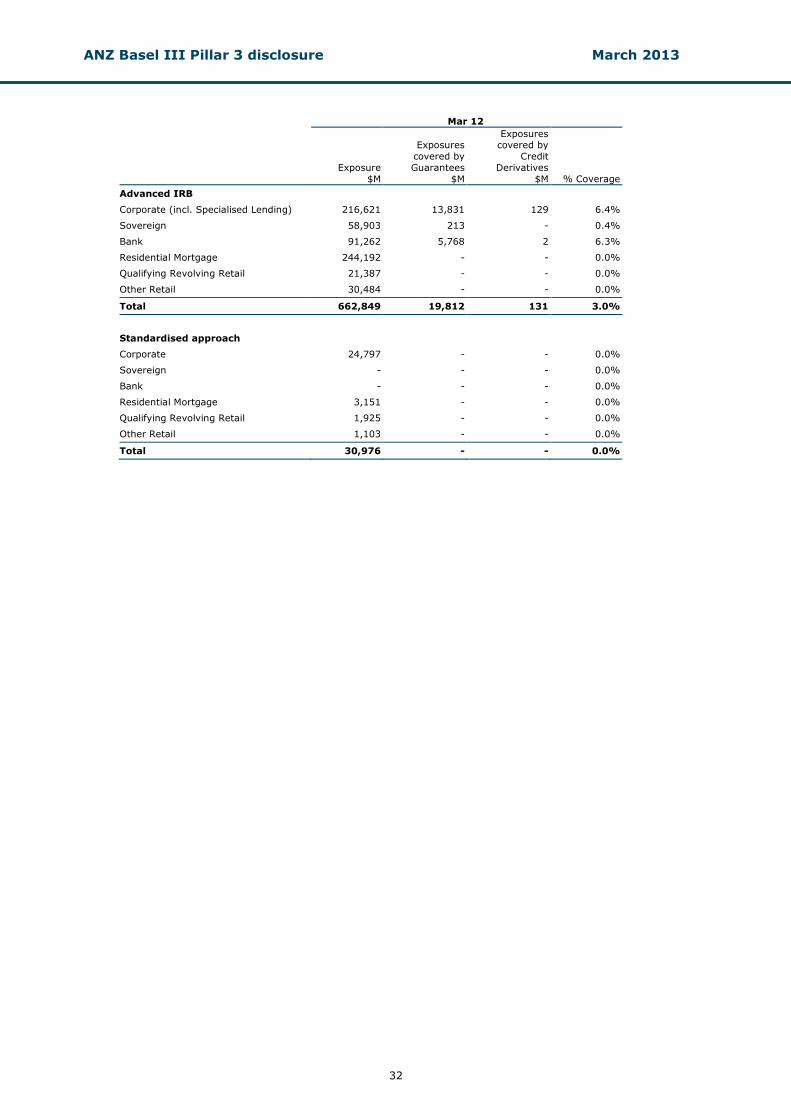
Mar 12
Exposure
$M
Exposures
covered by
Guarantees
$M
Exposures covered by
Credit
Derivatives
$M % Coverage
Advanced IRB
Corporate (incl. Specialised Lending) 216,621 13,831 129 6.4%
Sovereign 58,903 213 - 0.4%
Bank 91,262 5,768 2 6.3%
Residential Mortgage 244,192 - - 0.0%
Qualifying Revolving Retail 21,387 - - 0.0%
Other Retail 30,484 - - 0.0%
Total 662,849 19,812 131 3.0%
Standardised approach
Corporate 24,797 - - 0.0%
Sovereign - - - 0.0%
Bank - - - 0.0%
Residential Mortgage 3,151 - - 0.0%
Qualifying Revolving Retail 1,925 - - 0.0%
Other Retail 1,103 - - 0.0%
Total 30,976 - - 0.0%
ANZ Basel III Pillar 3 disclosure March 2013
33
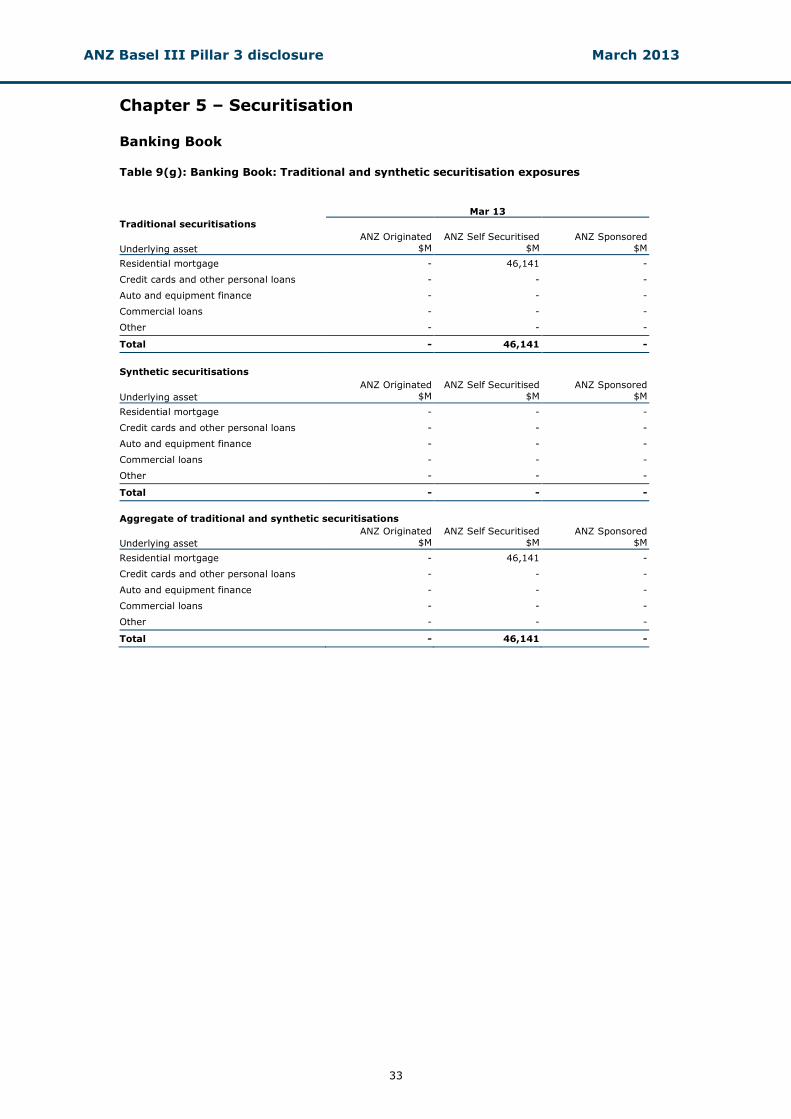
Chapter 5 – Securitisation
Banking Book Table 9(g): Banking Book: Traditional and synthetic securitisation exposures Mar 13
Traditional securitisations
Underlying asset
ANZ Originated
$M
ANZ Self Securitised
$M
ANZ Sponsored
$M
Residential mortgage - 46,141 -
Credit cards and other personal loans - - -
Auto and equipment finance - - -
Commercial loans - - -
Other - - -
Total - 46,141 -
Synthetic securitisations
Underlying asset
ANZ Originated
$M
ANZ Self Securitised
$M
ANZ Sponsored
$M
Residential mortgage - - -
Credit cards and other personal loans - - -
Auto and equipment finance - - -
Commercial loans - - -
Other - - -
Total - - -
Aggregate of traditional and synthetic securitisations
Underlying asset
ANZ Originated
$M
ANZ Self Securitised
$M
ANZ Sponsored
$M
Residential mortgage - 46,141 -
Credit cards and other personal loans - - -
Auto and equipment finance - - -
Commercial loans - - -
Other - - -
Total - 46,141 -
ANZ Basel III Pillar 3 disclosure March 2013
34
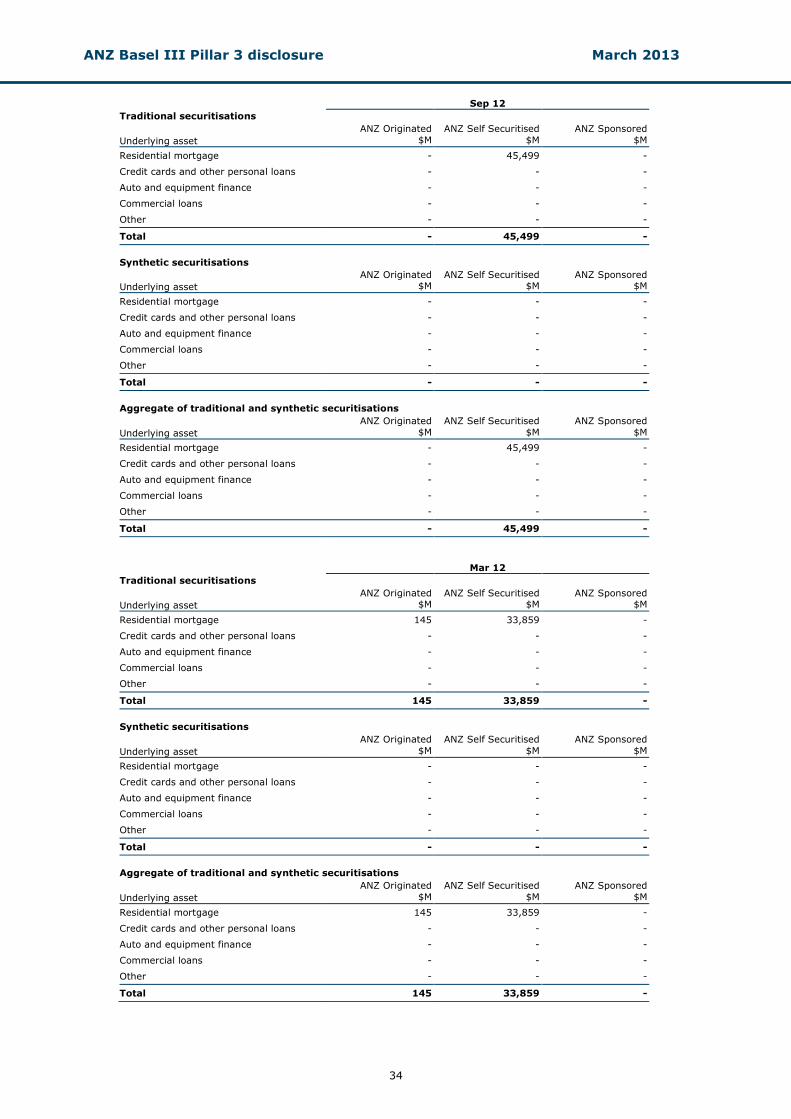
Sep 12
Traditional securitisations
Underlying asset
ANZ Originated
$M
ANZ Self Securitised
$M
ANZ Sponsored
$M
Residential mortgage - 45,499 -
Credit cards and other personal loans - - -
Auto and equipment finance - - -
Commercial loans - - -
Other - - -
Total - 45,499 -
Synthetic securitisations
Underlying asset
ANZ Originated $M
ANZ Self Securitised $M
ANZ Sponsored $M
Residential mortgage - - -
Credit cards and other personal loans - - -
Auto and equipment finance - - -
Commercial loans - - -
Other - - -
Total - - -
Aggregate of traditional and synthetic securitisations
Underlying asset
ANZ Originated
$M
ANZ Self Securitised
$M
ANZ Sponsored
$M
Residential mortgage - 45,499 -
Credit cards and other personal loans - - -
Auto and equipment finance - - -
Commercial loans - - -
Other - - -
Total - 45,499 -
Mar 12
Traditional securitisations
Underlying asset
ANZ Originated $M
ANZ Self Securitised $M
ANZ Sponsored $M
Residential mortgage 145 33,859 -
Credit cards and other personal loans - - -
Auto and equipment finance - - -
Commercial loans - - -
Other - - -
Total 145 33,859 -
Synthetic securitisations
Underlying asset
ANZ Originated
$M
ANZ Self Securitised
$M
ANZ Sponsored
$M
Residential mortgage - - -
Credit cards and other personal loans - - -
Auto and equipment finance - - -
Commercial loans - - -
Other - - -
Total - - -
Aggregate of traditional and synthetic securitisations
Underlying asset
ANZ Originated
$M
ANZ Self Securitised
$M
ANZ Sponsored
$M
Residential mortgage 145 33,859 -
Credit cards and other personal loans - - -
Auto and equipment finance - - -
Commercial loans - - -
Other - - -
Total 145 33,859 -
ANZ Basel III Pillar 3 disclosure March 2013
35
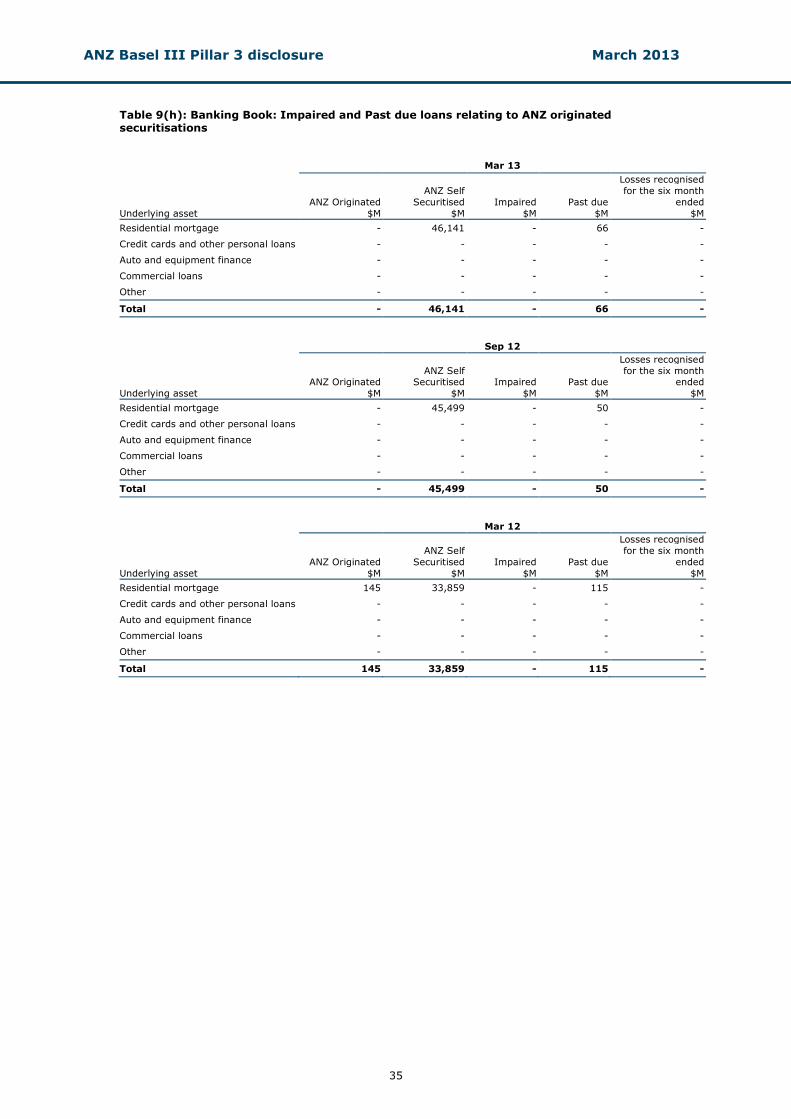
Table 9(h): Banking Book: Impaired and Past due loans relating to ANZ originated securitisations Mar 13
Underlying asset
ANZ Originated
$M
ANZ Self
Securitised
$M
Impaired
$M
Past due
$M
Losses recognised
for the six month
ended
$M
Residential mortgage - 46,141 - 66 -
Credit cards and other personal loans - - - - -
Auto and equipment finance - - - - -
Commercial loans - - - - -
Other - - - - -
Total - 46,141 - 66 -
Sep 12
Underlying asset
ANZ Originated
$M
ANZ Self Securitised
$M
Impaired
$M
Past due
$M
Losses recognised
for the six month ended
$M
Residential mortgage - 45,499 - 50 -
Credit cards and other personal loans - - - - -
Auto and equipment finance - - - - -
Commercial loans - - - - -
Other - - - - -
Total - 45,499 - 50 -
Mar 12
Underlying asset
ANZ Originated
$M
ANZ Self
Securitised
$M
Impaired
$M
Past due
$M
Losses recognised
for the six month
ended
$M
Residential mortgage 145 33,859 - 115 -
Credit cards and other personal loans - - - - -
Auto and equipment finance - - - - -
Commercial loans - - - - -
Other - - - - -
Total 145 33,859 - 115 -
ANZ Basel III Pillar 3 disclosure March 2013
36
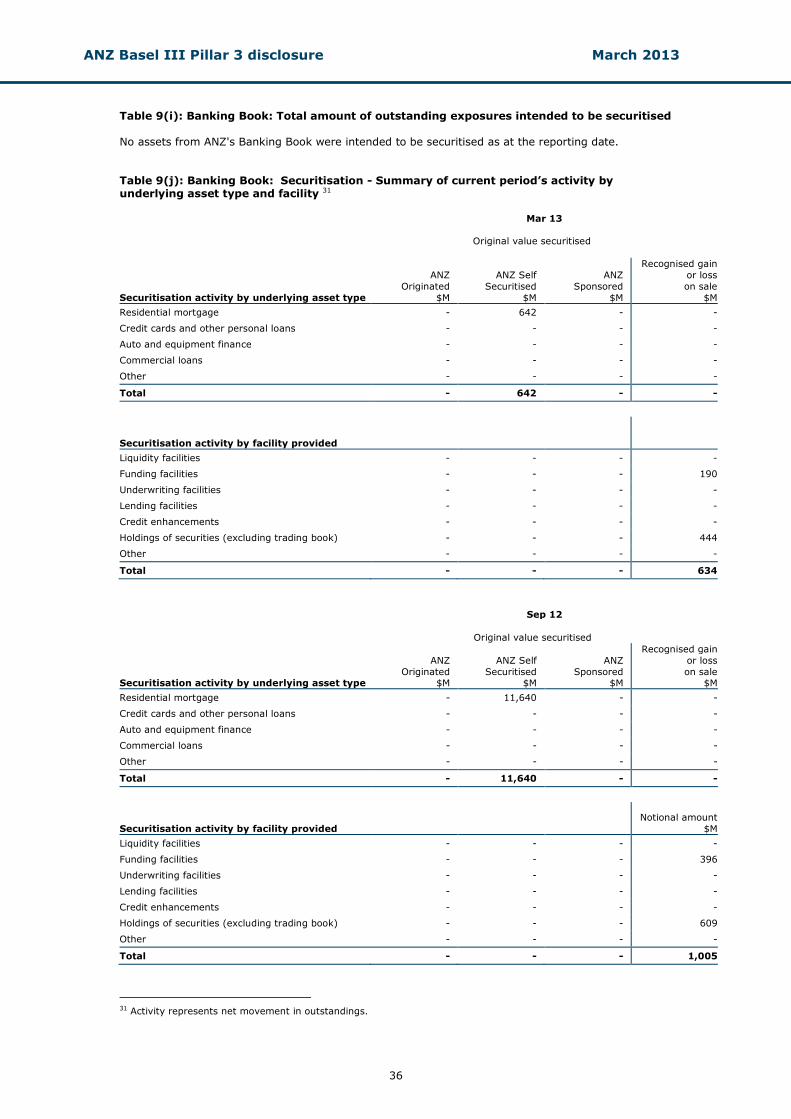
Table 9(i): Banking Book: Total amount of outstanding exposures intended to be securitised No assets from ANZ's Banking Book were intended to be securitised as at the reporting date. Table 9(j): Banking Book: Securitisation - Summary of current period’s activity by underlying asset type and facility 31
Mar 13
Original value securitised
Securitisation activity by underlying asset type
ANZ
Originated
$M
ANZ Self
Securitised
$M
ANZ
Sponsored
$M
Recognised gain
or loss
on sale
$M
Residential mortgage - 642 - -
Credit cards and other personal loans - - - -
Auto and equipment finance - - - -
Commercial loans - - - -
Other - - - -
Total - 642 - -
Securitisation activity by facility provided
Liquidity facilities - - - -
Funding facilities - - - 190
Underwriting facilities - - - -
Lending facilities - - - -
Credit enhancements - - - -
Holdings of securities (excluding trading book) - - - 444
Other - - - -
Total - - - 634
Sep 12
Original value securitised
Securitisation activity by underlying asset type
ANZ
Originated $M
ANZ Self
Securitised $M
ANZ
Sponsored $M
Recognised gain
or loss
on sale $M
Residential mortgage - 11,640 - -
Credit cards and other personal loans - - - -
Auto and equipment finance - - - -
Commercial loans - - - -
Other - - - -
Total - 11,640 - -
Securitisation activity by facility provided Notional amount
$M
Liquidity facilities - - - -
Funding facilities - - - 396
Underwriting facilities - - - -
Lending facilities - - - -
Credit enhancements - - - -
Holdings of securities (excluding trading book) - - - 609
Other - - - -
Total - - - 1,005
31 Activity represents net movement in outstandings.
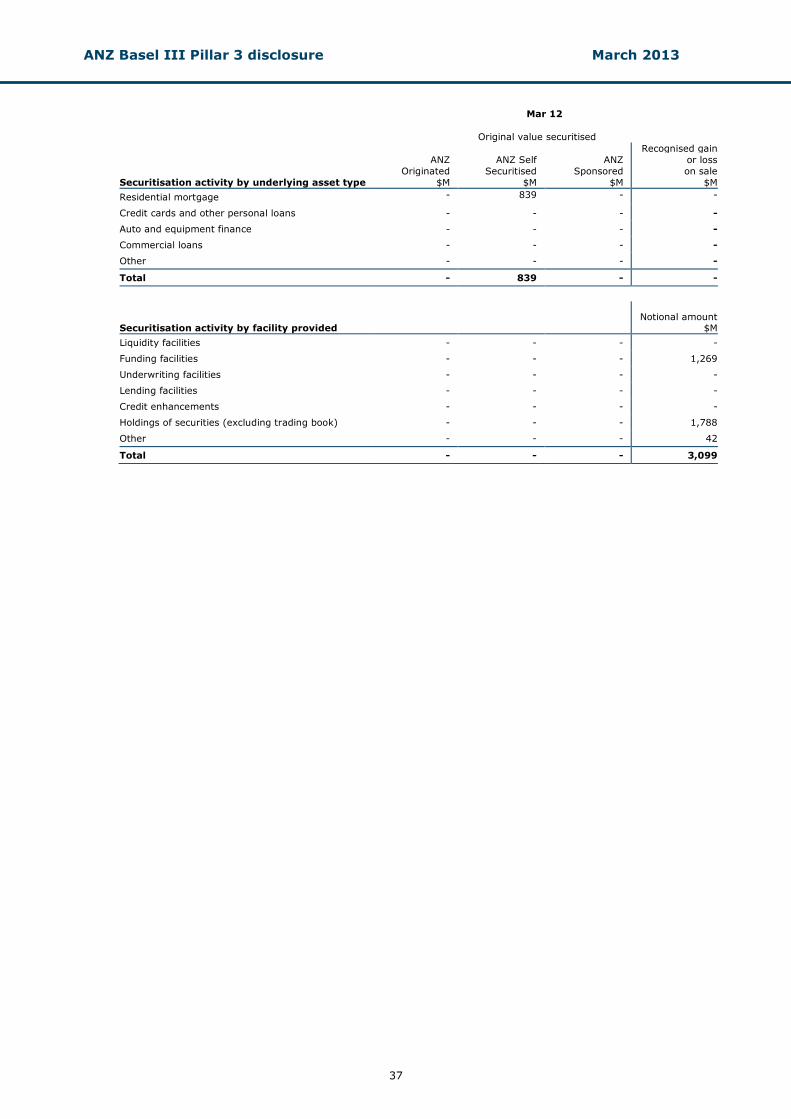
ANZ Basel III Pillar 3 disclosure March 2013
37
Mar 12
Original value securitised
Securitisation activity by underlying asset type
ANZ
Originated
$M
ANZ Self
Securitised
$M
ANZ
Sponsored
$M
Recognised gain
or loss
on sale
$M
Residential mortgage - 839 - -
Credit cards and other personal loans - - - -
Auto and equipment finance - - - -
Commercial loans - - - -
Other - - - -
Total - 839 - -
Securitisation activity by facility provided
Notional amount $M
Liquidity facilities - - - -
Funding facilities - - - 1,269
Underwriting facilities - - - -
Lending facilities - - - -
Credit enhancements - - - -
Holdings of securities (excluding trading book) - - - 1,788
Other - - - 42
Total - - - 3,099
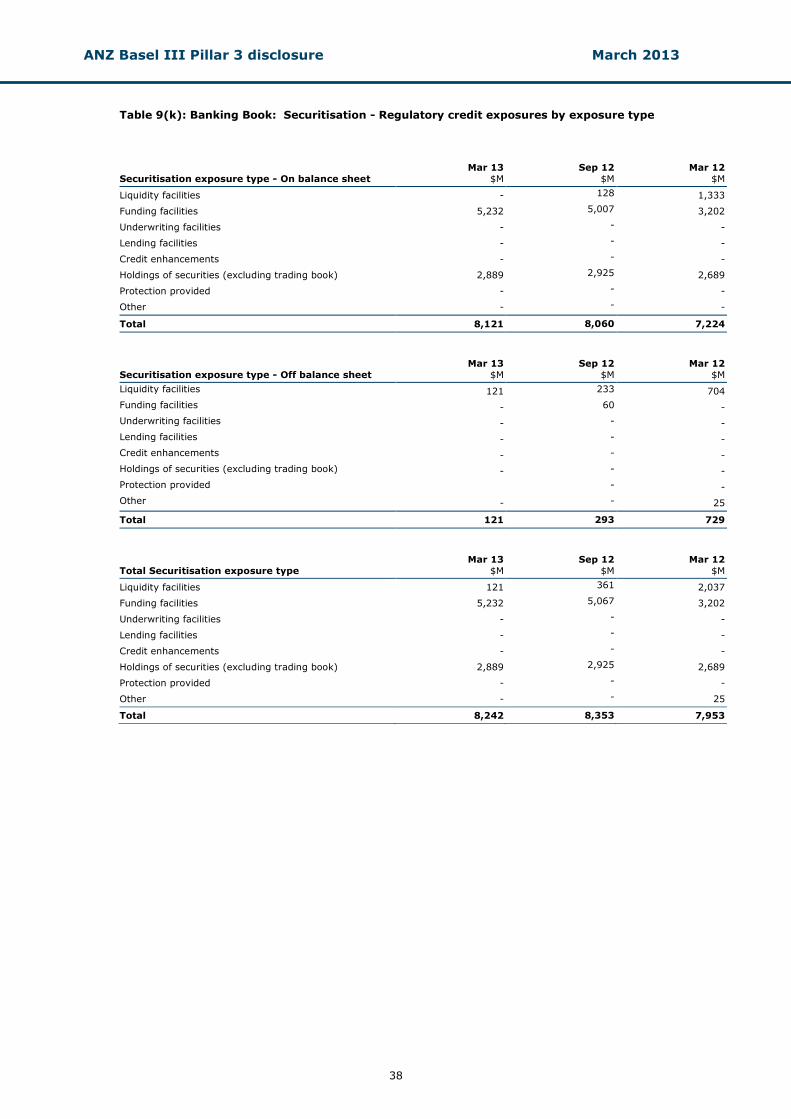
ANZ Basel III Pillar 3 disclosure March 2013
38
Table 9(k): Banking Book: Securitisation - Regulatory credit exposures by exposure type
Securitisation exposure type - On balance sheet
Mar 13
$M
Sep 12
$M
Mar 12
$M
Liquidity facilities - 128 1,333
Funding facilities 5,232 5,007 3,202
Underwriting facilities - - -
Lending facilities - - -
Credit enhancements - - -
Holdings of securities (excluding trading book) 2,889 2,925 2,689
Protection provided - - -
Other - - -
Total 8,121 8,060 7,224
Securitisation exposure type - Off balance sheet
Mar 13
$M
Sep 12
$M
Mar 12
$M
Liquidity facilities 121 233 704
Funding facilities - 60 -
Underwriting facilities - - -
Lending facilities - - -
Credit enhancements - - -
Holdings of securities (excluding trading book) - - -
Protection provided - -
Other - - 25
Total 121 293 729
Total Securitisation exposure type
Mar 13
$M
Sep 12
$M
Mar 12
$M
Liquidity facilities 121 361 2,037
Funding facilities 5,232 5,067 3,202
Underwriting facilities - - -
Lending facilities - - -
Credit enhancements - - -
Holdings of securities (excluding trading book) 2,889 2,925 2,689
Protection provided - - -
Other - - 25
Total 8,242 8,353 7,953
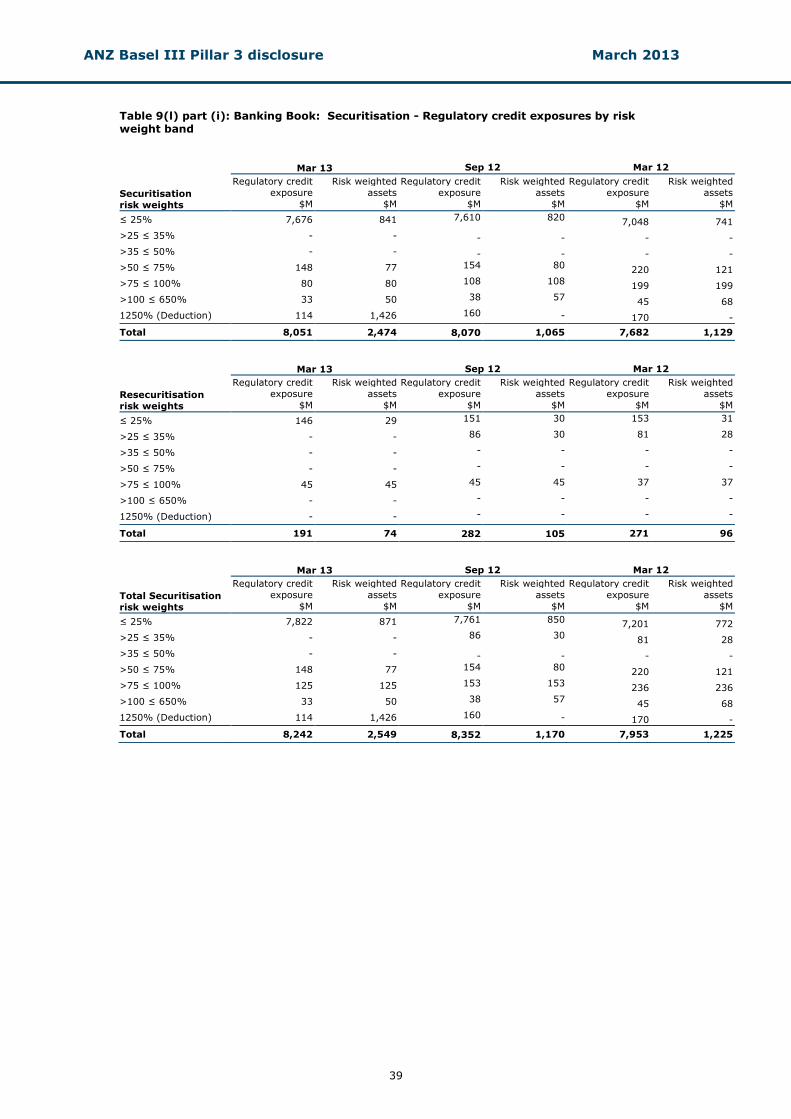
ANZ Basel III Pillar 3 disclosure March 2013
39
Table 9(l) part (i): Banking Book: Securitisation - Regulatory credit exposures by risk weight band Mar 13 Sep 12 Mar 12
Securitisation
risk weights
Regulatory credit
exposure
$M
Risk weighted
assets
$M
Regulatory credit
exposure
$M
Risk weighted
assets
$M
Regulatory credit
exposure
$M
Risk weighted
assets
$M
≤ 25% 7,676 841 7,610 820 7,048 741
>25 ≤ 35% - - - - - -
>35 ≤ 50% - - - - - -
>50 ≤ 75% 148 77 154 80 220 121
>75 ≤ 100% 80 80 108 108 199 199
>100 ≤ 650% 33 50 38 57 45 68
1250% (Deduction) 114 1,426 160 - 170 -
Total 8,051 2,474 8,070 1,065 7,682 1,129
Mar 13 Sep 12 Mar 12
Resecuritisation
risk weights
Regulatory credit
exposure
$M
Risk weighted
assets
$M
Regulatory credit
exposure
$M
Risk weighted
assets
$M
Regulatory credit
exposure
$M
Risk weighted
assets
$M
≤ 25% 146 29 151 30 153 31
>25 ≤ 35% - - 86 30 81 28
>35 ≤ 50% - - - - - -
>50 ≤ 75% - - - - - -
>75 ≤ 100% 45 45 45 45 37 37
>100 ≤ 650% - - - - - -
1250% (Deduction) - - - - - -
Total 191 74 282 105 271 96
Mar 13 Sep 12 Mar 12
Total Securitisation
risk weights
Regulatory credit
exposure
$M
Risk weighted
assets
$M
Regulatory credit
exposure
$M
Risk weighted
assets
$M
Regulatory credit
exposure
$M
Risk weighted
assets
$M
≤ 25% 7,822 871 7,761 850 7,201 772
>25 ≤ 35% - - 86 30 81 28
>35 ≤ 50% - - - - - -
>50 ≤ 75% 148 77 154 80 220 121
>75 ≤ 100% 125 125 153 153 236 236
>100 ≤ 650% 33 50 38 57 45 68
1250% (Deduction) 114 1,426 160 - 170 -
Total 8,242 2,549 8,352 1,170 7,953 1,225
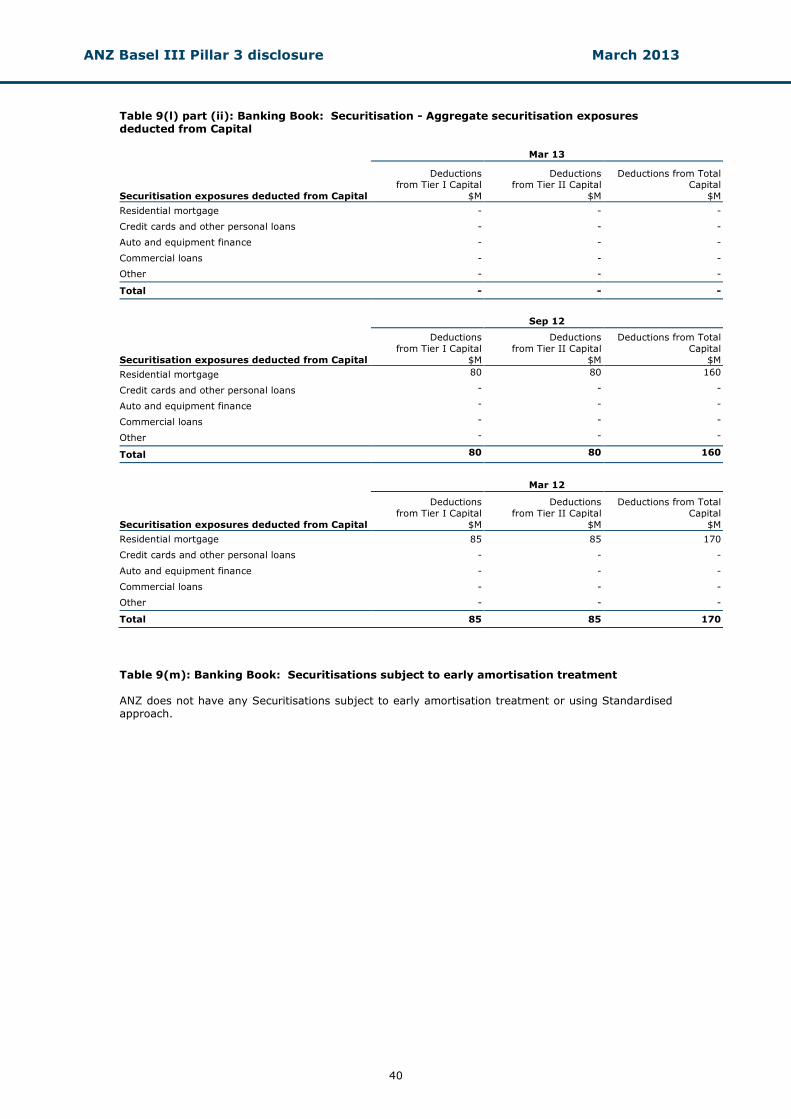
ANZ Basel III Pillar 3 disclosure March 2013
40
Table 9(l) part (ii): Banking Book: Securitisation - Aggregate securitisation exposures deducted from Capital Mar 13
Securitisation exposures deducted from Capital
Deductions from Tier I Capital
$M
Deductions from Tier II Capital
$M
Deductions from Total Capital
$M
Residential mortgage - - -
Credit cards and other personal loans - - -
Auto and equipment finance - - -
Commercial loans - - -
Other - - -
Total - - -
Sep 12
Securitisation exposures deducted from Capital
Deductions
from Tier I Capital
$M
Deductions
from Tier II Capital
$M
Deductions from Total
Capital
$M
Residential mortgage 80 80 160
Credit cards and other personal loans - - -
Auto and equipment finance - - -
Commercial loans - - -
Other - - -
Total 80 80 160
Mar 12
Securitisation exposures deducted from Capital
Deductions
from Tier I Capital
$M
Deductions
from Tier II Capital
$M
Deductions from Total
Capital
$M
Residential mortgage 85 85 170
Credit cards and other personal loans - - -
Auto and equipment finance - - -
Commercial loans - - -
Other - - -
Total 85 85 170 Table 9(m): Banking Book: Securitisations subject to early amortisation treatment ANZ does not have any Securitisations subject to early amortisation treatment or using Standardised approach.
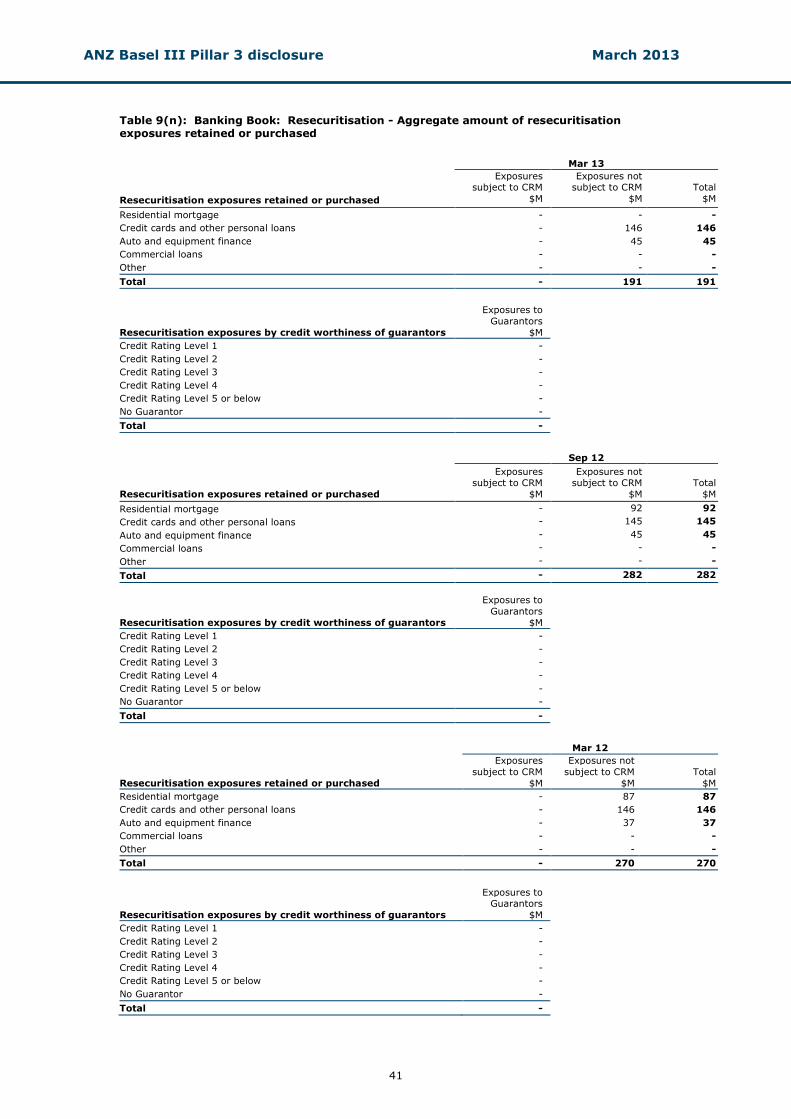
ANZ Basel III Pillar 3 disclosure March 2013
41
Table 9(n): Banking Book: Resecuritisation - Aggregate amount of resecuritisation exposures retained or purchased
Mar 13
Resecuritisation exposures retained or purchased
Exposures subject to CRM
$M
Exposures not subject to CRM
$M
Total
$M
Residential mortgage - - -
Credit cards and other personal loans - 146 146
Auto and equipment finance - 45 45
Commercial loans - - -
Other - - -
Total - 191 191
Resecuritisation exposures by credit worthiness of guarantors
Exposures to
Guarantors
$M
Credit Rating Level 1 -
Credit Rating Level 2 -
Credit Rating Level 3 -
Credit Rating Level 4 -
Credit Rating Level 5 or below -
No Guarantor -
Total -
Sep 12
Resecuritisation exposures retained or purchased
Exposures subject to CRM
$M
Exposures not subject to CRM
$M
Total
$M
Residential mortgage - 92 92
Credit cards and other personal loans - 145 145
Auto and equipment finance - 45 45
Commercial loans - - -
Other - - -
Total - 282 282
Resecuritisation exposures by credit worthiness of guarantors
Exposures to
Guarantors
$M
Credit Rating Level 1 -
Credit Rating Level 2 -
Credit Rating Level 3 -
Credit Rating Level 4 -
Credit Rating Level 5 or below -
No Guarantor -
Total -
Mar 12
Resecuritisation exposures retained or purchased
Exposures
subject to CRM
$M
Exposures not
subject to CRM
$M
Total
$M
Residential mortgage - 87 87
Credit cards and other personal loans - 146 146
Auto and equipment finance - 37 37
Commercial loans - - -
Other - - -
Total - 270 270
Resecuritisation exposures by credit worthiness of guarantors
Exposures to Guarantors
$M
Credit Rating Level 1 -
Credit Rating Level 2 -
Credit Rating Level 3 -
Credit Rating Level 4 -
Credit Rating Level 5 or below -
No Guarantor -
Total -
ANZ Basel III Pillar 3 disclosure March 2013
42
Trading Book Table 9(o): Trading Book: Traditional and synthetic securitisation exposures
No assets from ANZ's Trading Book were securitised during the reporting period. Table 9(p): Trading Book: Total amount of outstanding exposures intended to be securitised No assets from ANZ's Trading Book were intended to be securitised as at the reporting date. Table 9(q): Trading Book: Securitisation - Summary of current year's activity by underlying asset type and facility No assets from ANZ's Trading Book were securitised during the reporting period. Table 9(r): Trading Book: Traditional and synthetic securitisation exposures
No assets from ANZ's Trading Book were securitised during the reporting period.
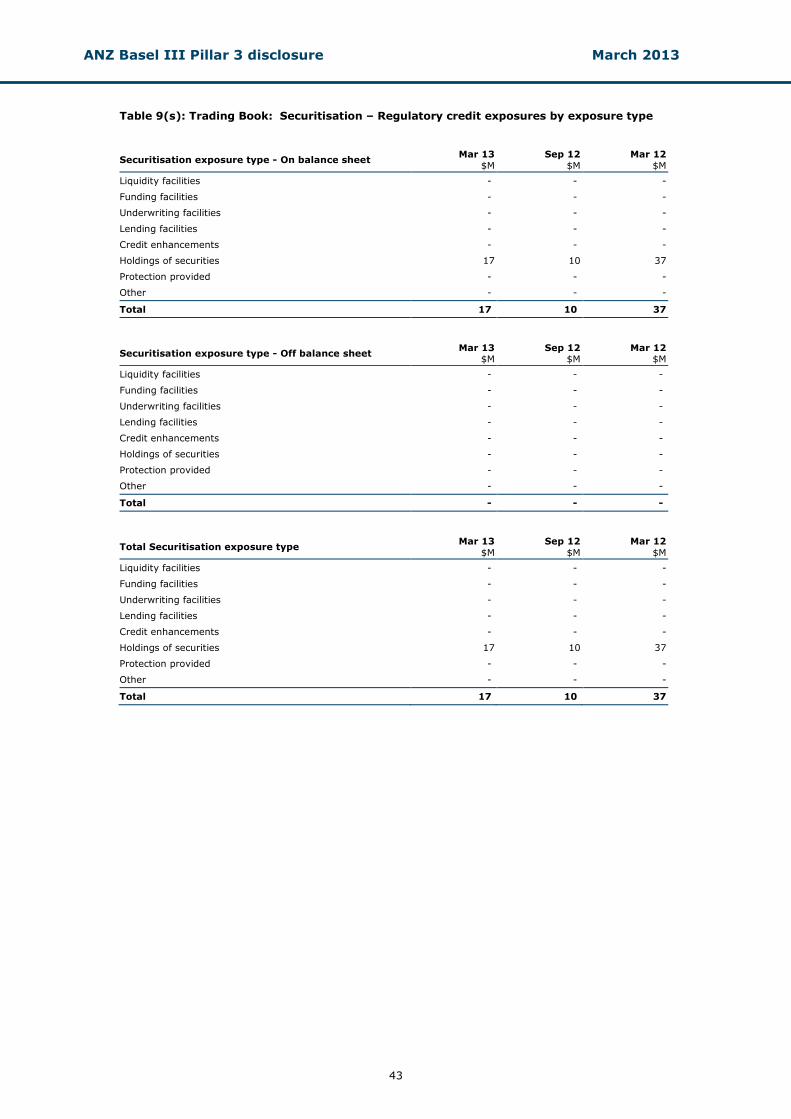
ANZ Basel III Pillar 3 disclosure March 2013
43
Table 9(s): Trading Book: Securitisation – Regulatory credit exposures by exposure type
Securitisation exposure type - On balance sheet Mar 13
$M
Sep 12
$M
Mar 12
$M
Liquidity facilities - - -
Funding facilities - - -
Underwriting facilities - - -
Lending facilities - - -
Credit enhancements - - -
Holdings of securities 17 10 37
Protection provided - - -
Other - - -
Total 17 10 37
Securitisation exposure type - Off balance sheet Mar 13
$M Sep 12
$M Mar 12
$M
Liquidity facilities - - -
Funding facilities - - -
Underwriting facilities - - -
Lending facilities - - -
Credit enhancements - - -
Holdings of securities - - -
Protection provided - - -
Other - - -
Total - - -
Total Securitisation exposure type Mar 13
$M
Sep 12
$M
Mar 12
$M
Liquidity facilities - - -
Funding facilities - - -
Underwriting facilities - - -
Lending facilities - - -
Credit enhancements - - -
Holdings of securities 17 10 37
Protection provided - - -
Other - - -
Total 17 10 37

ANZ Basel III Pillar 3 disclosure March 2013
44
Table 9(t)(i) & Table 9(u)(i): Trading Book: Aggregate securitisation exposures subject to Internal Models Approach (IMA) and the associated Capital requirements
ANZ does not have any Securitisation exposures subject to Internal Models Approach. Table 9(t)(ii) & Table 9(u)(ii): Trading Book: Aggregate securitisation exposures subject to APS120 and the associated Capital requirements ANZ does not have any aggregate Securitisation exposures subject to APS120 and the associated Capital requirements. Table 9(u)(iii): Trading Book: Securitisation - Aggregate securitisation exposures deducted from Capital ANZ does not have any Securitisation exposures deducted from Capital. Table 9(v): Trading Book: Securitisations subject to early amortisation treatment
ANZ does not have any Securitisation exposures subject to early amortisation or using Standardised approach.
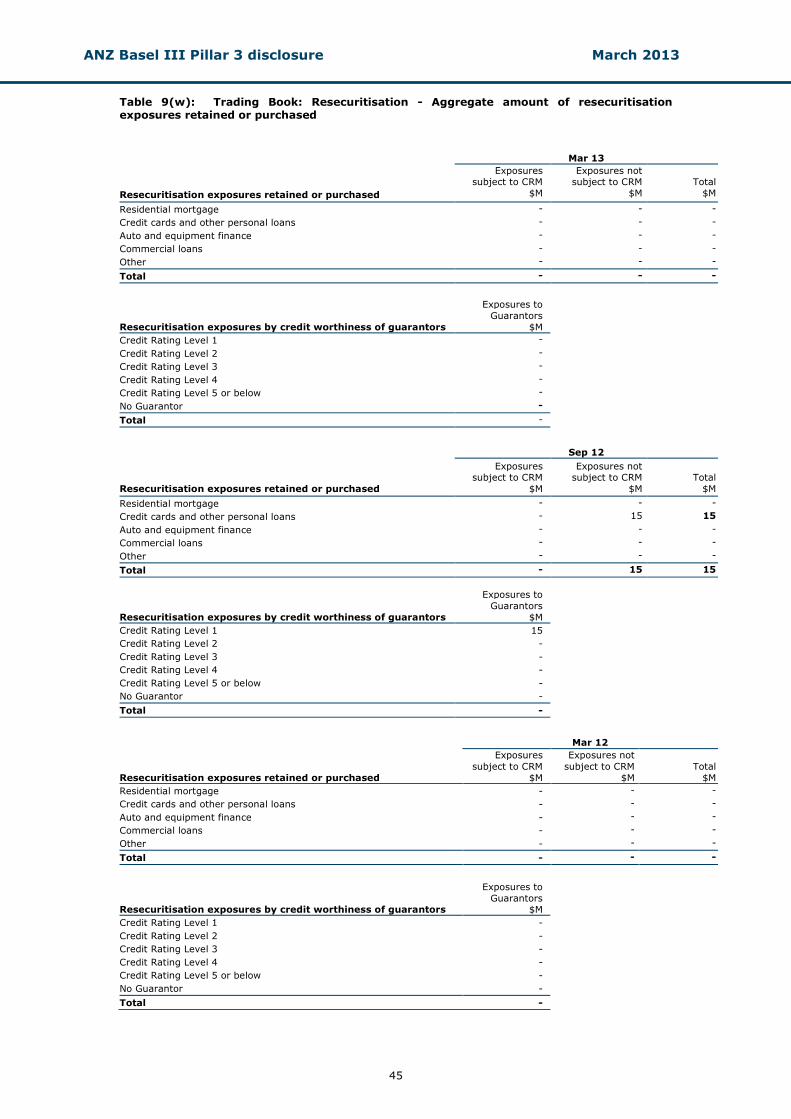
ANZ Basel III Pillar 3 disclosure March 2013
45
Table 9(w): Trading Book: Resecuritisation - Aggregate amount of resecuritisation exposures retained or purchased
Mar 13
Resecuritisation exposures retained or purchased
Exposures subject to CRM
$M
Exposures not subject to CRM
$M
Total
$M
Residential mortgage - - -
Credit cards and other personal loans - - -
Auto and equipment finance - - -
Commercial loans - - -
Other - - -
Total - - -
Resecuritisation exposures by credit worthiness of guarantors
Exposures to
Guarantors
$M
Credit Rating Level 1 -
Credit Rating Level 2 -
Credit Rating Level 3 -
Credit Rating Level 4 -
Credit Rating Level 5 or below -
No Guarantor -
Total -
Sep 12
Resecuritisation exposures retained or purchased
Exposures subject to CRM
$M
Exposures not subject to CRM
$M
Total
$M
Residential mortgage - - -
Credit cards and other personal loans - 15 15
Auto and equipment finance - - -
Commercial loans - - -
Other - - -
Total - 15 15
Resecuritisation exposures by credit worthiness of guarantors
Exposures to
Guarantors
$M
Credit Rating Level 1 15
Credit Rating Level 2 -
Credit Rating Level 3 -
Credit Rating Level 4 -
Credit Rating Level 5 or below -
No Guarantor -
Total -
Mar 12
Resecuritisation exposures retained or purchased
Exposures
subject to CRM
$M
Exposures not
subject to CRM
$M
Total
$M
Residential mortgage - - -
Credit cards and other personal loans - - -
Auto and equipment finance - - -
Commercial loans - - -
Other - - -
Total - - -
Resecuritisation exposures by credit worthiness of guarantors
Exposures to
Guarantors $M
Credit Rating Level 1 -
Credit Rating Level 2 -
Credit Rating Level 3 -
Credit Rating Level 4 -
Credit Rating Level 5 or below -
No Guarantor -
Total -
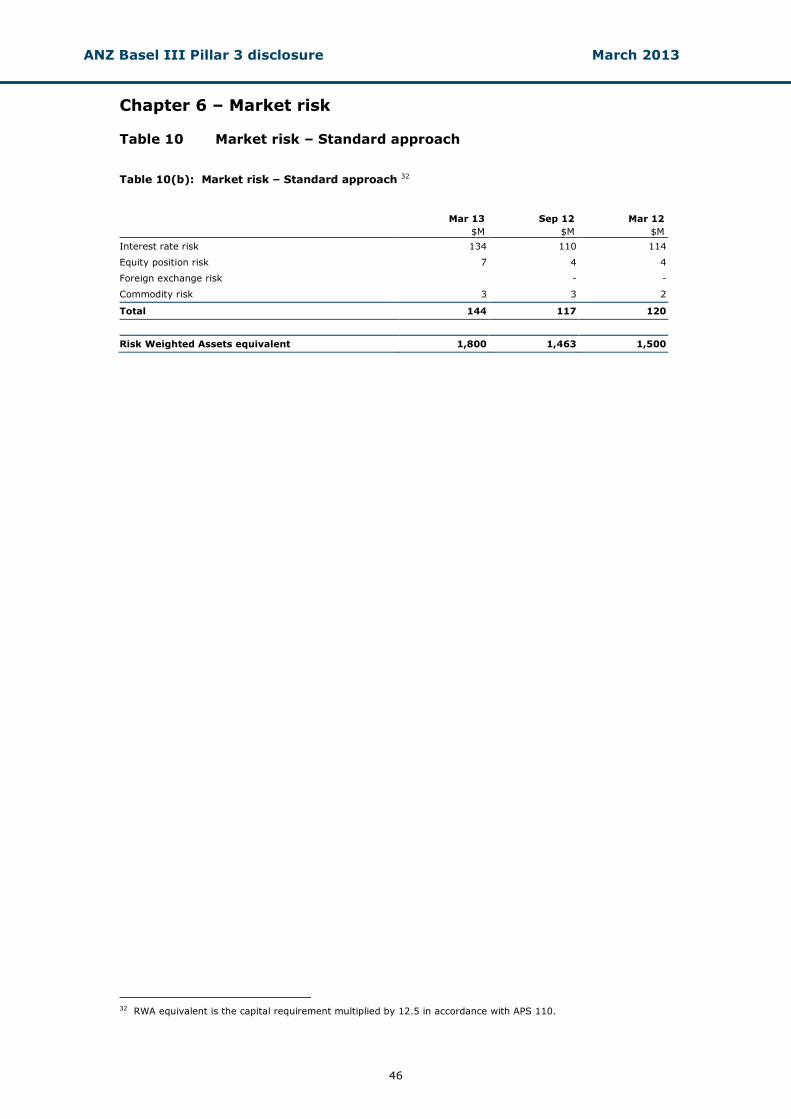
ANZ Basel III Pillar 3 disclosure March 2013
46
Chapter 6 – Market risk
Table 10 Market risk – Standard approach Table 10(b): Market risk – Standard approach 32 Mar 13 Sep 12 Mar 12
$M $M $M
Interest rate risk 134 110 114
Equity position risk 7 4 4
Foreign exchange risk - -
Commodity risk 3 3 2
Total 144 117 120
Risk Weighted Assets equivalent 1,800 1,463 1,500
32 RWA equivalent is the capital requirement multiplied by 12.5 in accordance with APS 110.
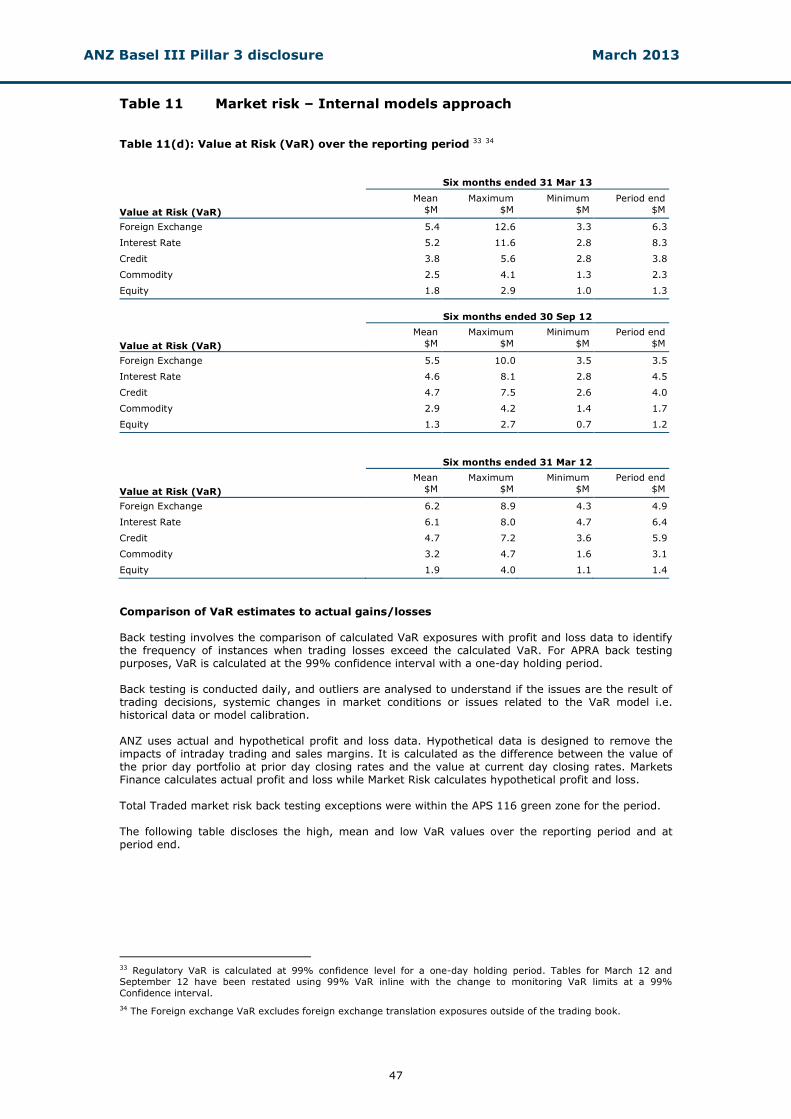
ANZ Basel III Pillar 3 disclosure March 2013
47
Table 11 Market risk – Internal models approach Table 11(d): Value at Risk (VaR) over the reporting period 33 34
Six months ended 31 Mar 13
Value at Risk (VaR)
Mean
$M
Maximum
$M
Minimum
$M
Period end
$M
Foreign Exchange 5.4 12.6 3.3 6.3
Interest Rate 5.2 11.6 2.8 8.3
Credit 3.8 5.6 2.8 3.8
Commodity 2.5 4.1 1.3 2.3
Equity 1.8 2.9 1.0 1.3
Six months ended 30 Sep 12
Value at Risk (VaR)
Mean
$M
Maximum
$M
Minimum
$M
Period end
$M
Foreign Exchange 5.5 10.0 3.5 3.5
Interest Rate 4.6 8.1 2.8 4.5
Credit 4.7 7.5 2.6 4.0
Commodity 2.9 4.2 1.4 1.7
Equity 1.3 2.7 0.7 1.2
Six months ended 31 Mar 12
Value at Risk (VaR)
Mean
$M
Maximum
$M
Minimum
$M
Period end
$M
Foreign Exchange 6.2 8.9 4.3 4.9
Interest Rate 6.1 8.0 4.7 6.4
Credit 4.7 7.2 3.6 5.9
Commodity 3.2 4.7 1.6 3.1
Equity 1.9 4.0 1.1 1.4
Comparison of VaR estimates to actual gains/losses Back testing involves the comparison of calculated VaR exposures with profit and loss data to identify the frequency of instances when trading losses exceed the calculated VaR. For APRA back testing purposes, VaR is calculated at the 99% confidence interval with a one-day holding period. Back testing is conducted daily, and outliers are analysed to understand if the issues are the result of trading decisions, systemic changes in market conditions or issues related to the VaR model i.e. historical data or model calibration. ANZ uses actual and hypothetical profit and loss data. Hypothetical data is designed to remove the impacts of intraday trading and sales margins. It is calculated as the difference between the value of the prior day portfolio at prior day closing rates and the value at current day closing rates. Markets Finance calculates actual profit and loss while Market Risk calculates hypothetical profit and loss.
Total Traded market risk back testing exceptions were within the APS 116 green zone for the period. The following table discloses the high, mean and low VaR values over the reporting period and at period end.
33 Regulatory VaR is calculated at 99% confidence level for a one-day holding period. Tables for March 12 and September 12 have been restated using 99% VaR inline with the change to monitoring VaR limits at a 99%
Confidence interval.
34 The Foreign exchange VaR excludes foreign exchange translation exposures outside of the trading book.
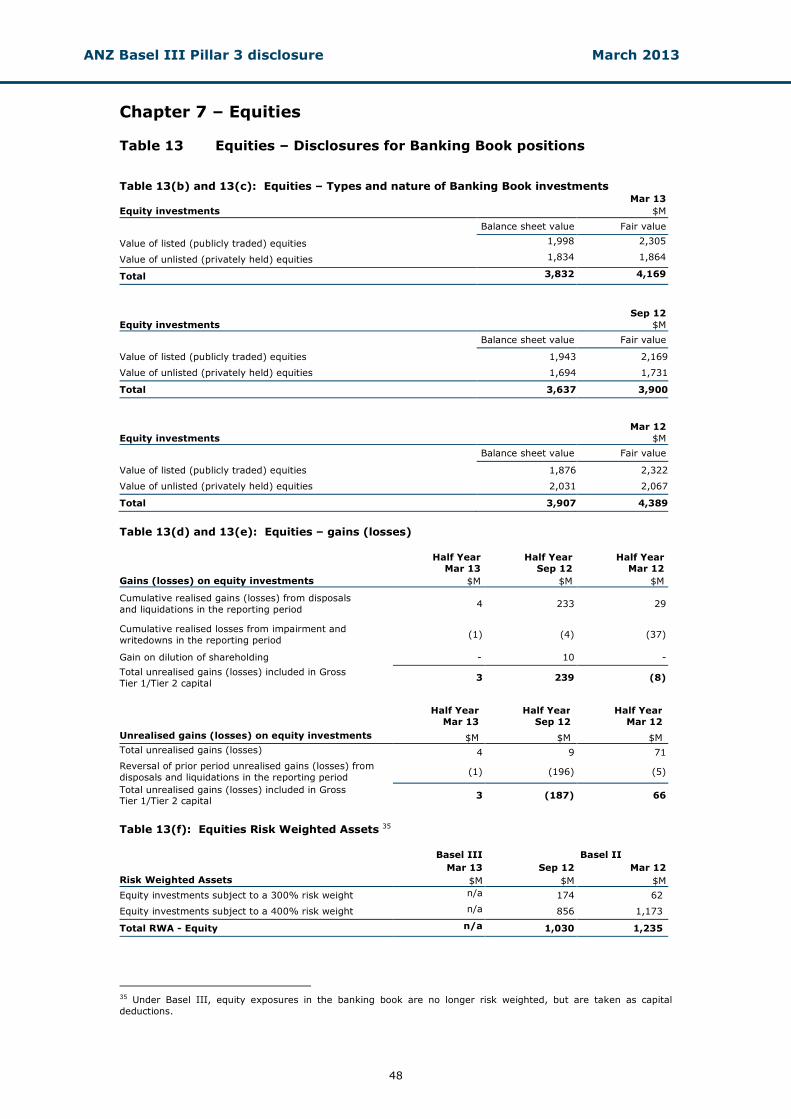
ANZ Basel III Pillar 3 disclosure March 2013
48
Chapter 7 – Equities Table 13 Equities – Disclosures for Banking Book positions Table 13(b) and 13(c): Equities – Types and nature of Banking Book investments
Mar 13
Equity investments $M
Balance sheet value Fair value
Value of listed (publicly traded) equities 1,998 2,305
Value of unlisted (privately held) equities 1,834 1,864
Total 3,832 4,169
Sep 12
Equity investments $M
Balance sheet value Fair value
Value of listed (publicly traded) equities 1,943 2,169
Value of unlisted (privately held) equities 1,694 1,731
Total 3,637 3,900
Mar 12
Equity investments $M
Balance sheet value Fair value
Value of listed (publicly traded) equities 1,876 2,322
Value of unlisted (privately held) equities 2,031 2,067
Total 3,907 4,389
Table 13(d) and 13(e): Equities – gains (losses)
Half Year
Mar 13
Half Year
Sep 12
Half Year
Mar 12
Gains (losses) on equity investments $M $M $M
Cumulative realised gains (losses) from disposals
and liquidations in the reporting period 4 233 29
Cumulative realised losses from impairment and
writedowns in the reporting period (1) (4) (37)
Gain on dilution of shareholding - 10 -
Total unrealised gains (losses) included in Gross
Tier 1/Tier 2 capital 3 239 (8)
Half Year
Mar 13
Half Year
Sep 12
Half Year
Mar 12
Unrealised gains (losses) on equity investments $M $M $M
Total unrealised gains (losses) 4 9 71
Reversal of prior period unrealised gains (losses) from
disposals and liquidations in the reporting period (1) (196) (5)
Total unrealised gains (losses) included in Gross Tier 1/Tier 2 capital
3 (187) 66
Table 13(f): Equities Risk Weighted Assets 35 Basel III Basel II
Mar 13 Sep 12 Mar 12
Risk Weighted Assets $M $M $M
Equity investments subject to a 300% risk weight n/a 174 62
Equity investments subject to a 400% risk weight n/a 856 1,173
Total RWA - Equity n/a 1,030 1,235
35 Under Basel III, equity exposures in the banking book are no longer risk weighted, but are taken as capital
deductions.
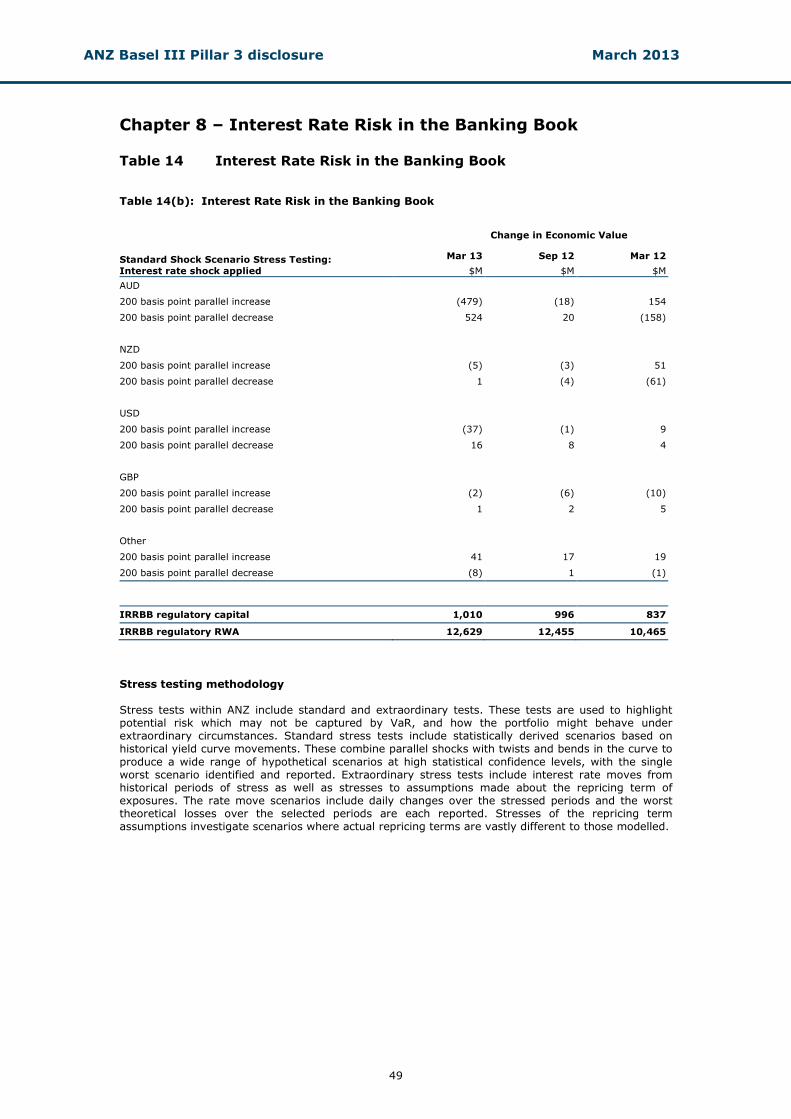
ANZ Basel III Pillar 3 disclosure March 2013
49
Chapter 8 – Interest Rate Risk in the Banking Book
Table 14 Interest Rate Risk in the Banking Book Table 14(b): Interest Rate Risk in the Banking Book
Change in Economic Value
Standard Shock Scenario Stress Testing:
Interest rate shock applied
Mar 13 Sep 12 Mar 12
$M $M $M
AUD
200 basis point parallel increase (479) (18) 154
200 basis point parallel decrease 524 20 (158)
NZD
200 basis point parallel increase (5) (3) 51
200 basis point parallel decrease 1 (4) (61)
USD
200 basis point parallel increase (37) (1) 9
200 basis point parallel decrease 16 8 4
GBP
200 basis point parallel increase (2) (6) (10)
200 basis point parallel decrease 1 2 5
Other
200 basis point parallel increase 41 17 19
200 basis point parallel decrease (8) 1 (1)
IRRBB regulatory capital 1,010 996 837
IRRBB regulatory RWA 12,629 12,455 10,465
Stress testing methodology Stress tests within ANZ include standard and extraordinary tests. These tests are used to highlight potential risk which may not be captured by VaR, and how the portfolio might behave under extraordinary circumstances. Standard stress tests include statistically derived scenarios based on historical yield curve movements. These combine parallel shocks with twists and bends in the curve to
produce a wide range of hypothetical scenarios at high statistical confidence levels, with the single worst scenario identified and reported. Extraordinary stress tests include interest rate moves from historical periods of stress as well as stresses to assumptions made about the repricing term of exposures. The rate move scenarios include daily changes over the stressed periods and the worst theoretical losses over the selected periods are each reported. Stresses of the repricing term assumptions investigate scenarios where actual repricing terms are vastly different to those modelled.
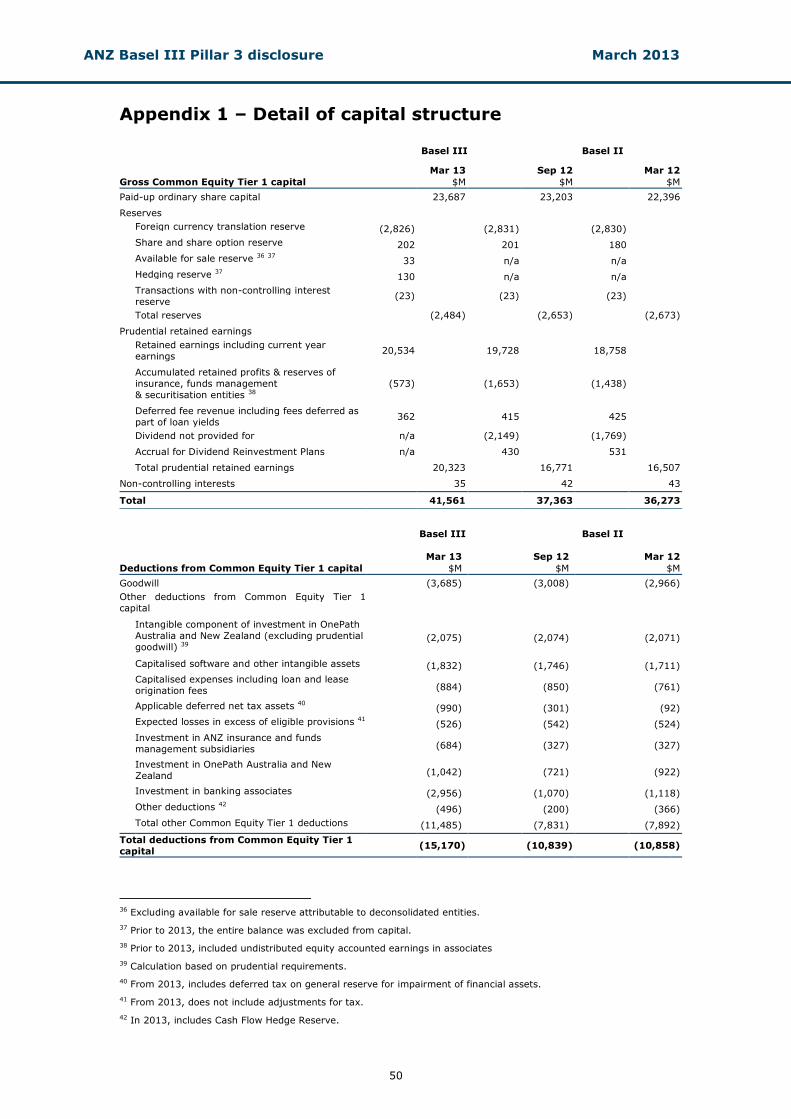
ANZ Basel III Pillar 3 disclosure March 2013
50
Appendix 1 – Detail of capital structure
Basel III Basel II
Mar 13 Sep 12 Mar 12
Gross Common Equity Tier 1 capital $M $M $M
Paid-up ordinary share capital 23,687 23,203 22,396
Reserves
Foreign currency translation reserve (2,826) (2,831) (2,830)
Share and share option reserve 202 201 180
Available for sale reserve 36 37 33 n/a n/a
Hedging reserve 37 130 n/a n/a
Transactions with non-controlling interest
reserve (23) (23) (23)
Total reserves (2,484) (2,653) (2,673)
Prudential retained earnings
Retained earnings including current year
earnings 20,534 19,728 18,758
Accumulated retained profits & reserves of
insurance, funds management
& securitisation entities 38
(573) (1,653) (1,438)
Deferred fee revenue including fees deferred as
part of loan yields 362 415 425
Dividend not provided for n/a (2,149) (1,769)
Accrual for Dividend Reinvestment Plans n/a 430 531
Total prudential retained earnings 20,323 16,771 16,507
Non-controlling interests 35 42 43
Total 41,561 37,363 36,273
Basel III Basel II
Mar 13 Sep 12 Mar 12
Deductions from Common Equity Tier 1 capital $M $M $M
Goodwill (3,685) (3,008) (2,966)
Other deductions from Common Equity Tier 1
capital
Intangible component of investment in OnePath
Australia and New Zealand (excluding prudential
goodwill) 39 (2,075) (2,074) (2,071)
Capitalised software and other intangible assets (1,832) (1,746) (1,711)
Capitalised expenses including loan and lease
origination fees (884) (850) (761)
Applicable deferred net tax assets 40 (990) (301) (92)
Expected losses in excess of eligible provisions 41 (526) (542) (524)
Investment in ANZ insurance and funds
management subsidiaries (684) (327) (327)
Investment in OnePath Australia and New
Zealand (1,042) (721) (922)
Investment in banking associates (2,956) (1,070) (1,118)
Other deductions 42 (496) (200) (366)
Total other Common Equity Tier 1 deductions (11,485) (7,831) (7,892)
Total deductions from Common Equity Tier 1
capital (15,170) (10,839) (10,858)
36 Excluding available for sale reserve attributable to deconsolidated entities.
37 Prior to 2013, the entire balance was excluded from capital.
38 Prior to 2013, included undistributed equity accounted earnings in associates
39 Calculation based on prudential requirements.
40 From 2013, includes deferred tax on general reserve for impairment of financial assets.
41 From 2013, does not include adjustments for tax.
42 In 2013, includes Cash Flow Hedge Reserve.
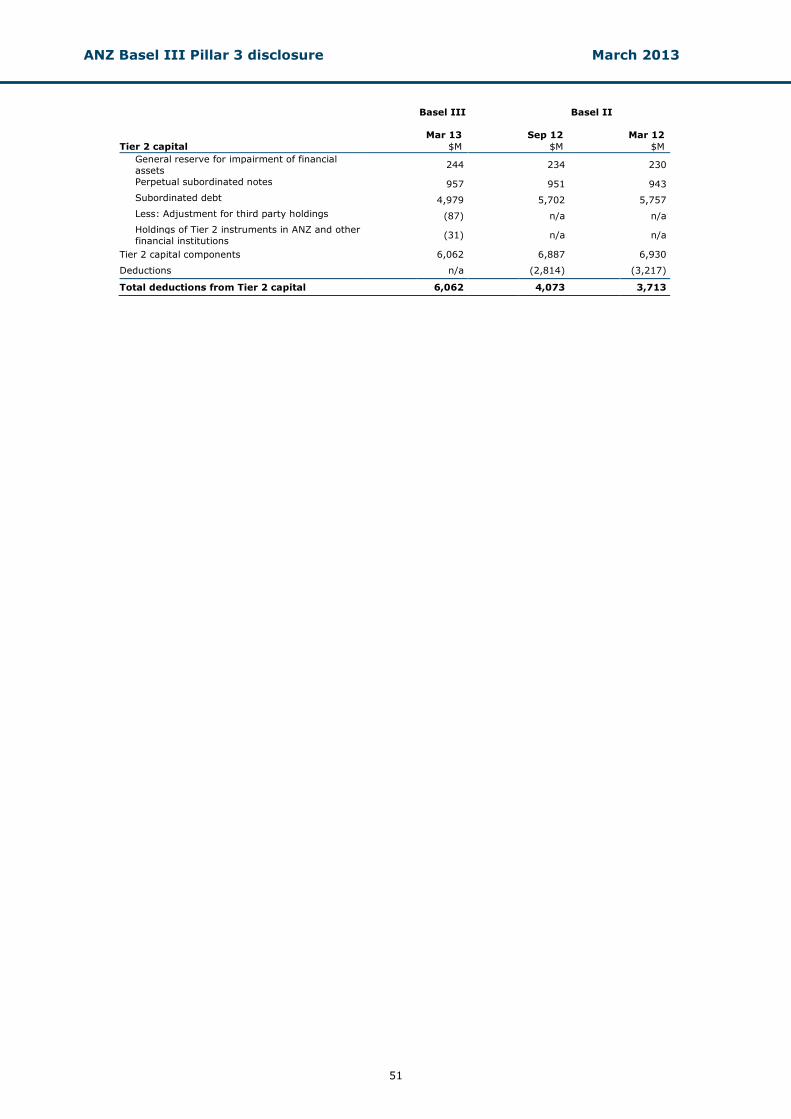
ANZ Basel III Pillar 3 disclosure March 2013
51
Basel III Basel II
Mar 13 Sep 12 Mar 12
Tier 2 capital $M $M $M
General reserve for impairment of financial
assets 244 234 230
Perpetual subordinated notes 957 951 943
Subordinated debt 4,979 5,702 5,757
Less: Adjustment for third party holdings (87) n/a n/a
Holdings of Tier 2 instruments in ANZ and other
financial institutions (31) n/a n/a
Tier 2 capital components 6,062 6,887 6,930
Deductions n/a (2,814) (3,217)
Total deductions from Tier 2 capital 6,062 4,073 3,713
ANZ Basel III Pillar 3 disclosure March 2013
52
Appendix 2 – ANZ Bank (Europe) Limited ANZ Bank (Europe) Limited (ANZBEL) is a 100% owned and controlled subsidiary of ANZ. ANZBEL was regulated by the Financial Services Authority (FSA) until 31 March 2013, after which date the FSA split to form the Prudential Regulatory Authority (PRA) and the Financial Conduct Authority (FCA). ANZBEL is subject to similar Pillar 3 requirements as ANZ, under the FSA's Prudential Source Book for Banks, Building Societies and Investment Firms (BIPRU). The FSA has granted ANZBEL a Pillar 3 Disclosure waiver direction, which can be found on the FSA website: fsa.gov.uk/pubs/waivers/bipru_waivers.pdf. In line with the FSA waiver direction, ANZBEL will rely on disclosures in this document to satisfy most of its Pillar 3 disclosure obligations. The following FSA requirements are not mirrored in APS 330 or included in this disclosure document, and as such are required by the FSA to be reported on an individual basis in the annual ANZBEL Statutory Accounts:
• BIPRU 11.5.4R (4) - Disclosure of the firm’s minimum capital requirements covering position, foreign exchange, commodity, counterparty and concentration risks.
• BIPRU 11.5.12R – Disclosure: Market Risk.
ANZ Basel III Pillar 3 disclosure March 2013
53
Glossary Collective provision (CP) Collective provision is the provision for credit losses that are
inherent in the portfolio but not able to be individually identified. A collective provision may only be recognised when a loss event has already occurred. Losses expected as a result of future events, no matter how likely, are not recognised.
Credit Default Swaps (CDS) A sequence of payments by one party (often called the “Buyer”) in exchange for an obligation of the other party (often called the “Seller”) to make a payment to the buyer if a credit default event occurs in relation to a specified reference entity (and possibly a specified obligation of that reference entity).
Credit exposure
The aggregate of all claims, commitments and contingent liabilities arising from on- and off-balance sheet transactions (in the banking book and trading book) with the counterparty or group of related counterparties.
Credit risk The risk of financial loss resulting from the failure of ANZ’s customers and counterparties to honour or perform fully the terms of a loan or contract.
Credit Valuation Adjustment (CVA) Over the life of a derivative instrument, ANZ uses a CVA model to adjust fair value to take into account the impact of counterparty credit quality. The methodology calculates the present value of expected losses over the life of the financial instrument as a function of probability of default, loss given default, expected credit risk exposure and an asset correlation factor. Impaired derivatives are also subject to a CVA.
Days past due
The number of days a credit obligation is overdue, commencing on the date that the arrears or excess occurs and accruing for each completed calendar day thereafter.
Equity risk Is the potential loss that may be incurred on equity investments in the banking book.
Expected loss (EL) Expected loss is determined based on the expected average annual loss of principal over the economic cycle for the current risk profile of the lending portfolio.
Exposure at Default (EAD) Exposure At Default is defined as the expected facility exposure
at the date of default.
Impaired assets (IA) Facilities are classified as impaired when there is doubt as to whether the contractual amounts due, including interest and other payments, will be met in a timely manner. Impaired assets include impaired facilities, and impaired derivatives. Impaired derivatives have a credit valuation adjustment (CVA), which is a market assessment of the credit risk of the relevant counterparties.
Impaired loans (IL) Impaired loans comprise of drawn facilities where the customer’s status is defined as impaired.
Individual provision charge (IPC) Impaired provision charge is the amount of expected credit losses on financial instruments assessed for impairment on an individual basis (as opposed to on a collective basis). It takes into account expected cash flows over the lives of those financial instruments.
Individual provisions (IP) Individual provisions are assessed on a case-by-case basis for all individually managed impaired assets taking into consideration factors such as the realisable value of security (or other credit mitigants), the likely return available upon liquidation or bankruptcy, legal uncertainties, estimated costs involved in recovery, the market price of the exposure in secondary markets and the amount and timing of expected
ANZ Basel III Pillar 3 disclosure March 2013
54
receipts and recoveries.
Loss Given Default (LGD) Loss Given Default is an estimate of the potential economic loss on a credit exposure, incurred as a consequence of obligor default and expressed as a percentage of the facility’s EAD.
Market risk The risk to ANZ’s earnings arising from changes in interest rates, currency exchange rates and credit spreads, or from fluctuations in bond, commodity or equity prices. ANZ has grouped market risk into two broad categories to facilitate the measurement, reporting and control of market risk: Traded market risk - the risk of loss from changes in the value of financial instruments due to movements in price factors for physical and derivative trading positions. Trading positions arise from transactions where ANZ acts as principal with clients or with the market. Non-traded market risk (or balance sheet risk) - comprises interest rate risk in the banking book and the risk to the AUD denominated value of ANZ’s capital and earnings due to foreign exchange rate movements.
Operational risk The risk of loss resulting from inadequate or failed internal controls or from external events, including legal risk but excluding reputation risk.
Past due facilities Facilities where a contractual payment has not been met or the customer is outside of contractual arrangements are deemed past due. Past due facilities include those operating in excess of approved arrangements or where scheduled repayments are outstanding but do not include impaired assets.
Probability of Default (PD) Probability of Default is an estimate of the level of the risk of borrower default.
Recoveries Payments received and taken to profit for the current period for
the amounts written off in prior financial periods.
Regulatory Expected Loss Regulatory Expected Loss is a measure of expected credit losses at the start of the year, whereas write-offs relate to a fluctuating portfolio and are recorded throughout the year.
Restructured items Restructured items comprise facilities in which the original contractual terms have been modified for reasons related to the financial difficulties of the customer. Restructuring may consist of reduction of interest, principal or other payments legally due, or an extension in maturity materially beyond those typically offered to new facilities with similar risk.
Risk Weighted Assets (RWA) Assets which are weighted for credit risk according to a set formula (APS 112/113).
Securitisation risk The risk of credit related losses greater than expected due to a securitisation failing to operate as anticipated, or of the values and risks accepted or transferred, not emerging as expected.
Write-Offs Facilities are written off against the related provision for impairment when they are assessed as partially or fully uncollectable, and after proceeds from the realisation of any collateral have been received. Where individual provisions recognised in previous periods have subsequently decreased or are no longer required, such impairment losses are reversed in the current period income statement.

ANZ Basel III Pillar 3 disclosure March 2013
This page has been intentionally left blank

ANZ Basel III Pillar 3 disclosure March 2013