Embed Size (px)
Citation preview

2018 BASEL III PILLAR 3DISCLOSURE
AS AT 31 MARCH 2018
APS 330: PUBLIC DISCLOSURE

ANZ Basel III Pillar 3 Disclosure March 2018
1
Important notice This document has been prepared by Australia and New Zealand Banking Group Limited (ANZ) to meet its disclosure obligations under the Australian Prudential Regulation Authority (APRA) ADI Prudential Standard (APS) 330: Public Disclosure.

ANZ Basel III Pillar 3 Disclosure March 2018
2
TABLE OF CONTENTS1
Chapter 1 – Highlights ........................................................................................................ 3
Chapter 2 – Introduction .................................................................................................... 5
Purpose of this document ............................................................................................. 5
Chapter 3 – Capital and capital adequacy ............................................................................. 6
Table 1 Capital disclosure template ........................................................................... 7
Table 2 Main features of capital instruments ............................................................. 18
Table 6 Capital adequacy ....................................................................................... 19
Chapter 4 – Credit risk ..................................................................................................... 21
Table 7 Credit risk – General disclosures .................................................................. 21
Table 8 Credit risk – Disclosures for portfolios subject to the Standardised approach
and supervisory risk weights in the IRB approach .......................................... 34
Table 9 Credit risk – Disclosures for portfolios subject to Advanced IRB approaches ...... 35
Table 10 Credit risk mitigation disclosures ................................................................. 43
Table 11 Counterparty Credit Risk ............................................................................. 46
Chapter 5 – Securitisation ................................................................................................. 48
Table 12 Banking Book - Securitisation disclosures ...................................................... 48
Trading Book - Securitisation disclosures ...................................................... 56
Chapter 6 – Market risk .................................................................................................... 59
Table 13 Market risk – Standard approach ................................................................. 59
Table 14 Market risk – Internal models approach ........................................................ 60
Chapter 7 – Equities ........................................................................................................ 61
Table 16 Equities – Disclosures for banking book positions ........................................... 61
Chapter 8 – Interest Rate Risk in the Banking Book ............................................................. 62
Table 17 Interest Rate Risk in the Banking Book ......................................................... 62
Chapter 9 – Leverage and Liquidity Ratio ............................................................................ 63
Table 18 Leverage Ratio .......................................................................................... 63
Table 19 Summary comparison of accounting assets vs. leverage ratio exposure
measure .................................................................................................. 64
Table 20 Liquidity Coverage Ratio ............................................................................. 65
Glossary ......................................................................................................................... 66
1 Each table reference adopted in this document aligns to those required by APS 330 to be disclosed at half year.

ANZ Basel III Pillar 3 Disclosure March 2018
3
Chapter 1 – Highlights
10.1% 10.6% 11.0%
15.2% 15.8% 16.3%
Mar-17 Sep-17 Mar-18
Common Equity Tier 1 (CET1) Ratios*
APRA Basel III Internationally Comparable Basel III
..-------------------------------------------------------------------------------------------
3.5% CapitalConservation
Buffer-------------------------------------------------------------------------------------------
4.5% CET1Minimum
899 903 930
Mar 17 Sep 17 Mar 18
Exposure at Default* ($bn)
Standardised QCCP Specialised LendingQRR & Other Retail Residential Mortgage Bank & SovereignCorporate
EAD up $27bn to $930bn for 1H18 • Underlying movement primarily driven by growth in Sovereign, Residential Mortgages and Corporate asset classes, partially offset by reduction in Qualifying Revolving Retail and Standardised portfolio.
Impaired Assets down $374m 14% HoH • Decrease in Impaired Assets HoH is driven by all divisions due to lower impairments taken combined with the sale of the Asia Retail and Wealth businesses.
* Internationally Comparable methodology aligns with APRA’s information paper entitled International Capital Comparison Study (13 July 2015). Basel III Internationally Comparable ratios do not include an estimate of the Basel I capital floor requirement.
*Exposure at Default is post Credit Risk Mitigation (CRM) and does not include Securitisation, Equities or Other Assets.
Strong capital position at March 2018 • Capital ratios have increased in the half to March 2018 mainly due to cash earnings generation and benefits from settlement of asset disposals (Shanghai Rural Commercial Bank, Asia Retail assets and 20% stake in Metrobank Card Corporation). These were partly offset by the payment of the September 2017 Final Dividend and completion of $1.1bn of on-market share buy back. • CET1 ratio is currently in excess of APRA’s ‘unquestionably strong’ benchmark and well ahead of the 2020 implementation date.

ANZ Basel III Pillar 3 Disclosure March 2018
4
1.19%1.13%
1.05%
0.81% 0.79% 0.75%
Mar 17 Sep 17 Mar 18
Provision Ratios (Provisions / Credit RWA)
Total Provision Balance / CRWA
Collective Provision Balance / CRWA
336.8 3.5 3.1
(0.6)
342.8
Sep 17 Growth FX Impact Other Mar 18
Movements in Credit Risk Weighted Assets ($bn)
52%
12%
26%
62%
85%
25%
91%
Corporate Bank & Sovereign ResidentialMortgage
QRR & OtherRetail
SpecialisedLending
Other Standardised
Average Risk Weights (CRWA / EAD*)
Mar 17
Sep 17
Mar 18
Credit Risk Weighted Assets (CRWA) increased by $6.0bn • Volume growth driven by Institutional as well as Australia home loans, partly offset by divestments of Asia Retail and Wealth businesses in Vietnam, Taiwan and Indonesia. • FX movements increased CRWA by $3.1bn, mainly driven by depreciation of AUD against US and NZ currencies.
Provision coverage remains sound • The total provision ratio decreased by 8bps HoH to 1.05%. Collective Provision ratio decreased by 4bps to 0.75% and continues to provide adequate coverage.
*Exposure at Default is post Credit Risk Mitigation (CRM) and does not include Securitisation, Equities or Other Assets.
ANZ Basel III Pillar 3 Disclosure March 2018
5
Chapter 2 - Introduction
Purpose of this document This document has been prepared in accordance with the Australian Prudential Regulation Authority (APRA) ADI Prudential Standard (APS) 330: Public Disclosure. APS 330 mandates the release to the investment community and general public of information relating to capital adequacy and risk management practices. APS 330 was established to implement Pillar 3 of the Basel Committee on Banking Supervision’s framework for bank capital adequacy2. In simple terms, the Basel framework consists of three mutually reinforcing ‘Pillars’:
Pillar 1 Minimum capital requirement
Pillar 2 Supervisory review process
Pillar 3 Market discipline
Minimum capital requirements for Credit Risk, Operational Risk, Market Risk and Interest Rate Risk in the Banking Book
Firm-wide risk oversight, Internal Capital Adequacy Assessment Process (ICAAP), consideration of additional risks, capital buffers and targets and risk concentrations, etc.
Regular disclosure to the market of qualitative and quantitative aspects of risk management, capital adequacy and underlying risk metrics
APS 330 requires the publication of various levels of information on a quarterly, semi-annual and annual basis. This document is the semi-annual disclosure. Basel in ANZ In December 2007, ANZ received accreditation for the most advanced approaches permitted under Basel for credit risk and operational risk, complementing its accreditation for market risk. Effective January 2013, ANZ adopted APRA requirements for Basel III with respect to the measurement and monitoring of regulatory capital. Verification of disclosures These Pillar 3 disclosures have been verified in accordance with Board approved policy, including ensuring consistency with information contained in ANZ’s Financial Report and in Pillar 1 returns provided to APRA. In addition ANZ’s external auditor has performed agreed procedures with respect to these disclosures. Comparison to ANZ’s Financial Reporting These disclosures have been produced in accordance with regulatory capital adequacy concepts and rules, rather than in accordance with accounting policies adopted in ANZ’s financial reports. As such, there are different areas of focus and measures in some common areas of disclosures. These differences are most pronounced in the credit risk disclosures, for instance: The principal method for measuring the amount at risk is Exposure at Default (EAD), which is the estimated
amount of exposure likely to be owed on a credit obligation at the time of default. Under the Advanced Internal Ratings Based (AIRB) approach in APS 113 Capital Adequacy: Internal Ratings-based Approach to Credit Risk, banks are accredited to provide their own estimates of EAD for all exposures (drawn, commitments or contingents) reflecting the current balance as well as the likelihood of additional drawings prior to default.
Loss Given Default (LGD) is an estimate of the amount of losses expected in the event of default. LGD is essentially calculated as the amount at risk (EAD) less expected net recoveries from realisation of collateral as well as any post default repayments of principal and interest.
Most credit risk disclosures split ANZ’s portfolio into regulatory asset classes, which span areas of ANZ’s internal divisional and business unit organisational structure.
Unless otherwise stated, all amounts are rounded to AUD millions.
2 Basel Committee on Banking Supervision, International Convergence of Capital Measurement and Capital Standards: A Revised Framework, 2004.

ANZ Basel III Pillar 3 Disclosure March 2018
6
Chapter 3 – Capital and Capital Adequacy Table 1 Capital Disclosure template The head of the Level 2 Group to which this prudential standard applies is Australia and New Zealand Banking Group Limited. Table 1 of this chapter consists of a Capital Disclosure template that assists users in understanding the differences between the application of the Basel III reforms in Australia and those rules as detailed in the document Basel III: A global regulatory framework for more resilient banks and banking systems, issued by the Bank for International Settlements. The information in the lines of the template have been mapped to ANZ’s Level 2 balance sheet, which adjusts for non-consolidated subsidiaries as required under APS 001: Definitions. Where this information cannot be mapped on a one to one basis, it is provided in an explanatory table. ANZ’s material non-consolidated subsidiaries are also listed in this chapter.
Restrictions on Transfers of Capital within ANZ
ANZ operates branches and locally incorporated subsidiaries in many countries. These operations are capitalised at an appropriate level to cover the risks in the business and to meet local prudential requirements. This level of capitalisation may be enhanced to meet local taxation and operational requirements. Any repatriation of capital from subsidiaries or branches is subject to meeting the requirements of the local prudential regulator and/or the local central bank. Apart from ANZ’s operations in New Zealand, local country capital requirements do not impose any material call on ANZ’s capital base. ANZ undertakes banking activities in New Zealand principally through its wholly owned subsidiary, ANZ Bank New Zealand Limited, which is subject to minimum capital requirements as set by the Reserve Bank of New Zealand (RBNZ). The RBNZ adopted the Basel II framework, effective from 1 January 2008 and Basel III reforms from 1 January 2013 and ANZ Bank New Zealand Limited has been accredited to use the advanced approach for the calculation of credit risk and operational risk. ANZ Bank New Zealand Limited maintains a buffer above the minimum capital base required by the RBNZ. This capital buffer has been calculated via the ICAAP undertaken for ANZ Bank New Zealand Limited, to ensure ANZ Bank New Zealand Limited is appropriately capitalised under stressed economic scenarios.

ANZ Basel III Pillar 3 Disclosure March 2018
7
Table 1 Capital disclosure template
Mar 18 Reconciliation Table
Reference $M
Common Equity Tier 1 Capital: instruments and reserves 1 Directly issued qualifying ordinary shares (and equivalent for mutually-owned entities) capital 28,031 Table A
2 Retained earnings 30,299 Table B
3 Accumulated other comprehensive income (and other reserves) 588 Table C
4 Directly issued capital subject to phase out from CET1 (only applicable to mutually-owned companies) n/a
5 Ordinary share capital issued by subsidiaries and held by third parties (amount allowed in group CET1) 51 Table D
6 Common Equity Tier 1 capital before regulatory adjustments 58,969
Common Equity Tier 1 capital : regulatory adjustments
7 Prudential valuation adjustments -
8 Goodwill (net of related tax liability) 3,638 Table E
9 Other intangibles other than mortgage servicing rights (net of related tax liability) 3,379 Table F
10 Deferred tax assets that rely on future profitability excluding those arising from temporary differences (net of related tax liability) 1 Table J
11 Cash-flow hedge reserve 117
12 Shortfall of provisions to expected losses 686 Table G
13 Securitisation gain on sale (as set out in paragraph 562 of Basel II framework) -
14 Gains and losses due to changes in own credit risk on fair valued liabilities (5)
15 Defined benefit superannuation fund net assets 117 Table H
16 Investments in own shares (if not already netted off paid-in capital on reported balance sheet) -
17 Reciprocal cross-holdings in common equity -
18 Investments in the capital of banking, financial and insurance entities that are outside the scope of regulatory consolidation, net of eligible short positions, where the ADI does not own more than 10% of the issued share capital (amount above 10% threshold)
-
19 Significant investments in the ordinary shares of banking, financial and insurance entities that are outside the scope of regulatory consolidation, net of eligible short positions (amount above 10% threshold)
203 Table I
20 Mortgage service rights (amount above 10% threshold) n/a
21 Deferred tax assets arising from temporary differences (amount above 10% threshold, net of related tax liability) -
22 Amount exceeding the 15% threshold -
23 of which: significant investments in the ordinary shares of financial entities -
24 of which: mortgage servicing rights n/a
25 of which: deferred tax assets arising from temporary differences -
26 National specific regulatory adjustments (sum of rows 26a - 26j) 7,126
26a of which: treasury shares -
26b of which: offset to dividends declared under a dividend reinvestment plan (DRP), to the extent that the dividends are used to purchase new ordinary shares issued by the ADI -
26c of which: deferred fee income (135)
26d of which: equity investments in financial institutions not reported in rows 18, 19 and 23 5,191 Table I
26e of which: deferred tax assets not reported in rows 10, 21 and 25 868 Table J
26f of which: capitalised expenses 1,133 Table K
26g of which: investments in commercial (non-financial) entities that are deducted under APRA prudential requirements 36 Table L
26h of which: covered bonds in excess of asset cover in pools -
26i of which: undercapitalisation of a non-consolidated subsidiary -
26j of which: other national specific regulatory adjustments not reported in rows 26a to 26i 33
27 Regulatory adjustments applied to CET1 due to insufficient Additional Tier 1 and Tier 2 to cover deductions -
28 Total regulatory adjustments to CET1 15,262
29 Common Equity Tier 1 Capital (CET1) 43,707

ANZ Basel III Pillar 3 Disclosure March 2018
8
Mar 18 Reconciliation
Table Reference $M
Additional Tier 1 Capital: instruments
30 Directly issued qualifying Additional Tier 1 instruments 7,515 Table M31 of which: classified as equity under applicable accounting standards - 32 of which: classified as liabilities under applicable accounting standards 7,515 Table M
33 Directly issued capital instruments subject to phase out from Additional Tier 1 -
34 Additional Tier 1 instruments (and CET1 instruments not included in row 5) issued by subsidiaries and held by third parties (amount allowed in group AT1) 309 Table M
35 of which: instruments issued by subsidiaries subject to phase out n/a
36 Additional Tier 1 Capital before regulatory adjustments 7,824
Additional Tier 1 Capital: regulatory adjustments
37 Investments in own Additional Tier 1 instruments -
38 Reciprocal cross-holdings in Additional Tier 1 instruments -
39 Investments in the capital of banking, financial and insurance entities that are outside the scope of regulatory consolidation, net of eligible short positions, where the ADI does not own more than 10% of the issued share capital (amount above 10% threshold)
-
40 Significant investments in the capital of banking, financial and insurance entities that are outside the scope of regulatory consolidation (net of eligible short positions) 405 Table M
41 National specific regulatory adjustments (sum of rows 41a - 41c) 1
41a of which: holdings of capital instruments in group members by other group members on behalf of third parties -
41b of which: investments in the capital of financial institutions that are outside the scope of regulatory consolidations not reported in rows 39 and 40 -
41c of which: other national specific regulatory adjustments not reported in rows 41a and 41b 1 Table M
42 Regulatory adjustments applied to Additional Tier 1 due to insufficient Tier 2 to cover deductions -
43 Total regulatory adjustments to Additional Tier 1 capital 406
44 Additional Tier 1 capital (AT1) 7,418
45 Tier 1 Capital (T1=CET1+AT1) 51,125
Tier 2 Capital: instruments and provisions
46 Directly issued qualifying Tier 2 instruments 6,366
47 Directly issued capital instruments subject to phase out from Tier 2 1,623 Table N
48 Tier 2 instruments (and CET1 and AT1 instruments not included in rows 5 or 34) issued by subsidiaries and held by third parties (amount allowed in group T2) 64
49 of which: instruments issued by subsidiaries subject to phase out -
50 Provisions 123 Table G
51 Tier 2 Capital before regulatory adjustments 8,176
Tier 2 Capital: regulatory adjustments
52 Investments in own Tier 2 instruments 10 Table N
53 Reciprocal cross-holdings in Tier 2 instruments -
54 Investments in the Tier 2 capital of banking, financial and insurance entities that are outside the scope of regulatory consolidation, net of eligible short positions, where the ADI does not own more than 10% of the issued share capital (amount above 10% threshold)
-
55 Significant investments in the Tier 2 capital of banking, financial and insurance entities that are outside the scope of regulatory consolidation, net of eligible short positions 85 Table N
56 National specific regulatory adjustments (sums of rows 56a - 56c) 41
56a of which: holdings of capital instruments in group members by other group members on behalf of third parties -
56b of which: investments in the capital of financial institutions that are outside the scope of regulatory consolidation not reported in rows 54 and 55 41 Table N
56c of which: other national specific regulatory adjustments not reported in rows 56a and 56b -
57 Total regulatory adjustments to Tier 2 capital 136
58 Tier 2 capital (T2) 8,040
59 Total capital (TC=T1+T2) 59,165
60 Total risk-weighted assets based on APRA standards 395,777

ANZ Basel III Pillar 3 Disclosure March 2018
9
Mar 18 Reconciliation
Table Reference $M
Capital ratios and buffers
61 Common Equity Tier 1 (as a percentage of risk-weighted assets) 11.0%
62 Tier 1 (as a percentage of risk-weighted assets) 12.9%
63 Total capital (as a percentage of risk-weighted assets) 14.9%
64 Buffer requirement (minimum CET1 requirement of 4.5% plus capital conservation buffer of 2.5% plus any countercyclical buffer requirements expressed as a percentage of risk-weighted assets) 8.03%
65 of which: capital conservation buffer requirement 3.50%3
66 of which: ADI-specific countercyclical buffer requirements 0.03%
67 of which: G-SIB buffer requirement (not applicable) n/a
68 Common Equity Tier 1 available to meet buffers (as a percentage of risk-weighted assets) 6.5%
National minima (if different from Basel III)
69 National Common Equity Tier 1 minimum ratio (if different from Basel III minimum) n/a
70 National Tier 1 minimum ratio (if different from Basel III minimum) n/a
71 National total capital minimum ratio (if different from Basel III minimum) n/a
Amount below thresholds for deductions (not risk-weighted)
72 Non-significant investments in the capital of other financial entities 128
73 Significant investments in the ordinary shares of financial entities 5,104 Table I
74 Mortgage servicing rights (net of related tax liability) n/a
75 Deferred tax assets arising from temporary differences (net of related tax liability) 868 Table J
Applicable caps on the inclusion of provisions in Tier 2
76 Provisions eligible for inclusion in Tier 2 in respect of exposures subject to standardised approach (prior to application of cap) 123
77 Cap on inclusion of provisions in Tier 2 under standardised approach 314
78 Provisions eligible for inclusion in Tier 2 in respect of exposures subject to internal ratings-based approach (prior to application of cap) -
79 Cap for inclusion of provisions in Tier 2 under internal ratings-based approach 1,906 Capital instruments subject to phase-out arrangements (only application between 1 January 2018 to 1 January 2022)
80 Current cap on CET1 instruments subject to phase out arrangements n/a
81 Amount excluded from CET1 due to cap (excess over cap after redemptions and maturities) n/a
82 Current cap on AT1 instruments subject to phase out arrangements n/a
83 Amount excluded from AT1 instruments due to cap (excess over cap after redemptions and maturities) n/a
84 Current cap on T2 instruments subject to phase out arrangements n/a
85 Amount excluded from T2 due to cap (excess over cap after redemptions and maturities) n/a
Counter Cyclical Capital Buffer
Geographic breakdown of Private Sector Credit Exposures
Hong Kong $M
Sweden $M
Norway $M
Other $M
Total $M
RWA for all private sector credit exposures 4,266 330 456 309,493 314,545 Jurisdictional buffer set by national authorities 1.875% 2.000% 2.000% 0.000% n/a Countercyclical buffer requirement 0.025% 0.002% 0.003% 0.000% 0.030%
3 Includes 1.0% buffer applied by APRA to ADI’s deemed as domestic systemically important.

ANZ Basel III Pillar 3 Disclosure March 2018
10
The following table shows ANZ's consolidated balance sheet and the adjustments required to derive the Level 2 balance sheet. The adjustments remove the external assets and liabilities of the entities deconsolidated for prudential purposes and reinstate any intragroup assets and liabilities, treating them as external to the Level 2 group.
Balance Sheet as in
published financial
statements Adjustments
Balance sheet under
scope of regulatory
consolidation
Template and Reconciliation
Table Reference
Assets ($M) ($M) ($M) Cash 82,071 (75) 81,996 Settlement balances owed to ANZ 5,037 - 5,037 Collateral Paid 10,863 - 10,863 Trading securities 45,058 - 45,058 of which: Financial Institutions capital instruments 10 Table N of which: Investments in the capital of financial institutions Table N
Derivative financial instruments 70,915 - 70,915 Available-for-sale assets 70,239 (561) 69,678 of which: Financial institutions equity instruments 981 Table I
of which: non-significant investment in financial institutions equity instruments 28 Table I
of which: Other entities equity investments 35 Table L Net loans and advances 588,946 (1,351) 587,595 of which: deferred fee income (135) Row 26c of which: collective provision (2,579) Table G of which: individual provisions (1,016) Table G of which: capitalised brokerage 1,044 Table K of which: CET1 margin lending adjustment 33 Row 26j of which: AT1 margin lending adjustment 1 Table M Regulatory deposits 1,229 - 1,229 Assets held for sale 45,278 (42,179) 3,099
of which: Goodwill 134 Table E of which: Significant investment in a financial institution 67 Table I of which: Deferred Tax assets 8 Table I Due from controlled entities - 1,501 1,501
of which: Significant investments in the Tier 2 capital of banking, financial and insurance entities that are outside the scope of regulatory consolidation
85 Table N
Shares in controlled entities - 4,283 4,283 of which: Investment in deconsolidated financial subsidiaries 3,878 Table I
of which: AT1 significant investment in banking, financial and insurance entities that are outside the scope of regulatory consolidation
405 Table M
Investment in associates 2,481 2 2,483 of which: Financial Institutions 2,482 Table I of which: Other Entities 1 Table L Current tax assets 15 - 15 Deferred tax assets 840 8 848 Table J
of which: Deferred tax assets that rely on future profitability 1 Table J
Goodwill and other intangible assets 5,338 (246) 5,092 of which: Goodwill 3,315 Table E of which: Software 1,777 Table F Investments backing policy liabilities - - - Premises and equipment 1,892 3 1,895 Other assets 4,914 (1,008) 3,906 of which: Defined benefit superannuation fund net assets 146
Total Assets 935,116 (39,623) 895,493

ANZ Basel III Pillar 3 Disclosure March 2018
11
Balance
Sheet as in published financial
statements
Adjustments
Balance
sheet under scope of
regulatory consolidation
Template and Reconciliation
Table Reference
Liabilities ($M) ($M) ($M) Settlement balances owed by ANZ 10,577 (1) 10,576 Collateral Received 9,395 - 9,395 Deposits and other borrowings 616,230 4,812 621,042 Derivative financial instruments 70,624 - 70,624 Due to controlled entities - 2,007 2,007 Current tax liabilities 371 (100) 271 Deferred tax liabilities 258 (160) 98 Table J
of which: related to intangible assets 32 Table F of which: related to capitalised expenses 6 Table K of which: related to defined benefit super assets 29 Table H
Liabilities held for sale 44,773 (43,817) 956
Policy liabilities - - - External unit holder liabilities - - - Provisions 1,110 (43) 1,067 Payables and other liabilities 7,442 (786) 6,656 Debt Issuances 97,576 (1,366) 96,210 Subordinated Debt 17,260 9 17,269
of which: Directly issued qualifying Additional Tier 1 instruments 7,403 Table M
of which: Additional Tier 1 Instruments 467 Table M of which: Directly issued capital instruments subject to phase out from Tier 2 2,240 Table N
of which: Directly issued qualifying Tier 2 6,366 Table N
Total Liabilities 875,616 (39,445) 836,171 Net Assets 59,500 (178) 59,322 Balance
Sheet as in published financial
statements Adjustments
Balance sheet under
scope of regulatory
consolidation
Template and Reconciliation
Table Reference
Shareholders’ equity ($M) ($M) ($M)
Ordinary Share Capital 27,933 304 28,237 Table A of which: Share reserve 206 Table A & C Reserves 541 (98) 443 Table C of which: Cash flow hedging reserves 117 Row 11 Retained earnings 30,900 (383) 30,517 Table B Share capital and reserves attributable to shareholders of the Company 59,374 (177) 59,197
Non-controlling interest 126 (1) 125 Table D
Total shareholders’ equity 59,500 (178) 59,322
ANZ Basel III Pillar 3 Disclosure March 2018
12
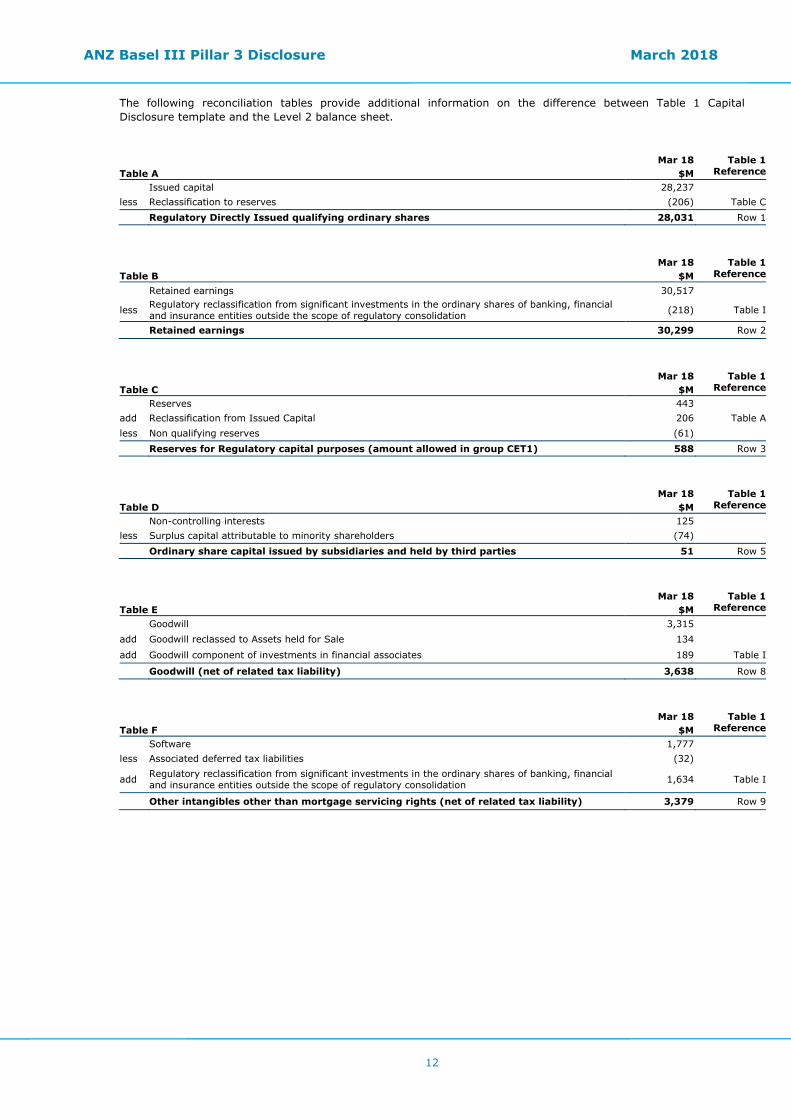
The following reconciliation tables provide additional information on the difference between Table 1 Capital Disclosure template and the Level 2 balance sheet.
Mar 18 Table 1 ReferenceTable A $M
Issued capital 28,237 less Reclassification to reserves (206) Table C Regulatory Directly Issued qualifying ordinary shares 28,031 Row 1
Mar 18 Table 1 ReferenceTable B $M
Retained earnings 30,517
less Regulatory reclassification from significant investments in the ordinary shares of banking, financial and insurance entities outside the scope of regulatory consolidation (218) Table I
Retained earnings 30,299 Row 2
Mar 18 Table 1 ReferenceTable C $M
Reserves 443 add Reclassification from Issued Capital 206 Table Aless Non qualifying reserves (61) Reserves for Regulatory capital purposes (amount allowed in group CET1) 588 Row 3
Mar 18 Table 1 ReferenceTable D $M
Non-controlling interests 125 less Surplus capital attributable to minority shareholders (74) Ordinary share capital issued by subsidiaries and held by third parties 51 Row 5
Mar 18 Table 1 ReferenceTable E $M
Goodwill 3,315 add Goodwill reclassed to Assets held for Sale 134 add Goodwill component of investments in financial associates 189 Table I
Goodwill (net of related tax liability) 3,638 Row 8
Mar 18 Table 1 ReferenceTable F $M
Software 1,777 less Associated deferred tax liabilities (32)
add Regulatory reclassification from significant investments in the ordinary shares of banking, financial and insurance entities outside the scope of regulatory consolidation 1,634 Table I
Other intangibles other than mortgage servicing rights (net of related tax liability) 3,379 Row 9

ANZ Basel III Pillar 3 Disclosure March 2018
13
Mar 18 Table 1 ReferenceTable G $M
Qualifying collective provision
Collective provision (2,579)
less Non-qualifying collective provision 312
less Standardised collective provision 123 Row 50
less Non-defaulted expected loss 2,826
Non-Defaulted: Expected Loss - Eligible Provision Shortfall 682
Qualifying individual provision
Individual provision (1,016)
add Additional individual provisions for partial write offs (301)
less Standardised individual provision 108
add Collective provision on advanced defaulted (290)
less Defaulted expected loss 1,503
Defaulted: Expected Loss - Eligible Provision Shortfall 4
Gross deduction 686 Row 12 Table H
Mar 18 $M
Table 1Reference
Defined benefit superannuation fund net assets 146
less Associated deferred tax liabilities (29)
Defined benefit superannuation fund net assets 117 Row 15
Mar 18 Table 1 ReferenceTable I $M
Investment in deconsolidated financial subsidiaries 3,878
less Regulatory reclassification to Retained Earnings and Other Intangible Assets (1,852) Tables B & F
add Investment in financial associates 2,482
add Investment in financial institutions Available for Sale 981
add Investment in financial institutions Held for Sale 7
less Goodwill component of investments in financial associates (189) Table E
less Amount below 10% threshold of CET 1 (5,104) Row 73
Significant investments in the ordinary shares of banking, financial and insurance entities that are outside the scope of regulatory consolidation, net of eligible short positions (amount above 10% threshold)
203 Row 19
add Amount below the 10% threshold of CET 1 5,104 Row 73
add Investments in the capital of banking, financial and insurance entities that are outside the scope of regulatory consolidation, net of eligible short positions, where the ADI does not own more than 10% of the issued share capital - Held for Sale
60
add Investments in the capital of banking, financial and insurance entities that are outside the scope of regulatory consolidation, net of eligible short positions, where the ADI does not own more than 10% of the issued share capital - Available for Sale exposures
27
Equity investment in financial institutions not reported in rows 18, 19 and 23 5,191 Row 26d
Deduction for equity holdings in financial institutions - APRA regulations 5,394
ANZ Basel III Pillar 3 Disclosure March 2018
14
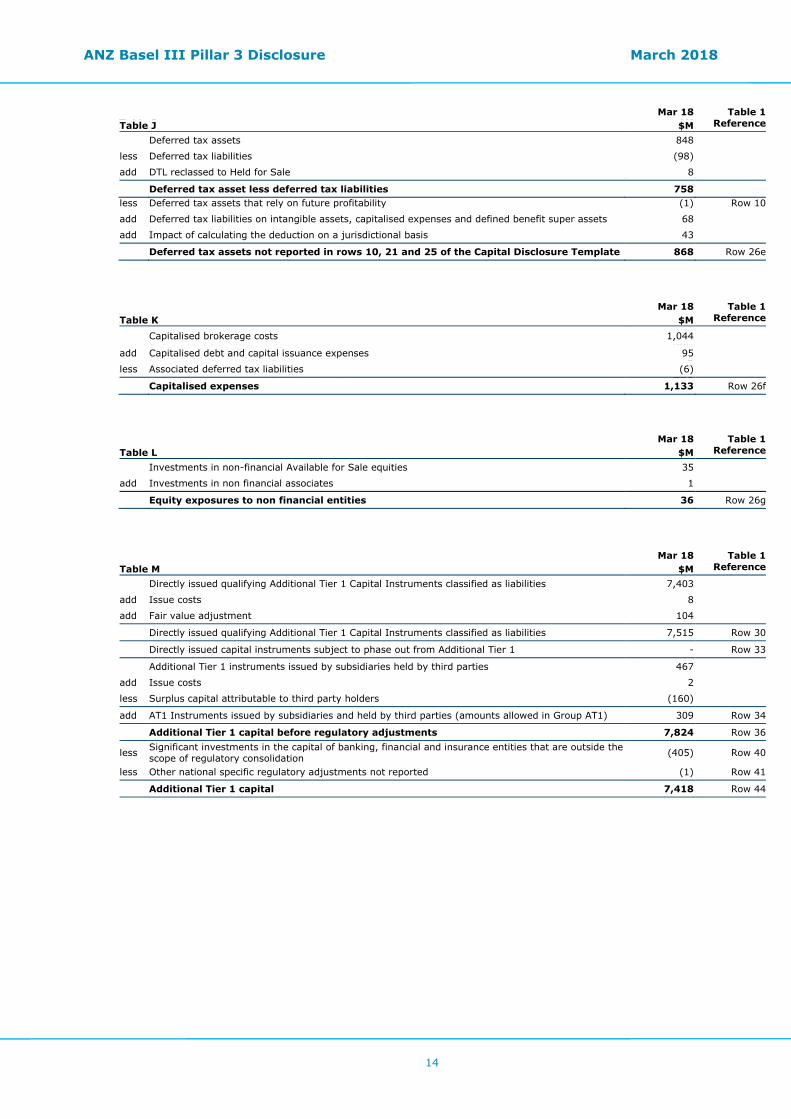
Mar 18 Table 1 ReferenceTable J $M
Deferred tax assets 848 add Deferred tax liabilities (98) DTL reclassed to Held for Sale 9 Deferred tax asset less deferred tax liabilities 759 less Deferred tax assets that rely on future profitability (1) Row 10
add Deferred tax liabilities on intangible assets, capitalised expenses and defined benefit super assets 68
add Impact of calculating the deduction on a jurisdictional basis 43
Deferred tax assets not reported in rows 10, 21 and 25 of the Capital Disclosure Template 868 Row 26e
Mar 18 Table 1 ReferenceTable J $M
Deferred tax assets 848
less Deferred tax liabilities (98)
add DTL reclassed to Held for Sale 8
Deferred tax asset less deferred tax liabilities 758
Mar 18 Table 1 ReferenceTable J $M
Deferred tax assets 848 add Deferred tax liabilities (98) DTL reclassed to Held for Sale 9 Deferred tax asset less deferred tax liabilities 759
Mar 18 Table 1 ReferenceTable K $M
Capitalised brokerage costs 1,044 add Capitalised debt and capital issuance expenses 95
less Associated deferred tax liabilities (6)
Capitalised expenses 1,133 Row 26f
Mar 18 Table 1 ReferenceTable L $M
Investments in non-financial Available for Sale equities 35
add Investments in non financial associates 1
Equity exposures to non financial entities 36 Row 26g
Mar 18 Table 1 ReferenceTable M $M
Directly issued qualifying Additional Tier 1 Capital Instruments classified as liabilities 7,403
add Issue costs 8
add Fair value adjustment 104
Directly issued qualifying Additional Tier 1 Capital Instruments classified as liabilities 7,515 Row 30
Directly issued capital instruments subject to phase out from Additional Tier 1 - Row 33
Additional Tier 1 instruments issued by subsidiaries held by third parties 467
add Issue costs 2
less Surplus capital attributable to third party holders (160)
add AT1 Instruments issued by subsidiaries and held by third parties (amounts allowed in Group AT1) 309 Row 34
Additional Tier 1 capital before regulatory adjustments 7,824 Row 36
less Significant investments in the capital of banking, financial and insurance entities that are outside the scope of regulatory consolidation (405) Row 40
less Other national specific regulatory adjustments not reported (1) Row 41
Additional Tier 1 capital 7,418 Row 44

ANZ Basel III Pillar 3 Disclosure March 2018
15
Mar 18 Table 1 ReferenceTable N $M
Directly issued capital instruments subject to phase out from Tier 2 2,240
add Issue costs 20
less Amortisation of Tier 2 Capital Instruments subject to phase out (723)
add Fair value adjustment 86
less Transition adjustment -
Directly issued capital instruments subject to phase out from Tier 2 1,623 Row 47
less Surplus capital attributable to third party holders 64
add Directly issued qualifying Tier 2 instruments 6,366 Row 46
add Provisions 123 Table G
Tier 2 capital before regulatory adjustments 8,176 Row 51
less Investments in own Tier 2 instruments (trading limit) (10) Row 52
less Significant investments in the Tier 2 capital of banking, financial and insurance entities that are outside the scope of regulatory consolidation, net of eligible short positions (85) Row 55
less Investments in the capital of financial institutions that are outside the scope of regulatory consolidation not reported in rows 54 and 55 (41) Row 56b
Tier 2 capital 8,040 Row 58
ANZ Basel III Pillar 3 Disclosure March 2018
16
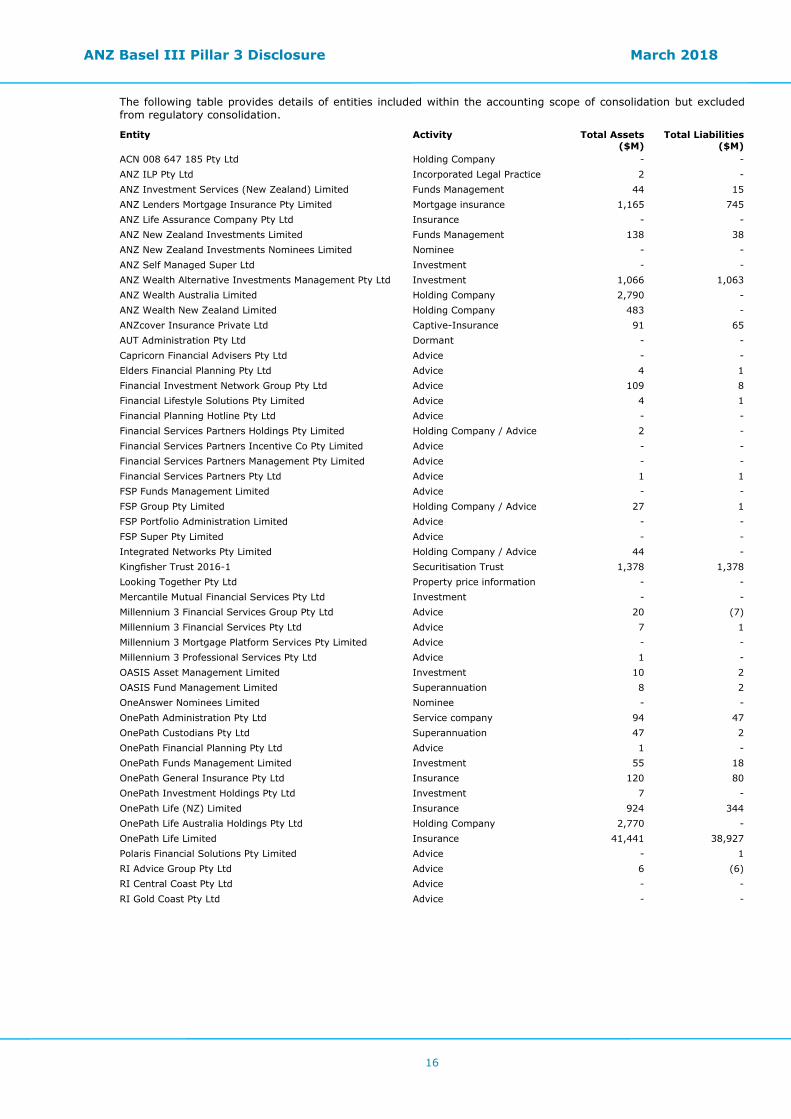
The following table provides details of entities included within the accounting scope of consolidation but excluded from regulatory consolidation.
Entity Activity Total Assets ($M)
Total Liabilities ($M)
ACN 008 647 185 Pty Ltd Holding Company - - ANZ ILP Pty Ltd Incorporated Legal Practice 2 - ANZ Investment Services (New Zealand) Limited Funds Management 44 15 ANZ Lenders Mortgage Insurance Pty Limited Mortgage insurance 1,165 745 ANZ Life Assurance Company Pty Ltd Insurance - - ANZ New Zealand Investments Limited Funds Management 138 38 ANZ New Zealand Investments Nominees Limited Nominee - - ANZ Self Managed Super Ltd Investment - - ANZ Wealth Alternative Investments Management Pty Ltd Investment 1,066 1,063 ANZ Wealth Australia Limited Holding Company 2,790 - ANZ Wealth New Zealand Limited Holding Company 483 - ANZcover Insurance Private Ltd Captive-Insurance 91 65 AUT Administration Pty Ltd Dormant - - Capricorn Financial Advisers Pty Ltd Advice - - Elders Financial Planning Pty Ltd Advice 4 1 Financial Investment Network Group Pty Ltd Advice 109 8 Financial Lifestyle Solutions Pty Limited Advice 4 1 Financial Planning Hotline Pty Ltd Advice - - Financial Services Partners Holdings Pty Limited Holding Company / Advice 2 - Financial Services Partners Incentive Co Pty Limited Advice - - Financial Services Partners Management Pty Limited Advice - - Financial Services Partners Pty Ltd Advice 1 1 FSP Funds Management Limited Advice - - FSP Group Pty Limited Holding Company / Advice 27 1 FSP Portfolio Administration Limited Advice - - FSP Super Pty Limited Advice - - Integrated Networks Pty Limited Holding Company / Advice 44 - Kingfisher Trust 2016-1 Securitisation Trust 1,378 1,378 Looking Together Pty Ltd Property price information - - Mercantile Mutual Financial Services Pty Ltd Investment - - Millennium 3 Financial Services Group Pty Ltd Advice 20 (7) Millennium 3 Financial Services Pty Ltd Advice 7 1 Millennium 3 Mortgage Platform Services Pty Limited Advice - - Millennium 3 Professional Services Pty Ltd Advice 1 - OASIS Asset Management Limited Investment 10 2 OASIS Fund Management Limited Superannuation 8 2 OneAnswer Nominees Limited Nominee - - OnePath Administration Pty Ltd Service company 94 47 OnePath Custodians Pty Ltd Superannuation 47 2 OnePath Financial Planning Pty Ltd Advice 1 - OnePath Funds Management Limited Investment 55 18 OnePath General Insurance Pty Ltd Insurance 120 80 OnePath Investment Holdings Pty Ltd Investment 7 - OnePath Life (NZ) Limited Insurance 924 344 OnePath Life Australia Holdings Pty Ltd Holding Company 2,770 - OnePath Life Limited Insurance 41,441 38,927 Polaris Financial Solutions Pty Limited Advice - 1 RI Advice Group Pty Ltd Advice 6 (6) RI Central Coast Pty Ltd Advice - - RI Gold Coast Pty Ltd Advice - -

ANZ Basel III Pillar 3 Disclosure March 2018
17
Entity Activity Total Assets
($M) Total Liabilities
($M) RI Maroochydore Pty Ltd Advice - - RI Newcastle Pty Ltd Advice 1 - RI Parramatta Pty Ltd Advice - - RI Rockhampton & Gladstone Pty Ltd Advice - - RI Townsville Pty Ltd Advice - - Rieas Pty Ltd Advice - - Shout for Good Pty Ltd Digital Fundraising - - Tandem Financial Advice Pty Limited Advice - - Union Investment Company Pty Limited Advice - -

ANZ Basel III Pillar 3 Disclosure March 2018
18
Table 2 Main features of capital instruments As the main feature of ANZ’s capital instruments are updated on an ongoing basis, ANZ has provided this information separately in the Regulatory Disclosures section of its website shareholder.anz.com/pages/regulatory-disclosure.
Table 3 Capital adequacy, Table 4 Credit risk, Table 5 Securitisation The above tables are produced at the quarters ending 30 June and 31 December.

ANZ Basel III Pillar 3 Disclosure March 2018
19
Table 6 Capital adequacy - Capital Ratio and Risk Weighted Assets The following table provides the composition of capital used for regulatory purposes and capital adequacy ratios. Mar 18 Sep 17 Mar 17 Risk weighted assets (RWA) $M $M $M Subject to Advanced Internal Rating Based (IRB) approach
Corporate 123,253 121,915 127,544
Sovereign 6,896 7,555 6,718
Bank 15,129 13,080 14,267
Residential Mortgage 99,560 96,267 86,218
Qualifying Revolving Retail 6,845 7,059 7,513
Other Retail 30,769 31,077 31,004
Credit risk weighted assets subject to Advanced IRB approach 282,452 276,953 273,264
Credit risk Specialised Lending exposures subject to slotting approach4 32,065 31,845 33,896
Subject to Standardised approach Corporate 15,105 13,365 16,264
Residential Mortgage 321 950 2,354
Other Retail 102 2,000 3,131
Credit risk weighted assets subject to Standardised approach 15,528 16,315 21,749 Credit Valuation Adjustment and Qualifying Central Counterparties 7,864 7,269 8,168 Credit risk weighted assets relating to securitisation exposures 1,728 1,083 1,171
Other assets 3,185 3,369 3,561
Total credit risk weighted assets 342,822 336,834 341,809 Market risk weighted assets 6,558 5,363 6,323
Operational risk weighted assets 37,378 37,305 38,576
Interest rate risk in the banking book (IRRBB) risk weighted assets 9,019 11,611 10,332
Total risk weighted assets 395,777 391,113 397,040 Capital ratios (%)5 Level 2 Common Equity Tier 1 capital ratio 8.5% 8.2% n/a11.0% 10.6% 10.1% Level 2 Tier 1 capital ratio 12.9% 12.6% 12.1% Level 2 Total capital ratio 14.9% 14.8% 14.5% Level 1: Extended licensed Common Equity Tier 1 capital ratio 10.9% 10.5% 10.2% Level 1: Extended licensed entity Tier 1 capital ratio 12.9% 12.7% 12.3% Level 1: Extended licensed entity Total capital ratio 15.1% 14.8% 14.8% Other significant Authorised Deposit-taking Institution (ADI) or overseas bank subsidiary: ANZ Bank New Zealand Limited –Common Equity Tier 1 capital ratio 11.0% 10.7% 10.2% ANZ Bank New Zealand Limited - Tier 1 capital ratio 14.4% 14.1% 13.5% ANZ Bank New Zealand Limited - Total capital ratio 14.4% 14.4% 13.8%
4 Specialised Lending exposures subject to slotting approach are those where the main servicing and repayment is from the asset being financed, and includes specified commercial property development/investment lending, project finance and object finance. 5 ANZ Bank New Zealand Limited’s capital ratios have been calculated in accordance with Reserve Bank of New Zealand prudential standards

ANZ Basel III Pillar 3 Disclosure March 2018
20
Credit Risk Weighted Assets (CRWA) Total CRWA increased $6.0 billion (1.8%) from September 2017 to $342.8 billion at March 2018. This was due to a combination of volume growth driven by Institutional as well as Australia home loans and foreign exchange movements, offset by Retail Asia divestments and contraction to SME Lending in Australia and New Zealand. Market Risk, Operational Risk and IRRBB RWA Traded Market Risk RWA increase $1.2billion driven by increased exposure to stressed market conditions. IRRBB RWA decreased $2.6 billion over the half due to a reduction in Repricing and Yield Curve risk. The Operational Risk RWA remained relatively unchanged since September 2017 reflecting minimal change in the ANZ operational risk profile.

ANZ Basel III Pillar 3 Disclosure March 2018
21
Chapter 4 – Credit risk Exposure at Default in Table 7 represents credit exposure net of offsets for credit risk mitigation such as guarantees, credit derivatives, netting and financial collateral. It includes Advanced IRB, Specialised Lending and Standardised exposures, however does not include Securitisation, Equities or Other Assets exposures.
Table 7(b) part (i): Period end and average Exposure at Default 6
6 Average Exposure at Default for half year is calculated as the simple average of the balances at the start and the end of each six month period.
Mar 18
Advanced IRB approach
Risk Weighted
Assets $M
Exposure at Default
$M
Average Exposure
at Default for half year
$M
Individual provision
charge forhalf year
$M
Write-offs for half year
$MCorporate 123,253 237,791 234,083 68 142
Sovereign 6,896 141,282 136,378 - -
Bank 15,129 48,668 46,604 - -
Residential Mortgage 99,560 376,082 371,376 42 24
Qualifying Revolving Retail 6,845 19,331 20,693 92 139
Other Retail 30,769 41,580 41,766 197 287
Total Advanced IRB approach 282,452 864,734 850,900 399 592
Specialised Lending 32,065 37,860 37,533 (4) 4
Standardised approach
Corporate 15,105 16,228 15,342 - 16
Residential Mortgage 321 681 1,565 2 1
Other Retail 102 101 1,045 33 38
Total Standardised approach 15,528 17,010 17,952 35 55
Credit Valuation Adjustment and Qualifying Central Counterparties 7,864 10,591 10,255 - -
Total 337,909 930,195 916,640 430 651
ANZ Basel III Pillar 3 Disclosure March 2018
22
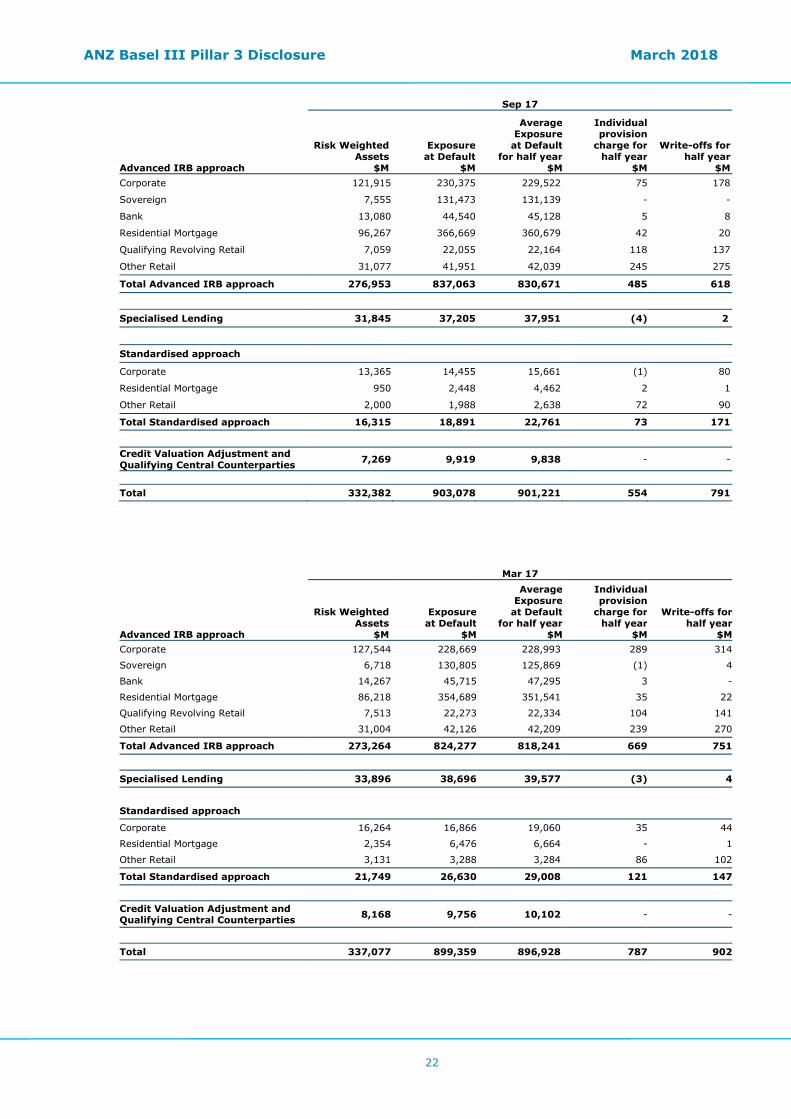
Sep 17
Advanced IRB approach
Risk Weighted Assets
$M
Exposureat Default
$M
Average Exposure
at Defaultfor half year
$M
Individual provision
charge forhalf year
$M
Write-offs for
half year $M
Corporate 121,915 230,375 229,522 75 178
Sovereign 7,555 131,473 131,139 - -
Bank 13,080 44,540 45,128 5 8
Residential Mortgage 96,267 366,669 360,679 42 20
Qualifying Revolving Retail 7,059 22,055 22,164 118 137
Other Retail 31,077 41,951 42,039 245 275
Total Advanced IRB approach 276,953 837,063 830,671 485 618
Specialised Lending 31,845 37,205 37,951 (4) 2
Standardised approach
Corporate 13,365 14,455 15,661 (1) 80
Residential Mortgage 950 2,448 4,462 2 1
Other Retail 2,000 1,988 2,638 72 90
Total Standardised approach 16,315 18,891 22,761 73 171
Credit Valuation Adjustment and Qualifying Central Counterparties 7,269 9,919 9,838 - -
Total 332,382 903,078 901,221 554 791
Mar 17
Advanced IRB approach
Risk Weighted Assets
$M
Exposureat Default
$M
Average Exposure
at Defaultfor half year
$M
Individual provision
charge forhalf year
$M
Write-offs for half year
$MCorporate 127,544 228,669 228,993 289 314
Sovereign 6,718 130,805 125,869 (1) 4
Bank 14,267 45,715 47,295 3 -
Residential Mortgage 86,218 354,689 351,541 35 22
Qualifying Revolving Retail 7,513 22,273 22,334 104 141
Other Retail 31,004 42,126 42,209 239 270
Total Advanced IRB approach 273,264 824,277 818,241 669 751
Specialised Lending 33,896 38,696 39,577 (3) 4
Standardised approach
Corporate 16,264 16,866 19,060 35 44
Residential Mortgage 2,354 6,476 6,664 - 1
Other Retail 3,131 3,288 3,284 86 102
Total Standardised approach 21,749 26,630 29,008 121 147
Credit Valuation Adjustment and Qualifying Central Counterparties 8,168 9,756 10,102 - -
Total 337,077 899,359 896,928 787 902

ANZ Basel III Pillar 3 Disclosure March 2018
23
Table 7(b) part(ii): Exposure at Default by portfolio type 7
Mar 18 Sep 17 Mar 17
Average for half year Mar 18
Portfolio Type $M $M $M $M Cash 37,994 26,123 33,613 32,059
Contingents liabilities, commitments, and other off-balance sheet exposures 152,263 153,775 153,607 153,019
Derivatives 43,357 38,922 40,393 41,139
Settlement Balances 18,524 21,532 18,433 20,028
Investment Securities 69,149 66,802 58,578 67,976
Net Loans, Advances & Acceptances 582,380 568,089 565,027 575,235
Other assets 2,873 2,558 3,411 2,716
Trading Securities 23,655 25,277 26,297 24,466
Total exposures 930,195 903,078 899,359 916,638
7 Average for half year is calculated as the simple average of the balances at the start and the end of each six month period.

ANZ Basel III Pillar 3 Disclosure March 2018
24
Table 7(c): Geographic distribution of Exposure at Default
Mar 18
Australia New Zealand
Asia Pacific,Europe and
Americas TotalPortfolio Type $M $M $M $MCorporate 130,966 46,025 77,028 254,019Sovereign 49,482 12,288 79,512 141,282Bank 22,776 4,702 21,190 48,668Residential Mortgage 297,892 78,190 681 376,763Qualifying Revolving Retail 19,331 - - 19,331Other Retail 29,249 12,331 101 41,681Qualifying Central Counterparties 7,561 1,321 1,709 10,591Specialised Lending 26,633 11,154 73 37,860
Total exposures 583,890 166,011 180,294 930,195
Sep 17
Australia New Zealand
Asia Pacific,Europe and
Americas TotalPortfolio Type $M $M $M $MCorporate 126,446 45,605 72,779 244,830Sovereign 47,632 11,306 72,535 131,473Bank 19,697 4,620 20,223 44,540Residential Mortgage 291,868 74,801 2,448 369,117Qualifying Revolving Retail 22,055 - - 22,055Other Retail 30,140 11,811 1,988 43,939Qualifying Central Counterparties 6,790 1,346 1,783 9,919Specialised Lending 26,331 10,749 125 37,205
Total exposures 570,959 160,238 171,881 903,078
Mar 17
Australia New Zealand
Asia Pacific,Europe and
Americas TotalPortfolio Type $M $M $M $MCorporate 122,728 45,911 76,896 245,535Sovereign 47,939 8,230 74,636 130,805Bank 20,686 4,430 20,599 45,715Residential Mortgage 281,972 72,717 6,476 361,165Qualifying Revolving Retail 22,273 - - 22,273Other Retail 30,459 11,687 3,268 45,414Qualifying Central Counterparties 6,479 1,751 1,526 9,756Specialised Lending 27,905 10,676 115 38,696
Total exposures 560,441 155,402 183,516 899,359

ANZ Basel III Pillar 3 Disclosure March 2018
25
Table 7(d): Industry distribution of Exposure at Default 8 9
8 Property Services includes Commercial property operators, Residential property operators, Retirement village operators/developers, Real estate agents, Non-financial asset investors and Machinery and equipment hiring and leasing. 9 Other industry includes Health & Community Services, Education, Communication Services and Personal & Other Services.
Mar 18
Portfolio Type
Agriculture, Forestry, Fishing &
Mining $M
Business Services
$M Construction
$M
Electricity, Gas & Water
Supply$M
Entertainment,Leisure &
Tourism$M
Financial, Investment
& Insurance $M
Governmentand OfficialInstitutions
$MManufacturing
$MPersonal
$M
Property Services
$M
Wholesale Trade
$M Retail Trade
$M
Transport &Storage
$MOther
$M Total
$MCorporate 43,623 9,941 5,678 9,461 13,456 37,230 2,849 37,790 730 19,685 24,776 13,405 16,109 19,286 254,019Sovereign 1,095 ‐ 28 773 ‐ 73,584 62,706 1,048 ‐ 1,420 13 ‐ 344 271 141,282Bank 2 4 1 27 ‐ 48,465 ‐ 13 ‐ ‐ 27 2 127 ‐ 48,668Residential Mortgage ‐ ‐ ‐ ‐ ‐ ‐ ‐ ‐ 376,763 ‐ ‐ ‐ ‐ ‐ 376,763Qualifying Revolving Retail ‐ ‐ ‐ ‐ ‐ ‐ ‐ ‐ 19,331 ‐ ‐ ‐ ‐ ‐ 19,331Other Retail 3,174 2,956 4,100 105 2,318 691 16 1,661 14,453 1,244 1,257 4,177 1,401 4,128 41,681Qualifying Central Counterparties ‐ ‐ ‐ ‐ ‐ 10,591 ‐ ‐ ‐ ‐ ‐ ‐ ‐ ‐ 10,591
Specialised Lending 815 6 375 1,599 67 1 ‐ 1 ‐ 33,561 17 16 955 447 37,860Total exposures 48,709 12,907 10,182 11,965 15,841 170,562 65,571 40,513 411,277 55,910 26,090 17,600 18,936 24,132 930,195% of Total 5.2% 1.4% 1.1% 1.3% 1.7% 18.4% 7.0% 4.4% 44.2% 6.0% 2.8% 1.9% 2.0% 2.6% 100.0%

ANZ Basel III Pillar 3 Disclosure March 2018
26
Sep 17
Portfolio Type
Agriculture, Forestry, Fishing &
Mining $M
Business Services
$MConstruction
$M
Electricity,Gas & Water
Supply$M
Entertainment, Leisure &
Tourism$M
Financial,Investment
& Insurance$M
Governmentand OfficialInstitutions
$MManufacturing
$MPersonal
$M
Property Services
$M
WholesaleTrade
$MRetail Trade
$M
Transport &Storage
$MOther
$MTotal
$MCorporate 41,333 9,746 5,468 9,461 13,109 33,600 3,027 36,912 870 18,919 24,289 13,526 15,177 19,393 244,830Sovereign 1,075 ‐ 29 524 1 65,694 61,576 856 ‐ 1,026 16 ‐ 370 306 131,473Bank 132 49 34 25 4 44,119 ‐ 65 ‐ ‐ 39 ‐ 43 30 44,540Residential Mortgage ‐ ‐ ‐ ‐ ‐ ‐ ‐ ‐ 369,117 ‐ ‐ ‐ ‐ ‐ 369,117Qualifying Revolving Retail ‐ ‐ ‐ ‐ ‐ ‐ ‐ ‐ 22,055 ‐ ‐ ‐ ‐ ‐ 22,055
Other Retail 3,257 2,951 4,135 110 2,376 713 15 1,650 16,511 1,278 1,259 4,288 1,442 3,954 43,939Qualifying Central Counterparties ‐ ‐ ‐ ‐ ‐ 9,919 ‐ ‐ ‐ ‐ ‐ ‐ ‐ ‐ 9,919
Specialised Lending 807 7 181 1,696 232 1 ‐ 1 ‐ 32,824 14 16 708 718 37,205Total exposures 46,604 12,753 9,847 11,816 15,722 154,046 64,618 39,484 408,553 54,047 25,617 17,830 17,740 24,401 903,078 % of Total 5.2% 1.4% 1.1% 1.3% 1.7% 17.1% 7.2% 4.4% 45.1% 6.0% 2.8% 2.0% 2.0% 2.7% 100.0%
Mar 17
Portfolio Type
Agriculture, Forestry, Fishing &
Mining $M
Business Services
$MConstruction
$M
Electricity,Gas & Water
Supply$M
Entertainment, Leisure &
Tourism$M
Financial,Investment
& Insurance$M
Governmentand OfficialInstitutions
$MManufacturing
$MPersonal
$M
Property Services
$M
WholesaleTrade
$MRetail Trade
$M
Transport &Storage
$MOther
$MTotal
$MCorporate 43,336 9,300 5,634 9,778 12,937 26,787 2,890 41,265 1,946 18,950 24,415 13,938 15,895 18,464 245,535Sovereign 1,462 1 32 627 1 74,814 51,855 939 1 413 21 ‐ 405 234 130,805Bank 176 5 35 62 4 45,331 ‐ 19 ‐ ‐ 58 10 1 14 45,715Residential Mortgage ‐ ‐ ‐ ‐ ‐ ‐ ‐ ‐ 361,165 ‐ ‐ ‐ ‐ ‐ 361,165Qualifying Revolving Retail ‐ ‐ ‐ ‐ ‐ ‐ ‐ ‐ 22,273 ‐ ‐ ‐ ‐ ‐ 22,273
Other Retail 3,363 2,879 4,092 106 2,382 710 15 1,629 18,042 1,311 1,246 4,336 1,455 3,848 45,414Qualifying Central Counterparties ‐ ‐ ‐ ‐ ‐ 9,756 ‐ ‐ ‐ ‐ ‐ ‐ ‐ ‐ 9,756
Specialised Lending 927 4 36 1,619 278 1 ‐ 1 ‐ 34,267 14 2 879 668 38,696Total exposures 49,264 12,189 9,829 12,192 15,602 157,399 54,760 43,853 403,427 54,941 25,754 18,286 18,635 23,228 899,359% of Total 5.5% 1.4% 1.1% 1.4% 1.7% 17.4% 6.1% 4.9% 44.8% 6.1% 2.9% 2.0% 2.1% 2.6% 100.0%

ANZ Basel III Pillar 3 Disclosure March 2018
27
Table 7(e): Residual contractual maturity of Exposure at Default10 Mar 18
Portfolio Type < 12 mths
$M 1 - 5 years
$M> 5 years
$M
No Maturity Specified
$MTotal
$MCorporate 112,769 125,869 15,231 150 254,019Sovereign 79,422 36,023 25,837 - 141,282Bank 33,167 15,078 423 - 48,668Residential Mortgage 311 1,100 345,272 30,080 376,763Qualifying Revolving Retail - - - 19,331 19,331Other Retail 14,537 7,645 19,499 - 41,681Qualifying Central Counterparties 3,372 4,053 2,824 342 10,591Specialised Lending 16,825 19,695 1,290 50 37,860
Total exposures 260,403 209,463 410,376 49,953 930,195 Sep 17
Portfolio Type < 12 mths
$M 1 - 5 years
$M> 5 years
$M
No Maturity Specified
$MTotal
$MCorporate 109,154 120,769 14,746 161 244,830Sovereign 66,591 40,319 24,563 - 131,473Bank 30,068 14,159 313 - 44,540Residential Mortgage 345 2,533 335,664 30,575 369,117Qualifying Revolving Retail - - - 22,055 22,055Other Retail 15,462 8,289 19,758 430 43,939Qualifying Central Counterparties 3,103 3,771 2,704 341 9,919Specialised Lending 16,160 19,985 1,010 50 37,205
Total exposures 240,883 209,825 398,758 53,612 903,078 Mar 17
Portfolio Type < 12 mths
$M 1 - 5 years
$M> 5 years
$M
No Maturity Specified
$MTotal
$MCorporate 101,298 129,007 15,063 167 245,535Sovereign 70,734 30,109 29,962 - 130,805Bank 30,075 15,295 345 - 45,715Residential Mortgage 337 6,355 323,327 31,146 361,165Qualifying Revolving Retail - - - 22,273 22,273Other Retail 16,332 8,423 20,055 604 45,414Qualifying Central Counterparties 3,202 3,654 2,552 348 9,756Specialised Lending 15,353 22,100 1,192 51 38,696
Total exposures 237,331 214,943 392,496 54,589 899,359
10 No Maturity Specified predominately includes credit cards and residential mortgage equity manager accounts.

ANZ Basel III Pillar 3 Disclosure March 2018
28
Table 7(f) part (i): Impaired assets11 12, Past due loans13, Provisions and Write-offs by Industry sector
Mar 18
Industry Sector
Impaired derivative
s
$M
Impaired loans/
facilities $M
Past due loans ≥ 90
days $M
Individual provision
balance $M
Individual provision
charge for half year
$M
Write-offs for half
year $M
Agriculture, Forestry, Fishing & Mining - 459 92 169 (5) 39
Business Services - 81 40 32 17 18
Construction - 157 64 73 16 69
Electricity, gas and water supply - 1 1 1 - 1
Entertainment Leisure & Tourism - 127 55 45 17 29
Financial, Investment & Insurance - 103 14 68 58 5
Government & Official Institutions - - - - - -
Manufacturing - 193 23 130 18 22
Personal - 641 2,351 298 263 353
Property Services - 60 38 28 3 5
Retail Trade - 145 72 67 35 30
Transport & Storage - 73 20 22 (13) 10
Wholesale Trade - 86 20 46 4 19
Other - 81 75 37 17 51
Total - 2,207 2,865 1,016 430 651
11 Impaired derivatives are net of credit value adjustment (CVA) of $36 million, being a market value based assessment of the credit risk of the relevant counterparties (September 2017: $42 million; March 2017: $55 million). 12 Impaired loans / facilities include restructured items of $76 million for customer facilities in which the original contractual terms have been modified for reasons related to the financial difficulties of the customer. Restructuring may consist of reduction of interest, principal or other payments legally due, or an extension in maturity materially beyond those typically offered to new facilities with similar risk (September 2017: $167 million; March 2017: $367 million). 13 For regulatory reporting not well secured portfolio managed retail exposures have been reclassified from past due loans > 90 days to impaired loans / facilities.

ANZ Basel III Pillar 3 Disclosure March 2018
29
Sep 17
Industry Sector
Impaired derivatives
$M
Impairedloans/
facilities$M
Past dueloans ≥90
days$M
Individualprovision
balance$M
Individualprovision
charge forhalf year
$M
Write-offsfor half year
$MAgriculture, Forestry, Fishing & Mining - 545 110 203 (14) 62
Business Services - 109 31 31 (7) 15
Construction - 225 71 125 48 16
Electricity, gas and water supply - 2 2 1 1 1
Entertainment Leisure & Tourism - 144 45 59 16 33
Financial, Investment & Insurance - 29 30 14 6 10
Government & Official Institutions - - - - - -
Manufacturing - 219 26 137 36 93
Personal - 745 2,177 307 369 421
Property Services - 50 39 28 (14) 14
Retail Trade - 129 90 62 25 19
Transport & Storage - 144 25 33 8 10
Wholesale Trade - 121 28 65 48 55
Other - 119 82 71 32 42
Total - 2,581 2,756 1,136 554 791 Mar 17
Industry Sector
Impaired derivatives
$M
Impairedloans/
facilities$M
Past dueloans ≥90
days$M
Individualprovision
balance$M
Individualprovision
charge forhalf year
$M
Write-offsfor half year
$MAgriculture, Forestry, Fishing & Mining - 867 150 265 19 25
Business Services - 85 31 51 16 17
Construction - 173 62 96 21 22
Electricity, gas and water supply - 2 1 2 - -
Entertainment Leisure & Tourism - 120 45 58 26 27
Financial, Investment & Insurance 1 40 19 16 7 6
Government & Official Institutions - - - - - 4
Manufacturing 5 347 30 201 12 82
Personal - 839 1,961 276 358 435
Property Services - 90 57 42 - 10
Retail Trade 1 115 77 59 20 36
Transport & Storage - 167 24 39 30 12
Wholesale Trade 3 129 20 71 211 209
Other - 158 92 93 67 17
Total 10 3,132 2,569 1,269 787 902

ANZ Basel III Pillar 3 Disclosure March 2018
30
Table 7(f) part (ii): Impaired asset, Past due loans, Provisions and Write-offs
Mar 18
Impaired derivatives
$M
Impaired loans/
facilities $M
Past due loans ≥ 90 days
$M
Individual provision
balance $M
Individual provision
charge for half year
$M
Write-offs for
half year $M
Portfolios subject to Advanced IRB approach
Corporate - 997 140 456 68 142
Sovereign - - - 3 - -
Bank - - - - - -
Residential Mortgage - 272 2,333 144 42 24
Qualifying Revolving Retail - 88 - 5 92 139
Other Retail - 545 336 260 197 287
Total Advanced IRB approach - 1,902 2,809 868 399 592
Specialised Lending - 28 17 9 (4) 4
Portfolios subject to Standardised approach
Corporate - 237 23 127 - 16
Residential Mortgage - 25 12 10 2 1
Other Retail - 15 4 2 33 38
Total Standardised approach - 277 39 139 35 55
Qualifying Central Counterparties
Total - 2,207 2,865 1,016 430 651
Sep 17
Impaired derivatives
$M
Impaired loans/
facilities $M
Past due loans
≥90 days $M
Individual provision
balance $M
Individual provision
charge for half year
$M
Write-offs for
half year $M
Portfolios subject to Advanced IRB approach
Corporate - 1,193 175 520 75 178
Sovereign - - - 3 - -
Bank - - 10 - 5 8
Residential Mortgage - 259 2,166 126 42 20
Qualifying Revolving Retail - 99 - 18 118 137
Other Retail - 586 325 299 245 275
Total Advanced IRB approach - 2,137 2,676 966 485 618
Specialised Lending - 25 21 17 (4) 2
Portfolios subject to Standardised approach Corporate - 273 34 140 (1) 80
Residential Mortgage - 25 19 10 2 1
Other Retail - 121 6 3 72 90
Total Standardised approach - 419 59 153 73 171
Qualifying Central Counterparties - - - - - -
Total - 2,581 2,756 1,136 554 791

ANZ Basel III Pillar 3 Disclosure March 2018
31
Mar 17
Impaired derivatives
$M
Impaired loans/
facilities $M
Past due loans
≥90 days $M
Individual provision
balance $M
Individual provision
charge for half year
$M
Write-offs for
half year $M
Portfolios subject to Advanced IRB approach
Corporate 1 1,569 207 614 289 314
Sovereign - - - 3 (1) 4
Bank - 13 11 3 3 -
Residential Mortgage - 231 1,962 104 35 22
Qualifying Revolving Retail - 88 - - 104 141
Other Retail - 552 291 289 239 270
Total Advanced IRB approach 1 2,453 2,471 1,013 669 751
Specialised Lending - 39 30 19 (3) 4
Portfolios subject to Standardised approach Corporate 9 382 42 222 35 44
Residential Mortgage - 31 18 9 - 1
Other Retail - 227 8 6 86 102
Total Standardised approach 9 640 68 237 121 147
Qualifying Central Counterparties - - - - - -
Total 10 3,132 2,569 1,269 787 902

ANZ Basel III Pillar 3 Disclosure March 2018
32
Table 7(g): Impaired assets14 15, Past due loans16and Provisions17 by Geography
Mar 18
Geographic region
Impaired derivatives
$M
Impaired loans/
facilities $M
Past due loans
≥ 90 days $M
Individual provision
balance $M
Collective provision
balance $M
Australia - 1,510 2,647 668 1,822
New Zealand - 361 178 165 393
Asia Pacific, Europe and America - 336 40 183 364
Total - 2,207 2,865 1,016 2,579 4fii 0 0 0 0 0 RA Sep 17
Geographic region
Impaired derivatives
$M
Impaired loans/
facilities $M
Past due loans
≥ 90 days $M
Individual provision
balance $M
Collective provision
balance $M
Australia - 1,723 2,519 791 1,810
New Zealand - 359 168 141 398
Asia Pacific, Europe and America - 499 69 204 454
Total - 2,581 2,756 1,136 2,662 4fii 0 0 0 0 0 RA Mar 17
Geographic region
Impaired derivatives
$M
Impaired loans/
facilities $M
Past due loans
≥ 90 days $M
Individual provision
balance $M
Collective provision
balance $M
Australia 1 1,705 2,347 777 1,830
New Zealand 1 488 144 158 411
Asia Pacific, Europe and America 8 939 78 334 544
Total 10 3,132 2,569 1,269 2,785
14 Impaired derivatives are net of credit value adjustment (CVA) of $36 million, being a market value based assessment of the credit risk of the relevant counterparties (September 2017: $42 million; March 2017: $55 million). 15 Impaired loans / facilities include restructured items of $76 million for customer facilities in which the original contractual terms have been modified for reasons related to the financial difficulties of the customer. Restructuring may consist of reduction of interest, principal or other payments legally due, or an extension in maturity materially beyond those typically offered to new facilities with similar risk (September 2017: $167 million; March 2017: $367 million). 16 For regulatory reporting not well secured portfolio managed retail exposures have been reclassified from past due loans > 90 days to impaired loans / facilities. 17 Due to definitional differences, there is a variation in the split between ANZ’s Individual Provision and Collective Provision for accounting purposes and the Specific Provision and General Reserve for Credit Losses (GRCL) for regulatory purposes. This does not impact total provisions, and essentially relates to the classification of collectively assessed provisions on defaulted accounts. The disclosures in this document are based on Individual Provision and Collective Provision, for ease of comparison with other published results.

ANZ Basel III Pillar 3 Disclosure March 2018
33
Table 7(h): Provision for Credit Impairment
Half year Mar 18
Half year Sep 17
Half year Mar 17
Collective Provision $M $M $M Balance at start of period 2,662 2,785 2,876
Charge/(release) to income statement (22) (75) (67)
Adjustments for exchange rate fluctuations 18 (9) (24)
Asia Retail and Wealth divestment (79) (39) -
Total Collective Provision 2,579 2,662 2,785
Individual Provision
Balance at start of period 1,136 1,269 1,307
New and increased provisions 728 948 1,121
Write-backs (191) (280) (221)
Adjustment for exchange rate fluctuations 5 (2) (12)
Discount unwind (7) (8) (24)
Bad debts written off (651) (791) (902)
Asia Retail and Wealth divestment (4) - -
Total Individual Provision 1,016 1,136 1,269
Total Provisions for Credit Impairment 3,595 3,798 4,054
Table 7(j): Specific Provision Balance and General Reserve for Credit Losses18
Mar 18
Specific Provision Balance
$M
General Reserve for Credit Losses
$M Total
$M Collective Provision 312 2,267 2,579
Individual Provision 1,016 - 1,016
Total Provision for Credit Impairment 1,328 2,267 3,595 Sep 17
Specific Provision Balance
$M
General Reserve for Credit Losses
$M Total
$M Collective Provision 352 2,310 2,662
Individual Provision 1,136 - 1,136
Total Provision for Credit Impairment 1,488 2,310 3,798 Mar 17
Specific Provision Balance
$M
General Reserve for Credit Losses
$M Total
$M Collective Provision 350 2,435 2,785
Individual Provision 1,269 - 1,269
Total Provision for Credit Impairment 1,619 2,435 4,054
18 Due to definitional differences, there is a variation in the split between ANZ’s Individual Provision and Collective Provision for accounting purposes and the Specific Provision and General Reserve for Credit Losses (GRCL) for regulatory purposes. This does not impact total provisions, and essentially relates to the classification of collectively assessed provisions on defaulted accounts. The disclosures in this document are based on Individual Provision and Collective Provision, for ease of comparison with other published results.

ANZ Basel III Pillar 3 Disclosure March 2018
34
Table 8 Credit risk – Disclosures for portfolios subject to the Standardised approach and supervisory risk weights in the IRB approach
Table 8(b): Exposure at Default by risk bucket19 Risk weight Mar 18 Sep 17 Mar 17 Standardised approach exposures $M $M $M 0% - - -
20% 255 308 219
35% 344 2,030 6,061
50% 2,462 2,336 1,927
75% - 5 6
100% 13,643 14,000 18,118
150% 303 215 300
>150% 3 4 4
Capital deductions - - -
Total 17,010 18,898 26,635
Other Asset exposures
0% - - -
20% 907 947 954
35% - - -
50% - - -
75% - - -
100% 3,004 3,179 3,370
150% - - -
>150% - - -
Capital deductions - - -
Total 3,911 4,126 4,324
Specialised Lending exposures
0% 99 120 122
70% 15,983 13,935 13,211
90% 19,164 19,659 21,383
115% 2,153 3,207 3,367
250% 461 284 613
Total 37,860 37,205 38,696
19 Table 8(b) shows exposure at default post credit risk mitigation in each risk category.

ANZ Basel III Pillar 3 Disclosure March 2018
35
Table 9 Credit risk – Disclosures for portfolios subject to Advanced IRB approaches
Portfolios subject to the Advanced IRB (AIRB) approach The following table summarises the types of borrowers and the rating approach adopted within each of ANZ’s AIRB portfolios: IRB Asset Class Borrower Type Rating Approach Corporate Corporations, partnerships or proprietorships that do
not fit into any other asset class AIRB
Sovereign Central governments Central banks Certain multilateral development banks
AIRB
Bank Banks20 In Australia only, other authorised deposit taking institutions (ADI) incorporated in Australia
AIRB
Residential mortgages
Exposures secured by residential property AIRB
Qualifying revolving retail
Consumer credit cards <$100,000 limit AIRB
Other retail Small business lending Other lending to consumers
AIRB
Specialised Lending Income Producing Real Estate21 Project finance Object finance
AIRB – Supervisory Slotting22
Other assets All other assets not falling into the above classes e.g. margin lending, fixed assets
AIRB – fixed risk weights
In addition, ANZ has applied the Standardised approach to some portfolio segments (mainly retail and local corporates in Asia Pacific) where currently available data does not enable development of advanced internal models for PD, LGD and EAD estimates. Under the Standardised approach, exposures are mapped to several regulatory risk weights, mainly based on the type of counterparty and its external rating. For these counterparties, external ratings by Standard & Poor’s and Moody’s Investors Service are used as inputs into the RWA calculation. As described in the section on the ANZ rating system, ANZ has mapped its master scale to the grading of these two External Credit Assessment Institutions (ECAIs). ANZ applies its full normal risk measurement and management framework to these segments for internal management purposes, such as for economic capital. Standardised segments will be migrated to AIRB if they reach a volume that generates sufficient data for development of advanced internal models. ANZ has not applied the Foundation IRB approach to any portfolios.
The ANZ rating system As an AIRB bank, ANZ’s internal models generate the inputs into regulatory capital adequacy to determine the risk weighted exposure calculations for both on and off-balance sheet exposures, including undrawn portions of credit facilities, committed and contingent exposures and EL calculations. ANZ’s internal models are used to generate the three key risk components that serve as inputs to the IRB approach to credit risk:
PD is an estimate of the level of the risk of borrower default. Borrower ratings are derived by way of rating models used both at loan origination and for ongoing monitoring.
EAD is defined as the expected facility exposure at the date of default.
20 The IRB asset classification of investment banks is Corporate, rather than Bank. 21 Since 2009, APRA has agreed that some large, well-diversified commercial property exposures may be treated as corporate exposures, in line with the original Basel Committee’s definition of Specialised Lending. 22 ANZ uses an internal assessment which is mapped to the appropriate Supervisory Slot.

ANZ Basel III Pillar 3 Disclosure March 2018
36
LGD is an estimate of the potential economic loss on a credit exposure, incurred as a consequence of obligor default and expressed as a percentage of the facility’s EAD. When measuring economic loss, all relevant factors are taken into account, including material effects of the timing of cash flows and material direct and indirect costs associated with collecting on the exposure, including realisation of collateral.
Effective maturity is also calculated as an input to the risk weighted exposure calculation for bank, sovereign and corporate IRB asset classes. ANZ’s rating system has two separate and distinct dimensions that:
Measure the PD, which is expressed by the Customer Credit Rating (CCR), reflecting the ability to service and repay debt.
Measure the LGD as expressed by the Security Indicator (SI) ranging from A to G. The SI is calculated by reference to the percentage of loan covered by security which can be realised in the event of default. This calculation uses standard ratios to adjust the current market value of collateral items to allow for historical realisation outcomes. The security-related SIs are supplemented with a range of other SIs which cover such factors as cash cover, mezzanine finance, intra-group guarantees and sovereign backing as ANZ’s LGD research indicates that these transaction characteristics have different recovery outcomes. ANZ’s LGD also includes recognition of the different legal and insolvency regimes in different countries, where this has been shown to influence recovery outcomes.
ANZ’s corporate PD master scale is APRA approved, and is made up of 27 rating grades. Each level/grade is separately defined and has a range of default probabilities attached to it. The PD master scale enables ANZ’s rating system to be mapped to the gradings of external rating agencies, using the PD as a common element after ensuring that default definitions and other key attributes are aligned. The following table demonstrates this alignment (for one year PDs):
ANZ CCR Moody’s Standard & Poor’s PD Range
0+ to 1- Aaa to Aa3 AAA to < AA- 0.0000 - 0.0346% 2+ to 3+ A1 to Baa1 A+ to BBB+ 0.0347 - 0.1636% 3= to 4+ Baa2 to > Baa3 BBB to > BB+ 0.1637 - 0.4004% 4= to 6= Ba1 to B1 BB+ to B+ 0.4005 – 2.7550% 6- to 7= B2 to B3 B to B- 2.7551 – 9.7980% 7- to 8+ Caa to Caa3 CCC+ to CCC- 9.7981 – 27.1109% 8= Ca, C CC, C 27.1110 – 99.9999% 8-, 9 and 10 Default Default 100%
In the retail asset classes, most facilities utilise credit rating scores. The scores are calibrated to PDs, and used to allocate exposures to homogenous pools, along with LGD and EAD. ANZ also uses specialised PD master scale/mappings for the sovereign asset class, based predominantly on the corporate master scale.

ANZ Basel III Pillar 3 Disclosure March 2018
37
Table 9(d): Non Retail Exposure at Default subject to Advanced Internal Ratings Based (IRB) approach23 24 25
Mar 18
AAA < A+
$M
A+ < BBB
$M
BBB< BB+
$M
BB+ < B+
$M
B+ < CCC
$MCCC $M
Default$M
Total$M
Exposure at Default Corporate 19,419 62,744 78,496 58,649 14,245 2,409 1,829 237,791Sovereign 120,077 16,108 1,760 1,001 2,323 13 - 141,282Bank 17,342 25,651 3,928 1,668 71 8 - 48,668Total 156,838 104,503 84,184 61,318 16,639 2,430 1,829 427,741% of Total 36.7% 24.4% 19.7% 14.3% 3.9% 0.6% 0.4% 100.0% Undrawn commitments (included in above) Corporate 5,731 24,602 23,306 9,165 1,506 275 44 64,629Sovereign 862 70 8 51 3 - - 994Bank 139 506 1 - 2 - - 648Total 6,732 25,178 23,315 9,216 1,511 275 44 66,271
Average Exposure at Default Corporate 6.812 7.567 1.628 0.666 0.124 0.237 0.671 0.865Sovereign 158.412 413.028 34.493 8.558 27.334 6.747 - 134.298Bank 7.791 5.489 8.908 6.391 1.019 0.185 - 6.311
Exposure-weighted average Loss Given Default (%) Corporate 54.7% 55.8% 46.6% 37.6% 34.3% 41.0% 47.5% 46.7%Sovereign 5.4% 12.6% 38.9% 49.3% 51.1% 60.0% - 7.7%Bank 63.4% 62.4% 66.3% 67.6% 72.3% 55.6% - 63.3%
Exposure-weighted average risk weight (%) Corporate 18.2% 32.2% 52.0% 64.2% 88.2% 196.9% 118.1% 51.2%Sovereign 1.1% 3.4% 44.4% 105.2% 138.3% 267.3% - 4.9%Bank 20.7% 26.5% 68.5% 113.4% 197.3% 309.6% - 31.1%
23 In accordance with APS 330, EAD in Table 9(d) includes Advanced IRB exposures; however does not include Specialised Lending, Standardised, Securitisation, Equities or Other Assets exposures. Specialised Lending is excluded from Table 9(d) as it follows the Supervisory Slotting treatment, and a breakdown of risk weightings is provided in Table 8(b). 24 Average EAD is calculated as total EAD post risk mitigants divided by the total number of credit risk generating exposures. 25 Exposure-weighted average risk weight (%) is calculated as CRWA divided by EAD.

ANZ Basel III Pillar 3 Disclosure March 2018
38
Sep 17
AAA < A+
$M
A+ < BBB
$M
BBB< BB+
$M
BB+ < B+
$M
B+ < CCC
$MCCC $M
Default$M
Total$M
Exposure at Default Corporate 20,273 59,504 72,916 59,268 14,525 1,856 2,033 230,375Sovereign 107,161 18,177 2,138 1,403 2,573 21 - 131,473Bank 16,773 23,248 3,055 1,371 80 2 11 44,540Total 144,207 100,929 78,109 62,042 17,178 1,879 2,044 406,388% of Total 35.5% 24.8% 19.2% 15.3% 4.2% 0.5% 0.5% 100.0%
Undrawn commitments (included in above)
Corporate 6,621 23,372 22,802 10,088 1,448 144 52 64,527Sovereign 553 85 6 56 - - - 700Bank 15 144 23 - 1 - - 183Total 7,189 23,601 22,831 10,144 1,449 144 52 65,410
Average Exposure at Default Corporate 8.590 8.114 1.578 0.649 0.126 0.185 0.660 0.836Sovereign 143.456 757.354 37.513 8.451 29.924 3.468 - 121.062Bank 15.416 5.846 6.990 9.523 1.102 0.073 5.195 7.747
Exposure-weighted average Loss Given Default (%) Corporate 55.8% 56.6% 45.7% 39.1% 34.2% 38.0% 46.5% 46.9%Sovereign 5.6% 12.2% 38.9% 50.1% 50.8% 56.3% - 8.4%Bank 63.2% 63.1% 68.8% 68.8% 73.1% 69.5% 29.6% 63.7%
Exposure-weighted average risk weight (%) Corporate 18.1% 32.7% 50.9% 67.5% 85.7% 181.4% 118.1% 51.4%Sovereign 1.2% 3.2% 43.3% 107.3% 124.5% 301.2% - 5.8%Bank 20.1% 26.1% 64.8% 109.3% 190.4% 390.2% 136.2% 29.4% Mar 17
AAA < A+
$M
A+ < BBB
$M
BBB< BB+
$M
BB+ < B+
$M
B+ < CCC
$MCCC $M
Default$M
Total$M
Exposure at Default Corporate 16,574 58,711 74,890 58,623 15,219 1,990 2,662 228,669Sovereign 109,437 16,053 1,930 1,592 1,780 12 1 130,805Bank 18,017 22,119 3,667 1,850 39 4 19 45,715Total 144,028 96,883 80,487 62,065 17,038 2,006 2,682 405,189% of Total 35.5% 23.9% 19.9% 15.3% 4.2% 0.5% 0.7% 100.0% Undrawn commitments (included in above) Corporate 5,505 25,581 21,893 11,167 1,587 179 70 65,982Sovereign 485 420 8 27 - - - 940Bank 88 113 159 1 1 - - 362Total 6,078 26,114 22,060 11,195 1,588 179 70 67,284
Average Exposure at Default Corporate 4.853 3.494 1.446 0.598 0.175 0.264 0.853 0.854Sovereign 143.242 573.322 31.643 7.369 49.434 6.101 0.204 117.525Bank 14.402 2.753 5.943 6.468 0.472 0.169 2.356 4.437
Exposure-weighted average Loss Given Default (%)
Corporate 55.6% 57.2% 46.7% 39.9% 34.7% 40.9% 40.2% 47.4%Sovereign 5.7% 10.8% 40.4% 54.7% 47.3% 57.0% 71.0% 8.0%Bank 63.4% 63.3% 66.0% 67.6% 69.5% 73.1% 34.0% 63.7%
Exposure-weighted average risk weight (%)
Corporate 19.1% 34.3% 52.7% 70.1% 86.6% 200.2% 142.2% 55.8%Sovereign 1.2% 3.0% 44.7% 119.4% 118.1% 356.2% - 5.1%Bank 20.7% 26.4% 68.5% 111.0% 203.3% 387.1% 146.5% 31.2%

ANZ Basel III Pillar 3 Disclosure March 2018
39
Table 9(d): Retail Exposure at Default subject to Advanced Internal Ratings Based (IRB) approach by risk grade
Mar 18
0.00% <0.11%
$M
0.11%<0.30%
$M
0.30%<0.51%
$M
0.51%<3.49%
$M
3.49%<10.09%
$M
10.09%<100.0%
$MDefault
$MTotal
$MExposure at Default Residential Mortgage 70,037 99,897 61,545 129,372 8,360 4,213 2,658 376,082Qualifying Revolving Retail 5,799 4,005 1,590 5,184 1,902 768 83 19,331Other Retail 1,107 5,603 2,440 23,055 6,253 2,149 973 41,580Total 76,943 109,505 65,575 157,611 16,515 7,130 3,714 436,993% of Total 17.6% 25.1% 15.0% 36.1% 3.8% 1.6% 0.8% 100.0% Undrawn commitments (included in above) Residential Mortgage 15,252 7,274 2,678 8,363 37 22 - 33,626Qualifying Revolving Retail 4,250 3,026 1,019 2,304 576 88 1 11,264Other Retail 829 3,569 1,587 3,209 563 81 6 9,844Total 20,331 13,869 5,284 13,876 1,176 191 7 54,734 Average Exposure at Default Residential Mortgage 0.246 0.231 0.251 0.247 0.326 0.325 0.272 0.245Qualifying Revolving Retail 0.009 0.008 0.009 0.011 0.010 0.006 0.009 0.009Other Retail 0.008 0.016 0.013 0.025 0.011 0.011 0.025 0.017 Exposure-weighted average Loss Given Default (%) Residential Mortgage 19.7% 18.5% 19.1% 20.8% 20.3% 20.0% 20.0% 19.7%Qualifying Revolving Retail 75.5% 80.3% 77.4% 81.1% 84.5% 82.8% 83.5% 79.3%Other Retail 55.6% 54.4% 73.7% 45.5% 64.9% 57.7% 48.2% 52.2% Exposure-weighted average risk weight (%) Residential Mortgage 5.9% 11.7% 19.3% 40.1% 94.3% 128.1% 193.7% 26.1%Qualifying Revolving Retail 3.5% 8.1% 16.3% 44.9% 104.8% 201.2% 232.3% 35.4%Other Retail 29.8% 36.7% 55.8% 59.8% 113.1% 174.4% 257.2% 74.0%

ANZ Basel III Pillar 3 Disclosure March 2018
40
Sep 17
0.00% <0.11%
$M
0.11%<0.30%
$M
0.30%<0.51%
$M
0.51%<3.49%
$M
3.49%<10.09%
$M
10.09%<100.0%
$MDefault
$MTotal
$MExposure at Default Residential Mortgage 68,361 96,848 59,982 126,225 8,394 4,381 2,478 366,669Qualifying Revolving Retail - 11,785 2,833 4,825 1,723 724 165 22,055Other Retail 1,066 5,443 2,339 23,182 6,773 2,155 993 41,951Total 69,427 114,076 65,154 154,232 16,890 7,260 3,636 430,675% of Total 16.1% 26.5% 15.1% 35.9% 3.9% 1.7% 0.8% 100.0%
Undrawn commitments (included in above) Residential Mortgage 15,073 7,153 2,655 9,102 37 23 1 34,044Qualifying Revolving Retail - 9,239 2,097 2,194 671 82 36 14,319Other Retail 814 3,466 1,543 3,134 566 86 6 9,615Total 15,887 19,858 6,295 14,430 1,274 191 43 57,978
Average Exposure at Default Residential Mortgage 0.243 0.227 0.245 0.242 0.319 0.315 0.268 0.241Qualifying Revolving Retail - 0.011 0.009 0.010 0.009 0.008 0.009 0.010Other Retail 0.008 0.015 0.011 0.025 0.011 0.010 0.026 0.017
Exposure-weighted average Loss Given Default (%) Residential Mortgage 19.8% 18.6% 19.2% 20.9% 20.4% 20.0% 20.1% 19.8%Qualifying Revolving Retail - 73.2% 73.2% 73.2% 73.2% 73.2% 73.2% 73.2%Other Retail 57.2% 54.7% 74.4% 45.2% 64.0% 58.1% 50.1% 52.2%
Exposure-weighted average risk weight (%) Residential Mortgage 5.9% 11.8% 19.5% 40.2% 94.5% 128.3% 195.5% 26.3%Qualifying Revolving Retail - 5.2% 14.5% 39.8% 116.1% 210.4% 355.4% 32.0%Other Retail 31.3% 36.8% 55.9% 59.5% 111.9% 175.4% 239.5% 74.1%
Mar 17
0.00% <0.11%
$M
0.11%<0.30%
$M
0.30%<0.51%
$M
0.51%<3.49%
$M
3.49%<10.09%
$M
10.09%<100.0%
$MDefault
$MTotal
$MExposure at Default Residential Mortgage 70,265 157,673 36,265 71,041 10,805 6,388 2,252 354,689Qualifying Revolving Retail 11,810 - 2,666 4,753 2,008 861 175 22,273Other Retail 1,188 5,507 2,345 23,099 6,854 2,212 921 42,126
Total 83,263 163,180 41,276 98,893 19,667 9,461 3,348 419,088
% of Total 19.9% 38.9% 9.8% 23.6% 4.7% 2.3% 0.8% 100.0%
Undrawn commitments (included in above) Residential Mortgage 6,940 17,932 1,035 7,097 193 186 1 33,384Qualifying Revolving Retail 9,195 - 1,965 2,193 794 100 34 14,281Other Retail 636 2,225 1,335 2,999 538 79 6 7,818Total 16,771 20,157 4,335 12,289 1,525 365 41 55,483
Average Exposure at Default Residential Mortgage 0.246 0.226 0.217 0.251 0.279 0.282 0.247 0.236Qualifying Revolving Retail 0.011 - 0.009 0.010 0.009 0.008 0.009 0.010Other Retail 0.006 0.012 0.010 0.025 0.010 0.010 0.023 0.016
Exposure-weighted average Loss Given Default (%) Residential Mortgage 19.8% 19.2% 19.0% 21.8% 20.3% 20.0% 20.1% 19.9%Qualifying Revolving Retail 73.2% - 73.2% 73.2% 73.2% 73.2% 73.2% 73.2%Other Retail 57.7% 53.6% 74.2% 45.4% 63.7% 59.4% 50.9% 52.3%
Exposure-weighted average risk weight (%) Residential Mortgage 9.6% 11.7% 19.6% 39.0% 111.7% 147.4% 223.1% 24.3%Qualifying Revolving Retail 5.0% - 13.9% 39.0% 113.1% 207.7% 368.2% 33.7%Other Retail 29.9% 36.4% 55.9% 59.5% 110.6% 177.5% 226.8% 73.6%

ANZ Basel III Pillar 3 Disclosure March 2018
41
Table 9(e): Actual Losses by portfolio type Half year Mar 18
Basel Asset Class
Individual provision charge
$M
Write-offs$M
Corporate 68 142
Sovereign - -
Bank - -
Residential Mortgage 42 24
Qualifying Revolving Retail 92 139
Other Retail 197 287
Total Advanced IRB 399 592
Specialised Lending (4) 4
Standardised approach 35 55
Total 430 651 Half year Sep 17
Basel Asset Class
Individual provision charge
$M
Write-offs$M
Corporate 75 178
Sovereign - -
Bank 5 8
Residential Mortgage 42 20
Qualifying Revolving Retail 118 137
Other Retail 245 275
Total Advanced IRB 485 618
Specialised Lending (4) 2
Standardised approach 73 171
Total 554 791 Half year Mar 17
Basel Asset Class
Individual provision charge
$M
Write-offs$M
Corporate 289 314
Sovereign (1) 4
Bank 3 -
Residential Mortgage 35 22
Qualifying Revolving Retail 104 141
Other Retail 239 270
Total Advanced IRB 669 751
Specialised Lending (3) 4
Standardised approach 121 147
Total 787 902
Factors impacting the loss experience The individual credit impairment charge decreased $124 million (-22%) primarily driven by a $112 million (-25%) decrease in the Australia division from lower new individual provisions and higher write-backs, and a $48 million (-61%) decrease in the Asia Retail & Pacific division following the progressive sale of Asia Retail and Wealth businesses. This is partially offset by an increase of $57 million in the Institutional division due to lower write-backs in the March 2018 half. Write offs decreased $140 million primarily driven by AIRB Corporate, and Standardised reflecting the progressive sale of Asia Retail and Wealth businesses.
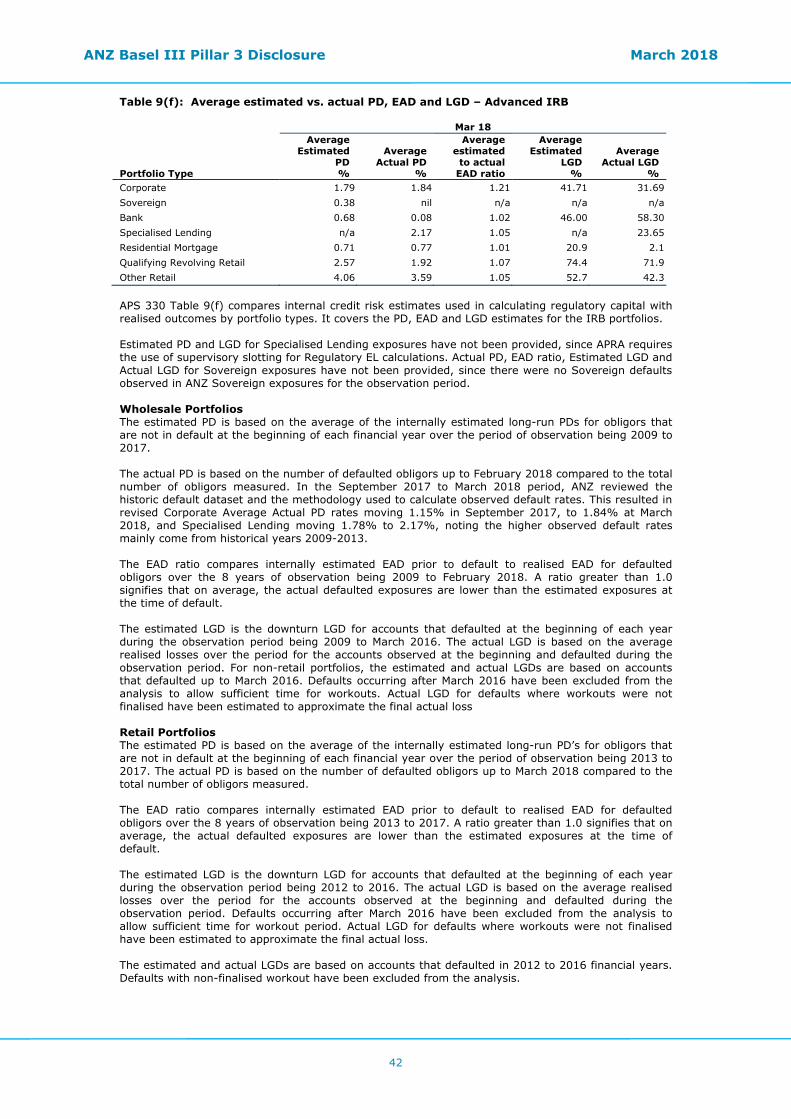
ANZ Basel III Pillar 3 Disclosure March 2018
42
Table 9(f): Average estimated vs. actual PD, EAD and LGD – Advanced IRB Mar 18
Portfolio Type
Average Estimated
PD %
Average Actual PD
%
Average estimated to actual
EAD ratio
Average Estimated
LGD %
Average Actual LGD
% Corporate 1.79 1.84 1.21 41.71 31.69 Sovereign 0.38 nil n/a n/a n/a Bank 0.68 0.08 1.02 46.00 58.30 Specialised Lending n/a 2.17 1.05 n/a 23.65 Residential Mortgage 0.71 0.77 1.01 20.9 2.1 Qualifying Revolving Retail 2.57 1.92 1.07 74.4 71.9 Other Retail 4.06 3.59 1.05 52.7 42.3 APS 330 Table 9(f) compares internal credit risk estimates used in calculating regulatory capital with realised outcomes by portfolio types. It covers the PD, EAD and LGD estimates for the IRB portfolios. Estimated PD and LGD for Specialised Lending exposures have not been provided, since APRA requires the use of supervisory slotting for Regulatory EL calculations. Actual PD, EAD ratio, Estimated LGD and Actual LGD for Sovereign exposures have not been provided, since there were no Sovereign defaults observed in ANZ Sovereign exposures for the observation period. Wholesale Portfolios The estimated PD is based on the average of the internally estimated long-run PDs for obligors that are not in default at the beginning of each financial year over the period of observation being 2009 to 2017. The actual PD is based on the number of defaulted obligors up to February 2018 compared to the total number of obligors measured. In the September 2017 to March 2018 period, ANZ reviewed the historic default dataset and the methodology used to calculate observed default rates. This resulted in revised Corporate Average Actual PD rates moving 1.15% in September 2017, to 1.84% at March 2018, and Specialised Lending moving 1.78% to 2.17%, noting the higher observed default rates mainly come from historical years 2009-2013. The EAD ratio compares internally estimated EAD prior to default to realised EAD for defaulted obligors over the 8 years of observation being 2009 to February 2018. A ratio greater than 1.0 signifies that on average, the actual defaulted exposures are lower than the estimated exposures at the time of default. The estimated LGD is the downturn LGD for accounts that defaulted at the beginning of each year during the observation period being 2009 to March 2016. The actual LGD is based on the average realised losses over the period for the accounts observed at the beginning and defaulted during the observation period. For non-retail portfolios, the estimated and actual LGDs are based on accounts that defaulted up to March 2016. Defaults occurring after March 2016 have been excluded from the analysis to allow sufficient time for workouts. Actual LGD for defaults where workouts were not finalised have been estimated to approximate the final actual loss Retail Portfolios The estimated PD is based on the average of the internally estimated long-run PD’s for obligors that are not in default at the beginning of each financial year over the period of observation being 2013 to 2017. The actual PD is based on the number of defaulted obligors up to March 2018 compared to the total number of obligors measured. The EAD ratio compares internally estimated EAD prior to default to realised EAD for defaulted obligors over the 8 years of observation being 2013 to 2017. A ratio greater than 1.0 signifies that on average, the actual defaulted exposures are lower than the estimated exposures at the time of default. The estimated LGD is the downturn LGD for accounts that defaulted at the beginning of each year during the observation period being 2012 to 2016. The actual LGD is based on the average realised losses over the period for the accounts observed at the beginning and defaulted during the observation period. Defaults occurring after March 2016 have been excluded from the analysis to allow sufficient time for workout period. Actual LGD for defaults where workouts were not finalised have been estimated to approximate the final actual loss. The estimated and actual LGDs are based on accounts that defaulted in 2012 to 2016 financial years. Defaults with non-finalised workout have been excluded from the analysis.
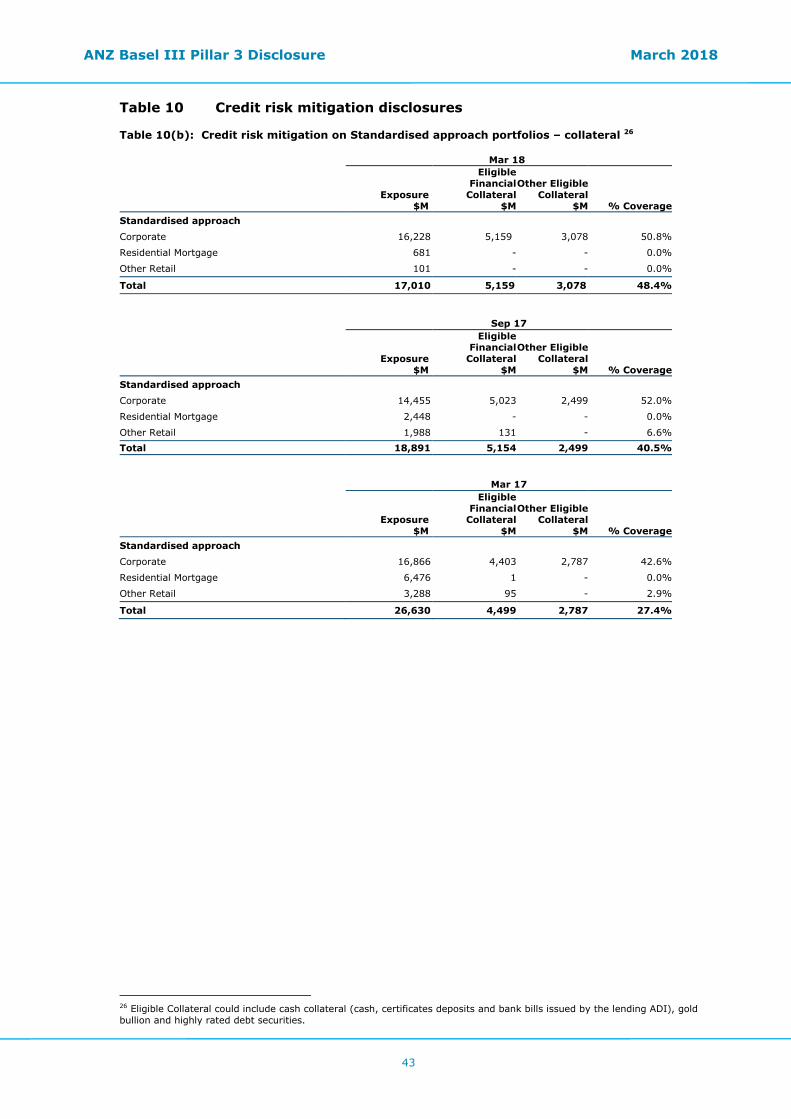
ANZ Basel III Pillar 3 Disclosure March 2018
43
Table 10 Credit risk mitigation disclosures Table 10(b): Credit risk mitigation on Standardised approach portfolios – collateral 26 Mar 18
Exposure $M
Eligible Financial
Collateral$M
Other Eligible Collateral
$M % CoverageStandardised approach
Corporate 16,228 5,159 3,078 50.8%
Residential Mortgage 681 - - 0.0%
Other Retail 101 - - 0.0%
Total 17,010 5,159 3,078 48.4% Sep 17
Exposure $M
Eligible Financial
Collateral$M
Other Eligible Collateral
$M % CoverageStandardised approach
Corporate 14,455 5,023 2,499 52.0%
Residential Mortgage 2,448 - - 0.0%
Other Retail 1,988 131 - 6.6%Total 18,891 5,154 2,499 40.5% Mar 17
Exposure $M
Eligible Financial
Collateral$M
Other Eligible Collateral
$M % CoverageStandardised approach
Corporate 16,866 4,403 2,787 42.6%
Residential Mortgage 6,476 1 - 0.0%
Other Retail 3,288 95 - 2.9%
Total 26,630 4,499 2,787 27.4%
26 Eligible Collateral could include cash collateral (cash, certificates deposits and bank bills issued by the lending ADI), gold bullion and highly rated debt securities.

ANZ Basel III Pillar 3 Disclosure March 2018
44
Table 10(c): Credit risk mitigation – guarantees and credit derivatives Mar 18
Exposure $M
Exposures covered by Guarantees
$M
Exposures covered by
Credit Derivatives
$M % Coverage Advanced IRB
Corporate (incl. Specialised Lending) 275,651 6,790 824 2.8%
Sovereign 141,282 5,212 - 3.7%
Bank 48,668 10 - 0.0%
Residential Mortgage 376,082 - - 0.0%
Qualifying Revolving Retail 19,331 - - 0.0%
Other Retail 41,580 - - 0.0%
Total 902,594 12,012 824 1.4%
Standardised approach
Corporate 16,228 182 - 1.1%
Residential Mortgage 681 - - 0.0%
Other Retail 101 - - 0.0%
Total 17,010 182 - 1.1%
Qualifying Central Counterparties 10,591 - - 0.0%
Sep 17
Exposure $M
Exposures covered by Guarantees
$M
Exposures covered by
Credit Derivatives
$M % Coverage Advanced IRB
Corporate (incl. Specialised Lending) 267,580 6,824 887 2.9%
Sovereign 131,473 4,479 - 3.4%
Bank 44,540 15 - 0.0%
Residential Mortgage 366,669 - - 0.0%
Qualifying Revolving Retail 22,055 - - 0.0%
Other Retail 41,951 - - 0.0%
Total 874,268 11,318 887 1.4%
Standardised approach
Corporate 14,455 168 - 1.2%
Residential Mortgage 2,448 - - 0.0%
Other Retail 1,988 - - 0.0%
Total 18,891 168 - 0.9%
Qualifying Central Counterparties 9,919 - - 0.0%

ANZ Basel III Pillar 3 Disclosure March 2018
45
Mar 17
Exposure $M
Exposurescovered byGuarantees
$M
Exposures covered by
Credit Derivatives
$M % CoverageAdvanced IRB
Corporate (incl. Specialised Lending) 267,365 5,313 828 2.3%
Sovereign 130,805 4,286 - 3.3%
Bank 45,715 11 - 0.0%
Residential Mortgage 354,689 - - 0.0%
Qualifying Revolving Retail 22,273 - - 0.0%
Other Retail 42,126 - - 0.0%
Total 862,973 9,610 828 1.2%
Standardised approach
Corporate 16,866 245 - 1.5%
Residential Mortgage 6,476 - - 0.0%
Other Retail 3,288 - - 0.0%
Total 26,630 245 - 0.9%
Qualifying Central Counterparties 9,756 - - 0.0%

ANZ Basel III Pillar 3 Disclosure March 2018
46
Table 11(b): Counterparty credit risk – net derivative credit exposure
Net derivative credit exposure
Mar 18 Sep 17 Mar 17 $M $M $M Gross positive fair value of contracts 70,915 62,518 63,882
Netting benefits (55,268) (49,227) (50,335)
Netted current credit exposure 15,647 13,291 13,547
Collateral held (7,530) (5,093) (3,861)
Net derivatives credit exposure 8,117 8,198 9,686 Counterparty credit risk exposure – by portfolio type
Mar 18 Sep 17 Mar 17 Portfolio Type $M $M $M Corporate 15,106 13,573 14,671 Sovereign 1,383 1,359 1,801 Bank 15,817 13,569 13,540 Qualifying Central Counterparties 10,591 9,916 9,756 Specialised Lending 461 505 625
Total exposures 43,358 38,922 40,393 Notional Value of Credit Derivative Hedges
Mar 18 Sep 17 Mar 17 Product Type $M $M $M Credit Default Swaps 343 731 729 Interest Rate Swaps - - - Currency Swaps - - - Other - - -
Total exposures 343 731 729

ANZ Basel III Pillar 3 Disclosure March 2018
47
Table 11(c): Counterparty credit risk exposure – credit derivative transactions Mar 18 Protection
Bought $M
Protection Sold
$M Total
$M Credit derivative products used for own credit portfolio Credit default swaps 2,896 2,502 5,398
Total notional value 2,896 2,502 5,398
Credit derivative products used for intermediation Credit default swaps 343 343 686
Total return swaps - - -
Total notional value 343 343 686
Total credit derivative notional value 3,239 2,845 6,084 Sep 17 Protection
Bought $M
Protection Sold
$M Total
$M Credit derivative products used for own credit portfolio Credit default swaps 6,138 5,672 11,810
Total notional value 6,138 5,672 11,810
Credit derivative products used for intermediation Credit default swaps 731 731 1,462
Total return swaps - - -
Total notional value 731 731 1,462
Total credit derivative notional value 6,869 6,403 13,272
Mar 17 Protection
Bought $M
Protection Sold
$M Total
$M Credit derivative products used for own credit portfolio Credit default swaps 7,764 7,384 15,148
Total notional value 7,764 7,384 15,148
Credit derivative products used for intermediation Credit default swaps 729 729 1,458
Total return swaps - - -
Total notional value 729 729 1,458
Total credit derivative notional value 8,493 8,113 16,606

ANZ Basel III Pillar 3 Disclosure March 2018
48
Chapter 5 – Securitisation Banking Book Table 12(g): Banking Book: Traditional and synthetic securitisation exposures Mar 18 Traditional securitisations
Underlying asset ANZ Originated
$M ANZ Self Securitised
$M ANZ Sponsored
$MResidential mortgage 1,349 70,709 -
Credit cards and other personal loans - - -
Auto and equipment finance - - -
Commercial loans - - -
Other - - -
Total 1,349 70,709 - Synthetic securitisations
Underlying asset ANZ Originated
$M ANZ Self Securitised
$M ANZ Sponsored
$MResidential mortgage - - -
Credit cards and other personal loans - - -
Auto and equipment finance - - -
Commercial loans - - -
Other - - -
Total - - -
Aggregate of traditional and synthetic securitisations
Underlying asset ANZ Originated
$M ANZ Self Securitised
$M ANZ Sponsored
$MResidential mortgage 1,349 70,709 -
Credit cards and other personal loans - - -
Auto and equipment finance - - -
Commercial loans - - -
Other - - -
Total 1,349 70,709 -

ANZ Basel III Pillar 3 Disclosure March 2018
49
Sep 17 Traditional securitisations
Underlying asset ANZ Originated
$M ANZ Self Securitised
$M ANZ Sponsored
$MResidential mortgage 1,528 71,011 -
Credit cards and other personal loans - - -
Auto and equipment finance - - -
Commercial loans - - -
Other - - -
Total 1,528 71,011 - Synthetic securitisations
Underlying asset ANZ Originated
$M ANZ Self Securitised
$M ANZ Sponsored
$MResidential mortgage - - -
Credit cards and other personal loans - - -
Auto and equipment finance - - -
Commercial loans - - -
Other - - -
Total - - -
Aggregate of traditional and synthetic securitisations
Underlying asset ANZ Originated
$M ANZ Self Securitised
$M ANZ Sponsored
$MResidential mortgage 1,528 71,011 -
Credit cards and other personal loans - - -
Auto and equipment finance - - -
Commercial loans - - -
Other - - -
Total 1,528 71,011 - Mar 17 Traditional securitisations
Underlying asset ANZ Originated
$M ANZ Self Securitised
$M ANZ Sponsored
$MResidential mortgage 1,750 81,224 -
Credit cards and other personal loans - - -
Auto and equipment finance - - -
Commercial loans - - -
Other - - -
Total 1,750 81,224 - Synthetic securitisations
Underlying asset ANZ Originated
$M ANZ Self Securitised
$M ANZ Sponsored
$MResidential mortgage - - -
Credit cards and other personal loans - - -
Auto and equipment finance - - -
Commercial loans - - -
Other - - -
Total - - - Aggregate of traditional and synthetic securitisations
Underlying asset ANZ Originated
$M ANZ Self Securitised
$M ANZ Sponsored
$MResidential mortgage 1,750 81,224 -
Credit cards and other personal loans - - -
Auto and equipment finance - - -
Commercial loans - - -
Other - - -
Total 1,750 81,224 -
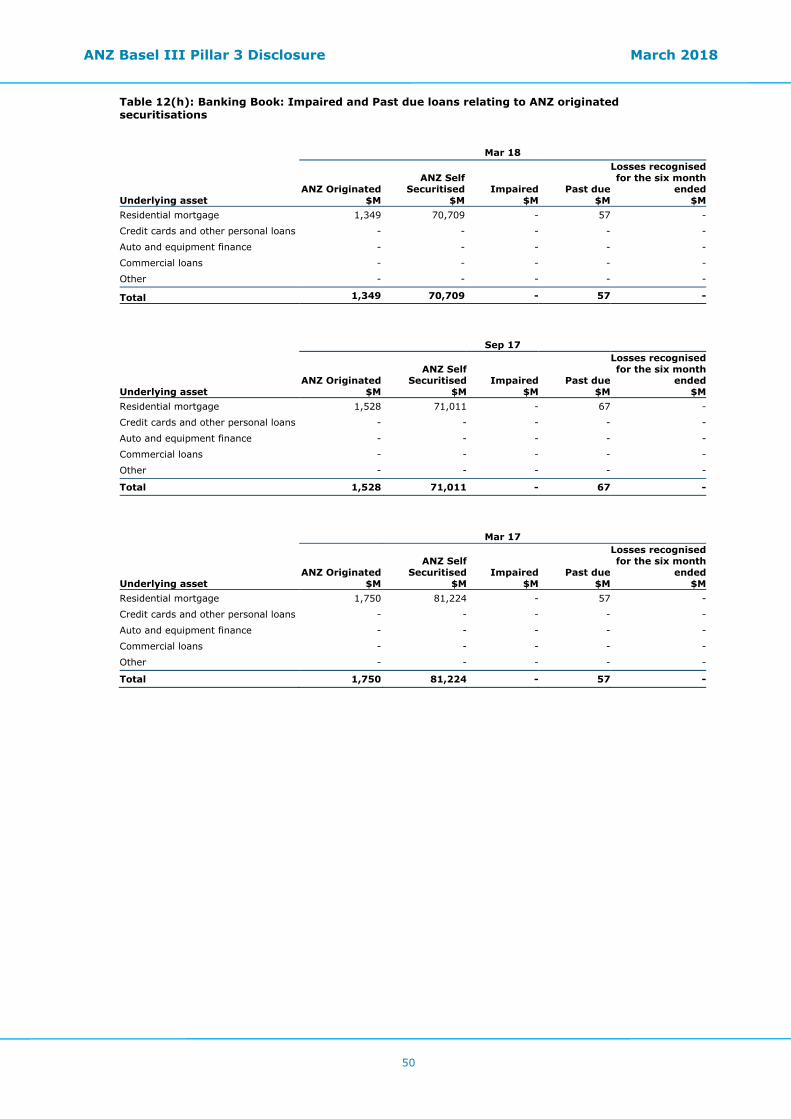
ANZ Basel III Pillar 3 Disclosure March 2018
50
Table 12(h): Banking Book: Impaired and Past due loans relating to ANZ originated securitisations Mar 18
Underlying asset ANZ Originated
$M
ANZ Self Securitised
$M Impaired
$MPast due
$M
Losses recognised for the six month
ended$M
Residential mortgage 1,349 70,709 - 57 -
Credit cards and other personal loans - - - - -
Auto and equipment finance - - - - -
Commercial loans - - - - -
Other - - - - -
Total 1,349 70,709 - 57 - Sep 17
Underlying asset ANZ Originated
$M
ANZ SelfSecuritised
$MImpaired
$MPast due
$M
Losses recognised for the six month
ended$M
Residential mortgage 1,528 71,011 - 67 -
Credit cards and other personal loans - - - - -
Auto and equipment finance - - - - -
Commercial loans - - - - -
Other - - - - -
Total 1,528 71,011 - 67 - Mar 17
Underlying asset ANZ Originated
$M
ANZ SelfSecuritised
$MImpaired
$MPast due
$M
Losses recognised for the six month
ended$M
Residential mortgage 1,750 81,224 - 57 -
Credit cards and other personal loans - - - - -
Auto and equipment finance - - - - -
Commercial loans - - - - -
Other - - - - -
Total 1,750 81,224 - 57 -

ANZ Basel III Pillar 3 Disclosure March 2018
51
Table 12(i): Banking Book: Total amount of outstanding exposures intended to be securitised No assets from ANZ's Banking Book were intended to be securitised as at the reporting date. Table 12(j): Banking Book: Securitisation - Summary of current period’s activity by underlying asset type and facility27
Mar 18
Original value securitised
Securitisation activity by underlying asset type
ANZ Originated
$M
ANZ Self Securitised
$MANZ Sponsored
$M
Recognised gain or loss
on sale $M
Residential mortgage (179) (302) - -
Credit cards and other personal loans - - - -Auto and equipment finance - - - -Commercial loans - - - -Other - - - -
Total (179) (302) - -
Securitisation activity by facility provided
Notional amount
$M Liquidity facilities (51)
Funding facilities (162)
Underwriting facilities -
Lending facilities -
Credit enhancements -
Holdings of securities (excluding trading book) (404)
Other 6
Total (611)
Sep 17
Original value securitised
Securitisation activity by underlying asset type
ANZ Originated
$M
ANZ SelfSecuritised
$MANZ Sponsored
$M
Recognised gain or loss
on sale $M
Residential mortgage (222) (10,213) - -
Credit cards and other personal loans - - - - Auto and equipment finance - - - - Commercial loans - - - - Other - - - -
Total (222) (10,213) - -
Securitisation activity by facility provided
Notional amount
$M Liquidity facilities -
Funding facilities 815
Underwriting facilities -
Lending facilities -
Credit enhancements -
Holdings of securities (excluding trading book) (635)
Other 4
Total 184
27 Activity represents net movement in outstandings.
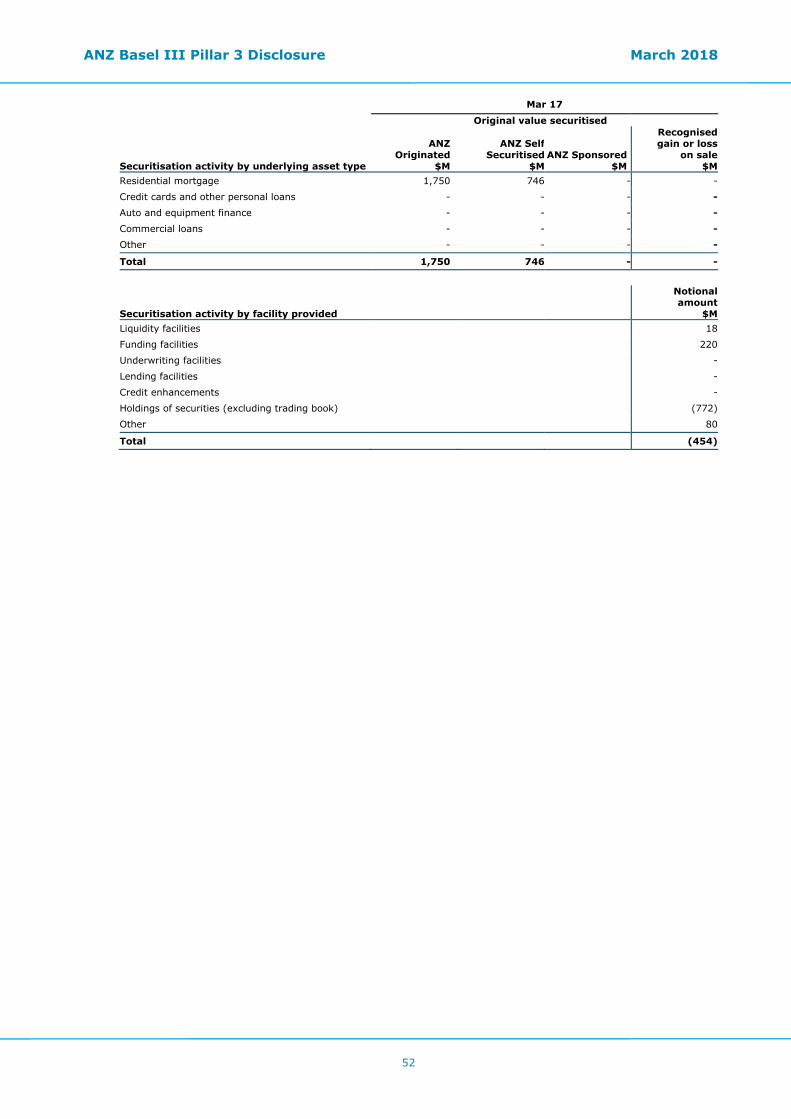
ANZ Basel III Pillar 3 Disclosure March 2018
52
Mar 17
Original value securitised
Securitisation activity by underlying asset type
ANZ Originated
$M
ANZ SelfSecuritised
$MANZ Sponsored
$M
Recognised gain or loss
on sale $M
Residential mortgage 1,750 746 - -
Credit cards and other personal loans - - - - Auto and equipment finance - - - - Commercial loans - - - - Other - - - -
Total 1,750 746 - -
Securitisation activity by facility provided
Notional amount
$M Liquidity facilities 18
Funding facilities 220
Underwriting facilities -
Lending facilities -
Credit enhancements -
Holdings of securities (excluding trading book) (772)
Other 80
Total (454)
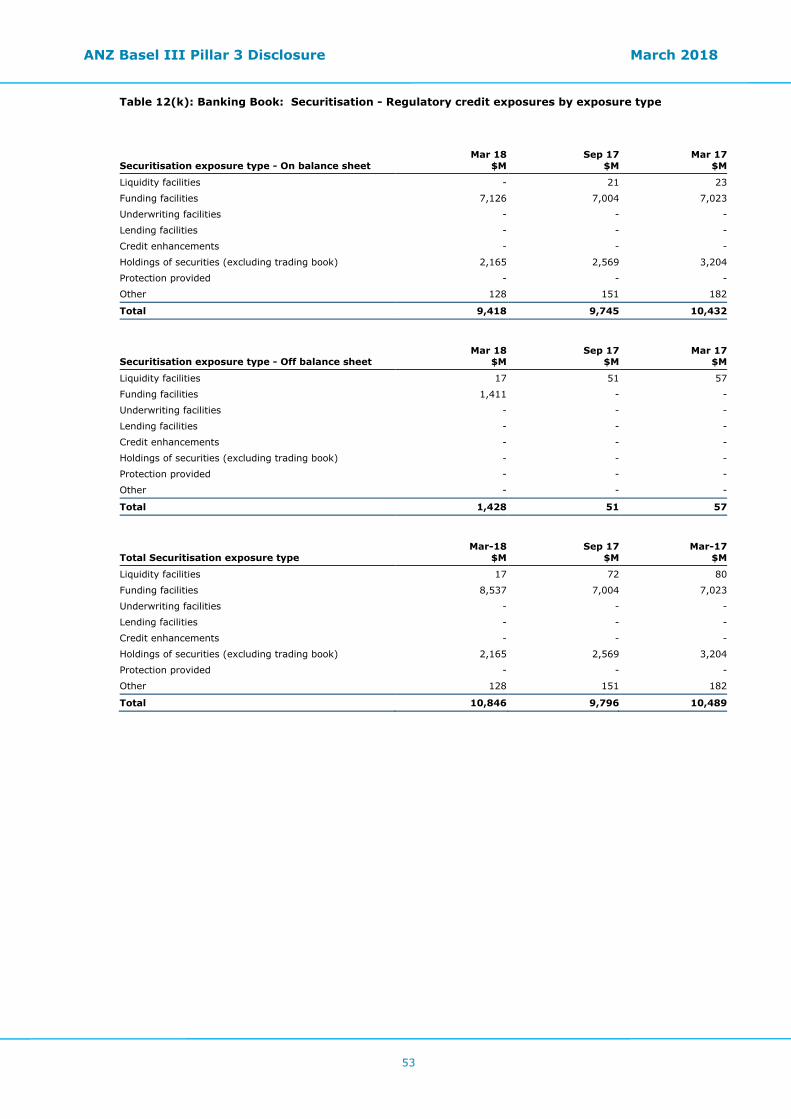
ANZ Basel III Pillar 3 Disclosure March 2018
53
Table 12(k): Banking Book: Securitisation - Regulatory credit exposures by exposure type Securitisation exposure type - On balance sheet
Mar 18 $M
Sep 17$M
Mar 17 $M
Liquidity facilities - 21 23
Funding facilities 7,126 7,004 7,023
Underwriting facilities - - -
Lending facilities - - -
Credit enhancements - - -
Holdings of securities (excluding trading book) 2,165 2,569 3,204
Protection provided - - -
Other 128 151 182
Total 9,418 9,745 10,432 Securitisation exposure type - Off balance sheet
Mar 18 $M
Sep 17$M
Mar 17 $M
Liquidity facilities 17 51 57
Funding facilities 1,411 - -
Underwriting facilities - - -
Lending facilities - - -
Credit enhancements - - -
Holdings of securities (excluding trading book) - - -
Protection provided - - -
Other - - -
Total 1,428 51 57 Total Securitisation exposure type
Mar-18 $M
Sep 17$M
Mar-17 $M
Liquidity facilities 17 72 80
Funding facilities 8,537 7,004 7,023
Underwriting facilities - - -
Lending facilities - - -
Credit enhancements - - -
Holdings of securities (excluding trading book) 2,165 2,569 3,204
Protection provided - - -
Other 128 151 182
Total 10,846 9,796 10,489

ANZ Basel III Pillar 3 Disclosure March 2018
54
Table 12(l) part (i): Banking Book: Securitisation - Regulatory credit exposures by risk weight band Mar 18 Sep 17 Mar 17
Securitisation risk weights
Regulatory credit exposure
$M
Risk weightedassets
$M
Regulatory credit exposure
$M
Risk weighted assets
$M
Regulatory credit exposure
$M
Risk weighted assets
$M ≤ 25% 10,846 1,728 9,709 1,012 10,395 1,093
>25 ≤ 35% - - - - - -
>35 ≤ 50% - - - - - -
>50 ≤ 75% - - 36 20 37 21
>75 ≤ 100% - - 51 51 57 57
>100 ≤ 650% - - - - - -
1250% (Deduction) - - - - - -
Total 10,846 1,728 9,796 1,083 10,489 1,171 Mar 18 Sep 17 Mar 17
Resecuritisation risk weights
Regulatory credit exposure
$M
Risk weightedassets
$M
Regulatory credit exposure
$M
Risk weighted assets
$M
Regulatory credit exposure
$M
Risk weighted assets
$M ≤ 25% - - - - - -
>25 ≤ 35% - - - - - -
>35 ≤ 50% - - - - - -
>50 ≤ 75% - - - - - -
>75 ≤ 100% - - - - - -
>100 ≤ 650% - - - - - -
1250% (Deduction) - - - - - -
Total - - - - - -
Mar 18 Sep 17 Mar 17
Total Securitisation risk weights
Regulatory credit exposure
$M
Risk weightedassets
$M
Regulatory credit exposure
$M
Risk weighted assets
$M
Regulatory credit exposure
$M
Risk weighted assets
$M ≤ 25% 10,846 1,728 9,709 1,012 10,395 1,093
>25 ≤ 35% - - - - - -
>35 ≤ 50% - - - - - -
>50 ≤ 75% - - 36 20 37 21
>75 ≤ 100% - - 51 51 57 57
>100 ≤ 650% - - - - - -
1250% (Deduction) - - - - - -
Total 10,486 1,728 9,796 1,083 10,489 1,171

ANZ Basel III Pillar 3 Disclosure March 2018
55
Table 12(l) part (ii): Banking Book: Securitisation - Aggregate securitisation exposures deducted from Capital No longer required under Basel III; defaulted exposures are given a risk weight of 1250% and no longer deducted from capital. Table 12(m): Banking Book: Securitisations subject to early amortisation treatment ANZ does not have any Securitisations subject to early amortisation treatment or using Standardised approach. Table 12(n): Banking Book: Resecuritisation - Aggregate amount of resecuritisation exposures retained or purchased ANZ does not have any retained or purchased Resecuritisation exposures.
ANZ Basel III Pillar 3 Disclosure March 2018
56
Trading Book Table 12(o): Trading Book: Traditional and synthetic securitisation exposures No assets from ANZ's Trading Book were securitised during the reporting period. Table 12(p): Trading Book: Total amount of outstanding exposures intended to be securitised No assets from ANZ's Trading Book were intended to be securitised as at the reporting date. Table 12(q): Trading Book: Securitisation - Summary of current year's activity by underlying asset type and facility No assets from ANZ's Trading Book were securitised during the reporting period. Table 12(r): Trading Book: Traditional and synthetic securitisation exposures
No assets from ANZ's Trading Book were securitised during the reporting period.
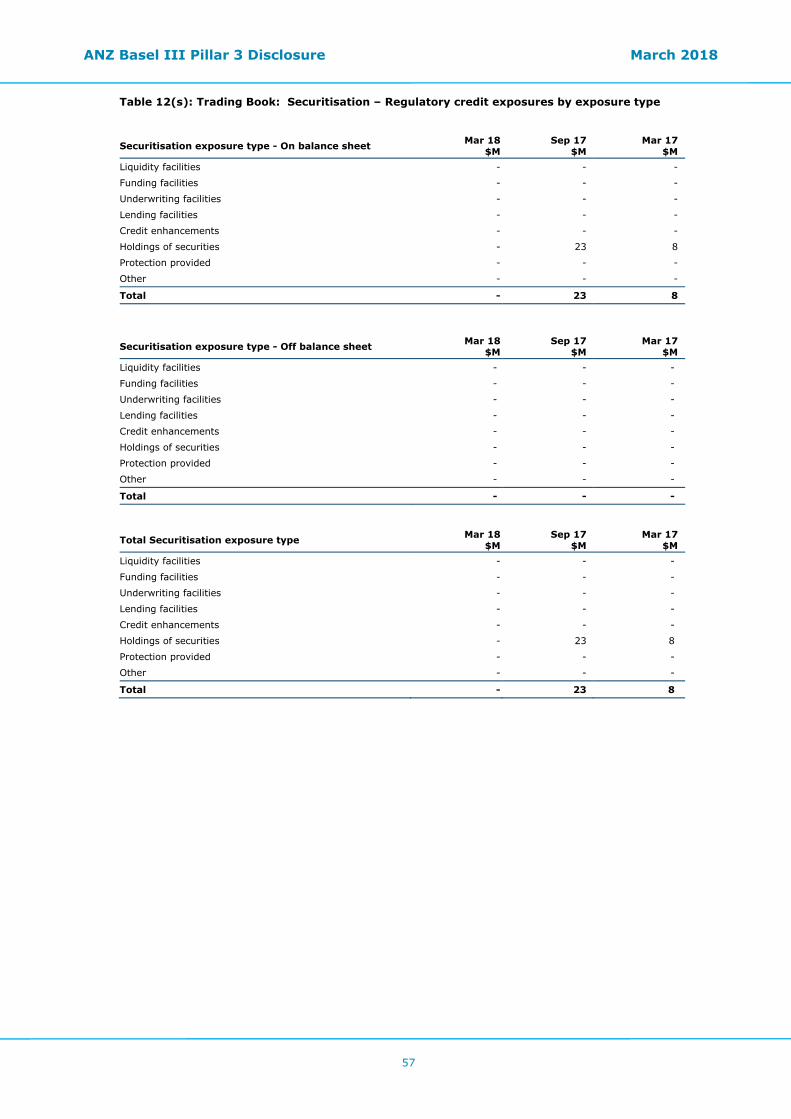
ANZ Basel III Pillar 3 Disclosure March 2018
57
Table 12(s): Trading Book: Securitisation – Regulatory credit exposures by exposure type Securitisation exposure type - On balance sheet Mar 18
$M Sep 17
$M Mar 17
$M Liquidity facilities - - -
Funding facilities - - -
Underwriting facilities - - -
Lending facilities - - -
Credit enhancements - - -
Holdings of securities - 23 8
Protection provided - - -
Other - - -
Total - 23 8
Securitisation exposure type - Off balance sheet Mar 18 $M
Sep 17 $M
Mar 17 $M
Liquidity facilities - - -
Funding facilities - - -
Underwriting facilities - - -
Lending facilities - - -
Credit enhancements - - -
Holdings of securities - - -
Protection provided - - -
Other - - -
Total - - -
Total Securitisation exposure type Mar 18 $M
Sep 17 $M
Mar 17 $M
Liquidity facilities - - -
Funding facilities - - -
Underwriting facilities - - -
Lending facilities - - -
Credit enhancements - - -
Holdings of securities - 23 8
Protection provided - - -
Other - - -
Total - 23 8

ANZ Basel III Pillar 3 Disclosure March 2018
58
Table 12(t)(i) & Table 12(u)(i): Trading Book: Aggregate securitisation exposures subject to Internal Models Approach (IMA) and the associated Capital requirements ANZ does not have any Securitisation exposures subject to Internal Models Approach. Table 12(t)(ii) & Table 12(u)(ii): Trading Book: Aggregate securitisation exposures subject to APS120 and the associated Capital requirements ANZ does not have any aggregate Securitisation exposures subject to APS120 and the associated Capital requirements. Table 12(u)(iii): Trading Book: Securitisation - Aggregate securitisation exposures deducted from Capital ANZ does not have any Securitisation exposures subject to early amortisation or using Standardised approach. Table 12(v): Trading Book: Securitisations subject to early amortisation treatment ANZ does not have any Securitisation exposures subject to early amortisation or using Standardised approach. Table 12(w): Trading Book: Resecuritisation - Aggregate amount of resecuritisation exposures retained or purchased ANZ does not have any retained or purchased Resecuritisation exposures.
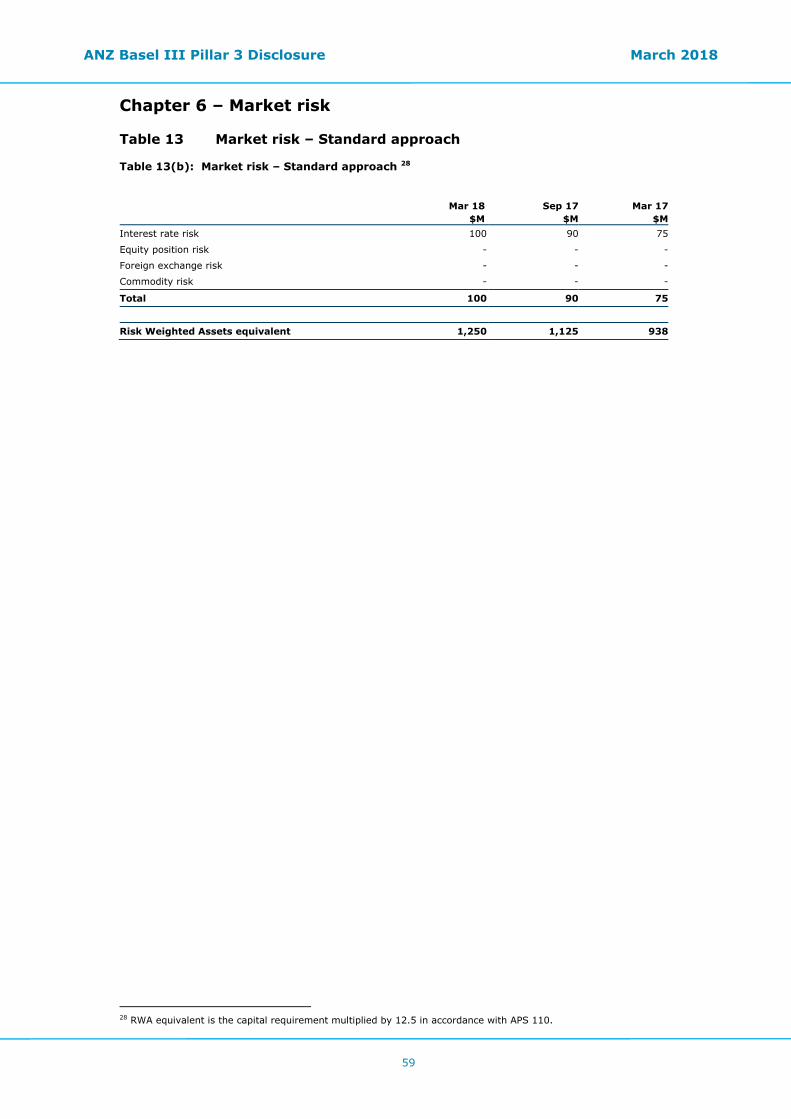
ANZ Basel III Pillar 3 Disclosure March 2018
59
Chapter 6 – Market risk Table 13 Market risk – Standard approach Table 13(b): Market risk – Standard approach 28 Mar 18 Sep 17 Mar 17 $M $M $MInterest rate risk 100 90 75
Equity position risk - - -
Foreign exchange risk - - -
Commodity risk - - -
Total 100 90 75
Risk Weighted Assets equivalent 1,250 1,125 938
28 RWA equivalent is the capital requirement multiplied by 12.5 in accordance with APS 110.
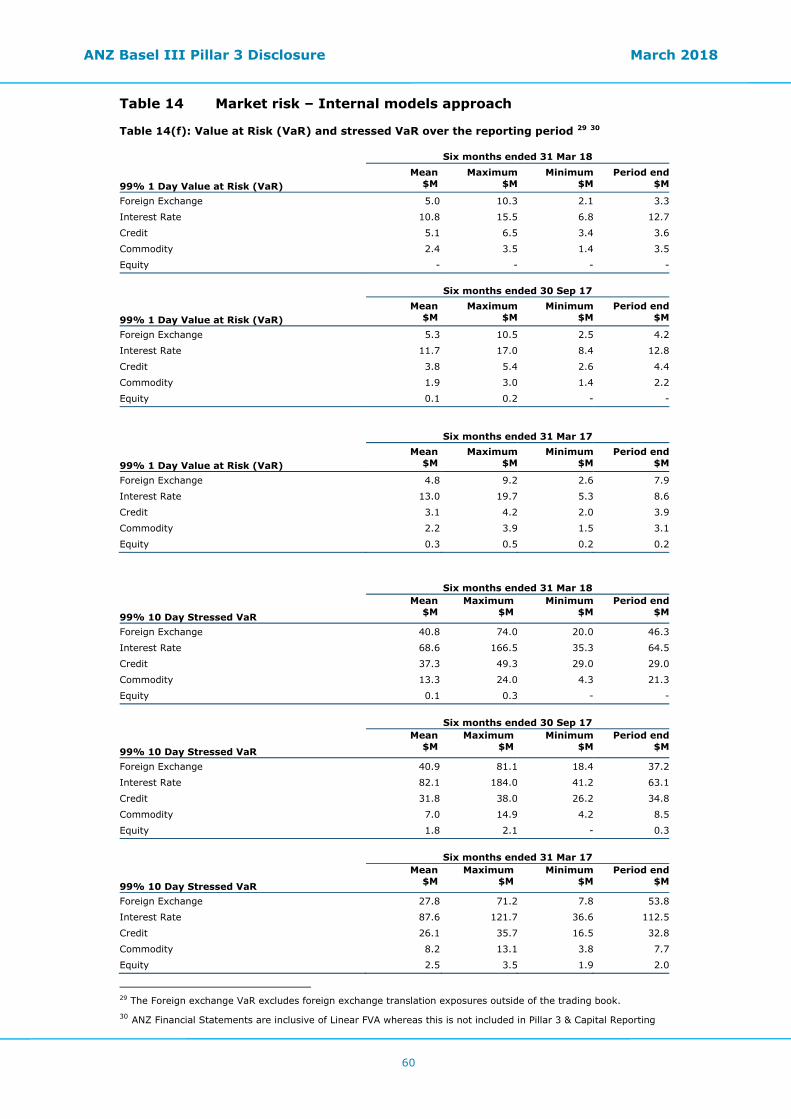
ANZ Basel III Pillar 3 Disclosure March 2018
60
Table 14 Market risk – Internal models approach Table 14(f): Value at Risk (VaR) and stressed VaR over the reporting period 29 30
Six months ended 31 Mar 18
99% 1 Day Value at Risk (VaR) Mean
$M Maximum
$MMinimum
$MPeriod end
$M
Foreign Exchange 5.0 10.3 2.1 3.3
Interest Rate 10.8 15.5 6.8 12.7
Credit 5.1 6.5 3.4 3.6
Commodity 2.4 3.5 1.4 3.5
Equity - - - - Six months ended 30 Sep 17
99% 1 Day Value at Risk (VaR) Mean
$M Maximum
$MMinimum
$MPeriod end
$M
Foreign Exchange 5.3 10.5 2.5 4.2
Interest Rate 11.7 17.0 8.4 12.8
Credit 3.8 5.4 2.6 4.4
Commodity 1.9 3.0 1.4 2.2
Equity 0.1 0.2 - - Six months ended 31 Mar 17
99% 1 Day Value at Risk (VaR) Mean
$M Maximum
$MMinimum
$MPeriod end
$M
Foreign Exchange 4.8 9.2 2.6 7.9
Interest Rate 13.0 19.7 5.3 8.6
Credit 3.1 4.2 2.0 3.9
Commodity 2.2 3.9 1.5 3.1
Equity 0.3 0.5 0.2 0.2
Six months ended 31 Mar 18
99% 10 Day Stressed VaR
Mean $M
Maximum $M
Minimum$M
Period end$M
Foreign Exchange 40.8 74.0 20.0 46.3
Interest Rate 68.6 166.5 35.3 64.5
Credit 37.3 49.3 29.0 29.0
Commodity 13.3 24.0 4.3 21.3
Equity 0.1 0.3 - - Six months ended 30 Sep 17
99% 10 Day Stressed VaR
Mean $M
Maximum $M
Minimum$M
Period end$M
Foreign Exchange 40.9 81.1 18.4 37.2
Interest Rate 82.1 184.0 41.2 63.1
Credit 31.8 38.0 26.2 34.8
Commodity 7.0 14.9 4.2 8.5
Equity 1.8 2.1 - 0.3 Six months ended 31 Mar 17
99% 10 Day Stressed VaR
Mean $M
Maximum $M
Minimum$M
Period end$M
Foreign Exchange 27.8 71.2 7.8 53.8
Interest Rate 87.6 121.7 36.6 112.5
Credit 26.1 35.7 16.5 32.8
Commodity 8.2 13.1 3.8 7.7
Equity 2.5 3.5 1.9 2.0
29 The Foreign exchange VaR excludes foreign exchange translation exposures outside of the trading book. 30 ANZ Financial Statements are inclusive of Linear FVA whereas this is not included in Pillar 3 & Capital Reporting

ANZ Basel III Pillar 3 Disclosure March 2018
61
Chapter 7 – Equities
Table 16 Equities – Disclosures for banking book positions Table 16(b) and 16(c): Equities – Types and nature of Banking Book investments Mar 18 Equity investments $M
Balance sheet value Fair value
Value of listed (publicly traded) equities 3,444 2,831
Value of unlisted (privately held) equities 151 151
Total 3,595 2,982 Sep 17 Equity investments $M
Balance sheet value Fair value
Value of listed (publicly traded) equities 2,900 2,633
Value of unlisted (privately held) equities 1,953 1,953
Total 4,853 4,586
Mar 17
Equity investments $M
Balance sheet value Fair value
Value of listed (publicly traded) equities 2,839 2,500
Value of unlisted (privately held) equities 1,918 1,918
Total 4,757 4,418 Table 16(d) and 16(e): Equities – gains (losses)
Half Year Mar 18
Half Year Sep 17
Half Year Mar 17
Realised gains (losses) on equity investments $M $M $M Cumulative realised gains (losses) from disposals and liquidations in the reporting period 353 (2) -
Cumulative realised losses from impairment and writedowns in the reporting period - - (1)
Total 353 (2) (1)
Half Year Mar 18
Half Year Sep 17
Half Year Mar 17
Unrealised gains (losses) on equity investments $M $M $M Total unrealised gains (losses) 170 21 (145) Total unrealised gains (losses) included in Common Equity Tier 1, Tier 1 and/or Tier 2 capital 170 21 (145)
Table 16(f): Equities Risk Weighted Assets From 1 January 2013 all banking book equity exposures are deducted from Common Equity Tier 1 capital.

ANZ Basel III Pillar 3 Disclosure March 2018
62
Chapter 8 – Interest Rate Risk in the Banking Book
Table 17 Interest Rate Risk in the Banking Book Table 17(b): Interest Rate Risk in the Banking Book Change in Economic Value
Standard Shock Scenario Stress Testing: Interest rate shock applied
Mar 18 Sep 17 Mar 17$M $M $M
AUD
200 basis point parallel increase (339) (427) (19)
200 basis point parallel decrease 344 415 (3)
NZD
200 basis point parallel increase (112) (82) (58)
200 basis point parallel decrease 106 75 53
USD
200 basis point parallel increase (46) (32) (27)
200 basis point parallel decrease 52 34 30
GBP
200 basis point parallel increase 12 9 11
200 basis point parallel decrease (12) (9) (11)
Other
200 basis point parallel increase (96) (98) (68)
200 basis point parallel decrease 103 103 74 IRRBB regulatory capital 722 929 827
IRRBB regulatory RWA 9,019 11,611 10,332
IRRBB stress testing methodology Stress tests within ANZ include standard and extraordinary tests. These tests are used to highlight potential risk which may not be captured by VaR, and how the portfolio might behave under extraordinary circumstances. Standard stress tests include statistically derived scenarios based on historical yield curve movements. These combine parallel shocks with twists and bends in the curve to produce a wide range of hypothetical scenarios at high statistical confidence levels, with the single worst scenario identified and reported. Extraordinary stress tests include interest rate moves from historical periods of stress as well as stresses to assumptions made about the repricing term of exposures. The rate move scenarios include daily changes over the stressed periods and the worst theoretical losses over the selected periods are each reported. Stresses of the repricing term assumptions investigate scenarios where actual repricing terms are vastly different to the base modelling assumptions.

ANZ Basel III Pillar 3 Disclosure March 2018
63
Chapter 9 – Leverage and Liquidity Coverage Ratio
Leverage Ratio The Leverage Ratio requirements are part of the Basel Committee on Banking Supervision (BCBS) Basel III capital framework. It is a simple, non-risk based supplement or backstop to the current risk based capital requirements and is intended to restrict the build-up of excessive leverage in the banking system. Consistent with the BCBS definition, APRA’s Leverage Ratio compares Tier 1 Capital to the Exposure Measure (expressed as a percentage) as defined by APS 110. APRA has not finalised a minimum Leverage Ratio requirement for Australian ADIs, although the current BCBS requirement is for a minimum of 3%. At 31 March 2018, the Group’s Leverage Ratio of 5.4% was above the 3% BCBS minimum. Table 18 below shows the Group’s Leverage Ratio calculation as at 31 March 2018 and Table 19 summarises the reconciliation of accounting assets and leverage ratio exposure measure at 31 March 2018. Table 18 Leverage Ratio
Mar 18
$M Sep 17
$M Mar 17
$M
On-balance sheet exposures 1 On-balance sheet items (excluding derivatives and securities financing
transactions (SFTs), but including collateral) 795,034 768,930 764,169
2 (Asset amounts deducted in determining Basel III Tier 1 capital) (14,762) (16,583) (16,461)
3 Total on-balance sheet exposures (excluding derivatives and SFTs) 780,272 752,347 747,708
Derivative exposures 4 Replacement cost associated with all derivatives transactions (i.e. net of eligible
cash variation margin) 8,267 8,354 9,685
5 Add-on amounts for potential future credit exposure (PFCE) associated with all derivatives transactions 31,107 28,193 28,199
6 Gross-up for derivatives collateral provided where deducted from the balance sheet assets pursuant to the operative accounting framework - -
7 (Deductions of receivables assets for cash variation margin provided in derivatives transactions) (7,199) (6,102) (7,924)
8 (Exempted central counterparty (CCP) leg of client-cleared trade exposures) - -
9 Adjusted effective notional amount of written credit derivatives 2,851 6,429 8,115
10 (Adjusted effective notional offsets and add-on deductions for written credit derivatives) (2,279) (5,405) (7,107)
11 Total derivative exposures 32,747 31,469 30,968
Securities financing transaction exposures 12 Gross SFT assets (with no recognition of netting), after adjusting for sale
accounting transactions 29,543 28,034 29,680
13 (Netted amounts of cash payables and cash receivables of gross SFT assets) (1,240) (490) (1,261)
14 CCR exposure for SFT assets 1,048 1,054 1,867
15 Agent transaction exposures - - -
16 Total securities financing transaction exposures 29,351 28,598 30,286
Other off-balance sheet exposures 17 Off-balance sheet exposure at gross notional amount 233,527 232,162 236,054
18 (Adjustments for conversion to credit equivalent amounts) (133,606) (135,397) (138,562)
19 Off-balance sheet items 99,921 96,765 97,492
Capital and Total Exposures
20 Tier 1 capital 51,125 49,324 48,091
21 Total exposures 942,291 909,179 906,454
Leverage ratio
22 Basel III leverage ratio 5.4% 5.4% 5.3%

ANZ Basel III Pillar 3 Disclosure March 2018
64
Table 19 Summary comparison of accounting assets vs. leverage ratio exposure measure
Mar18 $M
Sep17 $M
Mar17 $M
1 Total consolidated assets as per published financial statements 935,116 897,326 896,511
2
Adjustment for investments in banking, financial, insurance or commercial entities that are consolidated for accounting purposes but outside the scope of regulatory consolidation.
(39,623) (37,846) (38,781)
3
Adjustment for assets held on the balance sheet in a fiduciary capacity pursuant to the Australian Accounting Standards but excluded from the leverage ratio exposure measure
- - -
4 Adjustments for derivative financial instruments. (38,168) (31,047) (32,913)
5 Adjustment for SFTs (i.e. repos and similar secured lending) (193) 564 606
6 Adjustment for off-balance sheet exposures (i.e. conversion to credit equivalent amounts of off-balance sheet exposures)
99,921 96,765 97,492
7 Other adjustments (14,762) (16,583) (16,461)
8 Leverage ratio exposure 942,291 909,179 906,454

ANZ Basel III Pillar 3 Disclosure March 2018
65
Table 20 Liquidity Coverage Ratio disclosure template
Mar 18 Dec 17 Sep 17 Total
Unweighted Value
$M
Total Weighted
Value $M
Total Unweighted
Value $M
Total Weighted
Value $M
Total Unweighted
Value $M
Total Weighted
Value $M
Liquid assets, of which:
1 High-quality liquid assets (HQLA) - 142,032 - 131,462 - 128,333
2 Alternative liquid assets (ALA) - 40,898 - 37,799 - 37,797
3 Reserve Bank of New Zealand (RBNZ) securities - 12,306 - 12,270 - 8,329
Cash outflows
4 Retail deposits and deposits from small business customers 201,613 21,800 202,968 21,912 203,322 21,941
5 of which: stable deposits 76,074 3,804 77,436 3,872 77,762 3,888
6 of which: less stable deposits 125,539 17,996 125,532 18,040 125,560 18,053
7 Unsecured wholesale funding 199,523 112,597 193,680 108,436 183,549 103,476
8 of which: operational deposits (all
counterparties) and deposits in networks for cooperative banks
59,713 14,303 58,186 13,923 57,996 13,892
9 of which: non-operational deposits (all counterparties) 128,114 86,598 124,953 83,972 112,066 76,097
10 of which: unsecured debt 11,696 11,696 10,541 10,541 13,487 13,487
11 Secured wholesale funding 604 567 423
12 Additional requirements 142,331 44,342 140,318 40,527 138,071 39,151
13 of which: outflows related to
derivatives exposures and other collateral requirements
31,878 31,878 27,772 27,772 27,226 27,226
14 of which: outflows related to loss of funding on debt products - - - - - -
15 of which: credit and liquidity facilities 110,453 12,464 112,546 12,755 110,845 11,925
16 Other contractual funding obligations 10,189 - 9,904 - 9,227 -
17 Other contingent funding obligations 81,064 4,733 87,368 5,550 103,590 8,482
18 Total cash outflows 184,076 176,992 173,473
Cash inflows
19 Secured lending (e.g. reverse repos) 21,956 1,122 20,500 1,142 21,148 1479
20 Inflows from fully performing exposures 29,390 19,201 29,402 19,498 31,593 22,366
21 Other cash inflows 21,712 21,712 18,174 18,174 19,350 19,350
22 Total cash inflows 73,058 42,035 68,076 38,814 72,091 43,195 23 Total liquid assets - 195,236 - 181,531 - 174,459
24 Total net cash outflows - 142,041 - 138,178 - 130,278
25 Liquidity Coverage Ratio (%) 137.5% 131.4% 133.9%
Number of data points used (simple average) 64 65 65
Liquidity Coverage Ratio (LCR) ANZ’s average LCR for the 6 months to 31 March 2018 was 134% with total liquid assets exceeding net outflows by an average of $48.3bn. The main contributors to net outflows were modelled outflows associated with the bank’s corporate and retail deposit portfolios, offset by inflows from maturing loans. While cash outflows associated with derivatives are material, these are effectively offset by derivative cash inflows. The composition of the liquid asset portfolio has remained relatively stable through the half, with HQLA securities and cash making up on average 73% of total liquid assets. Through the period the Liquidity Coverage Ratio has remained within a range of 125% to 146%. ANZ has a well diversified deposit and funding base avoiding undue concentrations by investor type, maturity, market source and currency. ANZ monitors and manages its liquidity risk on a daily basis including LCR by geography and currency, ensuring ongoing compliance across the network.

ANZ Basel III Pillar 3 Disclosure March 2018
66
Glossary ADI Authorised Deposit-taking Institution.
Basel III Credit Valuation Adjustment (CVA) capital charge
CVA charge is an additional capital requirement under Basel III for bilateral derivative exposures. Derivatives not cleared through a central exchange/counterparty are subject to this additional capital charge and also receive normal CRWA treatment under Basel II principles.
Collective provision (CP) Collective provision is the provision for credit losses that are inherent in the portfolio but not able to be individually identified. A collective provision may only be recognised when a loss event has already occurred. Losses expected as a result of future events, no matter how likely, are not recognised.
Credit exposure
The aggregate of all claims, commitments and contingent liabilities arising from on and off-balance sheet transactions (in the banking book and trading book) with the counterparty or group of related counterparties.
Credit risk The risk of financial loss resulting from the failure of ANZ’s customers and counterparties to honour or perform fully the terms of a loan or contract.
Credit Valuation Adjustment (CVA) Over the life of a derivative instrument, ANZ uses a CVA model to adjust fair value to take into account the impact of counterparty credit quality. The methodology calculates the present value of expected losses over the life of the financial instrument as a function of probability of default, loss given default, expected credit risk exposure and an asset correlation factor. Impaired derivatives are also subject to a CVA.
Days past due
The number of days a credit obligation is overdue, commencing on the date that the arrears or excess occurs and accruing for each completed calendar day thereafter.
Exposure at Default (EAD) Exposure At Default is defined as the expected facility exposure at the date of default.
Impaired assets (IA) Facilities are classified as impaired when there is doubt as to whether the contractual amounts due, including interest and other payments, will be met in a timely manner. Impaired assets include impaired facilities, and impaired derivatives. Impaired derivatives have a credit valuation adjustment (CVA), which is a market assessment of the credit risk of the relevant counterparties.
Impaired loans (IL) Impaired loans comprise of drawn facilities where the customer’s status is defined as impaired.
Individual provision charge (IPC) Individual provision charge is the amount of expected credit losses on financial instruments assessed for impairment on an individual basis (as opposed to on a collective basis). It takes into account expected cash flows over the lives of those financial instruments.
Individual provisions (IP) Individual provisions are assessed on a case-by-case basis for all individually managed impaired assets taking into consideration factors such as the realisable value of security (or other credit mitigants), the likely return available upon liquidation or bankruptcy, legal uncertainties, estimated costs involved in recovery, the market price of the exposure in secondary markets and the amount and timing of expected receipts and recoveries.
Internationally Comparable Basel III Capital
The Internationally Comparable Basel 3 CET1 ratio incorporates differences between APRA and both the Basel Committee Basel III framework (including differences identified in the March 2014 Basel Committee Regulatory Consistency Assessment Programme (RCAP) on Basel III implementation in Australia) and its application in major offshore jurisdictions.

ANZ Basel III Pillar 3 Disclosure March 2018
67
Market risk The risk to ANZ’s earnings arising from changes in interest
rates, currency exchange rates and credit spreads, or from fluctuations in bond, commodity or equity prices. ANZ has grouped market risk into two broad categories to facilitate the measurement, reporting and control of market risk: Traded market risk - the risk of loss from changes in the value of financial instruments due to movements in price factors for physical and derivative trading positions. Trading positions arise from transactions where ANZ acts as principal with clients or with the market. Non-traded market risk (or balance sheet risk) - comprises interest rate risk in the banking book and the risk to the AUD denominated value of ANZ’s capital and earnings due to foreign exchange rate movements.
Operational risk The risk of loss resulting from inadequate or failed internal
controls or from external events, including legal risk but excluding reputation risk.
Past due facilities Facilities where a contractual payment has not been met or the customer is outside of contractual arrangements are deemed past due. Past due facilities include those operating in excess of approved arrangements or where scheduled repayments are outstanding but do not include impaired assets.
Qualifying Central Counterparties (QCCP)
QCCP is a central counterparty which is an entity that interposes itself between counterparties to derivative contracts. Trades with QCCP attract a more favorable risk weight calculation.
Recoveries Payments received and taken to profit for the current period for
the amounts written off in prior financial periods.
Restructured items Restructured items comprise facilities in which the original contractual terms have been modified for reasons related to the financial difficulties of the customer. Restructuring may consist of reduction of interest, principal or other payments legally due, or an extension in maturity materially beyond those typically offered to new facilities with similar risk.
Risk Weighted Assets (RWA) Assets (both on and off-balance sheet) are risk weighted according to each asset’s inherent potential for default and what the likely losses would be in the case of default. In the case of non asset backed risks (i.e. market and operational risk), RWA is determined by multiplying the capital requirements for those risks by 12.5.
Securitisation risk The risk of credit related losses greater than expected due to a securitisation failing to operate as anticipated, or of the values and risks accepted or transferred, not emerging as expected.
Write-Offs Facilities are written off against the related provision for impairment when they are assessed as partially or fully uncollectable, and after proceeds from the realisation of any collateral have been received. Where individual provisions recognised in previous periods have subsequently decreased or are no longer required, such impairment losses are reversed in the current period income statement.

ANZ Basel III Pillar 3 Disclosure March 2018
This page has been intentionally left blank

ANZ Basel III Pillar 3 Disclosure March 2018
Average Risk Weights (Credit RWA / EAD*)