Embed Size (px)
Citation preview

Baring Asset
Management Limited
155 Bishopsgate,
London, EC2M 3XY
Tel +44 (0)20 7628 6000
Fax +44 (0)20 7638 7928
www.barings.com
Authorised and regulated by the
Financial Conduct Authority
Baring Global Emerging Markets Fund
Fund Manager Forum Vienna
April 2015
Isabelle Irish
CONFIDENTIAL
FOR PROFESSIONAL INVESTORS ONLY

2
Global Emerging Markets
Team and resource
Source: Barings, 31 December 2014. Years of experience: Investment experience; Time at Barings
Quant Team 5 members, average
11 years investment
experience
GEMS Best Ideas Panel 3 members
average 17 years investment experience
Jean-Louis Scandella Head of Equities
22 ; 1
William Palmer Investment Manager
22 ; 4
Isabelle Irish Investment Manager
10 ; 2
Specialist Analysts, Portfolio Managers and Team Heads 61 members, average 14 years investment experience
Frontiers
• Global
• MENA
Developed
• Over 50% of the
company is exposed
to Emerging
Markets
Regional Emerging
• EMEA
• Latin America
• Asia Pacific
• Greater China
• ASEAN
Country Emerging
• China
• Russia
• Korea
Global Sectors
• Technology
• Pharmaceuticals
• Commodities

3
Corporate overview
Source: Barings, 31 December 2014
• Providing investment management services in emerging and developed markets, asset
allocation and specialist fixed income to investors worldwide
– Current assets under management US$42.3billion
• Operating in 11 countries with professionals from 35 different nations
– 122 investment professionals
– Investors based in London, Hong Kong, Seoul, Tokyo and Boston
• Mandates tailored to client needs
– Segregated accounts for institutions: specialist and international capability in equities and fixed income
– Pooled funds for institutions, distributors and product assemblers: high alpha regional equity and fixed
income funds and multi asset expertise
An international investment management company
with a history dating back to 1762
London, Boston, Dubai, Frankfurt, Geneva, Hong Kong, Kaohsiung, Paris,
San Francisco, Seoul, Taipei, Tokyo, Toronto

4
What sets us apart
Genuinely high conviction portfolios
• High active share
• Best ideas orientated
• Rigorously applied through Portfolio Scorecard
Well defined quality GARP philosophy
• Emphasis on Quality, Growth and Upside
• Identifying strong businesses with good expansion potential and attractive valuations
• Three to five year time horizon gives us a non-consensus perspective
In-depth, in-house, bottom-up research
• Focused approach to identifying the best opportunities
• Robust peer review encourages innovative thinking
• Company Scorecards provide a structured approach, common across all teams
… a strong platform for strong performance
5
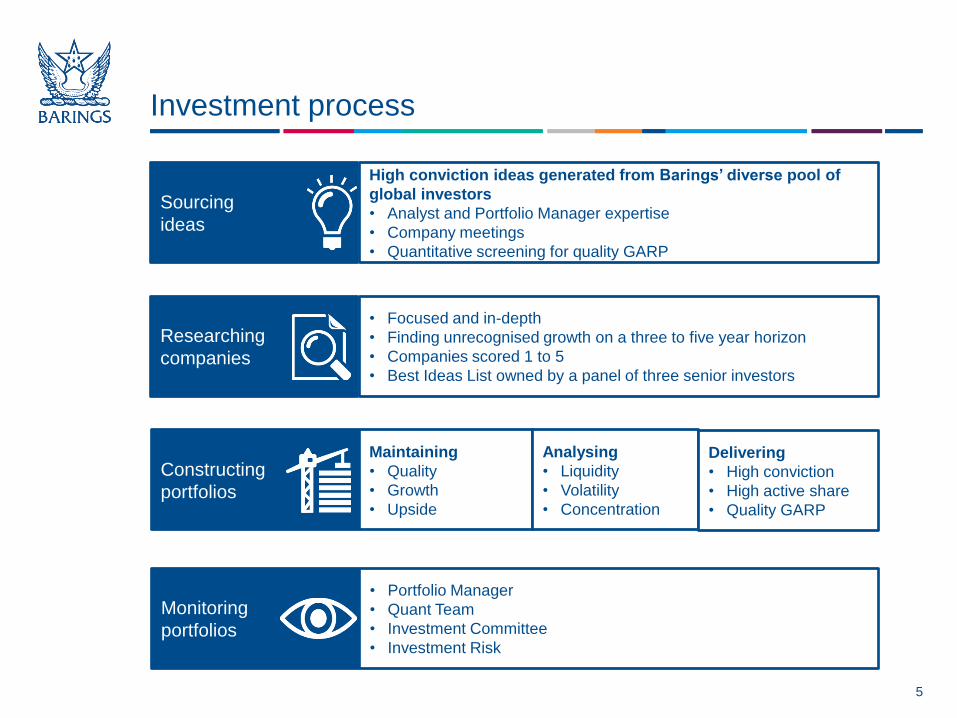
Investment process
• Focused and in-depth
• Finding unrecognised growth on a three to five year horizon
• Companies scored 1 to 5
• Best Ideas List owned by a panel of three senior investors
Researching
companies
Maintaining
• Quality
• Growth
• Upside
Constructing
portfolios
Monitoring
portfolios
High conviction ideas generated from Barings’ diverse pool of
global investors
• Analyst and Portfolio Manager expertise
• Company meetings
• Quantitative screening for quality GARP
Sourcing
ideas
Analysing
• Liquidity
• Volatility
• Concentration
• Portfolio Manager
• Quant Team
• Investment Committee
• Investment Risk
Delivering
• High conviction
• High active share
• Quality GARP

6
Macroeconomic ‘tourism’ does not work GDP and EM returns have a correlation of –0.41
Source: Is Economic Growth Good for Investors?, Jay R. Ritter, Journal Of Applied Corporate Finance, Summer 2012. Basis: Geometric mean annual real GDP per capita growth
rates (using constant local currency units) sourced from WDI. Stock returns in local currency terms from Datastream, where MSCI total return indices are used with CPI deflators
from the World Bank’s World Development Indicators. All data or the period 1988–2011 except for the BRIC countries, where the period is 1993-2011 for Brazil, India and China,
and 1995-2011 for Russia.
-10
-5
0
5
10
15
Russia China India Brazil Mexico
Real per capita GDP Real return
7
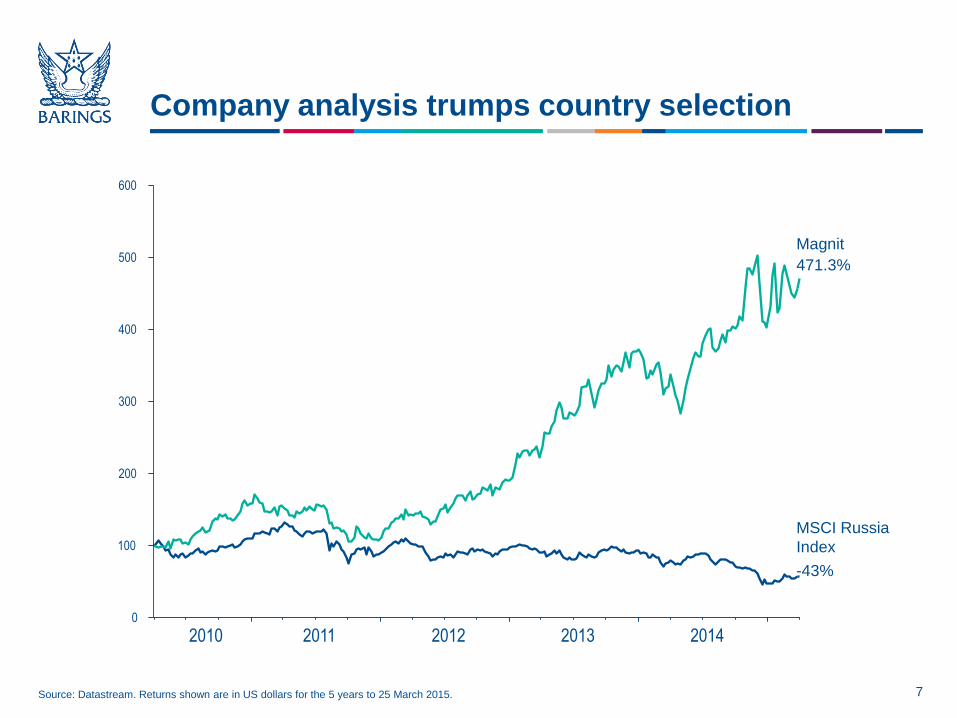
Company analysis trumps country selection
Source: Datastream. Returns shown are in US dollars for the 5 years to 25 March 2015.
-43%
2010 2011 2012 2013 2014 0
100
200
300
400
500
600
471.3%
MSCI Russia
Index
Magnit

8
Finding unrecognised growth
Researching companies
Consistent stock scoring methodology
• Franchise
‒ Competitive advantage
‒ Efficiency
‒ Stability
• Management
‒ Competence
‒ Commitment
‒ Alignment with
shareholder interest
• Balance sheet
Quality (1 to 5)
Quality
Helps to drive sustainable,
steady results
• Last three years net
earnings growth
• 12 month earnings growth
• Next five years earnings
growth
Growth (1 to 5)
Growth
Provides a long term
platform for
outperformance
• Discounted earnings over
five years
• Next 12 month P/E
‒ Compared to history
‒ Compared to sector
‒ Compared to peer
• P/B relative to ROE and
cost of capital
Upside (1 to 5)
Upside
Measured using a
disciplined, discounted
earnings approach

9
Systematic analysis of the portfolio
GEMS portfolio scorecard
Source: Barings 31 March 2015. Data relates to Baring Global Emerging Markets Fund
** Absolute Figures
Systematic quantitative tools support the portfolio managers in building
portfolios in line with their objectives
Conviction Growth
Quality Upside/Valuation
85,43
13,72 5,68
25,87 33,05
0 10 20 30 40 50 60 70 80 90
100
Active Share Active Weight (Top 5)
Small Holdings (<1% )
Small/Mid Weight (<$5bn)
Off Benchmark
0,49
0,04
-0,10
0,09 0,00
-0,60
-0,40
-0,20
0,00
0,20
0,40
0,60
ROE Debt to Equity
FCFY EPS Growth Stability
Volatility
0,49
0,14
0,39 0,32
15,80%
-0,60
-0,40
-0,20
0,00
0,20
0,40
0,60
Price/Book (Trailing)
P/E (12Mth Fwd)
DY (Trailing) EV/EBITDA Upside (%)**
0,55
0,23
0,56
-0,06
15,50%
-0,60
-0,40
-0,20
0,00
0,20
0,40
0,60
EPS Growth (3Yrs
Trailing)
EPS Growth (12Mth Fwd)
Sustainable Growth Rate
EPS Revisions
EPS Growth (BAM) %**

10
Style characteristics
Consistent with GARP approach
Source: Barings and Style Research (Index source), 31 March 2015
Metrics GEMS MSCI Emerging Markets
Return on equity (ROE) 24.0% 17.7%
Debt/equity ratio 90.1% 94.8%
Three year EPS growth 24.8% 11.3%
Dividend yield 1.8% 2.6%
P/E FY1 13.6x 12.5x
Active share 85% 0%
Market cap (US$Bn) 40.2 48.2
Number of holdings (ex cash) 50 836

11
Sector and country breakdown
Sector breakdown Country breakdown
Source: Barings March 2015
Country and sector breakdown are
a by product of bottom-up stock selection
Consumer Discretionary
4%
Consumer Staples
8%
Financials 34%
Health Care 5%
Industrials 9%
Information Technology
27%
Materials 1%
Tele communication
Services 3%
Utilities 4%
Other 5%
Brazil; 6,63
China; 27,01
Hong Kong; 4,66
India; 8,26
Indonesia; 3,38
Malaysia; 2,47
Mexico; 4,03
Russia; 2,16
South Africa; 8,66
South Korea; 4,05
Taiwan; 9,33
Thailand; 1,59
Turkey; 3,39
United Arab Emirates; 0,29
United Kingdom; 3,63
United States; 3,91

12
Concepts in our portfolio
Source: Barings 31 December 2014. Data relates to Baring Global Emerging Markets Fund
Middle class
emergence
Infrastructure
enhancement
South/South trade

13
Spot the Difference
What is the difference between these payment terminals?
Source: hansab.com, Codeo, chargecardsystems.com
14
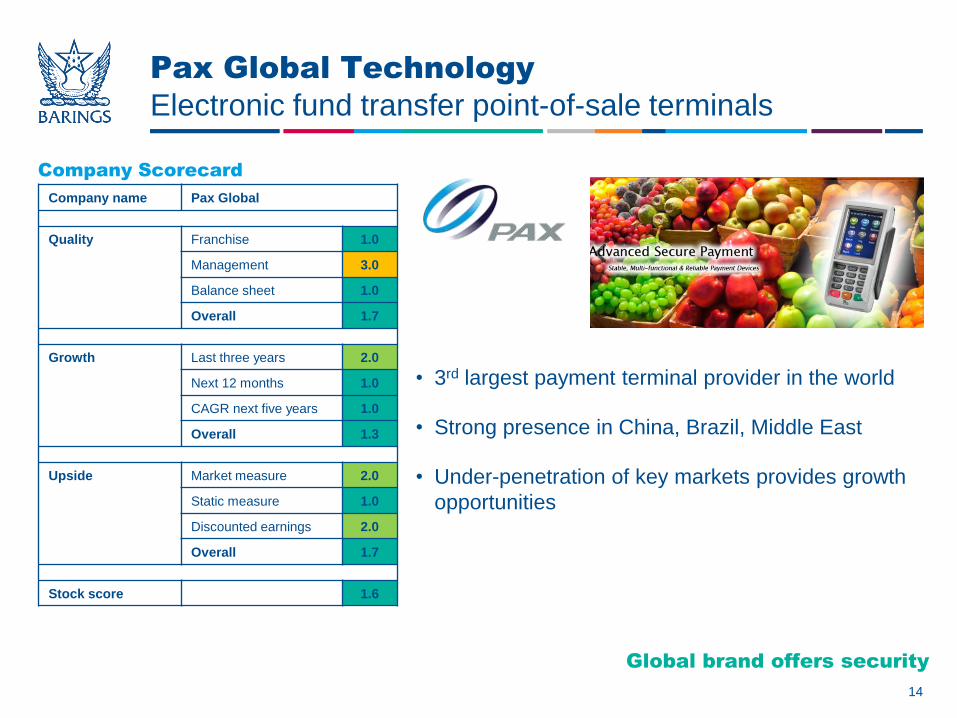
Pax Global Technology
Electronic fund transfer point-of-sale terminals
• 3rd largest payment terminal provider in the world
• Strong presence in China, Brazil, Middle East
• Under-penetration of key markets provides growth
opportunities
Company name Pax Global
Quality Franchise 1.0
Management 3.0
Balance sheet 1.0
Overall 1.7
Growth Last three years 2.0
Next 12 months 1.0
CAGR next five years 1.0
Overall 1.3
Upside Market measure 2.0
Static measure 1.0
Discounted earnings 2.0
Overall 1.7
Stock score 1.6
Global brand offers security
Company Scorecard

15
BB Seguridade
Brazilian insurance
Image from Forbes
Strong distribution

16
BB Seguridade
Brazilian insurance
Image from Arenadopavini
Company name BB Seguridade
Quality Franchise 2.0
Management 4.0
Balance sheet 2.0
Overall 2.7
Growth Last three years 1.0
Next 12 months 1.0
CAGR next five years 1.0
Overall 1.0
Upside Market measure 5.0
Static measure 5.0
Discounted earnings 1.0
Overall 3.7
Stock score 2.4
• Life insurance, credit life, rural insurance,
pension, premium bonds.
• Extensive distribution through Banco do Brasil
branches.

17
My EG Services Malaysia government services provided to citizens via internet
Image from MYEG website
90% market share

18
My EG Services e-services for Malaysia government
Images from bazariaonline and 48smart.blogspot April 2015
Company name My EG Services
Quality Franchise 2.0
Management 1.5
Balance sheet 1.5
Overall 1.7
Growth Last three years 1.0
Next 12 months 1.0
CAGR next five years 1.0
Overall 1.0
Upside Market measure 5.0
Static measure 5.0
Discounted earnings 1.0
Overall 3.7
Stock score 2.1
• Vehicle registration
• Driving licence
• Electronic bill payment
• Foreign worker permit renewal
All online or at 1000 kiosks around Malaysia

19
Historic performance
Gross returns
Past performance is not a guide to future performance
Source: Barings, 31 March 2015. **Inception 29th February 1992, (end-of-day pricing).
Benchmark MSCI Emerging Markets Total Return Index with gross dividends
1,53
4,3
0,04
0,57
7,53
2,28
0,79 0,67
2,08
7,30
0
1
2
3
4
5
6
7
8
YTD 1 Year(s) 3 Year(s) 5 Year(s) SI**
Baring Global Emerging Market Fund MSCI Emerging Markets

20
Contributors & detractors to performance
12 months to 31 March 2015
Source: Barings, 31 March 2015. Please refer to Important Information
Contributors
Bottom-up stock selection drives performance
Detractors
Company Contribution to
portfolio (%)
China Life Insurance 1.2
Ping An Insurance 1.0
Taiwan Semiconductor 0.9
Naspers 0.9
Luxoft 0.7
Company Detraction from
portfolio (%)
Mail.Ru Group -0.7
CCR -0.7
Hyundai Motor -0.7
Turkiye Halk Bankasi -0.6
National Bank of Greece -0.5

21
Barings Global Emerging Market Fund
• Investment objective – To seek long-term capital growth primarily through investment
in a diversified portfolio of developing country securities.
• Co-manager structure – Jean-Louis Scandella, William Palmer, Isabelle Irish
• Investment universe – MSCI Emerging Markets
– MSCI Frontier Markets
– MSCI World components where a substantial percentage of that
company is exposed to Emerging Markets
• Fund information – Launched 24 February 1992
– AUM €378.6
– Irish Authorised UCITS
– Daily dealing
• Share class information – XD Date 01 May
– Dividend paid by: 30 June
– ISIN: IE0004850503; KLASSE A EUR AUSSCHÜTTUNG
– ISIN: IE00B3NB3563; KLASSE I EUR THESAURIERUNG
– Bloomberg code: BRGGEMI ID; Lipper ID: 60000664
Source: Barings, Feburary 2015

22
Contact Details
Heike Tajariol Relationship Manager Germany & Austria
+49 (0)69 7169 1534
Hasret Albayrak Client Service & Sales Support
+49 69 7169 1821

23
Important Information
For Professional Investors/Advisers only. It should not be distributed to or relied on by Retail Investors. This document is approved and issued by Baring
Asset Management Limited, authorised and regulated by the Financial Conduct Authority and in jurisdictions other than the UK it is provided by the appropriate Baring
Asset Management company/affiliate whose name(s) and contact details are specified herein. The information in this document does not constitute investment, tax,
legal or other advice or recommendation. It is not an invitation to subscribe and is for information only.
Investment involves risk. The value of any investments and any income generated may go down as well as up and is not guaranteed. Past performance is not a
guide to future performance. Where yields have been quoted they are not guaranteed. Changes in rates of exchange may have an adverse effect on the value,
price or income of an investment. There are additional risks associated with investments (made directly or through investment vehicles which invest) in emerging or
developing markets. Investments in higher yielding bonds issued by borrowers with lower credit ratings may result in a greater risk of default and have a negative
impact on income and capital value. Income payments may constitute a return of capital in whole or in part. Income may be achieved by foregoing future capital
growth. We reasonably believe that the information contained herein from 3rd party sources, as quoted, is accurate as at the date of publication. The information and
any opinions expressed herein may change at any time. Companies and employees of the Baring Asset Management group may hold positions in the investment(s)
concerned. This document may include internal portfolio construction guidelines. As guidelines the fund is not required to and may not always be within these limits.
These guidelines are subject to change without prior notice and are provided for information purposes only.
This document may include forward looking statements which are based on our current opinions, expectations and projections. W e undertake no obligation to update
or revise any forward looking statements. Actual results could differ materially from those anticipated in the forward looking statements.
This document must not be used, or relied on, for purposes of any investment decisions.
Before investing in any product, we recommend that appropriate financial advice should be sought. The Key Investor Information Document (KIID) must be received
and read. All other relevant documents relating to the product such as the Report and Accounts and Prospectus should also be read. Compensation arrangements
under the Financial Services and Markets Act 2000 of the United Kingdom will not be available in respect to any Offshore Fund.
Research Material
Baring Asset Management only produces research for its own internal use. Where details of research are provided in this document it is provided as an example of
research undertaken by Baring Asset Management and must not be used, or relied upon, for the purposes of any investment decisions. The information and opinions
expressed herein may change at anytime.
For data sourced from Morningstar: © Morningstar, Inc. All Rights Reserved. The information contained herein: (1) is proprietary to Morningstar and/or its content
providers; (2) may not be copied or distributed; and (3) is not warranted to be accurate, complete or timely. Neither Morningstar nor its content providers are
responsible for any damages or losses arising from any use of this information.
Version 10/SD
Compliance Frankfurt: April 2015