Embed Size (px)
Citation preview

GENERAL MILLS Barc lays Global Consumer
Staples Conference
September 7, 2017

Don MulliganEVP, Chief Financial Officer

This presentation contains forward-looking statements within the meaning of the Private Securities Litigation Reform Act of 1995that are based on management’s current expectations and assumptions. These forward-looking statements are subject to certainrisks and uncertainties that could cause actual results to differ materially from the potential results discussed in the forward-lookingstatements. In particular, our predictions about future net sales and earnings could be affected by a variety of factors, including:competitive dynamics in the consumer foods industry and the markets for our products, including new product introductions,advertising activities, pricing actions and promotional activities of our competitors; economic conditions, including changes ininflation rates, interest rates, tax rates, or the availability of capital; product development and innovation; consumer acceptance ofnew products and product improvements; consumer reaction to pricing actions and changes in promotion levels; acquisitions ordispositions of businesses or assets; changes in capital structure; changes in the legal and regulatory environment, includinglabeling and advertising regulations and litigation; impairments in the carrying value of goodwill, other intangible assets, or otherlong-lived assets, or changes in the useful lives of other intangible assets; changes in accounting standards and the impact ofsignificant accounting estimates; product quality and safety issues, including recalls and product liability; changes in consumerdemand for our products; effectiveness of advertising, marketing and promotional programs; changes in consumer behavior, trendsand preferences, including weight loss trends; consumer perception of health-related issues, including obesity; consolidation in theretail environment; changes in purchasing and inventory levels of significant customers; fluctuations in the cost and availability ofsupply chain resources, including raw materials, packaging and energy; disruptions or inefficiencies in the supply chain;effectiveness of restructuring and cost savings initiatives; volatility in the market value of derivatives used to manage price risk forcertain commodities; benefit plan expenses due to changes in plan asset values and discount rates used to determine planliabilities; failure or breach of our information technology systems; foreign economic conditions, including currency rate fluctuations;and political unrest in foreign markets and economic uncertainty due to terrorism or war. The company undertakes no obligation topublicly revise any forward-looking statements to reflect any future events or circumstances.
A Reminder on Forward-looking Statements
3

General Mills Overview
4
Purpose: We serve the world by making food
people love
Goal: Create market leading growth to
deliver top tier shareholder returns
Strategy: Consumer First
$15.6B Net Sales in F17
38,000 Employees
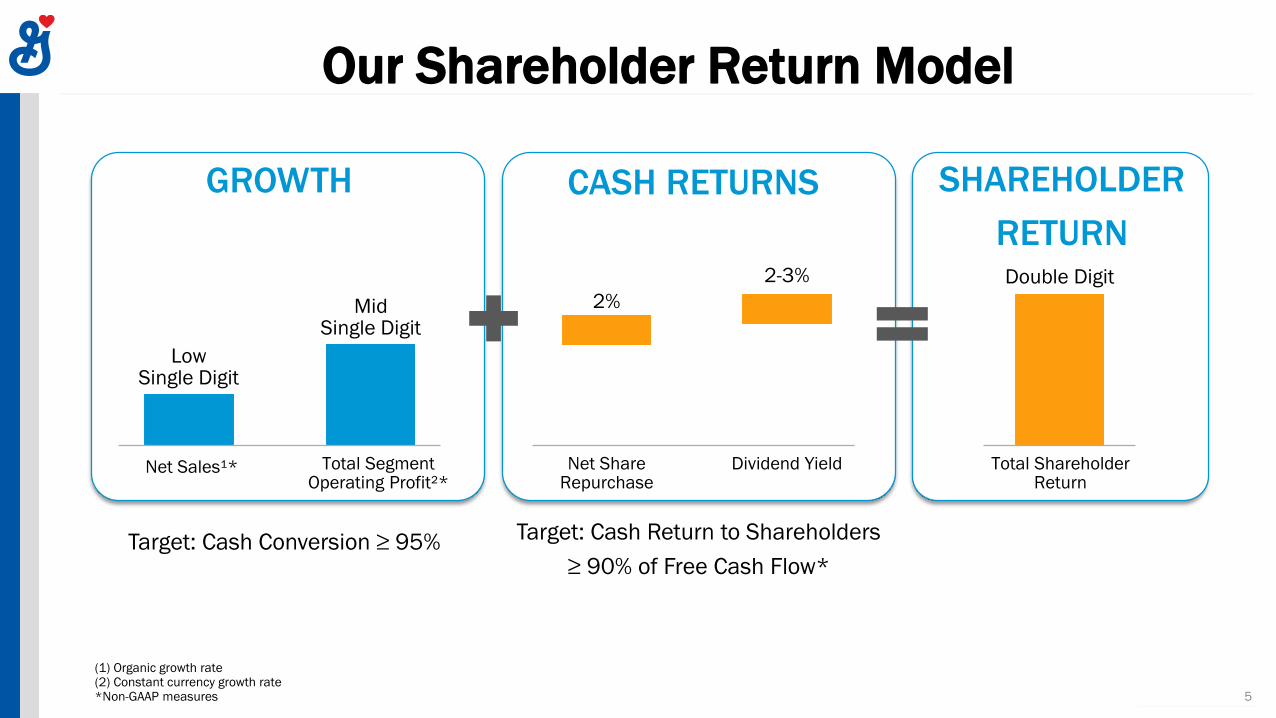
(1) Organic growth rate(2) Constant currency growth rate*Non-GAAP measures
Our Shareholder Return Model
Target: Cash Conversion ≥ 95% Target: Cash Return to Shareholders
≥ 90% of Free Cash Flow*
GROWTH
LowSingle Digit
Net Sales¹* Total Segment Operating Profit²*
MidSingle Digit
Total Shareholder Return
Double Digit
Dividend YieldNet Share Repurchase
CASH RETURNS SHAREHOLDER
RETURN
2%
2-3%
5
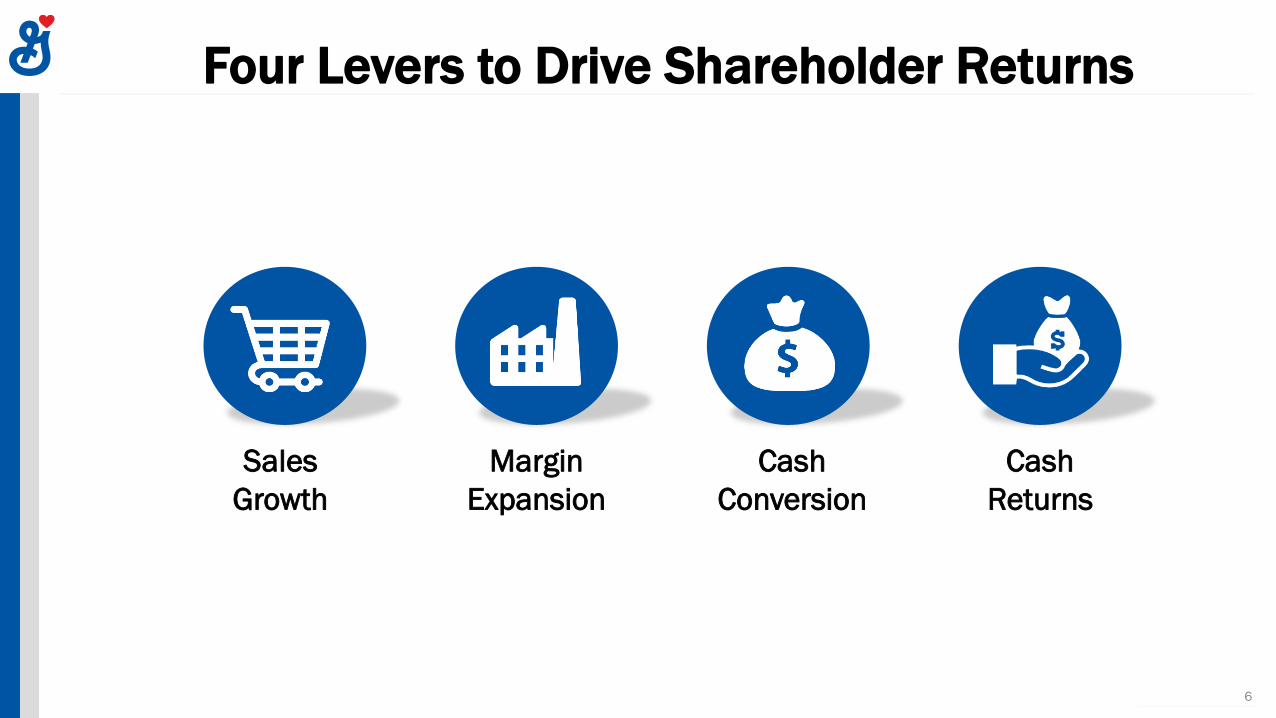
Four Levers to Drive Shareholder Returns
6
Sales
Growth
Margin
Expansion
Cash
Conversion
Cash
Returns
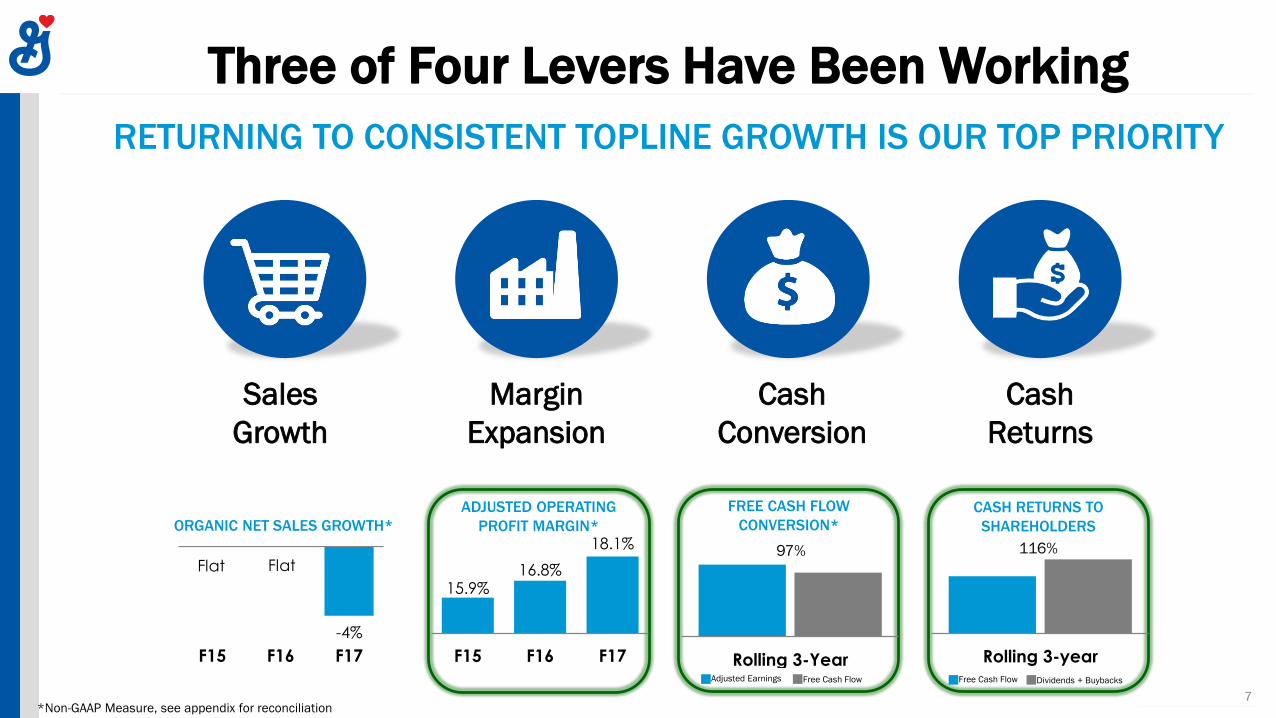
RETURNING TO CONSISTENT TOPLINE GROWTH IS OUR TOP PRIORITY
Three of Four Levers Have Been Working
7*Non-GAAP Measure, see appendix for reconciliation
Sales
Growth
Margin
Expansion
Cash
Conversion
Cash
Returns
ORGANIC NET SALES GROWTH*
ADJUSTED OPERATING
PROFIT MARGIN*
FREE CASH FLOW
CONVERSION*
CASH RETURNS TO
SHAREHOLDERS
-4%
F15 F16 F17
15.9%16.8%
18.1%
F15 F16 F17 Rolling 3-YearAdjusted Earnings Free Cash Flow
97%
Rolling 3-year
116%
Free Cash Flow Dividends + Buybacks
FlatFlat
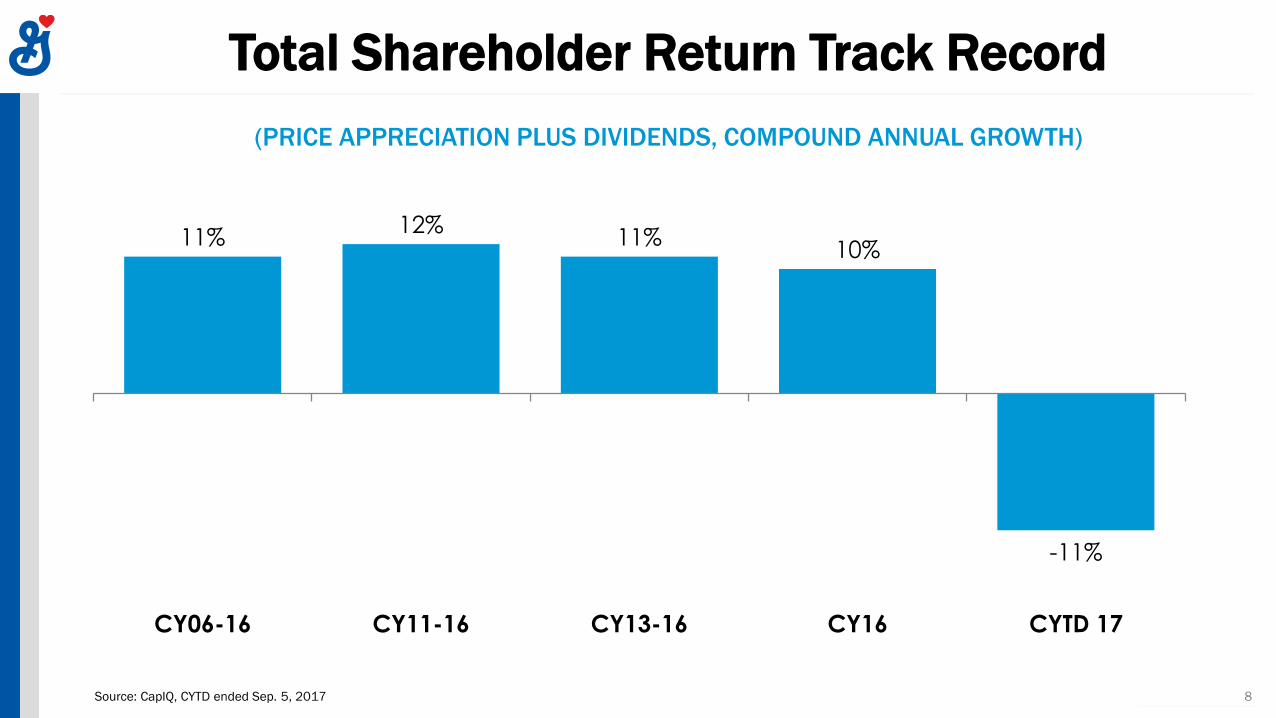
(PRICE APPRECIATION PLUS DIVIDENDS, COMPOUND ANNUAL GROWTH)
Total Shareholder Return Track Record
Source: CapIQ, CYTD ended Sep. 5, 2017
11%12%
11%10%
-11%
CY06-16 CY11-16 CY13-16 CY16 CYTD 17
8

• Grow Cereal Globally (Including CPW)
• Improve U.S. Yogurt Through Innovation
• Invest in Differential Growth Opportunities
− Häagen-Dazs
− Snack Bars
− Old El Paso
− Natural & Organic
• Manage Foundation Brands with Appropriate Investment
Fiscal 2018 Growth Priorities
9
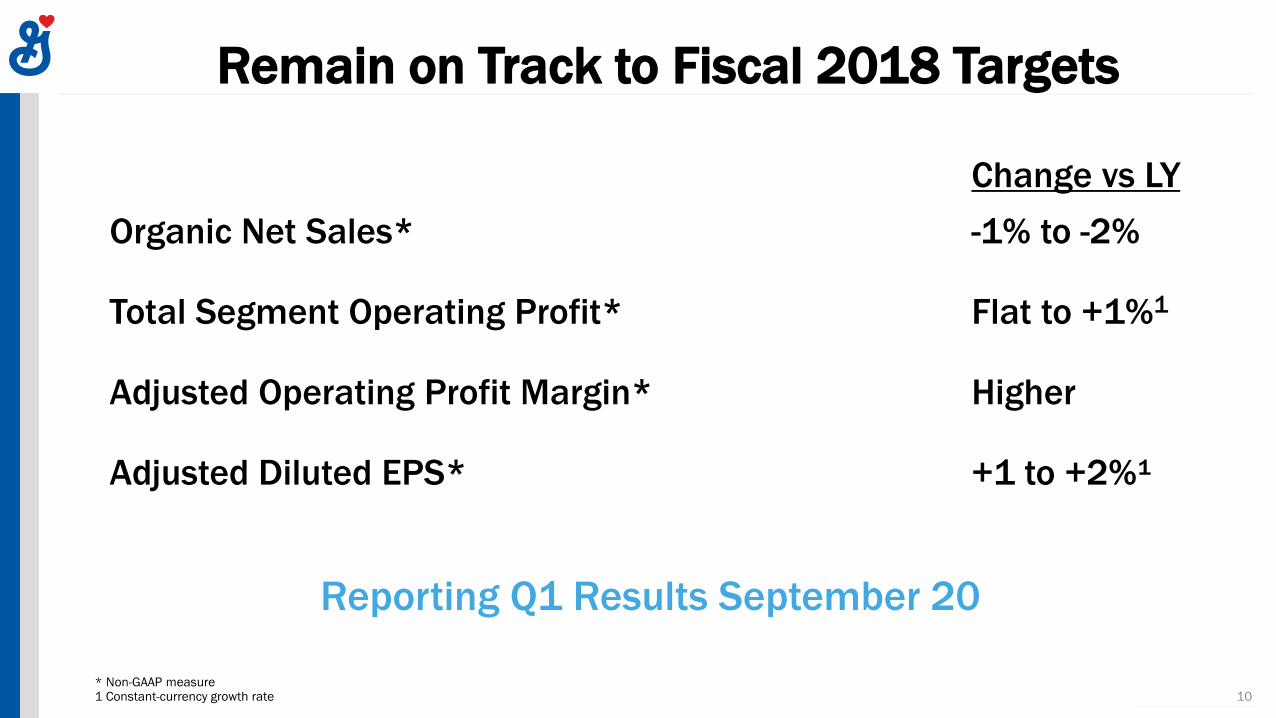
Change vs LY
Organic Net Sales* -1% to -2%
Total Segment Operating Profit* Flat to +1%1
Adjusted Operating Profit Margin* Higher
Adjusted Diluted EPS* +1 to +2%¹
Reporting Q1 Results September 20
Remain on Track to Fiscal 2018 Targets
* Non-GAAP measure1 Constant-currency growth rate 10

• As You Enter Fiscal 2018, What is Changing at General Mills?
• What are you Seeing in the Food Retail Environment in the U.S.?
• Can General Mills Return to Consistent Topline Growth?
ADDRESS INVESTORS’ TOP FAQS IN RECENT MONTHS
Today’s Agenda
11
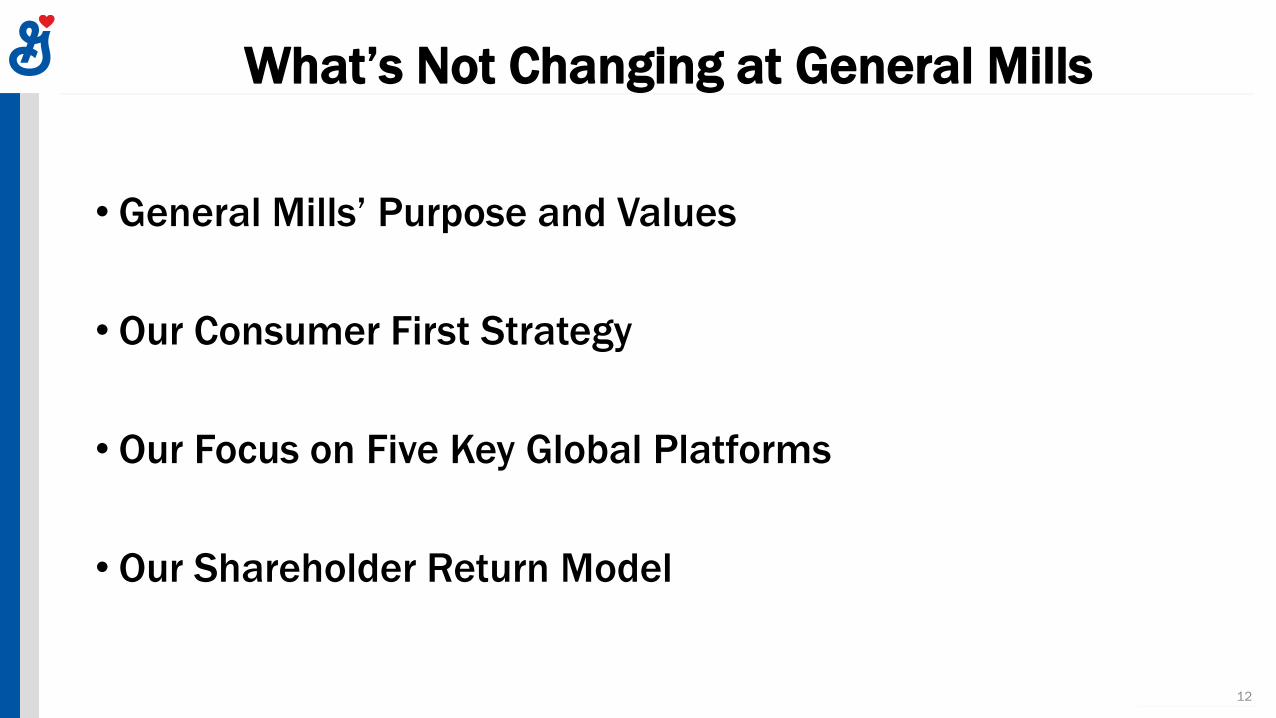
• General Mills’ Purpose and Values
• Our Consumer First Strategy
• Our Focus on Five Key Global Platforms
• Our Shareholder Return Model
What’s Not Changing at General Mills
12

• Jeff Harmening Appointed CEO on June 1
• New Business Segments
• Flatter Organization & More Global Senior Leadership
• Strengthening Capabilities with External Talent
New Global Organization Structure
13
Realigned
Global
Segments
New Global
Capabilities
Global
Functions

Global Prioritization
14
Oui by Yoplait in the U.S. Häagen-Dazs Stick Bars in Asia and Europe Yoplait Expansion in China
Annie’s on TV for the First Time Old El Paso Brand Building Global Häagen-Dazs Campaign
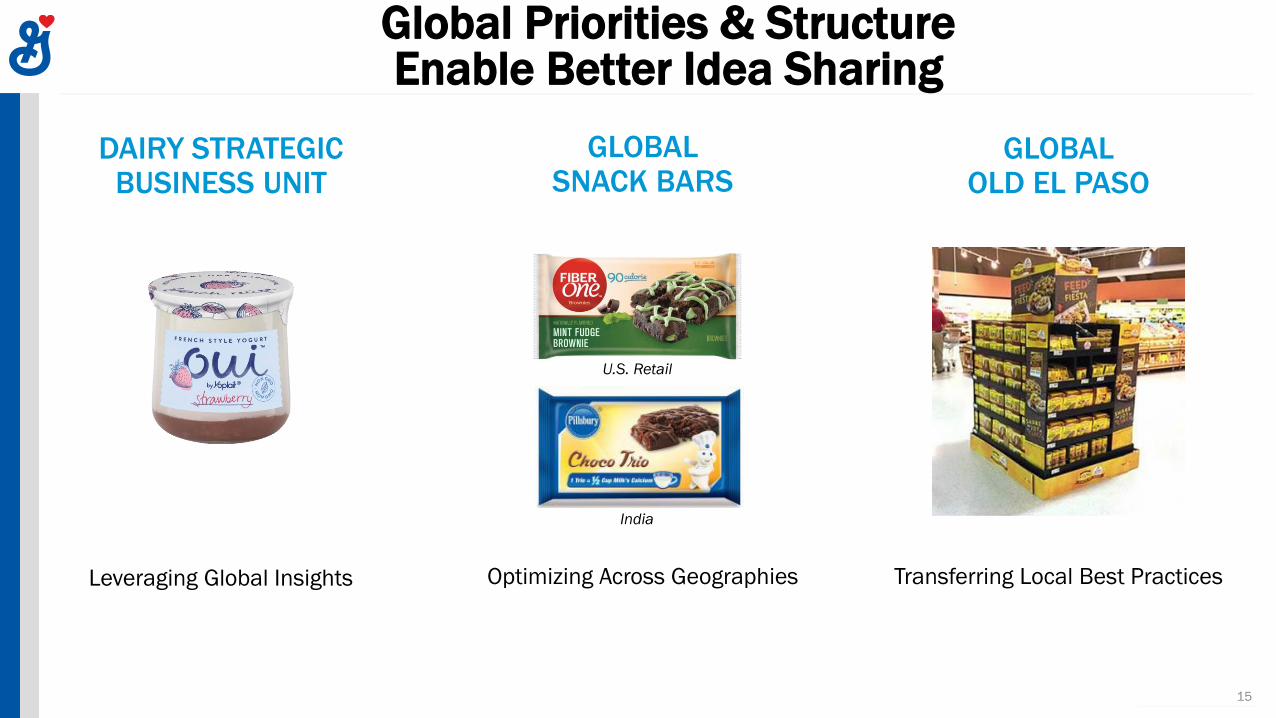
Global Priorities & Structure Enable Better Idea Sharing
15
DAIRY STRATEGIC BUSINESS UNIT
GLOBAL SNACK BARS
GLOBAL OLD EL PASO
U.S. Retail
India
Optimizing Across GeographiesLeveraging Global Insights Transferring Local Best Practices
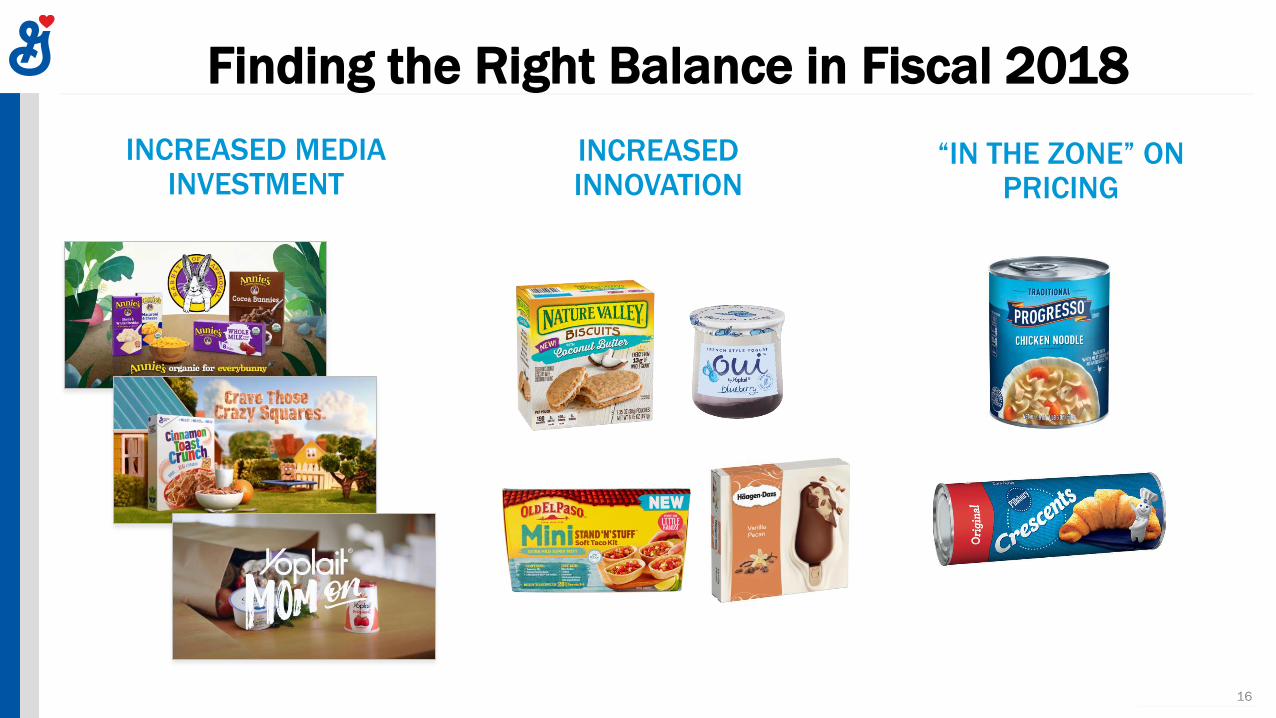
Finding the Right Balance in Fiscal 2018
16
INCREASED INNOVATION
“IN THE ZONE” ON PRICING
INCREASED MEDIA INVESTMENT

• As You Enter Fiscal 2018, What is Changing at General Mills?
• What are you Seeing in the Food Retail Environment in the U.S.?
• Can General Mills Return to Consistent Topline Growth?
ADDRESS INVESTORS’ TOP FAQS IN RECENT MONTHS
Today’s Agenda
17
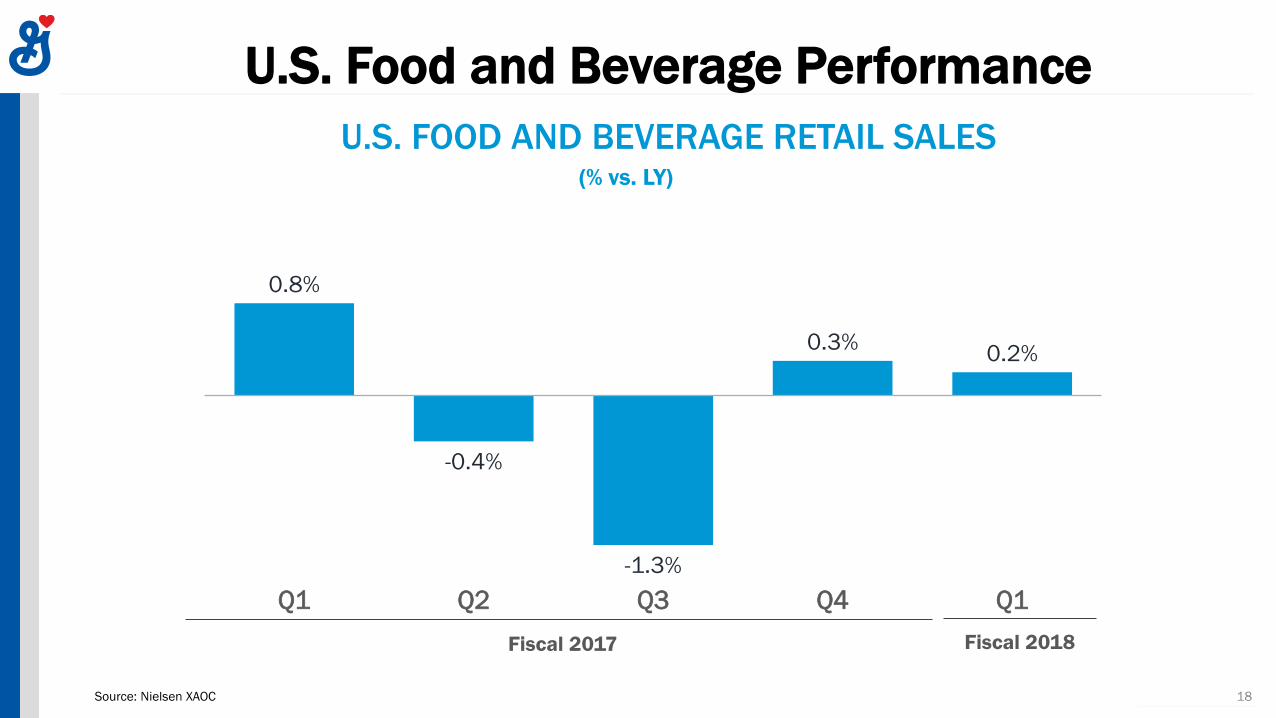
U.S. FOOD AND BEVERAGE RETAIL SALES
U.S. Food and Beverage Performance
18Source: Nielsen XAOC
0.8%
-0.4%
-1.3%
0.3%0.2%
Q1 Q2 Q3 Q4 Q1
(% vs. LY)
Fiscal 2017 Fiscal 2018

Private Label in the U.S.
19Source: Nielsen XAOC, 26-week data
18.5 18.4 18.0 18.4
10.3 10.1 9.7 10.0
U.S. PRIVATE LABEL
RETAIL DOLLAR SHARE (% OF SALES)
Total Food & Beverage General Mills Categories
• Private Label Share Low in General Mills’ Categories
• Share Relatively Flat Across Industry
• Innovation is Best Defense Against Private LabelJul ‘14 Jul ‘15 Jul ‘16 Jul ‘17
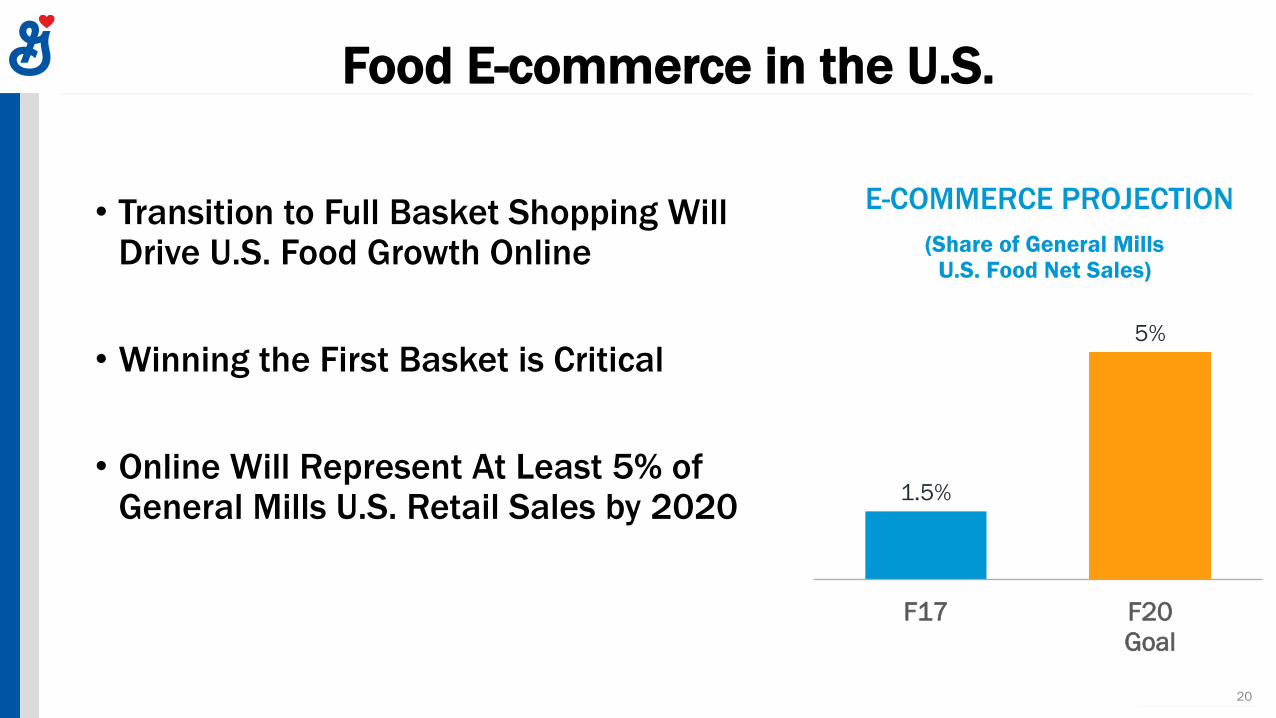
• Transition to Full Basket Shopping Will Drive U.S. Food Growth Online
• Winning the First Basket is Critical
• Online Will Represent At Least 5% of General Mills U.S. Retail Sales by 2020
Food E-commerce in the U.S.
20
E-COMMERCE PROJECTION
(Share of General Mills U.S. Food Net Sales)
1.5%
5%
F17 F20
Goal

U.K. RETAIL SALES DOLLAR SHARE INDEX
(E-COMMERCE / TRADITIONAL)
21
65
128
Private Label General Mills
Food E-commerce in Europe
Source: Nielsen/IRI, 52 weeks ended Jun 2017
• Private Label Share Under-indexes Online in Europe, Even in High P/L Markets Like the U.K.
• General Mills Brands are Advantaged Online
• Similar Dynamics Playing Out in the U.S.

• As You Enter Fiscal 2018, What is Changing at General Mills?
• What are you Seeing in the Food Retail Environment in the U.S.?
• Can General Mills Return to Consistent Topline Growth?
ADDRESS INVESTORS’ TOP FAQS IN RECENT MONTHS
Today’s Agenda
22
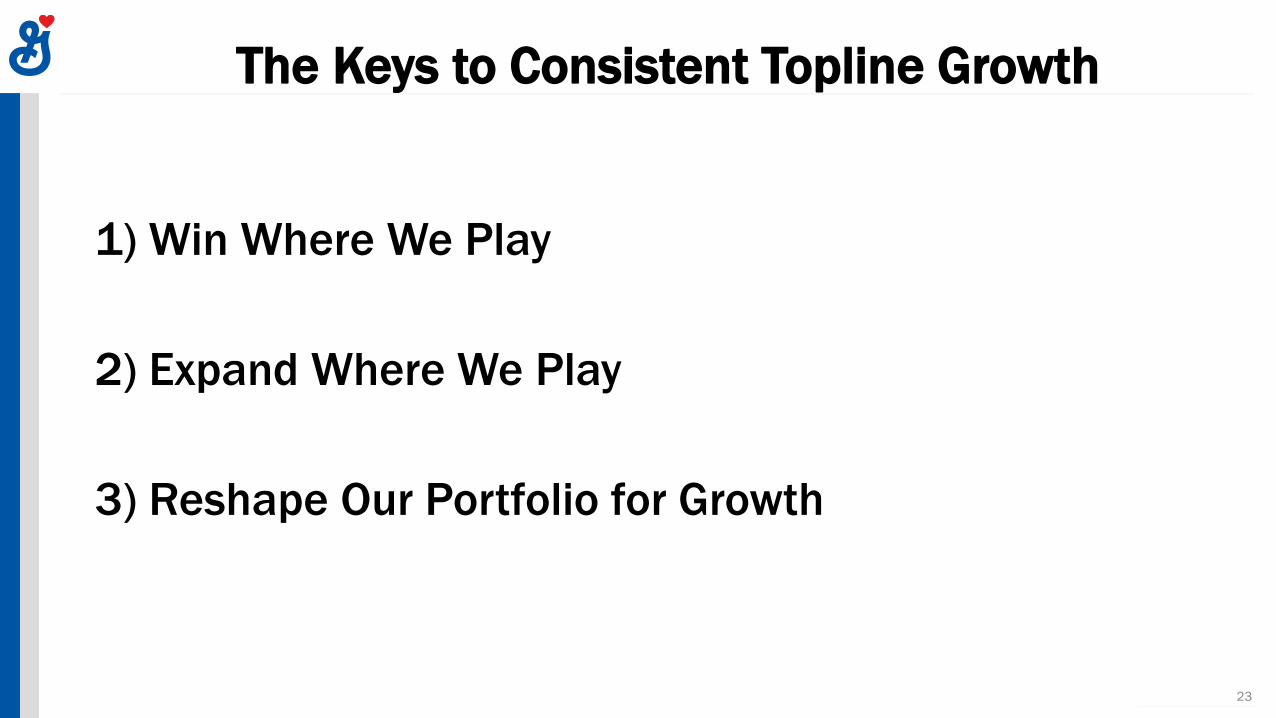
1) Win Where We Play
2) Expand Where We Play
3) Reshape Our Portfolio for Growth
The Keys to Consistent Topline Growth
23

Win Where We Play
Source: Euromonitor, Calendar 2016
GLOBAL CATEGORY2016
RETAIL SALESPROJECTED 5-YR. CGR
RTE Cereal $23 Billion +LSD
Ice Cream $64 Billion +MSD
Yogurt $84 Billion +HSD
Convenient Meals $89 Billion +MSD
Sweet & Savory Snacks $295 Billion +MSD
24
POSITIVE OUTLOOK IN OUR GLOBAL CATEGORIES

FISCAL 2018 PLAN HIGHLIGHTS
Win Where We Play
25
TASTE NEWS IN U.S. CEREAL FUNDAMENTAL INNOVATION IN U.S. YOGURT
INNOVATION AND MEDIA SUPPORT ON NATURE VALLEY HÄAGEN-DAZS INNOVATION IN EUROPE
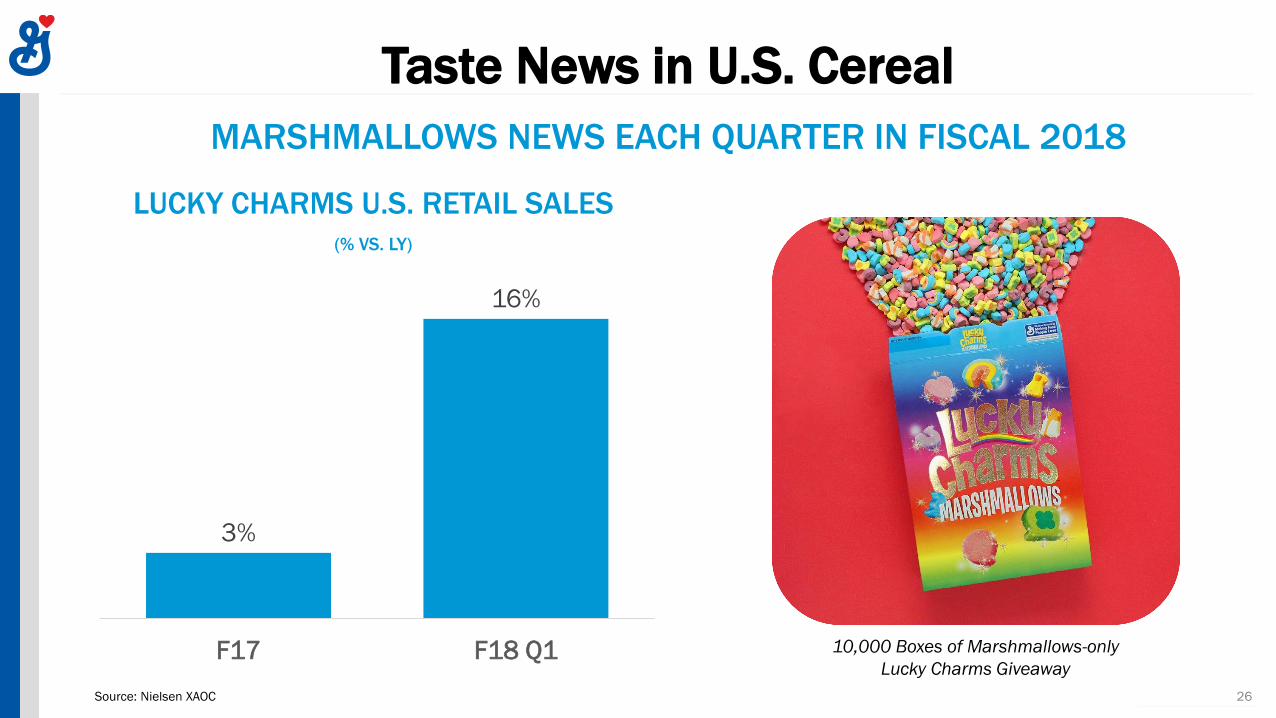
3%
16%
F17 F18 Q1
MARSHMALLOWS NEWS EACH QUARTER IN FISCAL 2018
Taste News in U.S. Cereal
26Source: Nielsen XAOC
LUCKY CHARMS U.S. RETAIL SALES
(% VS. LY)
10,000 Boxes of Marshmallows-only
Lucky Charms Giveaway
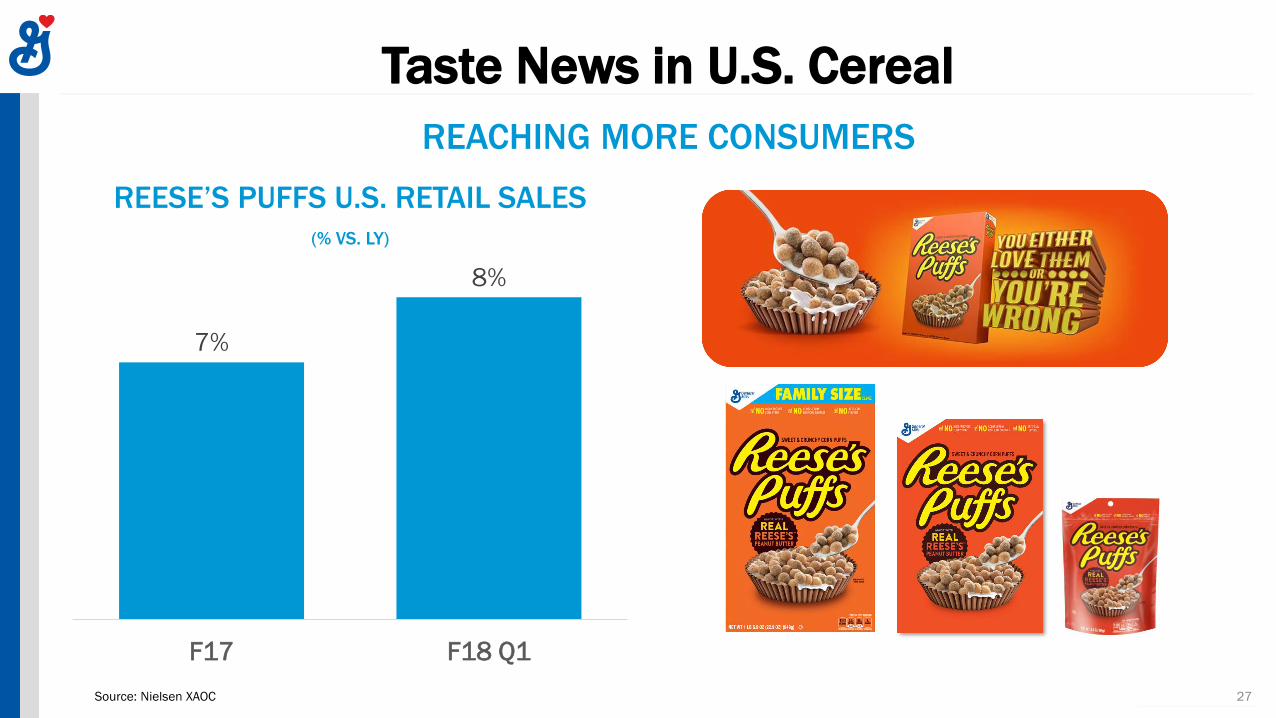
Taste News in U.S. Cereal
27Source: Nielsen XAOC
REESE’S PUFFS U.S. RETAIL SALES
(% VS. LY)
7%
8%
F17 F18 Q1
REACHING MORE CONSUMERS

• Outperforming Other Recent Category Innovations
• Distribution Still Building
• Media Support Just Beginning
Fundamental Innovation in U.S. Yogurt
28Source: Nielsen XAOC
LARGEST U.S. YOGURT LAUNCHES IN F13-F18RETAIL SALES INDEX
(FIRST SIX WEEKS RETAIL SALES, NEW PRODUCT VS. OUI)
100
78
54 51 46
Oui Launch
A
Launch
B
Launch
C
Launch
D
OUI BY YOPLAIT
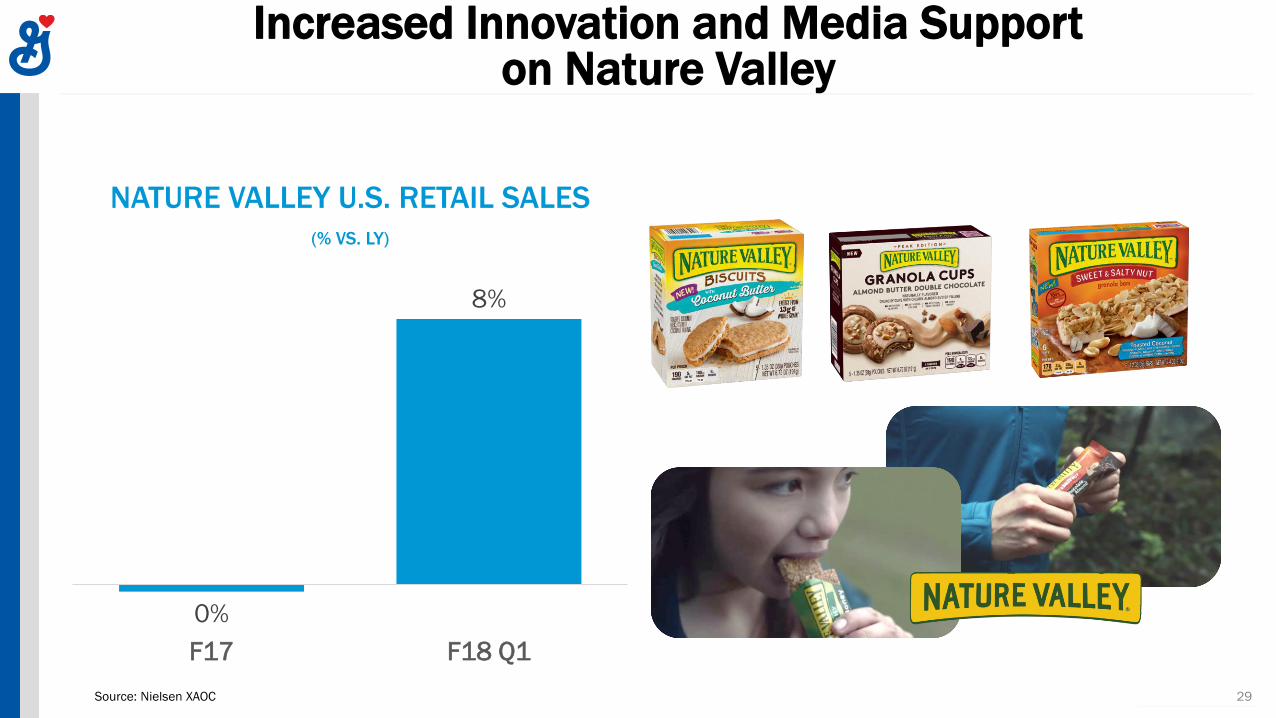
Increased Innovation and Media Support on Nature Valley
29Source: Nielsen XAOC
NATURE VALLEY U.S. RETAIL SALES
(% VS. LY)
0%
8%
F17 F18 Q1

Häagen-Dazs Flavor and Format Innovation in Europe
30Source: Nielsen/IRI, 12 weeks ended July 15, 2017
HÄAGEN-DAZS EUROPE & AUSTRALIA SEGMENT
RETAIL SALES(% VS. LY)
13%
28%
F17 Latest 12 Weeks

General Mills U.S. Retail Sales Trends Improving, As Expected
31Source: Nielsen XAOC
Fiscal 2017 Fiscal 2018
GENERAL MILLS U.S. RETAIL SALES(% vs. LY)
-6%
-7%
-8%
-7%
-4%
Q1 Q2 Q3 Q4 Q1
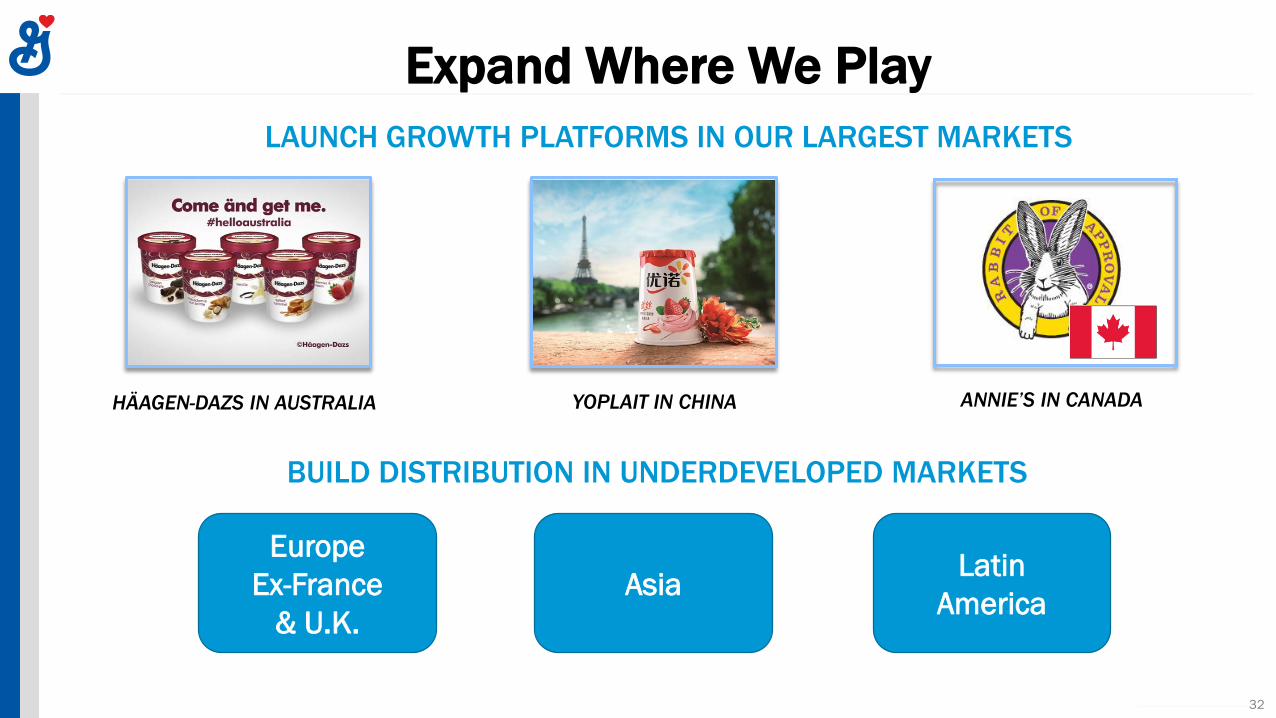
Expand Where We Play
32
HÄAGEN-DAZS IN AUSTRALIA YOPLAIT IN CHINA ANNIE’S IN CANADA
LAUNCH GROWTH PLATFORMS IN OUR LARGEST MARKETS
BUILD DISTRIBUTION IN UNDERDEVELOPED MARKETS
Europe
Ex-France
& U.K.
AsiaLatin
America

Reshape Our Portfolio for Growth
33
• M&A Has Enhanced Our Organic Growth Profile
• M&A Focus Areas:
• Bolt-on Acquisitions in North America and Europe
• Adding Scale in Emerging Markets
F15-F17 ACQUISITIONS
F16 DIVESTITURE
• We’ve Made a Number of Significant Changes to Drive Improved Performance at General Mills
• E-commerce Will be the Biggest Driver of Change in the U.S. Food Retail Environment and We See it as an Opportunity
• We Will Return to Consistent Topline Growth By Winning Where We Play, Expanding Where We Play, and Reshaping our Portfolio for Growth
Today’s Summary
34

GENERAL MILLS Barc lays Global Consumer
Staples Conference
September 7, 2017

Our fiscal 2018 outlook for organic net sales growth, constant-currency total segment operating profit and adjusted diluted EPS,
and adjusted operating profit margin are non-GAAP financial measures that exclude, or have otherwise been adjusted for, items
impacting comparability, including the effect of foreign currency exchange rate fluctuations, restructuring charges and project-
related costs, and commodity mark-to-market effects. Our fiscal 2018 outlook for organic net sales growth also excludes the
effect of acquisitions and divestitures. We are not able to reconcile these forward-looking non-GAAP financial measures to their
most directly comparable forward-looking GAAP financial measures without unreasonable efforts because we are unable to
predict with a reasonable degree of certainty the actual impact of changes in foreign currency exchange rates and commodity
prices or the timing of acquisitions, divestitures and restructuring actions throughout fiscal 2018. The unavailable information
could have a significant impact on our fiscal 2018 GAAP financial results.
For fiscal 2018, we currently expect: foreign currency exchange rates (based on blend of forward and forecasted rates and
hedge positions), acquisitions, and divestitures to have an immaterial impact on net sales growth; foreign currency exchange
rates to have an immaterial impact on total segment operating profit and adjusted diluted EPS growth; and total restructuring
charges and project-related costs related to actions previously announced to total approximately $45 million.
A Reminder on Non-GAAP Guidance
36
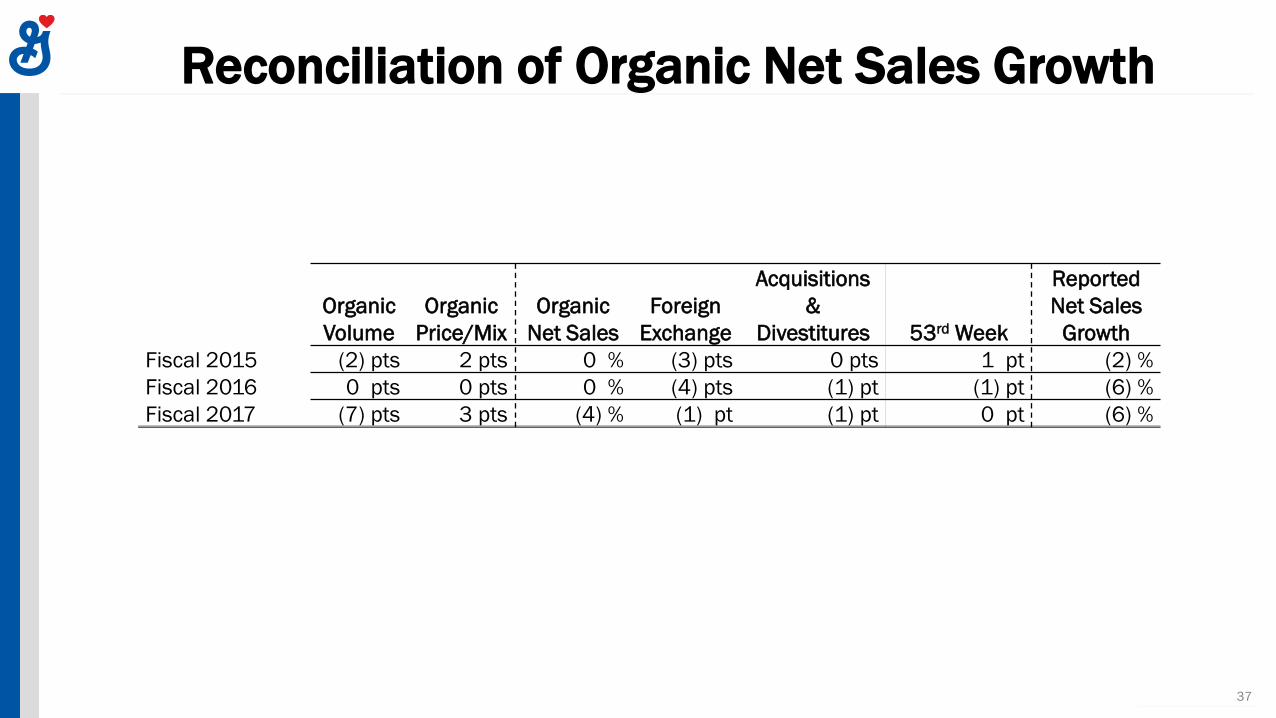
Reconciliation of Organic Net Sales Growth
37
Organic
Volume
Organic
Price/Mix
Organic
Net Sales
Foreign
Exchange
Acquisitions
&
Divestitures 53rd Week
Reported
Net Sales
Growth
Fiscal 2015 (2) pts 2 pts 0 % (3) pts 0 pts 1 pt (2) %
Fiscal 2016 0 pts 0 pts 0 % (4) pts (1) pt (1) pt (6) %
Fiscal 2017 (7) pts 3 pts (4) % (1) pt (1) pt 0 pt (6) %

Reconciliation of Adjusted Operating Profit Margin
Full Year
% of Net Sales
2017 2016 2015
Operating profit as reported 16.4 % 16.3 % 11.8 %
Mark-to-market effects (0.1) (0.4) 0.5
Divestitures (gain) loss, net 0.1 (0.9) -
Restructuring costs 1.4 1.4 1.9
Project-related costs 0.3 0.4 0.1
Acquisition integration costs - - 0.1
Intangible asset impairment - - 1.5
Adjusted operating profit margin 18.1 % 16.8 % 15.9 %
(Fiscal Years)
38

2017 2016 2015
Net earnings, including earnings attributable to redeemable and
noncontrolling interests $1,701 $1,737 $1,259
Mark-to-market effects* (9) (40) 57
Divestitures (gain) loss* 9 (66) -
Tax-related items* - - 79
Acquisition integration costs* - - 10
Venezuela currency devaluation* - - 8
Restructuring costs* 154 161 218
Project-related costs* 28 37 8
Intangible asset impairment* - - 177
Adjusted net earnings, including earnings attributable to redeemable
and noncontrolling interests $1,884 $1,829 $1,816
Net cash provided by operating activities, as reported $2,313 $2,630 $2,543
Purchases of land, buildings, and equipment (684) (729) (712)
Free cash flow $1,629 $1,901 $1,830
Free cash flow, rolling 3-year $5,360
Free cash flow conversion, rolling 3-years 97%
Reconciliation of Free Cash Flow and Free Cash Flow Conversion
(Fiscal Years, $ in Millions)
*See reconciliation of income taxes on adjusted items.
Table does not foot due to rounding.39

Cash Return to Shareholders(Fiscal Years, $ in Millions)
2017 2016 2015
Dividends paid $1,135 $1,072 $1,018
Purchases of common stock for treasury 1,652 607 1,162
Proceeds from common stock issued on
exercised options (113) (172) (164)
Total cash return to shareholders $2,674 $1,507 $2,016
Cash returns, rolling 3-year $6,197
Cash returns % of Free Cash Flow, rolling 3-year 116%
40
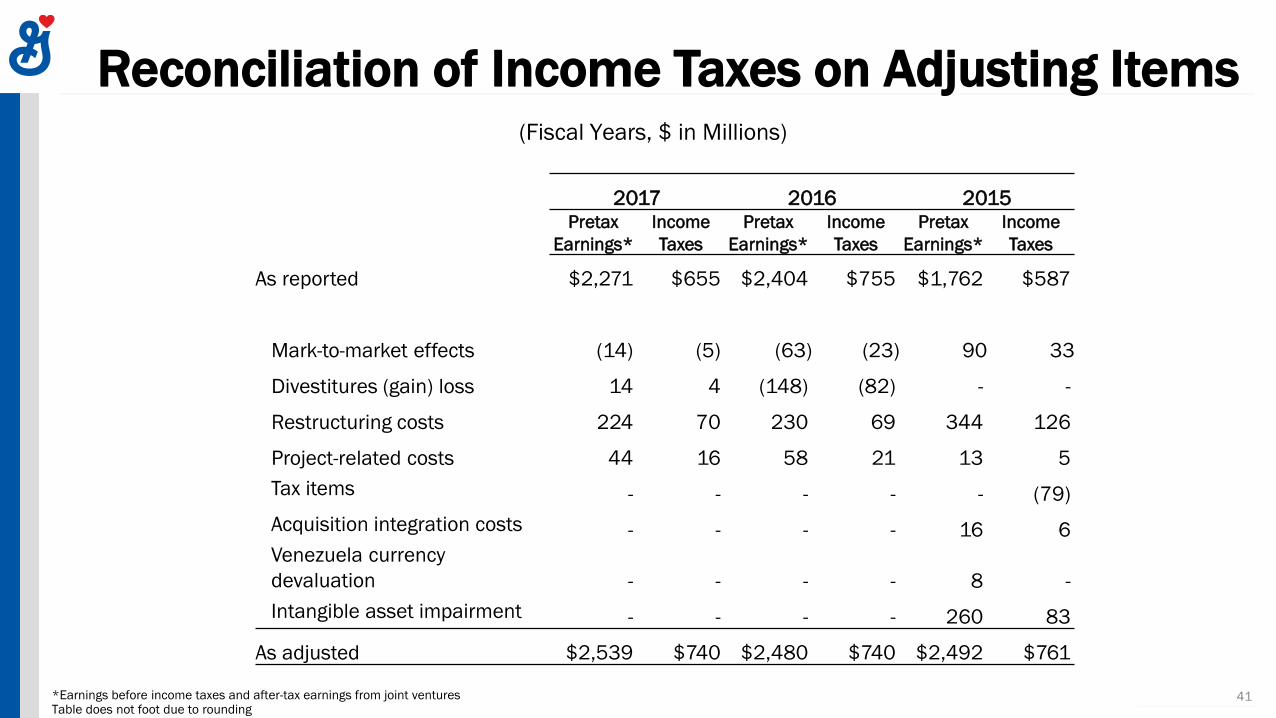
Reconciliation of Income Taxes on Adjusting Items
2017 2016 2015Pretax
Earnings*
Income
Taxes
Pretax
Earnings*
Income
Taxes
Pretax
Earnings*
Income
Taxes
As reported $2,271 $655 $2,404 $755 $1,762 $587
Mark-to-market effects (14) (5) (63) (23) 90 33
Divestitures (gain) loss 14 4 (148) (82) - -
Restructuring costs 224 70 230 69 344 126
Project-related costs 44 16 58 21 13 5
Tax items - - - - - (79)
Acquisition integration costs - - - - 16 6
Venezuela currency
devaluation - - - - 8 -
Intangible asset impairment - - - - 260 83
As adjusted $2,539 $740 $2,480 $740 $2,492 $761
(Fiscal Years, $ in Millions)
*Earnings before income taxes and after-tax earnings from joint venturesTable does not foot due to rounding
41