Embed Size (px)
Citation preview
Page | 1 | PHILLIP SECURITIES INDONESIA MCI (P) 019/11/2014_0013 Ref. No.: INDO2014_0015
Bank Negara Indonesia (BBNI ID)
The fourth largest bank in Indonesia with strong financial ratios
INDONESIA | BANKING | INITIATION
16 December 2014
Company Overview
Bank Negara Indonesia (“BNI”) is the first wholly-owned state bank as
well as the fourth largest bank in Indonesia, with total assets of IDR
388.2 trillion and 26,100 employees.
Currently has more than 1,700 outlets across the archipelago services
14 million customers, as well as 6 overseas offices in Singapore, Hong
Kong, Tokyo, Osaka, London and New York, more than 1,600
correspondent banks in 104 countries, and 13,370 ATMs throughout
the country. BNI also serves its customers through 42,000 EDC, as well
as through Internet banking and SMS banking.
Has 10 subsidiaries that support the provision of one stop financial
service, including banking products, insurance, financing, capital, and
remittance.
Initiate with “ACCUMULATE” with TP of IDR 7,025.
Investment Merits
Strong financial ratios
BNI is the only domestic bank to have consistently increased and
maintained higher ROE and ROA since FY08. BNI has reduced its NPL by
over 55% since FY08, more than any of its peers. Amid high interest rate
environment, BNI could maintain its NIM at 6.1% level and low NPL ratio of
2.2% in 3Q14.
The fourth largest commercial bank in Indonesia
BNI is now the fourth largest Indonesian lender by asset size, loans, and
customer deposits. As of August 2014, BNI booked a total asset of IDR 380
trillion with market share of 7.3% or the fourth largest among its peers in
Indonesia.
Local bank with the largest network of overseas branches
BNI is the only domestic bank in Indonesia with overseas branches as well
as one of the most extensive distribution platforms in the country. In
3Q14, BNI strengthened its international loan up to 41.4% yoy to IDR 9.8
trillion compared to IDR 6.9 trillion in 3Q13, contributing 3.7% to BNI’s
total loan.
Steady loans and funding growth
BNI booked a steady and double-digit loan growth of 12.9%, 19%, 22%,
and 24% respectively in FY10-13. In line with loan growth, BNI also
successfully maintain its third party funds to grow at the double-digit 19%,
11.4%, and 13.3% respectively in FY11-13 amid the tight competition
among banks to obtain third party funds.
Strong fee based income and low cost funding
BNI’s net fee and commision income grew 11.3%, 18.8%, and 26.8%
respectively in FY11-13, driven by developing consumer payment
transaction and cash management services. BNI is also one of the banks
with the lowest cost of funds in Indonesia, at 3.2% in 3Q14, lower than its
peers such as Mandiri with 3.9% and BRI with 4.3%.
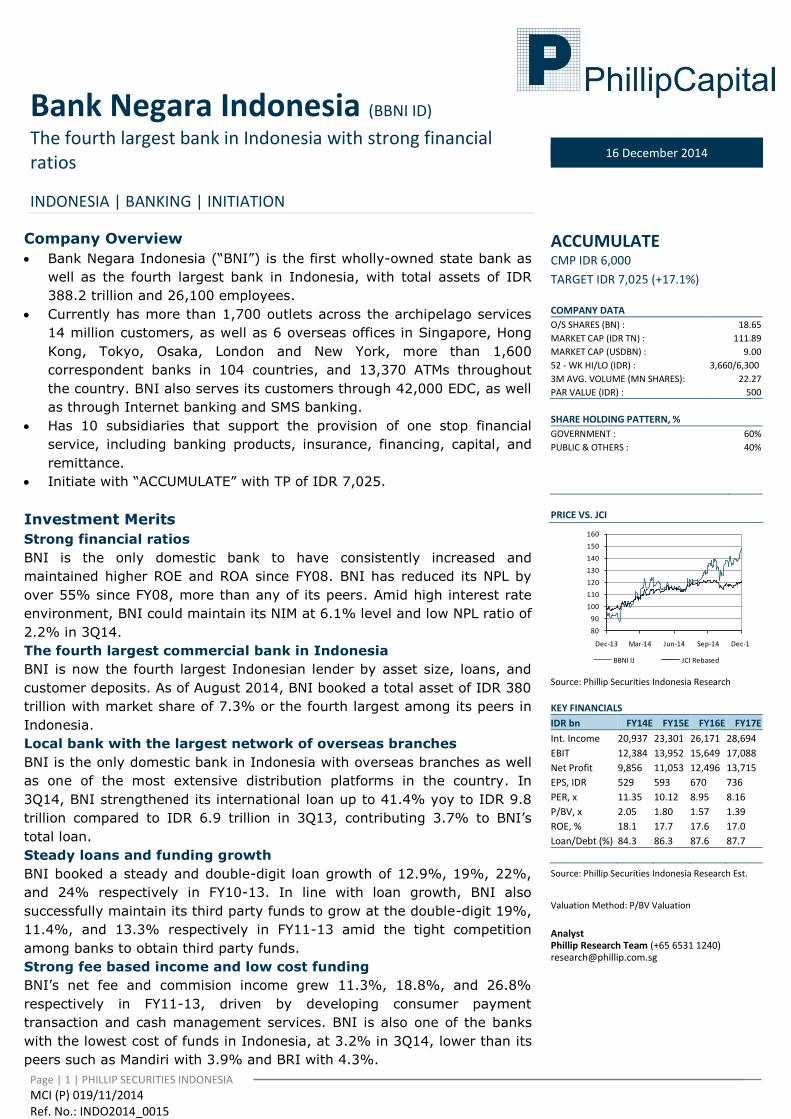
ACCUMULATE CMP IDR 6,000
TARGET IDR 7,025 (+17.1%) COMPANY DATA
O/S SHARES (BN) : 18.65
MARKET CAP (IDR TN) : 111.89
MARKET CAP (USDBN) : 9.00
52 - WK HI/LO (IDR) : 3,660/6,300
3M AVG. VOLUME (MN SHARES): 22.27
PAR VALUE (IDR) : 500
SHARE HOLDING PATTERN, %
GOVERNMENT : 60%
PUBLIC & OTHERS : 40%
PRICE VS. JCI
80
90
100
110
120
130
140
150
160
Dec-13 Mar-14 Jun-14 Sep-14 Dec-14
BBNI IJ JCI Rebased
Source: Phillip Securities Indonesia Research
KEY FINANCIALS
IDR bn FY14E FY15E FY16E FY17E
Int. Income 20,937 23,301 26,171 28,694
EBIT 12,384 13,952 15,649 17,088
Net Profit 9,856 11,053 12,496 13,715
EPS, IDR 529 593 670 736
PER, x 11.35 10.12 8.95 8.16
P/BV, x 2.05 1.80 1.57 1.39
ROE, % 18.1 17.7 17.6 17.0
Loan/Debt (%) 84.3 86.3 87.6 87.7
Source: Phillip Securities Indonesia Research Est.
Valuation Method: P/BV Valuation
Analyst Phillip Research Team (+65 6531 1240) [email protected]

Page | 2 | PHILLIP SECURITIES INDONESIA
Risk Factor
Coupled with global economic slowdown, especially in China and India,
some local factors such as rising inflation and gradual increase in electricity
tariffs will also potentially pressure Indonesia’s economic growth. A slower
demand from the export market could reduce revenue growth of real
sector, which in turn would cause slower loan growth in the banking sector.
The possibility of higher interest rate by the U.S. Federal Reserve will
potentially result in increased liquidity pressure.
Investment Action
We initiate coverage on BNI with “Accumulate” rating. We are positive on
1) Positive demand for syndicated loans from the infrastructure sector and
2) BNI’s target to reduce cost to income and increase its efficiency. Based
on our FY15 BVPS of IDR 3,342 and a P/B of 1.80x, we derive a target
price of IDR 7,025 with potential upside of 17.1% (not include a DPS of
IDR 178).
Key Financial Summary
FYE Dec FY12 FY13 FY14F FY15F FY16F
Net interest income (IDR mn) 15,458,991 19,149,281 20,936,989 23,301,162 26,170,696
Non interest income (IDR mn) 8,445,813 9,440,904 10,553,237 11,796,626 13,186,512
NPAT. Adj. (IDR mn) 6,789,823 9,089,579 9,860,361 11,056,983 12,500,489
EPS, adj. (IDR) 378 490 529 593 670
P/E (X), adj. 9.79 8.05 11.35 10.12 8.95
BVPS (IDR) 2,334 2,557 2,927 3,342 3,811
P/B (X) 1.59 1.54 2.05 1.80 1.57
DPS (IDR) 113 146 159 178 201
Div. Yield (%) 3.06% 3.69% 2.64% 2.96% 3.35%
Source: Bloomberg, PSI Research Est.*Forward multiples and yields are based on current price and historical multiples andyields are based on historical prices

PHILLIP SECURITIES INDONESIA | 3 | P a g e
BANK NEGARA INDONESIA INITIATING COVERAGE

PHILLIP SECURITIES INDONESIA | 4 | P a g e
BANK NEGARA INDONESIA INITIATING COVERAGE
Banking Industry in Indonesia
Slower Economic Growth in Indonesia
Statistic Indonesia announced that economic growth in Indonesia
reached 5.01% yoy in 3Q14. This result was slightly below analysts’
forecast and implies that the slowing trend of economic expansion in
Southest Asia’s largest economy continues. Since FY11, GDP growth has
been declining amid global and domestic economy declines. The 5.01%
point GDP growth in 3Q14 was the slowest quarterly growth pace in 5
years.
Externally, economic expansion in Indonesia has been limited by
sluggish global economy. With China’s economy growing at a relatively
low pace, global demand for Indonesian commodities has declined
sharply. In 3Q14, exports declined by 0.7% yoy. Furthermore, the
slowdown in exports was also partly caused by the controversial ban on
mineral ore exports which was implemented by the Indonesian
government in January 2014.
Indonesia’s quarterly GDP growth FY09-14 (annual % change)
4.6
5.996.45 6.29 6.03
5.224.37
6.29 6.52 6.365.89
5.124.31
5.816.49 6.16
5.625.01
4.58
6.81 6.56.11 5.78
0
1
2
3
4
5
6
7
2009 2010 2011 2012 2013 2014
1Q 2Q 3Q 4Q
Source: Statistics Indonesia, PSI Research
According to the Bank Indonesia, inflation may reach around 7.5% yoy
by FY14 as a result of higher subsidized fuel prices. In 4Q14, subsidized
fuel prices (gasoline and diesel) were raised more than 30% in an
attempt to reallocate government funds to more productive sectors as
well as to curb the country’s wide current account deficit. However, the
Bank Indonesia projects the IDR 2,000/liter fuel price hike will add
another 2.5% of Indonesian inflation to 7.5-8% for FY14.
The Bank Indonesia immediately responded to the fuel price hike by
raising its key interest rate by 25 basis points to 7.75%, for the first
time in 12 months. The higher interest environment in Indonesia led to
slower credit growth of 14% in 3Q14 versus 2013’s 21.4% pace.
However, the liquidity condition in banking sector has relatively eased,
proved by a decrease in the loan to deposit (LDR) ratio of 89.13% in
3Q14, compared to above 92% level in the previous month.
Indonesian economy grew 5.01% yoy in 3Q14, the slowest quarterly growth pace in 5 years.
Subsidized fuel prices were raised by more than 30% in 4Q14. In response, BI raised its key interest rate to 7.75%.

PHILLIP SECURITIES INDONESIA | 5 | P a g e
BANK NEGARA INDONESIA INITIATING COVERAGE
Indonesia’s Economic Growth Accelerates in 2015
According to the Asian Development Bank (ADB), Indonesian economy is
expected to pick up in FY15 as external demand improves and the new
government’s reform agenda takes hold. The ADB expects a growth
pace of 5.5% in FY15. Optimism over the new Joko Widodo (Jokowi)-led
administration brings new hope that can trigger investment growth.
Jokowi has been the market-favorite in the 2014 election.
Higher global economic growth forecast of 4% in FY15 compared to
3.4% in FY14 will encourage optimism over Indonesian economic growth
in FY15. Global trade, which is forecast to grow 5.3% in FY15 compared
to 4% in FY14, will encourage export performance to increase 4.4% in
FY15 compared to 1.4% in FY14. Due to enhanced certainty about
investment and employment programs of the new government,
investments in Indonesia are expected to grow by 5.5% or higher than
the 5.2% point growth projected in FY14.
Furthermore, the reallocation of fuel subsidies to finance infrastructure
development as well as various other productive activities (healthcare
and education) will improve the central government’s fiscal space in
term of nurturing stronger and more sustainable GDP growth. As such,
Bank Indonesia also estimates that Indonesia’s economic growth will
return to 5.5% yoy in FY15 and higher in the medium-long term.
Meanwhile, we have conservative view regarding the value of the Rupiah
(IDR). The average IDR rate is estimated to depreciate at IDR
12,600/USD range in FY15.
Despite positive impacts thanks to easing current account deficit, risks
poses by U.S. tappering off and possible increase in U.S. interest rates
will most likely lead to another round of capital outflows from the stock
and financial markets of emerging markets, including Indonesia. This is
because Indonesia’s 5.5% growth target will be highly dependent on
global economic growth, the acceleration of infrastructure development
in Indonesia, as well as government budget.
Banking Outlook in 2015
In line with economic growth forecast of 5.5% in FY15, the Bank
Indonesia sees loan growth between 15-17% next year, higher than
13-15% in FY14, while total deposits is expected to grow 11-13% in
FY15, or higher than 10-12% in FY14. We expect a slower loan growth
in the 1Q15 following the key interest rate hike at the end of FY14. The
Bank Indonesia increased key interest rate by 25 basis point to 7.75%
in 4Q14 to anticipate higher inflation after fuel price hike by Indonesian
government. We see a high chance of key interest rate hike in 2015 to
8.00% along with possible increase in U.S. Fed funds rates.
But we are positive that the 5.5% economic growth forecast will
encourage loan growth in the long term. Better use of government funds
from fuel consumption to infrastructure development will lead to lower
logistic costs. Moreover, along with improving economy in the US and
Japan, as well as signs of economic recoveries in Europe, China, and
We expect loans to grow 15-17% in FY15, in line with economic growth.
Infrastructure development will create more sustainable GDP growth of 5.5% in FY15.

PHILLIP SECURITIES INDONESIA | 6 | P a g e
BANK NEGARA INDONESIA INITIATING COVERAGE
India, it is expected that the global economy will improve in FY15 to
support future growth of Indonesian economy.
In addition, major lenders also expect positive demand for syndicated
loans from infrastructure sector next year, as President Jokowi envisions
more project developments to boost Indonesia’s economy. According to
Bloomberg’s Global Syndicated Loans League Tables, as many as 20
international banks and financial institutions acted as Indonesia’s
mandated arrangers as of September 2014 for 42 syndicated-loan deals
with a total volume of USD 14.56 billion, increased by 30.23% from USD
11.18 billion last year. However, the non-performing loan (NPL) level is
estimated to rise in the beginning of FY15, along with an increase of BI
rate. We expect higher loan risks in FY15, but it will likely to remain
below 3% or better than 3.8% NPL rate in FY08-09.

PHILLIP SECURITIES INDONESIA | 7 | P a g e
BANK NEGARA INDONESIA INITIATING COVERAGE
Investment Thesis
The fourth largest commercial bank in Indonesia
BNI is now the fourth largest Indonesian lender by asset size, loans, and
customer deposits. As of August 2014, BNI booked a total asset of IDR
380 trillion with market share of 7.3%, making it the fourth largest
among peers in Indonesia. BNI also recorded total loans of IDR 157
trillion (7.1% market share) and total customer deposits of IDR 293
trillion (7.6% market share) in the same period, which is the fourth
largest after BRI, Mandiri, and BCA.
The top 10 largest bank in Indonesia in terms of assets, loans,
and customer deposits as of August 2014
Source: Bank Indonesia, PSI Research
Has a solid liquidity position and asset quality
BNI’s liquidity was well maintained within the range set by Bank
Indonesia, with LDR of 85.7% in 3Q14, an increase compared with
84.7% a year earlier as a result of higher loan growth compared to
growth in third party deposits. Despite high interest rate environment,
BNI could maintain its NIM at 6.1% level and low NPL ratio of 2.2% in
3Q14. This shows that BNI has no difficulty in liquidity position and its
asset quality.
Strong financial ratios
BNI is the only domestic bank to have consistently increased and
maintained higher ROE since FY08, and its emphasis on quality growth
has led to a 400% rise in ROA during the same seven year period.
Meanwhile, the bank has reduced its NPL by over 55% since FY08, more
than any of its peers, and has significantly improved its coverage ratio
as well. BNI also boasts one of the strongest and low LDR banks, with
ROA and ROE have been maintained at consistently improving trajectory
under the stewardship of a focused and commited management team.
In 3Q14, BNI booked LDR of 85.7%, lower than industry’s 90.6%.
Local bank with the largest network of overseas branches
BNI is the only domestic banks in Indonesia with overseas branches.
The bank has overseas offices in Singapore, Hong Kong, Tokyo, Osaka,
London and New York, and 6 overseas ATM (4 ATMs in HongKong and 2
ATMs in Singapore). BNI also has one of the most extensive distribution
platforms in the country. In 3Q14, BNI strengthened its international
BNI has overseas offices in Singapore, Hong Kong, Tokyo, Osaka, London, and New York.
BNI boasts one of the strongest, low-cost funding-based and low LDR banks, with ROA and ROE have been maintained at consistently improving trajectory.

PHILLIP SECURITIES INDONESIA | 8 | P a g e
BANK NEGARA INDONESIA INITIATING COVERAGE
loans to up to 41.4% yoy to IDR 9.8 trillion, compared to IDR 6.9 trillion
in 3Q13, contributin 3.7% of BNI’s total loan.
Steady loans and funding growth
BNI booked steady and double-digit loan growths of 12.9%, 19%, 22%,
and 24% respectively in FY10-13. Despite slowdown of global economy
in FY13, BNI managed to increase its loans to grow by more than 24%,
above banking sector average of 21.6%. In line with loan growth, BNI
also successfully maintained its third party funds to grow at double-digit
pace of 19%, 11.4%, and 13.3%, respectively in FY11-13 amid tight
competitions among banks to secure third party funds.
Strong fee-based income and low-cost funding
BNI’s net fee and commision income grew 11.3%, 18.8%, and 26.8%
respectively in FY11-13, driven by developing consumer payment
transactions and cash management services. These fee-based income
contribute 14% to BNI’s total income in FY13. BNI is also one of the
banks with the lowest cost of funds in Indonesia, with 3.2% CoF in
3Q14, up 31.3% compared to 2.3% in 3Q13. This is lower compared to
its peers such as Mandiri with 3.9% CoF and BRI with 4.3% CoF.
BNI is one of the banks with the lowest cost of funds in Indonesia.
PHILLIP SECURITIES INDONESIA | 9 | P a g e
BANK NEGARA INDONESIA INITIATING COVERAGE
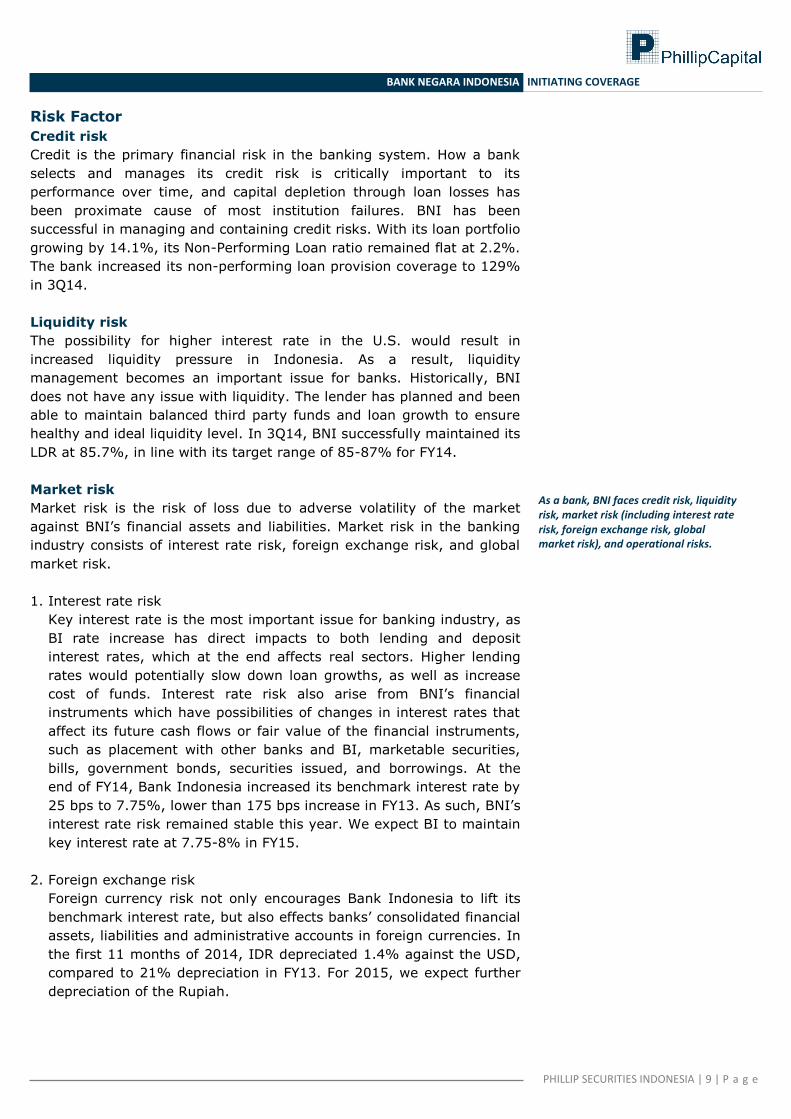
Risk Factor
Credit risk
Credit is the primary financial risk in the banking system. How a bank
selects and manages its credit risk is critically important to its
performance over time, and capital depletion through loan losses has
been proximate cause of most institution failures. BNI has been
successful in managing and containing credit risks. With its loan portfolio
growing by 14.1%, its Non-Performing Loan ratio remained flat at 2.2%.
The bank increased its non-performing loan provision coverage to 129%
in 3Q14.
Liquidity risk
The possibility for higher interest rate in the U.S. would result in
increased liquidity pressure in Indonesia. As a result, liquidity
management becomes an important issue for banks. Historically, BNI
does not have any issue with liquidity. The lender has planned and been
able to maintain balanced third party funds and loan growth to ensure
healthy and ideal liquidity level. In 3Q14, BNI successfully maintained its
LDR at 85.7%, in line with its target range of 85-87% for FY14.
Market risk
Market risk is the risk of loss due to adverse volatility of the market
against BNI’s financial assets and liabilities. Market risk in the banking
industry consists of interest rate risk, foreign exchange risk, and global
market risk.
1. Interest rate risk
Key interest rate is the most important issue for banking industry, as
BI rate increase has direct impacts to both lending and deposit
interest rates, which at the end affects real sectors. Higher lending
rates would potentially slow down loan growths, as well as increase
cost of funds. Interest rate risk also arise from BNI’s financial
instruments which have possibilities of changes in interest rates that
affect its future cash flows or fair value of the financial instruments,
such as placement with other banks and BI, marketable securities,
bills, government bonds, securities issued, and borrowings. At the
end of FY14, Bank Indonesia increased its benchmark interest rate by
25 bps to 7.75%, lower than 175 bps increase in FY13. As such, BNI’s
interest rate risk remained stable this year. We expect BI to maintain
key interest rate at 7.75-8% in FY15.
2. Foreign exchange risk
Foreign currency risk not only encourages Bank Indonesia to lift its
benchmark interest rate, but also effects banks’ consolidated financial
assets, liabilities and administrative accounts in foreign currencies. In
the first 11 months of 2014, IDR depreciated 1.4% against the USD,
compared to 21% depreciation in FY13. For 2015, we expect further
depreciation of the Rupiah.
As a bank, BNI faces credit risk, liquidity risk, market risk (including interest rate risk, foreign exchange risk, global market risk), and operational risks.

PHILLIP SECURITIES INDONESIA | 10 | P a g e
BANK NEGARA INDONESIA INITIATING COVERAGE
3. Global market risk
The economic slowdown in global markets, especially in China and
India as Indonesia’s top importers, could have negative impacts on
Indonesian banking industry. Slower demand from export markets
could reduce revenue growth in real sector, which in turn could slow
loan growth in the banking sector. Indonesia’s export value declined
by 2.21% yoy to USD 15.35 billion in October 2014, bringing current
account deficit to up to USD 270.3 million. Coupled with global
economic slowdown, several local factors such as rising inflation and
gradual increase in electricity tariffs will also weigh on Indonesia’s
economic growth.
Operational risk
Bank Indonesia (BI) said Indonesia needs to merge banks so that the
country’s lenders could compete in ASEAN region. Commission XI
overseeing financial affairs at the House of Representatives also
supports mergers between state-owned banks. This merger plan would
negatively effect BNI, since it would more likely be taken over by Bank
Mandiri. Banks that becomes unnaturally large would have more
complex financial and operational system. As a result, the system
becomes more fragile. If the two banks merged and became a larger
bank, the government will have to set aside a huge sum of money for
bailout funds if this huge lender were to collapse.
Investment Correlation
The correlation between BNI’s stock price and the Jakarta Composite
Index (JCI) has been 76.5% positive over the past 12 months. Among
Indonesian banks, BNI’s share price movement has higher correlation
with the JCI compared to the average banking sector correlation of
68.5%.
BNI’s share price movement among banking sector companies
and its correlation with the Jakarta Composite Index (JCI) over
the past 12 months
Source: Bloomberg, PSI Research
BNI’s share price movement has 76.5% positive correlation with the JCI over the past 12 months.

PHILLIP SECURITIES INDONESIA | 11 | P a g e
BANK NEGARA INDONESIA INITIATING COVERAGE
Financial Review and Forecast
Loan Growth
Loans represent the largest component (65.67%) of BNI’s assets in
3Q14, growing by 14.1% from IDR 234.91 trillion in 3Q13 to IDR 267.94
trillion in 3Q14. We expect BNI to record a loan growth of 16% to IDR
277.59 trillion for FY14, in line with BNI’s loan growth target of 14-17%
this year, compared to IDR 250.64 trillion in FY13. BNI’s loans
performance until 3Q14 has represented 96.5% of our loans estimation,
hence we believe BNI will achieve our loan growth estimation this year.
In line with our expectation for a slower loan growth of 15.5% in the
banking industry in FY15, we assume BNI’s loans to grow at the similar
level. Considering the lender’s historical loan growth which stood above
industry average over the last 2 years, we surmise a 15.5% loan growth
as attainable in FY15. However, we are positive on growing demands for
syndicated loans from infrastructure sector next year, since BNI
participated in the government’s infrastructure fund pool with USD 234
million investment.
BNI’s total loan composition in 3Q14 and its 8 sector focus in
business banking
Source: Company
BNI loans were mainly disbursed to corporate segment, representing
44% of its total loans, followed by consumer segment which comprises
18.2% of total loans. With respect to loan growth during 3Q14, loan
declines in the small segment are attributed to the upgrading of some
small segment debtors to become middle segment customers. The
upgrade indicates that BNI has successfully helped business customers
to grow. The small business segment that now meets the criteria for
middle debtors amounts to IDR 38.3 trillion.
BNI has recorded loan of IDR 268 trillion until 3Q14 or 96.5% of our loan estimate of IDR 278 trillion in FY14.

PHILLIP SECURITIES INDONESIA | 12 | P a g e
BANK NEGARA INDONESIA INITIATING COVERAGE
Deposit Growth
Customer deposits consisting of current accounts, savings, and time
deposits, represented the largest component (88.1%) of BNI’s liabilities
in 3Q14. Total customer deposits stood at IDR 308.33 trillion in 3Q14,
up by 11.9% from IDR 275.63 trillion in the same period in FY13. Based
on funding compositions, total funds from time deposits represented
38% of total customer deposits of IDR 117.12 trillion, while CASA
increased IDR 3 trillion or 1.6% yoy whereas CASA ratio decreased to
62% versus 68% in 3Q13.
We expect BNI to book customer deposit growth of 11.6% and 13% in
FY14 and FY15, respectively. With 3Q14 achievement of IDR 308.33
trillion, BNI has reached 94.7% of our customer deposit estimation for
FY14 of IDR 325.73 trillion. CASA only grew 1.6% yoy in 3Q14 or below
our estimation of 6.9% for FY14, while time deposits have grown
significantly by 32.8% or higher than our estimation of 21.8%.
However, these high-cost funds have increased BNI’s cost of funds to
3.2% in 3Q14, while we estimated 2.4% cost of funds in FY14.
BNI’s total customer deposits by type, by currencies, and by cost
Source: Company
Interest Rate Forecast
In line with our key interest rate assumption, we forecast average
interest rate for loans and deposits at 8.5% and 2.5% for FY14, flat
enough compared to FY13. We expect only small changes of 25 basis
points increase in our interest rate forecast for FY15. Based on
management’s guidance, BNI plans to maintain its interest rates to
avoid slower loan growth and higher cost of funds. After BI raised its
benchmark interest rate by 25 bps at the end of FY14, BNI does not
have any plan to adjust its interest rate.
BNI recorded customer deposits of IDR 308.33 trillion in 3Q14 or 94.7% of our estimation of IDR 325.73 trillion in FY14, with composition of 38% customer deposits and 62% CASA.
We forecast interest rates for loans and deposits to average at 8.5% and 2.5% in FY14, and expect only small changes of 25 bps for FY15.

PHILLIP SECURITIES INDONESIA | 13 | P a g e
BANK NEGARA INDONESIA INITIATING COVERAGE
Earnings Forecast
We forecast BNI’s earnings by estimating banking industry’s loan size
compared to GDP growth and the key interest rate. We believe a 15.5%
loan growth is feasible in FY15 due to improving economic growth and
better strategies from BNI. Considering historical loan growth of 19%,
22%, and 24% respectively in FY11, FY12, and FY13, we surmise a
15.5% loan growth as attainable in FY15.
FY15 management guidance:
(1) Maintain NIM at the same level of 6%.
(2) Loan growth: 16.5-17.5% from FY14’s forecast of IDR 278
trillion.
(3) Maintain LDR at a comfortable level of 85-90%.
(4) Expanding its business by setting up a joint venture with
Sumitomo through BNI Life, building 76 new branch offices, and
adding new branches for BNI Syariah with a total investment of
IDR 500 billion.
(5) Branchless banking targets 3,000 agents to increase BNI’s
efficiency as well as to decrease its cost to income ratio.
(6) Focus on corporate loans and support the government’s program.
Based on our assumption, interest income is projected to grow 12.4%
CAGR in FY15-19F while net profit is forecast to rise by 14.9% CAGR
over the same period. We believe our key interest rate estimates to be
conservative and earnings forecast to be attainable with BNI’s continued
efforts to improve operational efficiency.
Interest income and net profit forecast for FY14-19F
3016434655
3769240318
4324147463
0
10000
20000
30000
40000
50000
FY09 FY10 FY11 FY12 FY13 FY14F FY15F FY16F FY17F FY18F FY19F
985611061
1250213723
1538416938
0
3000
6000
9000
12000
15000
18000
FY09 FY10 FY11 FY12 FY13 FY14F FY15F FY16F FY17F FY18F FY19F
Source: PSI Research Est.
Interest income is projected to grow 12.4% CAGR for FY15-19F while net profit is forecast to rise by 14.9% CAGR over the same period.

PHILLIP SECURITIES INDONESIA | 14 | P a g e
BANK NEGARA INDONESIA INITIATING COVERAGE
Dividends: BNI’s dividend policy is determined every year through the
General Meeting of Shareholders (GMS). In FY13, BNI paid full-year
dividend of IDR 146, translating into payout ratio of 30%, or unchanged
compared to the previous year. We expect the same dividend payout
ratio of 30% for FY15-19.
BNI’s dividend and payout ratio over FY10-14F
0.0%
10.0%
20.0%
30.0%
40.0%
-
1,000,000
2,000,000
3,000,000
4,000,000
FY10 FY11 FY12 FY13 FY14F
Dividend (IDR mn) Dividend Payout
3016434655
3769240318
4324147463
0
10000
20000
30000
40000
50000
FY09 FY10 FY11 FY12 FY13 FY14F FY15F FY16F FY17F FY18F FY19F
985611061
1250213723
1538416938
0
3000
6000
9000
12000
15000
18000
FY09 FY10 FY11 FY12 FY13 FY14F FY15F FY16F FY17F FY18F FY19F
Source: PSI Research Est.
3Q14 Financial Performance
BNI, who reported higher net income, had seen its net profit increase by
16.4% yoy to IDR 7.61 trillion from January to September 2014, or
77.2% from our estimation of IDR 9.86 trillion for FY14. According to its
latest financial report, net interest income rose 18.6% to IDR 16.39
trillion, supported by higher lending, which grew 14.1% to IDR 308.33
trillion. This loan growth was in line with industry growth, which rose
14.0%.
Loan to Deposit Ratio (LDR) increased from 84.7% in 3Q13 to 85.7% in
3Q14, in line with BNI’s strategy in managing productive assets with
higher yields. On the other hand, its fee-based income remained flat by
2.0% to IDR 7.29 trillion. The majority of the fee-based income came
from provision and commissions (49.2%) which stood at IDR 3.59
trillion.
BNI managed to maintain its Net Interest Margin (NIM) at 6.1% amid
tightening liquidity issue faced by Indonesian banks. BNI also reduced
its Non Performing Loan (NPL) ratio to 2.2% in 3Q14 compared to 2.4%
in 3Q13, in line with its target of 1.8-2.2% in FY14. Loan to Deposit
Ratio (LDR) in 3Q14 reached 85.7%, thanks to its foreign currency loans
which grew 34.3% year-on-year. Capital Adequacy Ratio (CAR)
increased to 16.2% in 3Q14 from 15.7% in 3Q13. The CAR growth
showed the ability of BNI’s capital structure to anticipate credit risk,
operational risk, and market risk, as it was higher than the minimum
8% CAR set by Bank Indonesia.
In 3Q14, BNI reported net income of IDR 7.61 trillion, or 77.2% from our estimation of IDR 9.86 trillion.
PHILLIP SECURITIES INDONESIA | 15 | P a g e
BANK NEGARA INDONESIA INITIATING COVERAGE
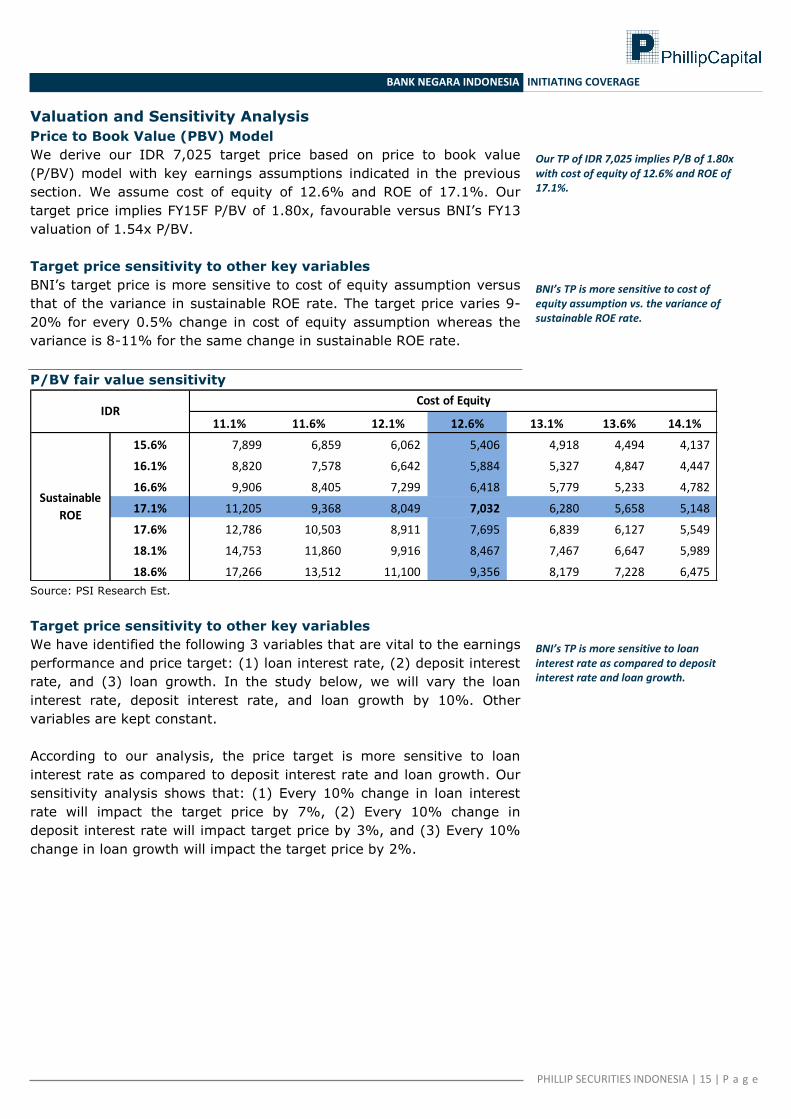
Valuation and Sensitivity Analysis
Price to Book Value (PBV) Model
We derive our IDR 7,025 target price based on price to book value
(P/BV) model with key earnings assumptions indicated in the previous
section. We assume cost of equity of 12.6% and ROE of 17.1%. Our
target price implies FY15F P/BV of 1.80x, favourable versus BNI’s FY13
valuation of 1.54x P/BV.
Target price sensitivity to other key variables
BNI’s target price is more sensitive to cost of equity assumption versus
that of the variance in sustainable ROE rate. The target price varies 9-
20% for every 0.5% change in cost of equity assumption whereas the
variance is 8-11% for the same change in sustainable ROE rate.
P/BV fair value sensitivity
11.1% 11.6% 12.1% 12.6% 13.1% 13.6% 14.1%
15.6% 7,899 6,859 6,062 5,406 4,918 4,494 4,137
16.1% 8,820 7,578 6,642 5,884 5,327 4,847 4,447
16.6% 9,906 8,405 7,299 6,418 5,779 5,233 4,782
17.1% 11,205 9,368 8,049 7,032 6,280 5,658 5,148
17.6% 12,786 10,503 8,911 7,695 6,839 6,127 5,549
18.1% 14,753 11,860 9,916 8,467 7,467 6,647 5,989
18.6% 17,266 13,512 11,100 9,356 8,179 7,228 6,475
IDRCost of Equity
Sustainable
ROE
IDR in M illion unless otherw ise stated
2014F 2015F 2016F 2014F 2015F 2016F 2014F 2015F 2016F
Loan Interest Rate (%) 7.65 7.92 7.65 8.50 8.80 8.50 9.35 9.68 9.35
Interest Income 27,902,407 32,061,105 34,708,228 30,164,024 34,603,622 37,635,765 32,425,640 37,452,466 40,563,302
EBIT 11,252,785 12,680,331 14,184,966 12,383,593 13,951,590 15,648,735 13,514,402 15,376,012 17,112,503
Net profit 8,915,210 9,994,452 11,277,147 9,856,460 11,052,609 12,495,543 10,797,711 12,238,255 13,713,940
BV (IDR) 2,892 3,267 3,690 2,927 3,342 3,811 2,962 3,422 3,936
Price target (IDR) 6,573 7,032 7,546
Deposit Interest Rate (%) 2.25 2.52 2.25 2.50 2.80 2.50 2.75 3.08 2.75
Interest Income 30,164,024 34,603,622 37,635,765 30,164,024 34,603,622 37,635,765 30,164,024 34,603,622 37,635,765
EBIT 12,795,112 14,378,392 16,161,691 12,383,593 13,951,590 15,648,735 11,972,074 13,339,221 15,135,779
Net profit 10,267,817 11,479,242 13,008,296 9,856,460 11,052,609 12,495,543 9,445,104 10,440,483 11,982,790
BV (IDR) 2,942 3,373 3,862 2,927 3,342 3,811 2,911 3,303 3,753
Price target (IDR) 7,223 7,032 6,791
Loan Growth (%) 14.40 13.77 11.07 16.00 15.30 12.30 17.60 16.83 13.53
Interest Income 29,831,659 33,833,486 36,450,683 30,164,024 34,603,622 37,635,765 30,496,388 35,364,562 38,811,865
EBIT 12,241,777 13,642,002 15,189,157 12,383,593 13,951,590 15,648,735 12,525,410 14,257,205 16,105,055
Net profit 9,742,492 10,807,541 12,135,241 9,856,460 11,052,609 12,495,543 9,970,429 11,294,476 12,853,340
BV (IDR) 2,923 3,328 3,784 2,927 3,342 3,811 2,931 3,355 3,838
Price target (IDR) 6,914 7,032 7,150
Loan Interest Rate (%) -10.00% -10.00% -10.00% 0.00% 0.00% 0.00% 10.00% 10.00% 10.00%
Sales -7.50% -7.35% -7.78% 0.00% 0.00% 0.00% 7.50% 8.23% 7.78%
EBITDA -9.13% -9.11% -9.35% 0.00% 0.00% 0.00% 9.13% 10.21% 9.35%
Net profit -9.55% -9.57% -9.75% 0.00% 0.00% 0.00% 9.55% 10.73% 9.75%
BV (IDR) -1.21% -2.25% -3.17% 0.00% 0.00% 0.00% 1.21% 2.39% 3.30%
Price target (IDR) -6.54% 0.00% 7.30%
Deposit Interest Rate (%) -10.00% -10.00% -10.00% 0.00% 0.00% 0.00% 10.00% 10.00% 10.00%
Sales 0.00% 0.00% 0.00% 0.00% 0.00% 0.00% 0.00% 0.00% 0.00%
EBITDA 3.32% 3.06% 3.28% 0.00% 0.00% 0.00% -3.32% -4.39% -3.28%
Net profit 4.17% 3.86% 4.10% 0.00% 0.00% 0.00% -4.17% -5.54% -4.10%
BV (IDR) 0.53% 0.94% 1.33% 0.00% 0.00% 0.00% -0.53% -1.15% -1.51%
Price target (IDR) 2.71% 0.00% -3.44%
Loan Growth (%) -10.00% -10.00% -10.00% 0.00% 0.00% 0.00% 10.00% 10.00% 10.00%
Sales -1.10% -2.23% -3.15% 0.00% 0.00% 0.00% 1.10% 2.20% 3.12%
EBITDA -1.15% -2.22% -2.94% 0.00% 0.00% 0.00% 1.15% 2.19% 2.92%
Net profit -1.16% -2.22% -2.88% 0.00% 0.00% 0.00% 1.16% 2.19% 2.86%
BV (IDR) -0.15% -0.40% -0.71% 0.00% 0.00% 0.00% 0.15% 0.40% 0.70%
Price target (IDR) -1.68% 0.00% 1.68%
% Changes
K e y F in a n cia l S u m m a r y
F Y E D e c F Y 1 2 F Y 1 3 F Y 1 4 F F Y 1 5 F F Y 1 6 F
N e t in te r e s t in c o m e ( ID R m n ) 1 5 ,4 5 8 ,9 9 1 1 9 ,1 4 9 ,2 8 1 2 0 ,9 3 6 ,9 8 9 2 3 ,3 0 1 ,1 6 2 2 6 ,1 7 0 ,6 9 6
N o n in te r e s t in c o m e ( ID R m n ) 8 ,4 4 5 ,8 1 3 9 ,4 4 0 ,9 0 4 1 0 ,5 5 3 ,2 3 7 1 1 ,7 9 6 ,6 2 6 1 3 ,1 8 6 ,5 1 2
N P A T . A d j. ( ID R m n ) 6 ,7 8 9 ,8 2 3 9 ,0 8 9 ,5 7 9 9 ,8 6 0 ,3 6 1 1 1 ,0 5 6 ,9 8 3 1 2 ,5 0 0 ,4 8 9
E P S , a d j. ( ID R ) 3 7 8 4 9 0 5 2 9 5 9 3 6 7 0
P / E (X ) , a d j. 9 .7 9 8 .0 5 1 1 .3 5 1 0 .1 2 8 .9 5
B V P S ( ID R ) 2 ,3 3 4 2 ,5 5 7 2 ,9 2 7 3 ,3 4 2 3 ,8 1 1
P / B (X ) 1 .5 9 1 .5 4 2 .0 5 1 .8 0 1 .5 7
D P S ( ID R ) 1 1 3 1 4 6 1 5 9 1 7 8 2 0 1
D iv . Y ie ld (% ) 3 .0 6 % 3 .6 9 % 2 .6 4 % 2 .9 6 % 3 .3 5 %
S o u r c e : B lo o m b e r g , P S I R e s e a r c h E s t.
Source: PSI Research Est.
Target price sensitivity to other key variables
We have identified the following 3 variables that are vital to the earnings
performance and price target: (1) loan interest rate, (2) deposit interest
rate, and (3) loan growth. In the study below, we will vary the loan
interest rate, deposit interest rate, and loan growth by 10%. Other
variables are kept constant.
According to our analysis, the price target is more sensitive to loan
interest rate as compared to deposit interest rate and loan growth. Our
sensitivity analysis shows that: (1) Every 10% change in loan interest
rate will impact the target price by 7%, (2) Every 10% change in
deposit interest rate will impact target price by 3%, and (3) Every 10%
change in loan growth will impact the target price by 2%.
Our TP of IDR 7,025 implies P/B of 1.80x with cost of equity of 12.6% and ROE of 17.1%.
BNI’s TP is more sensitive to cost of equity assumption vs. the variance of sustainable ROE rate.
BNI’s TP is more sensitive to loan interest rate as compared to deposit interest rate and loan growth.

PHILLIP SECURITIES INDONESIA | 16 | P a g e
BANK NEGARA INDONESIA INITIATING COVERAGE
BNI’s earnings and price target analysis
IDR in Million unless otherwise stated
2014F 2015F 2016F 2014F 2015F 2016F 2014F 2015F 2016F
Loan Interest Rate (%) 7.65 7.92 7.65 8.50 8.80 8.50 9.35 9.68 9.35
Interest Income 27,902,407 32,061,105 34,708,228 30,164,024 34,603,622 37,635,765 32,425,640 37,452,466 40,563,302
EBIT 11,252,785 12,680,331 14,184,966 12,383,593 13,951,590 15,648,735 13,514,402 15,376,012 17,112,503
Net profit 8,915,210 9,994,452 11,277,147 9,856,460 11,052,609 12,495,543 10,797,711 12,238,255 13,713,940
BV (IDR) 2,892 3,267 3,690 2,927 3,342 3,811 2,962 3,422 3,936
Price target (IDR) 6,573 7,032 7,546
Deposit Interest Rate (%) 2.25 2.52 2.25 2.50 2.80 2.50 2.75 3.08 2.75
Interest Income 30,164,024 34,603,622 37,635,765 30,164,024 34,603,622 37,635,765 30,164,024 34,603,622 37,635,765
EBIT 12,795,112 14,378,392 16,161,691 12,383,593 13,951,590 15,648,735 11,972,074 13,339,221 15,135,779
Net profit 10,267,817 11,479,242 13,008,296 9,856,460 11,052,609 12,495,543 9,445,104 10,440,483 11,982,790
BV (IDR) 2,942 3,373 3,862 2,927 3,342 3,811 2,911 3,303 3,753
Price target (IDR) 7,223 7,032 6,791
Loan Growth (%) 14.40 13.77 11.07 16.00 15.30 12.30 17.60 16.83 13.53
Interest Income 29,831,659 33,833,486 36,450,683 30,164,024 34,603,622 37,635,765 30,496,388 35,364,562 38,811,865
EBIT 12,241,777 13,642,002 15,189,157 12,383,593 13,951,590 15,648,735 12,525,410 14,257,205 16,105,055
Net profit 9,742,492 10,807,541 12,135,241 9,856,460 11,052,609 12,495,543 9,970,429 11,294,476 12,853,340
BV (IDR) 2,923 3,328 3,784 2,927 3,342 3,811 2,931 3,355 3,838
Price target (IDR) 6,914 7,032 7,150
Loan Interest Rate (%) -10.00% -10.00% -10.00% 0.00% 0.00% 0.00% 10.00% 10.00% 10.00%
Sales -7.50% -7.35% -7.78% 0.00% 0.00% 0.00% 7.50% 8.23% 7.78%
EBITDA -9.13% -9.11% -9.35% 0.00% 0.00% 0.00% 9.13% 10.21% 9.35%
Net profit -9.55% -9.57% -9.75% 0.00% 0.00% 0.00% 9.55% 10.73% 9.75%
BV (IDR) -1.21% -2.25% -3.17% 0.00% 0.00% 0.00% 1.21% 2.39% 3.30%
Price target (IDR) -6.54% 0.00% 7.30%
Deposit Interest Rate (%) -10.00% -10.00% -10.00% 0.00% 0.00% 0.00% 10.00% 10.00% 10.00%
Sales 0.00% 0.00% 0.00% 0.00% 0.00% 0.00% 0.00% 0.00% 0.00%
EBITDA 3.32% 3.06% 3.28% 0.00% 0.00% 0.00% -3.32% -4.39% -3.28%
Net profit 4.17% 3.86% 4.10% 0.00% 0.00% 0.00% -4.17% -5.54% -4.10%
BV (IDR) 0.53% 0.94% 1.33% 0.00% 0.00% 0.00% -0.53% -1.15% -1.51%
Price target (IDR) 2.71% 0.00% -3.44%
Loan Growth (%) -10.00% -10.00% -10.00% 0.00% 0.00% 0.00% 10.00% 10.00% 10.00%
Sales -1.10% -2.23% -3.15% 0.00% 0.00% 0.00% 1.10% 2.20% 3.12%
EBITDA -1.15% -2.22% -2.94% 0.00% 0.00% 0.00% 1.15% 2.19% 2.92%
Net profit -1.16% -2.22% -2.88% 0.00% 0.00% 0.00% 1.16% 2.19% 2.86%
BV (IDR) -0.15% -0.40% -0.71% 0.00% 0.00% 0.00% 0.15% 0.40% 0.70%
Price target (IDR) -1.68% 0.00% 1.68%
% Changes
Base Estimates +10% vs. Base-10% vs. Base
Key Financial Summary
FYE Dec FY12 FY13 FY14F FY15F FY16F
Net interest incom e (IDR m n) 15,458,991 19,149,281 20,936,989 23,301,162 26,170,696
Non interest incom e (IDR m n) 8,445,813 9,440,904 10,553,237 11,796,626 13,186,512
NPAT. Adj. (IDR m n) 6,789,823 9,089,579 9,860,361 11,056,983 12,500,489
EPS, adj. (IDR) 378 490 529 593 670
P/E (X), adj. 9.79 8.05 11.35 10.12 8.95
BVPS (IDR) 2,334 2,557 2,927 3,342 3,811
P/B (X) 1.59 1.54 2.05 1.80 1.57
DPS (IDR) 113 146 159 178 201
Div. Yield (%) 3.06% 3.69% 2.64% 2.96% 3.35%
Source: Bloom berg, PSI Research Est.
Source: PSI Research Est.

PHILLIP SECURITIES INDONESIA | 17 | P a g e
BANK NEGARA INDONESIA INITIATING COVERAGE
Peer group valuation comparison
P/B (x) ROE ROA Div. Yield
Company Ticker Market Cap 2014F 2015F 2016F 2014F 2015F 2016F 2014F 2015F 2016F 2014F 2015F 2016F
(USD Bn) 14y 15y 16y 14y 15y 16y 14y 15y 16y 14y 15y 16y
Bank Negara Indonesia BBNI IJ 8.95 2.05 1.80 1.58 17.96 17.69 17.52 2.26 2.26 2.30 2.46 2.79 3.17
Indonesia
Bank Mandiri BMRI IJ 19.88 2.42 2.09 1.81 20.94 20.73 20.5 2.65 2.68 2.71 2.33 2.60 2.93
Bank Rakyat Indonesia BBRI IJ 22.42 2.89 2.40 2.00 27.17 25.43 24.24 3.64 3.50 3.50 2.40 2.68 10.24
Bank Central Asia BBCA IJ 26.45 4.23 3.56 3.01 23.4 22.32 21.28 3.12 3.18 3.16 1.06 1.28 1.5
Bank Danamon BDMN IJ 3.43 1.27 1.18 1.09 9.55 10.31 11.26 1.66 1.74 1.86 2.45 2.49 2.89
Mean 2.57 2.21 1.90 19.80 19.30 18.96 2.67 2.67 2.71 2.14 2.37 4.15
Median 2.42 2.09 1.81 20.94 20.73 20.5 2.65 2.68 2.71 2.40 2.60 2.93
Malaysia
CIMB CIMB MK 13.09 1.24 1.16 1.08 12.04 12.09 12.52 1.05 1.12 1.15 3.83 4.34 4.90
Maybank MAY MK 23.75 1.59 1.49 1.40 13.48 13.38 13.48 1.13 1.14 1.17 5.92 6.23 6.43
Public Bank PBK MK 20.08 2.52 2.32 2.13 18.04 16.84 16.65 1.38 1.36 1.34 2.93 3.10 3.35
Mean 1.78 1.66 1.54 14.52 14.10 14.22 1.19 1.21 1.22 4.23 4.56 4.89
Median 1.59 1.49 1.40 13.48 13.38 13.48 1.13 1.14 1.17 3.83 4.34 4.90
Singapore
United Overseas Bank UOB SP 29.63 1.44 1.33 1.24 11.98 11.62 11.77 1.08 1.06 1.08 3.09 3.24 3.5
DBS Group DBS SP 37.27 1.33 1.24 1.15 11.38 11.35 11.86 0.96 0.98 1.04 3.02 3.21 3.52
OCBC OCBC SP 31.46 1.36 1.26 1.17 13.01 12.1 12.42 1.02 0.98 1.01 3.42 3.63 3.91
Mean 1.38 1.28 1.19 12.12 11.69 12.02 1.02 1.01 1.04 3.18 3.36 3.64
Median 1.36 1.26 1.17 11.98 11.62 11.86 1.02 0.98 1.04 3.09 3.24 3.52
Overall industry mean 2.03 1.80 1.61 16.27 15.81 15.77 1.81 1.82 1.85 2.99 3.24 4.21
Overall industry median 1.59 1.49 1.40 13.48 13.38 13.48 1.38 1.36 1.34 2.93 3.10 3.50
11.1% 11.6% 12.1% 12.6% 13.1% 13.6% 14.1%
15.6% 7,899 6,859 6,062 5,406 4,918 4,494 4,137
16.1% 8,820 7,578 6,642 5,884 5,327 4,847 4,447
16.6% 9,906 8,405 7,299 6,418 5,779 5,233 4,782
17.1% 11,205 9,368 8,049 7,032 6,280 5,658 5,148
17.6% 12,786 10,503 8,911 7,695 6,839 6,127 5,549
18.1% 14,753 11,860 9,916 8,467 7,467 6,647 5,989
18.6% 17,266 13,512 11,100 9,356 8,179 7,228 6,475
IDR
Sustainable
ROE
ID R in M illio n u n le s s o t h e r w is e s t a t e d
2 0 1 4 F 2 0 1 5 F 2 0 1 6 F 2 0 1 4 F 2 0 1 5 F 2 0 1 6 F 2 0 1 4 F 2 0 1 5 F 2 0 1 6 F
L o a n In te r e s t R a te (% ) 7 .6 5 7 .9 2 7 .6 5 8 .5 0 8 .8 0 8 .5 0 9 .3 5 9 .6 8 9 .3 5
In te r e s t In c o m e 2 7 ,9 0 2 ,4 0 7 3 2 ,0 6 1 ,1 0 5 3 4 ,7 0 8 ,2 2 8 3 0 ,1 6 4 ,0 2 4 3 4 ,6 0 3 ,6 2 2 3 7 ,6 3 5 ,7 6 5 3 2 ,4 2 5 ,6 4 0 3 7 ,4 5 2 ,4 6 6 4 0 ,5 6 3 ,3 0 2
E B IT 1 1 ,2 5 2 ,7 8 5 1 2 ,6 8 0 ,3 3 1 1 4 ,1 8 4 ,9 6 6 1 2 ,3 8 3 ,5 9 3 1 3 ,9 5 1 ,5 9 0 1 5 ,6 4 8 ,7 3 5 1 3 ,5 1 4 ,4 0 2 1 5 ,3 7 6 ,0 1 2 1 7 ,1 1 2 ,5 0 3
N e t p r o f it 8 ,9 1 5 ,2 1 0 9 ,9 9 4 ,4 5 2 1 1 ,2 7 7 ,1 4 7 9 ,8 5 6 ,4 6 0 1 1 ,0 5 2 ,6 0 9 1 2 ,4 9 5 ,5 4 3 1 0 ,7 9 7 ,7 1 1 1 2 ,2 3 8 ,2 5 5 1 3 ,7 1 3 ,9 4 0
B V ( ID R ) 2 ,8 9 2 3 ,2 6 7 3 ,6 9 0 2 ,9 2 7 3 ,3 4 2 3 ,8 1 1 2 ,9 6 2 3 ,4 2 2 3 ,9 3 6
P r ic e ta r g e t ( ID R ) 6 ,5 7 3 7 ,0 3 2 7 ,5 4 6
D e p o s it In te r e s t R a te (% ) 2 .2 5 2 .5 2 2 .2 5 2 .5 0 2 .8 0 2 .5 0 2 .7 5 3 .0 8 2 .7 5
In te r e s t In c o m e 3 0 ,1 6 4 ,0 2 4 3 4 ,6 0 3 ,6 2 2 3 7 ,6 3 5 ,7 6 5 3 0 ,1 6 4 ,0 2 4 3 4 ,6 0 3 ,6 2 2 3 7 ,6 3 5 ,7 6 5 3 0 ,1 6 4 ,0 2 4 3 4 ,6 0 3 ,6 2 2 3 7 ,6 3 5 ,7 6 5
E B IT 1 2 ,7 9 5 ,1 1 2 1 4 ,3 7 8 ,3 9 2 1 6 ,1 6 1 ,6 9 1 1 2 ,3 8 3 ,5 9 3 1 3 ,9 5 1 ,5 9 0 1 5 ,6 4 8 ,7 3 5 1 1 ,9 7 2 ,0 7 4 1 3 ,3 3 9 ,2 2 1 1 5 ,1 3 5 ,7 7 9
N e t p r o f it 1 0 ,2 6 7 ,8 1 7 1 1 ,4 7 9 ,2 4 2 1 3 ,0 0 8 ,2 9 6 9 ,8 5 6 ,4 6 0 1 1 ,0 5 2 ,6 0 9 1 2 ,4 9 5 ,5 4 3 9 ,4 4 5 ,1 0 4 1 0 ,4 4 0 ,4 8 3 1 1 ,9 8 2 ,7 9 0
B V ( ID R ) 2 ,9 4 2 3 ,3 7 3 3 ,8 6 2 2 ,9 2 7 3 ,3 4 2 3 ,8 1 1 2 ,9 1 1 3 ,3 0 3 3 ,7 5 3
P r ic e ta r g e t ( ID R ) 7 ,2 2 3 7 ,0 3 2 6 ,7 9 1
L o a n G r o w th (% ) 1 4 .4 0 1 3 .7 7 1 1 .0 7 1 6 .0 0 1 5 .3 0 1 2 .3 0 1 7 .6 0 1 6 .8 3 1 3 .5 3
In te r e s t In c o m e 2 9 ,8 3 1 ,6 5 9 3 3 ,8 3 3 ,4 8 6 3 6 ,4 5 0 ,6 8 3 3 0 ,1 6 4 ,0 2 4 3 4 ,6 0 3 ,6 2 2 3 7 ,6 3 5 ,7 6 5 3 0 ,4 9 6 ,3 8 8 3 5 ,3 6 4 ,5 6 2 3 8 ,8 1 1 ,8 6 5
E B IT 1 2 ,2 4 1 ,7 7 7 1 3 ,6 4 2 ,0 0 2 1 5 ,1 8 9 ,1 5 7 1 2 ,3 8 3 ,5 9 3 1 3 ,9 5 1 ,5 9 0 1 5 ,6 4 8 ,7 3 5 1 2 ,5 2 5 ,4 1 0 1 4 ,2 5 7 ,2 0 5 1 6 ,1 0 5 ,0 5 5
N e t p r o f it 9 ,7 4 2 ,4 9 2 1 0 ,8 0 7 ,5 4 1 1 2 ,1 3 5 ,2 4 1 9 ,8 5 6 ,4 6 0 1 1 ,0 5 2 ,6 0 9 1 2 ,4 9 5 ,5 4 3 9 ,9 7 0 ,4 2 9 1 1 ,2 9 4 ,4 7 6 1 2 ,8 5 3 ,3 4 0
B V ( ID R ) 2 ,9 2 3 3 ,3 2 8 3 ,7 8 4 2 ,9 2 7 3 ,3 4 2 3 ,8 1 1 2 ,9 3 1 3 ,3 5 5 3 ,8 3 8
P r ic e ta r g e t ( ID R ) 6 ,9 1 4 7 ,0 3 2 7 ,1 5 0
L o a n In te r e s t R a te (% ) -1 0 .0 0 % -1 0 .0 0 % -1 0 .0 0 % 0 .0 0 % 0 .0 0 % 0 .0 0 % 1 0 .0 0 % 1 0 .0 0 % 1 0 .0 0 %
S a le s -7 .5 0 % -7 .3 5 % -7 .7 8 % 0 .0 0 % 0 .0 0 % 0 .0 0 % 7 .5 0 % 8 .2 3 % 7 .7 8 %
E B IT D A -9 .1 3 % -9 .1 1 % -9 .3 5 % 0 .0 0 % 0 .0 0 % 0 .0 0 % 9 .1 3 % 1 0 .2 1 % 9 .3 5 %
N e t p r o f it -9 .5 5 % -9 .5 7 % -9 .7 5 % 0 .0 0 % 0 .0 0 % 0 .0 0 % 9 .5 5 % 1 0 .7 3 % 9 .7 5 %
B V ( ID R ) -1 .2 1 % -2 .2 5 % -3 .1 7 % 0 .0 0 % 0 .0 0 % 0 .0 0 % 1 .2 1 % 2 .3 9 % 3 .3 0 %
P r ic e ta r g e t ( ID R ) -6 .5 4 % 0 .0 0 % 7 .3 0 %
D e p o s it In te r e s t R a te (% ) -1 0 .0 0 % -1 0 .0 0 % -1 0 .0 0 % 0 .0 0 % 0 .0 0 % 0 .0 0 % 1 0 .0 0 % 1 0 .0 0 % 1 0 .0 0 %
S a le s 0 .0 0 % 0 .0 0 % 0 .0 0 % 0 .0 0 % 0 .0 0 % 0 .0 0 % 0 .0 0 % 0 .0 0 % 0 .0 0 %
E B IT D A 3 .3 2 % 3 .0 6 % 3 .2 8 % 0 .0 0 % 0 .0 0 % 0 .0 0 % -3 .3 2 % -4 .3 9 % -3 .2 8 %
N e t p r o f it 4 .1 7 % 3 .8 6 % 4 .1 0 % 0 .0 0 % 0 .0 0 % 0 .0 0 % -4 .1 7 % -5 .5 4 % -4 .1 0 %
B V ( ID R ) 0 .5 3 % 0 .9 4 % 1 .3 3 % 0 .0 0 % 0 .0 0 % 0 .0 0 % -0 .5 3 % -1 .1 5 % -1 .5 1 %
P r ic e ta r g e t ( ID R ) 2 .7 1 % 0 .0 0 % -3 .4 4 %
L o a n G r o w th (% ) -1 0 .0 0 % -1 0 .0 0 % -1 0 .0 0 % 0 .0 0 % 0 .0 0 % 0 .0 0 % 1 0 .0 0 % 1 0 .0 0 % 1 0 .0 0 %
S a le s -1 .1 0 % -2 .2 3 % -3 .1 5 % 0 .0 0 % 0 .0 0 % 0 .0 0 % 1 .1 0 % 2 .2 0 % 3 .1 2 %
E B IT D A -1 .1 5 % -2 .2 2 % -2 .9 4 % 0 .0 0 % 0 .0 0 % 0 .0 0 % 1 .1 5 % 2 .1 9 % 2 .9 2 %
N e t p r o f it -1 .1 6 % -2 .2 2 % -2 .8 8 % 0 .0 0 % 0 .0 0 % 0 .0 0 % 1 .1 6 % 2 .1 9 % 2 .8 6 %
B V ( ID R ) -0 .1 5 % -0 .4 0 % -0 .7 1 % 0 .0 0 % 0 .0 0 % 0 .0 0 % 0 .1 5 % 0 .4 0 % 0 .7 0 %
P r ic e ta r g e t ( ID R ) -1 .6 8 % 0 .0 0 % 1 .6 8 %
% C h a n g e s
K e y F in a n c ia l S u m m a r y
F Y E D e c F Y 1 2 F Y 1 3 F Y 1 4 F F Y 1 5 F F Y 1 6 F
N e t i n t e r e s t i n c o m e ( ID R m n ) 1 5 ,4 5 8 ,9 9 1 1 9 ,1 4 9 ,2 8 1 2 0 ,9 3 6 ,9 8 9 2 3 ,3 0 1 ,1 6 2 2 6 ,1 7 0 ,6 9 6
N o n i n t e r e s t i n c o m e ( ID R m n ) 8 ,4 4 5 ,8 1 3 9 ,4 4 0 ,9 0 4 1 0 ,5 5 3 ,2 3 7 1 1 ,7 9 6 ,6 2 6 1 3 ,1 8 6 ,5 1 2
N P A T . A d j . ( ID R m n ) 6 ,7 8 9 ,8 2 3 9 ,0 8 9 ,5 7 9 9 ,8 6 0 ,3 6 1 1 1 ,0 5 6 ,9 8 3 1 2 ,5 0 0 ,4 8 9
E P S , a d j . ( ID R ) 3 7 8 4 9 0 5 2 9 5 9 3 6 7 0
P / E ( X ) , a d j . 9 .7 9 8 .0 5 1 1 .3 5 1 0 .1 2 8 .9 5
B V P S ( ID R ) 2 ,3 3 4 2 ,5 5 7 2 ,9 2 7 3 ,3 4 2 3 ,8 1 1
P / B ( X ) 1 .5 9 1 .5 4 2 .0 5 1 .8 0 1 .5 7
D P S ( ID R ) 1 1 3 1 4 6 1 5 9 1 7 8 2 0 1
D i v . Y i e l d ( % ) 3 .0 6 % 3 .6 9 % 2 .6 4 % 2 .9 6 % 3 .3 5 %
S o u r c e : B l o o m b e r g , P S I R e s e a r c h E s t .
IDR in M illion unless otherw ise stated
2014F 2015F 2016F 2014F 2015F 2016F 2014F 2015F 2016F
Loan Interest Rate (%) 7.65 7.92 7.65 8.50 8.80 8.50 9.35 9.68 9.35
Interest Income 27,902,407 32,061,105 34,708,228 30,164,024 34,603,622 37,635,765 32,425,640 37,452,466 40,563,302
EBIT 11,252,785 12,680,331 14,184,966 12,383,593 13,951,590 15,648,735 13,514,402 15,376,012 17,112,503
Net profit 8,915,210 9,994,452 11,277,147 9,856,460 11,052,609 12,495,543 10,797,711 12,238,255 13,713,940
BV (IDR) 2,892 3,267 3,690 2,927 3,342 3,811 2,962 3,422 3,936
Price target (IDR) 6,573 7,032 7,546
Deposit Interest Rate (%) 2.25 2.52 2.25 2.50 2.80 2.50 2.75 3.08 2.75
Interest Income 30,164,024 34,603,622 37,635,765 30,164,024 34,603,622 37,635,765 30,164,024 34,603,622 37,635,765
EBIT 12,795,112 14,378,392 16,161,691 12,383,593 13,951,590 15,648,735 11,972,074 13,339,221 15,135,779
Net profit 10,267,817 11,479,242 13,008,296 9,856,460 11,052,609 12,495,543 9,445,104 10,440,483 11,982,790
BV (IDR) 2,942 3,373 3,862 2,927 3,342 3,811 2,911 3,303 3,753
Price target (IDR) 7,223 7,032 6,791
Loan Growth (%) 14.40 13.77 11.07 16.00 15.30 12.30 17.60 16.83 13.53
Interest Income 29,831,659 33,833,486 36,450,683 30,164,024 34,603,622 37,635,765 30,496,388 35,364,562 38,811,865
EBIT 12,241,777 13,642,002 15,189,157 12,383,593 13,951,590 15,648,735 12,525,410 14,257,205 16,105,055
Net profit 9,742,492 10,807,541 12,135,241 9,856,460 11,052,609 12,495,543 9,970,429 11,294,476 12,853,340
BV (IDR) 2,923 3,328 3,784 2,927 3,342 3,811 2,931 3,355 3,838
Price target (IDR) 6,914 7,032 7,150
Loan Interest Rate (%) -10.00% -10.00% -10.00% 0.00% 0.00% 0.00% 10.00% 10.00% 10.00%
Sales -7.50% -7.35% -7.78% 0.00% 0.00% 0.00% 7.50% 8.23% 7.78%
EBITDA -9.13% -9.11% -9.35% 0.00% 0.00% 0.00% 9.13% 10.21% 9.35%
Net profit -9.55% -9.57% -9.75% 0.00% 0.00% 0.00% 9.55% 10.73% 9.75%
BV (IDR) -1.21% -2.25% -3.17% 0.00% 0.00% 0.00% 1.21% 2.39% 3.30%
Price target (IDR) -6.54% 0.00% 7.30%
Deposit Interest Rate (%) -10.00% -10.00% -10.00% 0.00% 0.00% 0.00% 10.00% 10.00% 10.00%
Sales 0.00% 0.00% 0.00% 0.00% 0.00% 0.00% 0.00% 0.00% 0.00%
EBITDA 3.32% 3.06% 3.28% 0.00% 0.00% 0.00% -3.32% -4.39% -3.28%
Net profit 4.17% 3.86% 4.10% 0.00% 0.00% 0.00% -4.17% -5.54% -4.10%
BV (IDR) 0.53% 0.94% 1.33% 0.00% 0.00% 0.00% -0.53% -1.15% -1.51%
Price target (IDR) 2.71% 0.00% -3.44%
Loan Growth (%) -10.00% -10.00% -10.00% 0.00% 0.00% 0.00% 10.00% 10.00% 10.00%
Sales -1.10% -2.23% -3.15% 0.00% 0.00% 0.00% 1.10% 2.20% 3.12%
EBITDA -1.15% -2.22% -2.94% 0.00% 0.00% 0.00% 1.15% 2.19% 2.92%
Net profit -1.16% -2.22% -2.88% 0.00% 0.00% 0.00% 1.16% 2.19% 2.86%
BV (IDR) -0.15% -0.40% -0.71% 0.00% 0.00% 0.00% 0.15% 0.40% 0.70%
Price target (IDR) -1.68% 0.00% 1.68%
-10% vs. Base
K e y F in a n cia l S u m m a r y
F Y E D e c F Y 1 2 F Y 1 3 F Y 1 4 F F Y 1 5 F F Y 1 6 F
N e t in te r e s t in c o m e ( ID R m n ) 1 5 ,4 5 8 ,9 9 1 1 9 ,1 4 9 ,2 8 1 2 0 ,9 3 6 ,9 8 9 2 3 ,3 0 1 ,1 6 2 2 6 ,1 7 0 ,6 9 6
N o n in te r e s t in c o m e ( ID R m n ) 8 ,4 4 5 ,8 1 3 9 ,4 4 0 ,9 0 4 1 0 ,5 5 3 ,2 3 7 1 1 ,7 9 6 ,6 2 6 1 3 ,1 8 6 ,5 1 2
N P A T . A d j. ( ID R m n ) 6 ,7 8 9 ,8 2 3 9 ,0 8 9 ,5 7 9 9 ,8 6 0 ,3 6 1 1 1 ,0 5 6 ,9 8 3 1 2 ,5 0 0 ,4 8 9
E P S , a d j. ( ID R ) 3 7 8 4 9 0 5 2 9 5 9 3 6 7 0
P / E ( X ) , a d j. 9 .7 9 8 .0 5 1 1 .3 5 1 0 .1 2 8 .9 5
B V P S ( ID R ) 2 ,3 3 4 2 ,5 5 7 2 ,9 2 7 3 ,3 4 2 3 ,8 1 1
P / B ( X ) 1 .5 9 1 .5 4 2 .0 5 1 .8 0 1 .5 7
D P S ( ID R ) 1 1 3 1 4 6 1 5 9 1 7 8 2 0 1
D iv . Y ie ld (% ) 3 .0 6 % 3 .6 9 % 2 .6 4 % 2 .9 6 % 3 .3 5 %
S o u r c e : B lo o m b e r g , P S I R e s e a r c h E s t.
Source: PSI Research Est.

PHILLIP SECURITIES INDONESIA | 18 | P a g e
BANK NEGARA INDONESIA INITIATING COVERAGE
Company Profile
Company Background
Founded in 1946 as the first wholly-owned state bank, BNI began its
history by serving as the first central bank of Indonesia, before
assuming its status as a commercial bank back in 1955. BNI became the
first State-Owned Enterprise (SOE) bank to go public by listing its
shares on the Jakarta Stock Exchanges in 1996. To further strengthen
its financial structure and competitive edge in the national banking
industry, BNI conducted a series of corporate actions, such as
recapitalization by the Government in 1991, divestment of the
Government’s shares in 1997, and a rights issue in 2011. By the end of
2011, the Government of the Republic of Indonesia held 60% of stake
BNI, with the remaining 40% held by individuals and institutional
shareholders, domestic as well as overseas.
BNI Milestones
Source: Company
Company Overview
Offering various financial products and services, BNI currently is the
fourth largest bank in Indonesia in terms of total assets, lending and
third-party funds. In providing comprehensive financial services, BNI is
supported by its subsidiaries, namely Bank BNI Syariah, BNI Multi
Finance, BNI Securities, and BNI Life Insurance. By the end of 2013,
BNI had total assets of IDR 388.2 trillion and a total of 26,100
employees. BNI operates a wide ranging service network, comprising
1,693 domestic outlets and overseas branches in New York, London,
Tokyo, Hong Kong, Singapore, and Osaka. BNI is able to provide
complete trade finance services to its corporate clients, assisting
exports, imports and remittances, and also essential treasury services
such as foreign exchange transactions and hedging. BNI’s current ATM
network consists of 13,370 proprietary ATMs. BNI also serves its
customers through 42,000 EDC, as well as through Internet banking and
SMS banking.
BNI was the first wholly-owned state bank, founded in 1946. By FY11, the Government holds 60% stake in BNI.

PHILLIP SECURITIES INDONESIA | 19 | P a g e
BANK NEGARA INDONESIA INITIATING COVERAGE
BNI Network and Distribution
Source: Company
Business Model and Business Segment
Purposes: BNI strives to become a bank that ‘excels’ in terms of quality
human capital and internal business processes that provide value for
customers through improvements and innovation as well as quality
banking management with measured risks. ‘Prominent’ means to be the
bank of choice with superior service quality, which will lead BNI to be
the ‘advanced’ bank relative to its peers in terms of financial
performance, profitability and growth, and thus providing quality
investments for the satisfaction of stakeholders.
Process: To achieve its long-term objective, BNI implemented a multi-
prolonged approach to growth as follows: (1) Provide excellent services
and value added solutions to all customers as the banking partner of
choice, (2) Enhance investment value for investors, (3) Provide the best
environment for its employees, to be the source of pride to perform and
excel, (4) Improve social and environmental responsibility, and (5) To
be the benchmark for compliance and good corporate governance
practices.
BNI Business Concept
BNI had equity participation in 10 subsidiaries
Source: Company

PHILLIP SECURITIES INDONESIA | 20 | P a g e
BANK NEGARA INDONESIA INITIATING COVERAGE
BNI focuses on quality asset growth by targeting key sectors, supported
by 10 subsidiaries. BNI’s subsidiaries were established to support the
provision of one stop financial service, including banking products,
insurance, financing, capital, and remittance.
1. Bank BNI Syariah
PT Bank BNI Syariah is the result of a spin-off from BNI’s Sharia
Business Unit. Micro financing, productive retail and Griya Hasanah
products to become the champion products. By FY13, BNI Syariah
operated a total of 282 outlets, comprised 49 regular branches, 15
micro branches, 95 regular sub branches, 66 micro sub branches, 17
cash offices, 22 BNI Syariah mobile services and 20 payment points.
2. BNI Securities
The main business of BNI Securities is securities brokerage and
underwriting. BNI Securities also established a strategic alliance with
SBI Securities Co. Ltd., a securities company in Japan. In FY13, BNI
securities operated 66 branches throughout Indonesia with 15,741
active customers from a total of 22,210 customers. Indonesia’s
capital market is expected to continue growing, supported by stable
economic growth and strong investor growth.
3. BNI Multi Finance
BNI Multi Finance is a subsidiary of BNI operating in the consumer
financing sector, specifically in car ownership financing and capital
goods leasing business. BNI Multi Finance operates 9 branch offices in
Indonesia and also acquired BNI Oto’s financing business in FY13.
Going forward, BNI Multi Finance will also offer Multi Product
Financing solutions for consumer products, such as electronics and
household equipment.
4. BNI Life Insurance
BNI Life Insurance focuses on accelerating business growth, service
quality improvement and strategic alliance development. In FY13, BNI
announced a strategic partnership with Sumitomo Life that will be
implemented via a subscription of IDR 4.2 trillion worth of new shares
issued by BNI Life Insurance. Indonesia’s life insurance industry is
expected to continue growing, supported by the country’s strong
macro economy fundamentals, political stability and fast growing
middle class segment. Indonesia remains an attractive life insurance
market, given that the country has the largest population in South
East Asia with low insurance penetration relative to the GDP.
5. BNI Remittance Ltd
BNI Remittance Ltd. (BRL) is a subsidiary established by BNI Hong
Kong branch in FY96 as “High Motivation Company”, before becoming
BNI Remittance Limited in FY09. At present, BRL holds 5% market
share of total remittance transactions from Hong Kong to Indonesia,
which positions the Company as the third largest player in the
remittance transaction business from Hong Kong to Indonesia and the
largest player compared to other Indonesian banks that provide
BNI has 10 subsidiaries, including banking, insurance, financing, capital, and remittance.

PHILLIP SECURITIES INDONESIA | 21 | P a g e
BANK NEGARA INDONESIA INITIATING COVERAGE
remittance services in Hong Kong. Going forward, BRL will focus on
increasing its market share in Hong Kong and entering new market in
Taiwan.
Management
Board of Directors
Board of Commissioners

PHILLIP SECURITIES INDONESIA | 22 | P a g e
BANK NEGARA INDONESIA INITIATING COVERAGE
SWOT Analysis
Strength
1. Top fourth largest bank in Indonesia in
terms of asset, loan, and customer deposit.
2. Has strong brand name with 68 years
history in Indonesia as the first wholly-
owned state bank.
3. The only bank that is connected directly to
the integrated state revenue service
system for forex.
4. A leader bank in providing international
services in Indonesia.
5. Has wide customer base with 14,000
customers and wide ranging service
network, comprising 1,745 domestic outlets
and overseas branches.
6. The only bank to have strong ROA and ROE
improvement trajectory.
Weakness
1. Over diversification in it business portfolio
and does not have specific focus for its loan
target.
2. Has quite high efficiency ratio of 47.3%
compared to its peers.
Opportunity
1. Rapid grow in the domestic population.
2. Strong demand for syndicated loans from
the infrastructure sector.
3. Overseas market potentials can be
explored further.
Threats
1. Economic slowdown in the global markets
may reduce demand for bank loans.
2. Tight competitions among banks will make it
difficult to obtain cheap funding.
3. Presence of foreign banks in Indonesia.
4. The uncertainty in regulation and market
environment.
5. Government’s plan to merge state-owned
banks in Indonesia.
6. Tighter liquidity condition to continue in
Indonesia.

PHILLIP SECURITIES INDONESIA | 23 | P a g e
BANK NEGARA INDONESIA INITIATING COVERAGE
FYE Dec FY12 FY13 FY14F FY15F FY16F FYE Dec FY12 FY13 FY14F FY15F FY16F
Income Statement (IDR bn) Valuation Ratios
Net interest income 15,459 19,149 20,937 23,301 26,171 P/E (X), adj. 9.79 8.05 11.35 10.12 8.95
Non interest income 8,446 9,441 10,553 11,797 13,187 P/B (X) 1.59 1.54 2.05 1.80 1.57
Total operating income 23,905 28,590 31,490 35,098 39,357 Dividend Yield (%) 3.1% 3.7% 2.6% 3.0% 3.4%
Operating expenses (12,739) (14,573) (15,745) (17,549) (19,679) Growth & Margins (%)
Provisions (2,525) (2,708) (3,362) (3,597) (4,030) Growth
Operating profit 8,641 11,310 12,384 13,952 15,649 Assets 11.5% 16.0% 11.6% 12.5% 10.8%
Taxation (1,851) (2,220) (2,523) (2,895) (3,148) Loan 23.9% 25.8% 13.9% 15.3% 12.3%
Profit after tax 6,790 9,090 9,860 11,057 12,500 Deposit 11.4% 13.3% 11.6% 12.8% 10.6%
Non-controlling interest 2 4 4 4 5 Equity 15.0% 9.6% 14.5% 14.2% 14.0%
Net income 6,788 9,086 9,856 11,053 12,496 Net interest income 17.2% 23.9% 9.3% 11.3% 12.3%
Non interest income 11.1% 11.8% 11.8% 11.8% 11.8%
FYE Dec FY12 FY13 FY14F FY15F FY16F Operating income 19.3% 30.9% 9.5% 12.7% 12.2%
Balance Sheet (IDR bn) Net income 21.1% 33.9% 8.5% 12.1% 13.1%
Cash 7,969 10,090 8,593 5,115 3,967 Margins
Current account with BI & other banks 28,263 27,232 31,483 36,338 39,426 Net interest margin 5.9% 6.1% 6.0% 6.0% 6.0%
Placement with other banks and BI 32,617 23,473 23,190 22,911 22,636 Key Ratios (%)
Marketable securities 9,801 11,966 12,579 13,208 13,869 ROE 16.2% 19.2% 18.1% 17.7% 17.6%
Acceptance receivables 10,077 11,479 12,938 14,922 16,763 ROA 2.1% 2.4% 2.3% 2.3% 2.3%
Loans 193,835 243,758 277,593 320,175 359,657 Non-interest/total income ratio 35.3% 33.0% 33.5% 33.6% 33.5%
Government bonds 38,561 41,432 44,559 47,922 51,539 Cost/income ratio 53.3% 51.0% 50.0% 50.0% 50.0%
Fixed assets 4,592 5,514 5,582 5,545 5,410 Loan/deposit ratio 74.3% 82.6% 84.3% 86.3% 87.6%
Others 7,589 11,712 15,019 19,260 24,697 Capital Adequacy Ratio 17.9% 16.4% 16.5% 16.3% 16.4%
Total Assets 333,304 386,655 431,536 485,397 537,962
Obligations due to immediately 2,726 1,760 1,936 2,129 2,342 FYE Dec FY12 FY13 FY14F FY15F FY16F
Deposits from customers & other banks 260,906 295,075 329,215 371,132 410,365 Per share data (IDR)
Acceptances payable 4,625 6,199 6,819 7,501 8,251 EPS, adj. 378 490 529 593 670
Borrowings 8,750 18,951 20,846 22,930 25,223 DPS 113 146 159 178 201
Securities issued 4,769 6,037 6,640 7,304 8,035 BVPS 2,334 2,557 2,927 3,342 3,811
Others 8,003 10,950 11,498 12,073 12,676
Total liabilities 289,778 338,971 376,953 423,070 466,892
Shareholder's equity 43,473 47,600 54,500 62,237 70,983
Non-controlling interest 52 83 83 83 83
Total equity 43,525 47,684 54,583 62,320 71,067 Source: Company, PSI Research Est.

PHILLIP SECURITIES INDONESIA | 24 | P a g e
BANK NEGARA INDONESIA INITIATING COVERAGE
Contact Information (Singapore Research Team) Management Chan Wai Chee (CEO, Research - Special Opportunities)
+65 6531 1231 Research Operations Officer Jaelyn Chin +65 6531 1240
Joshua Tan (Head, Research - Equities & Macro)
+65 6531 1249
Macro | Equities Market Analyst | Equities US Equities Soh Lin Sin +65 6531 1516 Kenneth Koh +65 6531 1791 Wong Yong Kai +65 6531 1685 Bakhteyar Osama +65 6531 1793 Finance | Offshore Marine Real Estate Benjamin Ong +65 6531 1535 Caroline Tay +65 6531 1792 Telecoms | Technology Transport & Logistics Colin Tan +65 6531 1221 Richard Leow, CFTe +65 6531 1735
Contact Information (Regional Member Companies) SINGAPORE
Phillip Securities Pte Ltd Raffles City Tower
250, North Bridge Road #06-00 Singapore 179101 Tel +65 6533 6001 Fax +65 6535 6631
Website: www.poems.com.sg
MALAYSIA Phillip Capital Management Sdn Bhd
B-3-6 Block B Level 3 Megan Avenue II, No. 12, Jalan Yap Kwan Seng, 50450
Kuala Lumpur Tel +603 2162 8841 Fax +603 2166 5099
Website: www.poems.com.my
HONG KONG Phillip Securities (HK) Ltd
11/F United Centre 95 Queensway Hong Kong
Tel +852 2277 6600 Fax +852 2868 5307
Websites: www.phillip.com.hk
JAPAN
Phillip Securities Japan, Ltd. 4-2 Nihonbashi Kabuto-cho Chuo-ku,
Tokyo 103-0026 Tel +81-3 3666 2101 Fax +81-3 3666 6090
Website: www.phillip.co.jp
INDONESIA PT Phillip Securities Indonesia
ANZ Tower Level 23B, Jl Jend Sudirman Kav 33A Jakarta 10220 – Indonesia
Tel +62-21 5790 0800 Fax +62-21 5790 0809
Website: www.phillip.co.id
CHINA Phillip Financial Advisory (Shanghai) Co Ltd
No 550 Yan An East Road, Ocean Tower Unit 2318,
Postal code 200001 Tel +86-21 5169 9200 Fax +86-21 6351 2940
Website: www.phillip.com.cn
THAILAND Phillip Securities (Thailand) Public Co. Ltd
15th Floor, Vorawat Building, 849 Silom Road, Silom, Bangrak,
Bangkok 10500 Thailand Tel +66-2 6351700 / 22680999
Fax +66-2 22680921 Website www.phillip.co.th
FRANCE King & Shaxson Capital Limited
3rd Floor, 35 Rue de la Bienfaisance 75008 Paris France
Tel +33-1 45633100 Fax +33-1 45636017
Website: www.kingandshaxson.com
UNITED KINGDOM King & Shaxson Capital Limited
6th Floor, Candlewick House, 120 Cannon Street, London, EC4N 6AS
Tel +44-20 7426 5950 Fax +44-20 7626 1757
Website: www.kingandshaxson.com
UNITED STATES Phillip Futures Inc
141 W Jackson Blvd Ste 3050 The Chicago Board of Trade Building
Chicago, IL 60604 USA Tel +1-312 356 9000 Fax +1-312 356 9005
Website: www.phillipusa.com
AUSTRALIA Phillip Capital Limited
Level 12, 15 William Street, Melbourne, Victoria 3000, Australia
Tel +61-03 9629 8288 Fax +61-03 9629 8882
Website: www.phillipcapital.com.au
SRI LANKA Asha Phillip Securities Limited
No-10 Prince Alfred Tower, Alfred House Gardens, Colombo 03, Sri Lanka Tel: (94) 11 2429 100 Fax: (94) 11 2429 199
Website: www.ashaphillip.net
INDIA PhillipCapital (India) Private Limited
No.1, 18th Floor Urmi Estate
95, Ganpatrao Kadam Marg Lower Parel West, Mumbai 400-013
Maharashtra, India Tel: +91-22-2300 2999 / Fax: +91-22-2300 2969
Website: www.phillipcapital.in
TURKEY PhillipCapital Menkul Degerler
Dr. Cemil Bengü Cad. Hak Is Merkezi No. 2 Kat. 6A Caglayan 34403 Istanbul, Turkey
Tel: 0212 296 84 84 Fax: 0212 233 69 29
Website: www.phillipcapital.com.tr
DUBAI Phillip Futures DMCC
Member of the Dubai Gold and Commodities Exchange (DGCX)
Unit No 601, Plot No 58, White Crown Bldg, Sheikh Zayed Road, P.O.Box 212291
Dubai-UAE Tel: +971-4-3325052 / Fax: + 971-4-3328895
Website: www.phillipcapital.in

PHILLIP SECURITIES INDONESIA | 25 | P a g e
BANK NEGARA INDONESIA INITIATING COVERAGE
Important Information
This publication is prepared by Phillip Securities Research Pte Ltd., 250 North Bridge Road, #06-00, Raffles City Tower, Singapore 179101 (Registration Number: 198803136N), which is regulated by the Monetary Authority of Singapore (“Phillip Securities Research”). By receiving or reading this publication, you agree to be bound by the terms and limitations set out below. This publication has been provided to you for personal use only and shall not be reproduced, distributed or published by you in whole or in part, for any purpose. If you have received this document by mistake, please delete or destroy it, and notify the sender immediately. Phillip Securities Research shall not be liable for any direct or consequential loss arising from any use of material contained in this publication.
The information contained in this publication has been obtained from public sources, which Phillip Securities Research has no reason to believe are unreliable and any analysis, forecasts, projections, expectations and opinions (collectively, the “Research”) contained in this publication are based on such information and are expressions of belief of the individual author or the indicated source (as applicable) only. Phillip Securities Research has not verified this information and no representation or warranty, express or implied, is made that such information or Research is accurate, complete, appropriate or verified or should be relied upon as such. Any such information or Research contained in this publication is subject to change, and Phillip Securities Research shall not have any responsibility to maintain or update the information or Research made available or to supply any corrections, updates or releases in connection therewith. In no event will Phillip Securities Research or persons associated with or connected to Phillip Securities Research, including but not limited its officers, directors, employees or persons involved in the preparation or issuance of this report, (i) be liable in any manner whatsoever for any consequences (including but not limited to any special, direct, indirect, incidental or consequential losses, loss of profits and damages) of any reliance or usage of this publication or (ii) accept any legal responsibility from any person who receives this publication, even if it has been advised of the possibility of such damages. You must make the final investment decision and accept all responsibility for your investment decision, including, but not limited to your reliance on the information, data and/or other materials presented in this publication.
Any opinions, forecasts, assumptions, estimates, valuations and prices contained in this material are as of the date indicated and are subject to change at any time without prior notice. Past performance of any product referred to in this publication is not indicative of future results.
This report does not constitute, and should not be used as a substitute for, tax, legal or investment advice. This publication should not be relied upon exclusively or as authoritative, without further being subject to the recipient’s own independent verification and exercise of judgment. The fact that this publication has been made available constitutes neither a recommendation to enter into a particular transaction, nor a representation that any product described in this material is suitable or appropriate for the recipient. Recipients should be aware that many of the products, which may be described in this publication involve significant risks and may not be suitable for all investors, and that any decision to enter into transactions involving such products should not be made, unless all such risks are understood and an independent determination has been made that such transactions would be appropriate. Any discussion of the risks contained herein with respect to any product should not be considered to be a disclosure of all risks or a complete discussion of such risks. Nothing in this report shall be construed to be an offer or solicitation for the purchase or sale of any product. Any decision to purchase any product mentioned in this research should take into account existing public information, including any registered prospectus in respect of such product.
Phillip Securities Research, or persons associated with or connected to Phillip Securities Research, including but not limited to its officers, directors, employees or persons involved in the preparation or issuance of this report, may provide an array of financial services to a large number of corporations in Singapore and worldwide, including but not limited to commercial / investment banking activities (including sponsorship, financial advisory or underwriting activities), brokerage or securities trading activities. Phillip Securities Research, or persons associated with or connected to Phillip Securities Research, including but not limited to its officers, directors, employees or persons involved in the preparation or issuance of this report, may have participated in or invested in transactions with the issuer(s) of the securities mentioned in this publication, and may have performed services for or solicited business from such issuers. Additionally, Phillip Securities Research, or persons associated with or connected to Phillip Securities Research, including but not limited to its officers, directors, employees or persons involved in the preparation or issuance of this report, may have provided advice or investment services to such companies and investments or related investments, as may be mentioned in this publication.
Phillip Securities Research or persons associated with or connected to Phillip Securities Research, including but not limited to its officers, directors, employees or persons involved in the preparation or issuance of this report may, from time to time maintain a long or short position in securities referred to herein, or in related futures or options, purchase or sell, make a market in, or engage in any other transaction involving such securities, and earn brokerage or other compensation in respect of the foregoing. Investments will be denominated in various currencies including US dollars and Euro and thus will be subject to any fluctuation in exchange rates between US dollars and Euro or foreign currencies and the currency of your own jurisdiction. Such fluctuations may have an adverse effect on the value, price or income return of the investment.
To the extent permitted by law, Phillip Securities Research, or persons associated with or connected to Phillip Securities Research, including but not limited to its officers, directors, employees or persons involved in the preparation or issuance of this report, may at any time engage in any of the above activities as set out above or otherwise hold a interest, whether material or not, in respect of companies and investments or related investments, which may be mentioned in this publication. Accordingly, information may be available to Phillip Securities Research, or persons associated with or connected to Phillip Securities Research, including but not limited to its officers, directors, employees or persons involved in the preparation or issuance of this report, which is not reflected in this material, and Phillip Securities Research, or persons associated with or connected to Phillip Securities Research, including but not limited to its officers, directors, employees or persons involved in the preparation or issuance of this report, may, to the extent permitted by law, have acted upon or used the information prior to or immediately following its publication. Phillip Securities Research, or persons associated with or connected to Phillip Securities Research, including but not limited its officers, directors, employees or persons involved in the preparation or issuance of this report, may have issued other material that is inconsistent with, or reach different conclusions from, the contents of this material.
The information, tools and material presented herein are not directed, intended for distribution to or use by, any person or entity in any jurisdiction or country where such distribution, publication, availability or use would be contrary to the applicable law or regulation or which would subject Phillip Securities Research to any registration or licensing or other requirement, or penalty for contravention of such requirements within such jurisdiction. Section 27 of the Financial Advisers Act (Cap. 110) of Singapore and the MAS Notice on Recommendations on Investment Products (FAA-N01) do not apply in respect of this publication.
This material is intended for general circulation only and does not take into account the specific investment objectives, financial situation or particular needs of any particular person. The products mentioned in this material may not be suitable for all investors and a person receiving or reading this material should seek advice from a professional and financial adviser regarding the legal, business, financial, tax and other aspects including the suitability of such products, taking into account the specific investment objectives, financial situation or particular needs of that person, before making a commitment to invest in any of such products.
Please contact Phillip Securities Research at [65 65311240] in respect of any matters arising from, or in connection with, this document. This report is only for the purpose of distribution in Singapore.