Embed Size (px)
Citation preview
Bandwidth Trends on the
Internet… A Cable Data
Vendor’s Perspective
Tom Cloonan, Chief Strategy Officer, ARRIS
Agenda
• Introduction
• Observed Bandwidth Trends (& Predictions for the
Future)
• Networking Equipment Trends
• Conclusions
ARRIS Talk for IEEE - September 20112
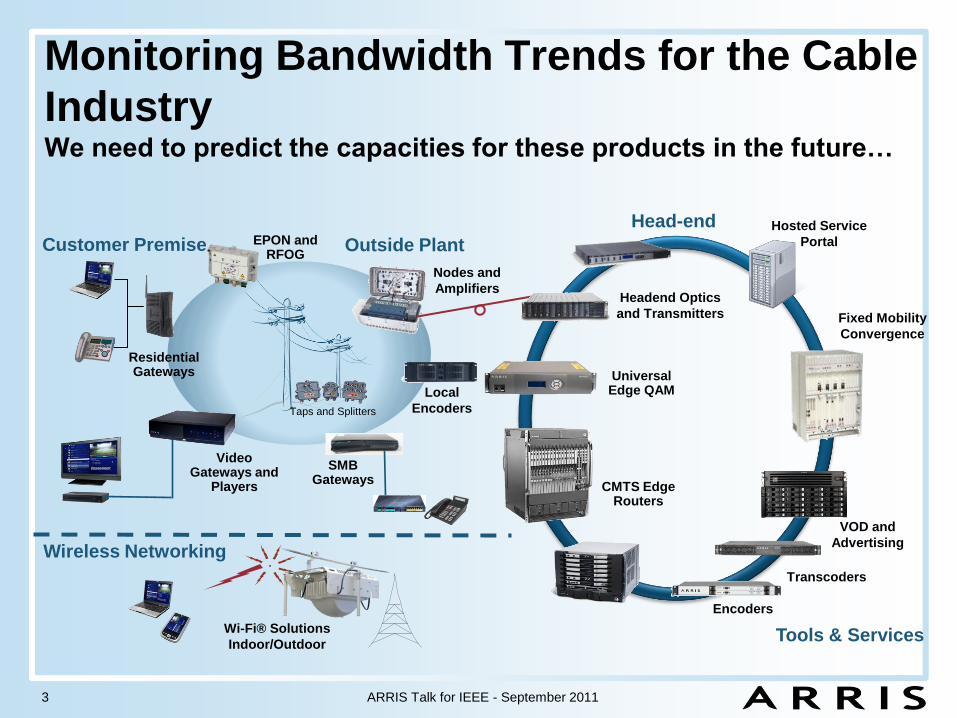
Monitoring Bandwidth Trends for the Cable
IndustryWe need to predict the capacities for these products in the future…
ARRIS Talk for IEEE - September 20113
Taps and Splitters
Headend Optics
and Transmitters
Universal Edge QAM
CMTS Edge Routers
Local
Encoders
Transcoders
Fixed Mobility
Convergence
Wireless Networking
Customer Premise
VOD and
Advertising
Encoders
EPON and RFOG
Residential Gateways
Nodes and
Amplifiers
Video Gateways and
Players
SMBGateways
Head-end Hosted Service
Portal
Wi-Fi® Solutions
Indoor/OutdoorTools & Services
Outside Plant
Agenda
• Introduction
• Observed Bandwidth Trends (& Predictions for
the Future)
• Networking Equipment Trends
• Conclusions
ARRIS Talk for IEEE - September 20114
ARRIS Investor Conference
March 2008
5www.arrisi.com
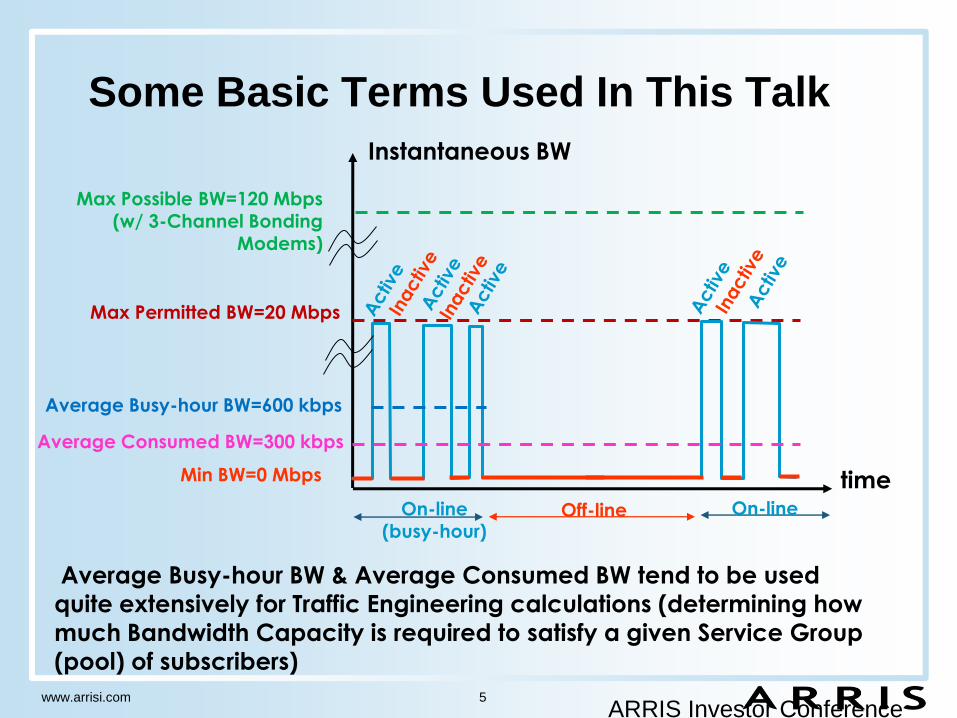
time
Instantaneous BW
Min BW=0 Mbps
Max Permitted BW=20 Mbps
Max Possible BW=120 Mbps(w/ 3-Channel Bonding
Modems)
On-line(busy-hour)
On-lineOff-line
Average Consumed BW=300 kbps
Average Busy-hour BW & Average Consumed BW tend to be used
quite extensively for Traffic Engineering calculations (determining how
much Bandwidth Capacity is required to satisfy a given Service Group
(pool) of subscribers)
Some Basic Terms Used In This Talk
Average Busy-hour BW=600 kbps
6
2.4 kbps
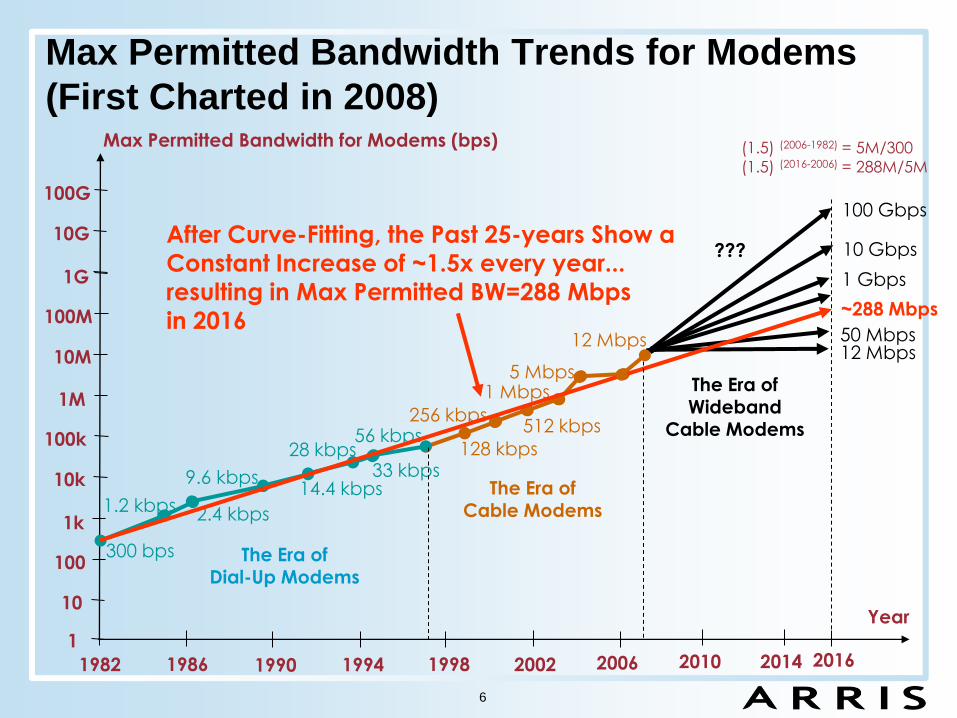
Max Permitted Bandwidth for Modems (bps)
1982 1986 1990 1994 1998
1
10
100
1k
300 bps
2002 2006
56 kbps
10k
100k
1M
1.2 kbps
9.6 kbps14.4 kbps
28 kbps33 kbps
10M
100M
1G
128 kbps
256 kbps512 kbps
1 Mbps5 Mbps
50 Mbps
The Era ofDial-Up Modems
The Era ofCable Modems
The Era ofWideband
Cable Modems
2010
Year
???
2014
10G
100G
12 Mbps
~288 Mbps
1 Gbps
10 Gbps
100 Gbps
12 Mbps
2016
After Curve-Fitting, the Past 25-years Show a
Constant Increase of ~1.5x every year...
resulting in Max Permitted BW=288 Mbps
in 2016
Max Permitted Bandwidth Trends for Modems
(First Charted in 2008)
(1.5) (2006-1982) = 5M/300
(1.5) (2016-2006) = 288M/5M
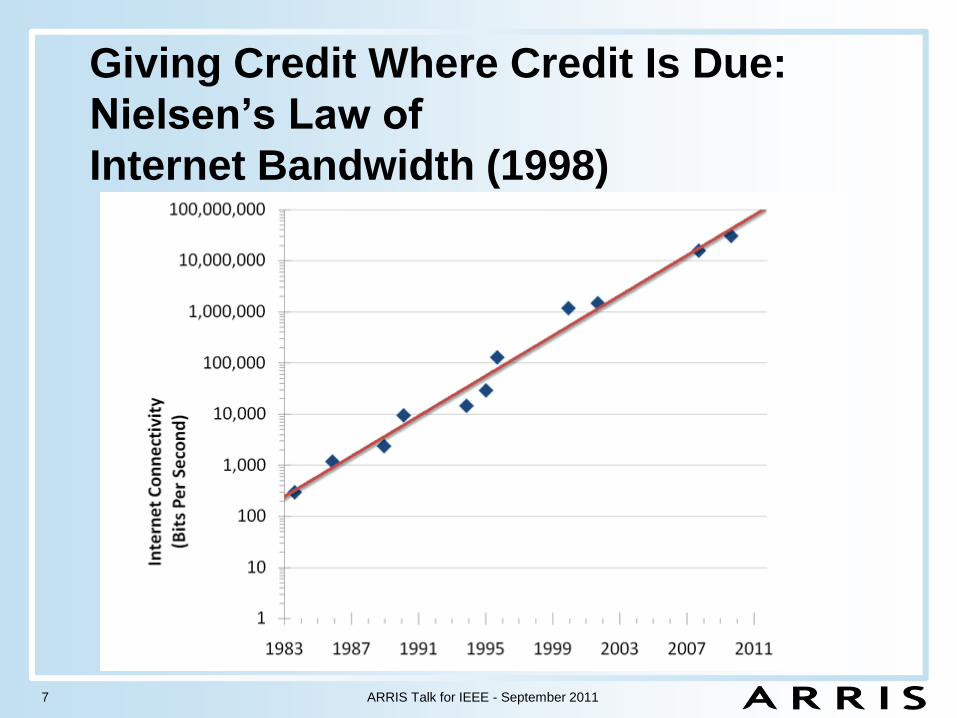
Giving Credit Where Credit Is Due:
Nielsen’s Law of
Internet Bandwidth (1998)
ARRIS Talk for IEEE - September 20117
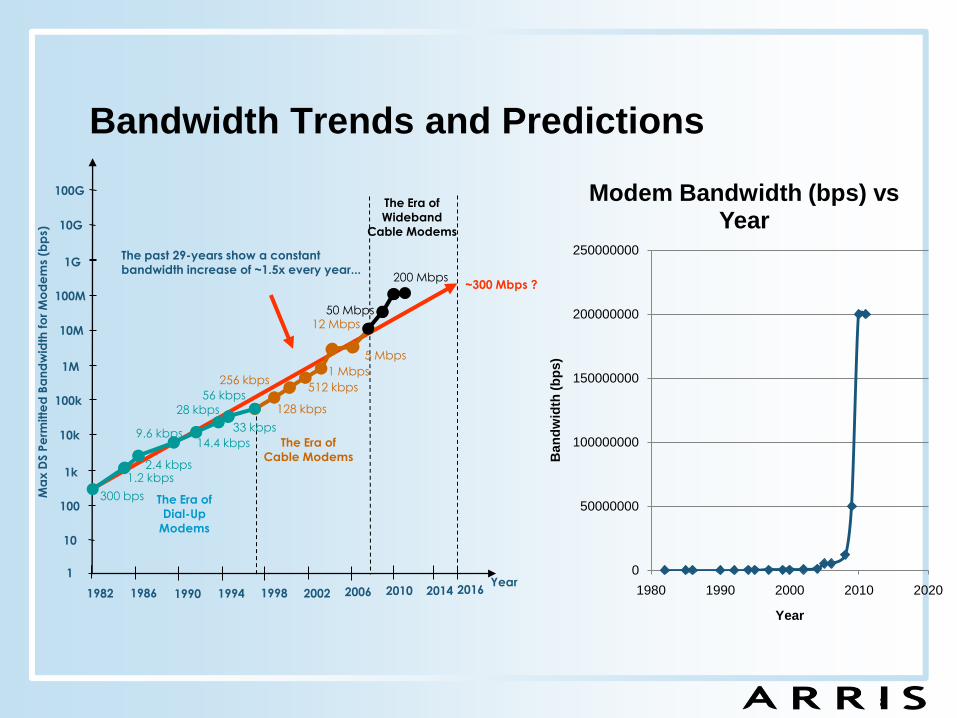
Bandwidth Trends and Predictions
Ma
x D
S P
erm
itte
d B
an
dw
idth
fo
r M
od
em
s (b
ps)
1982 1986 1990 1994 1998
1
10
100
1k
2002 2006
10k
100k
1M
10M
100M
1G
2010Year
2014
10G
100G
2016
The Era ofWideband
Cable Modems
12 Mbps
The past 29-years show a constantbandwidth increase of ~1.5x every year...
~300 Mbps ?
128 kbps
256 kbps512 kbps
1 Mbps
5 Mbps
The Era of
Cable Modems2.4 kbps
300 bps
56 kbps
1.2 kbps
9.6 kbps14.4 kbps
28 kbps
33 kbps
The Era of
Dial-Up
Modems
50 Mbps
200 Mbps
8
0
50000000
100000000
150000000
200000000
250000000
1980 1990 2000 2010 2020
Ban
dw
idth
(b
ps)
Year
Modem Bandwidth (bps) vs Year
9
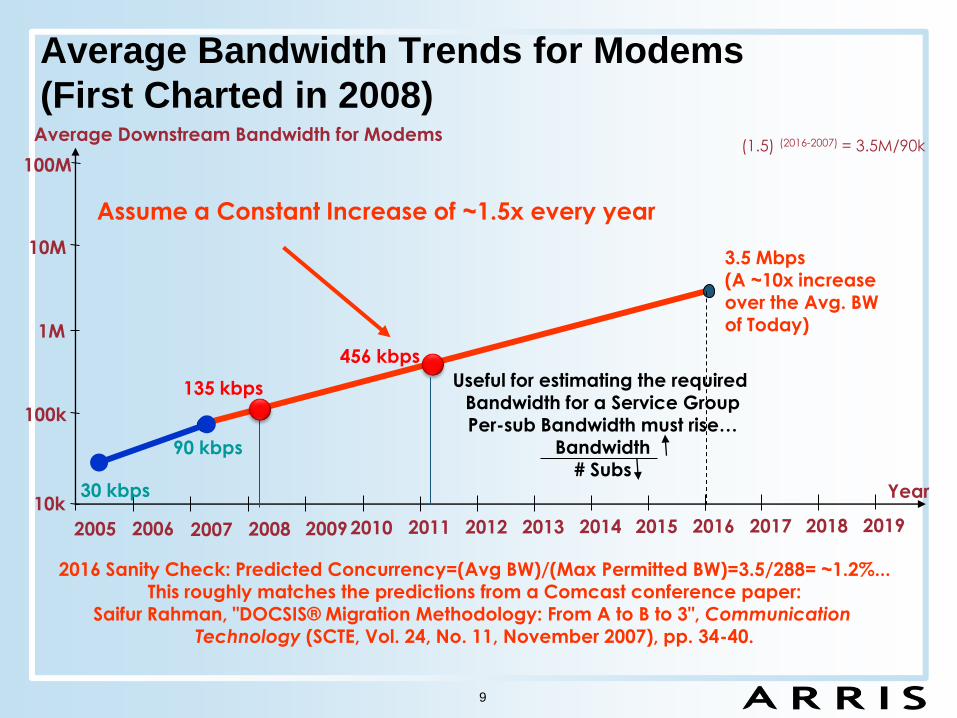
Average Bandwidth Trends for Modems
(First Charted in 2008)
2016 Sanity Check: Predicted Concurrency=(Avg BW)/(Max Permitted BW)=3.5/288= ~1.2%...
This roughly matches the predictions from a Comcast conference paper:Saifur Rahman, "DOCSIS® Migration Methodology: From A to B to 3", Communication
Technology (SCTE, Vol. 24, No. 11, November 2007), pp. 34-40.
Average Downstream Bandwidth for Modems
10k
100k
1M
10M
100M
2005 2006 2007 2008 2009
30 kbps
90 kbps
2010 2011 2012 2013 2014
Year
2015 2016
3.5 Mbps(A ~10x increaseover the Avg. BW
of Today)
2017 2018 2019
Useful for estimating the required Bandwidth for a Service GroupPer-sub Bandwidth must rise…
Bandwidth
# Subs
Assume a Constant Increase of ~1.5x every year
(1.5) (2016-2007) = 3.5M/90k
135 kbps
456 kbps
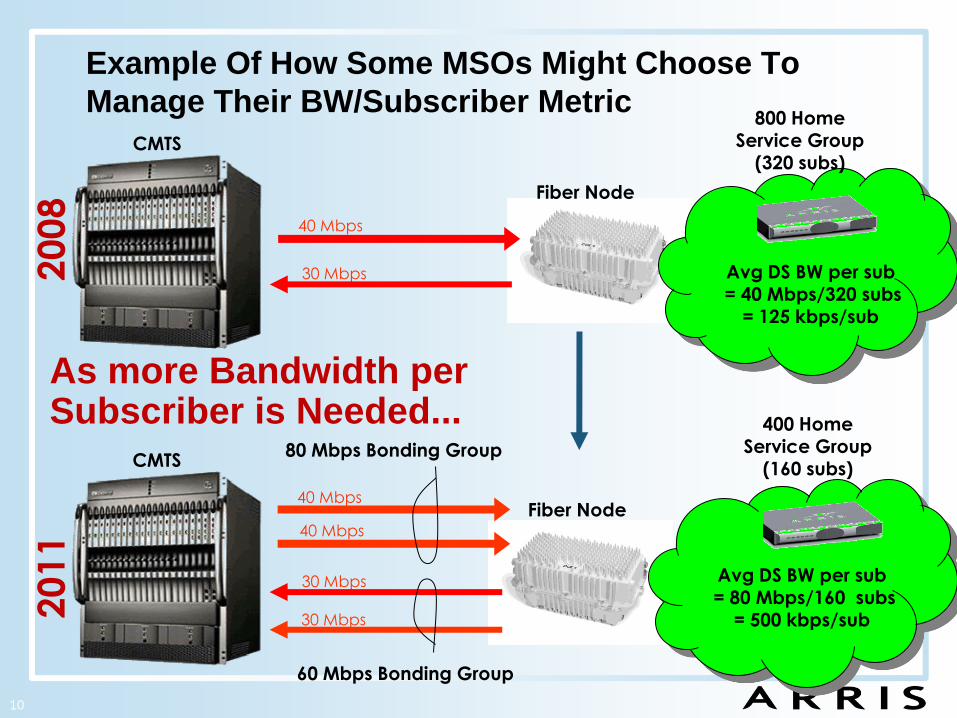
Example Of How Some MSOs Might Choose To
Manage Their BW/Subscriber Metric
10
CMTS
40 Mbps
30 Mbps
As more Bandwidth per Subscriber is Needed...
Avg DS BW per sub= 40 Mbps/320 subs
= 125 kbps/sub
800 Home Service Group
(320 subs)
Fiber Node
2008
CMTS
40 Mbps
40 Mbps
30 Mbps
30 Mbps
400 HomeService Group
(160 subs)
Fiber Node
80 Mbps Bonding Group
2011
Avg DS BW per sub= 80 Mbps/160 subs
= 500 kbps/sub
60 Mbps Bonding Group
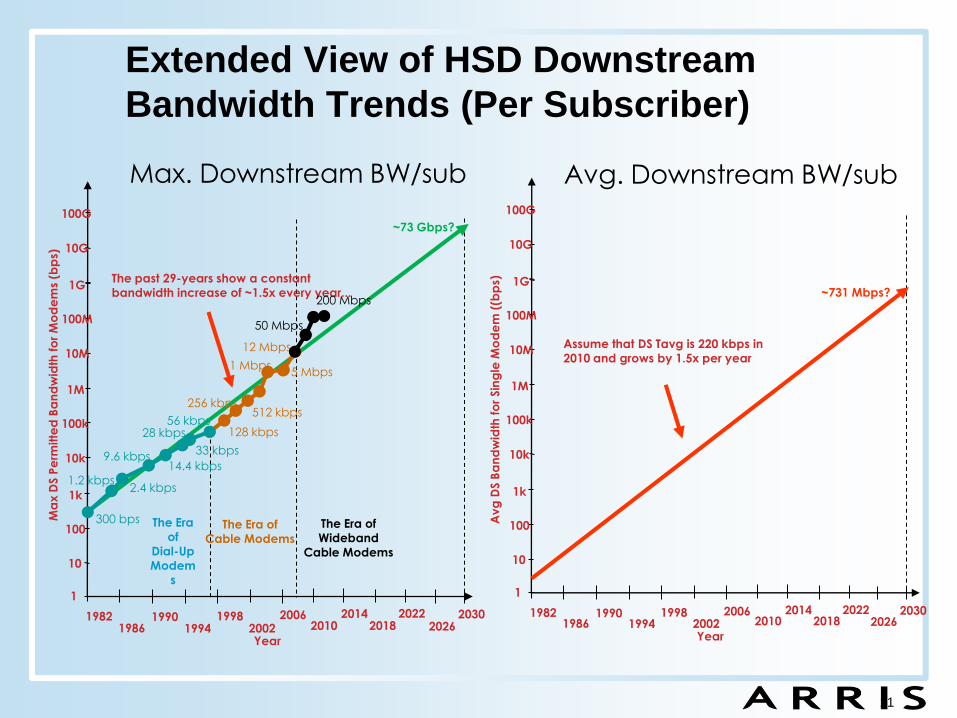
Extended View of HSD Downstream
Bandwidth Trends (Per Subscriber)
11
Ma
x D
S P
erm
itte
d B
an
dw
idth
fo
r M
od
em
s (b
ps)
19821986
19901994
1998
1
10
100
1k
20022006
10k
100k
1M
10M
100M
1G
2010
Year
2014
10G
100G
2018
The Era of
Wideband
Cable Modems
12 Mbps
The past 29-years show a constant
bandwidth increase of ~1.5x every year...
~73 Gbps?
128 kbps
256 kbps512 kbps
1 Mbps5 Mbps
The Era of
Cable Modems
2.4 kbps
300 bps
56 kbps
1.2 kbps
9.6 kbps14.4 kbps
28 kbps
33 kbps
The Era of
Dial-Up
Modem
s
50 Mbps
200 Mbps
2022
Avg
DS B
an
dw
idth
fo
r Sin
gle
Mo
de
m (
(bp
s)
19821986
19901994
1998
1
10
100
1k
20022006
10k
100k
1M
10M
100M
1G
2010
Year
2014
10G
100G
2018
Assume that DS Tavg is 220 kbps in
2010 and grows by 1.5x per year
~731 Mbps?
2022
Max. Downstream BW/sub Avg. Downstream BW/sub
20262030
20262030
A Philosophical Side-Bar on Downstream
Bandwidth Growth (Better Done Over Beers)
• Some argue that we will soon hit an asymptotic limit in Downstream Bandwidth Growth due to the limit of the human eye and mind to absorb information
• Ex: If a 20 Mbps, 3D-HD, H.264 video feed is sent to (on average) 2.3 people per home, then each home should be satiated with an average bandwidth offer of
(20 Mbps)*(2.3)=46 Mbps… which we predict we will hit by ~2023 (in ~12 years).
• Maybe… BUT…
− What about the impact of DVR pumping bandwidth?
− What about the impact of cloud technologies (like Apples iCloud)?
− What about machine-to-machine transfers for video search engines looking for our optimal content for each night?
− What about holography?
− What about the smell & touch & taste technologies that are yet-to-be invented?
• It may be a while before we hit the asymptotic limit…
ARRIS Talk for IEEE - September 201112
Source: ARRIS Estimates
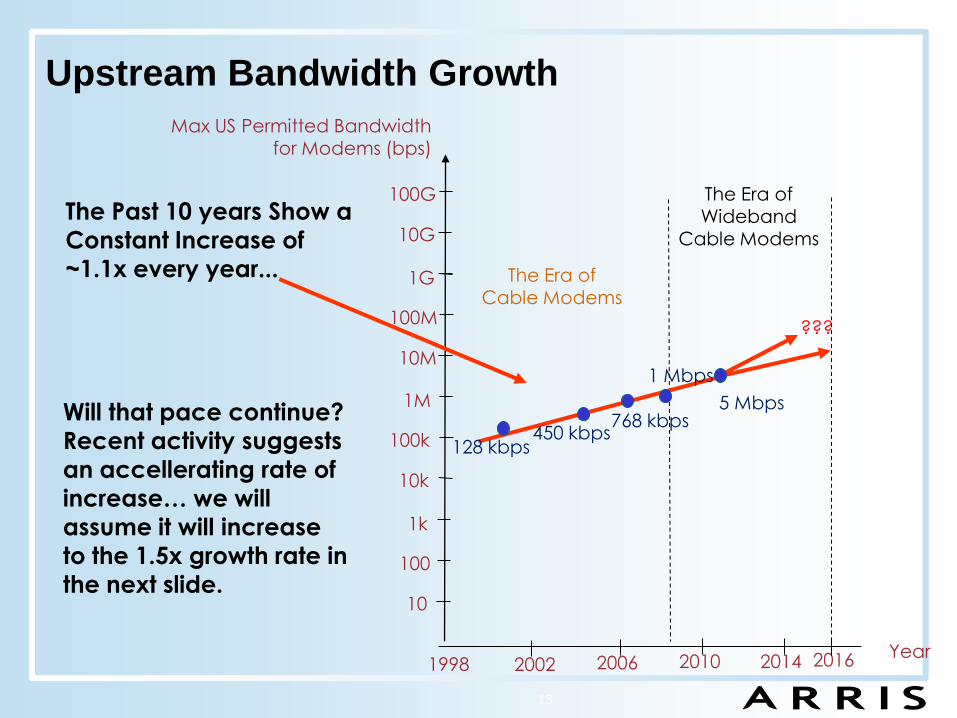
Upstream Bandwidth Growth
13
Max US Permitted Bandwidthfor Modems (bps)
1998
10
100
1k
2002 2006
10k
100k
1M
10M
100M
1G
2010Year
2014
10G
100G
2016
The Era ofWideband
Cable Modems
???
The Era ofCable Modems
The Past 10 years Show a
Constant Increase of
~1.1x every year...
128 kbps450 kbps
768 kbps
1 Mbps
Will that pace continue?
Recent activity suggests
an accellerating rate of
increase… we will
assume it will increase
to the 1.5x growth rate in
the next slide.
5 Mbps
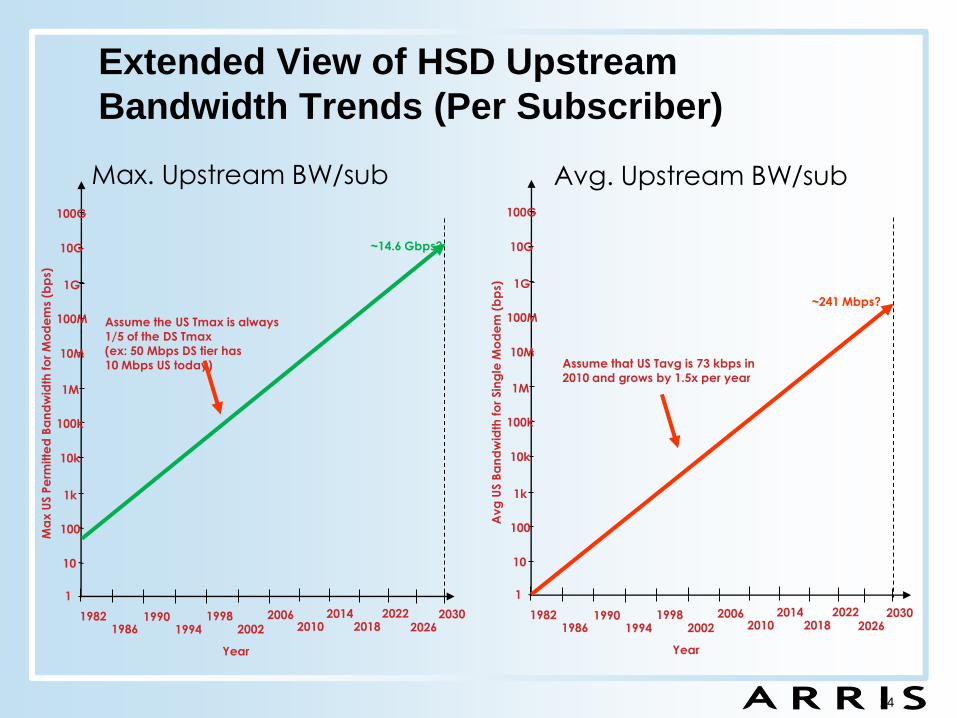
Extended View of HSD Upstream
Bandwidth Trends (Per Subscriber)
14
Max. Upstream BW/sub Avg. Upstream BW/sub
Avg
US B
an
dw
idth
fo
r Sin
gle
Mo
de
m (
bp
s)
19821986
19901994
1998
1
10
100
1k
2002
2006
10k
100k
1M
10M
100M
1G
2010
Year
2014
10G
100G
2018
Assume that US Tavg is 73 kbps in
2010 and grows by 1.5x per year
2022
Ma
x U
S P
erm
itte
d B
an
dw
idth
fo
r M
od
em
s (b
ps)
19821986
19901994
1998
1
10
100
1k
2002
2006
10k
100k
1M
10M
100M
1G
2010
Year
2014
10G
100G
2018
Assume the US Tmax is always
1/5 of the DS Tmax
(ex: 50 Mbps DS tier has
10 Mbps US today)
~14.6 Gbps?
20222026
20302026
2030
~241 Mbps?
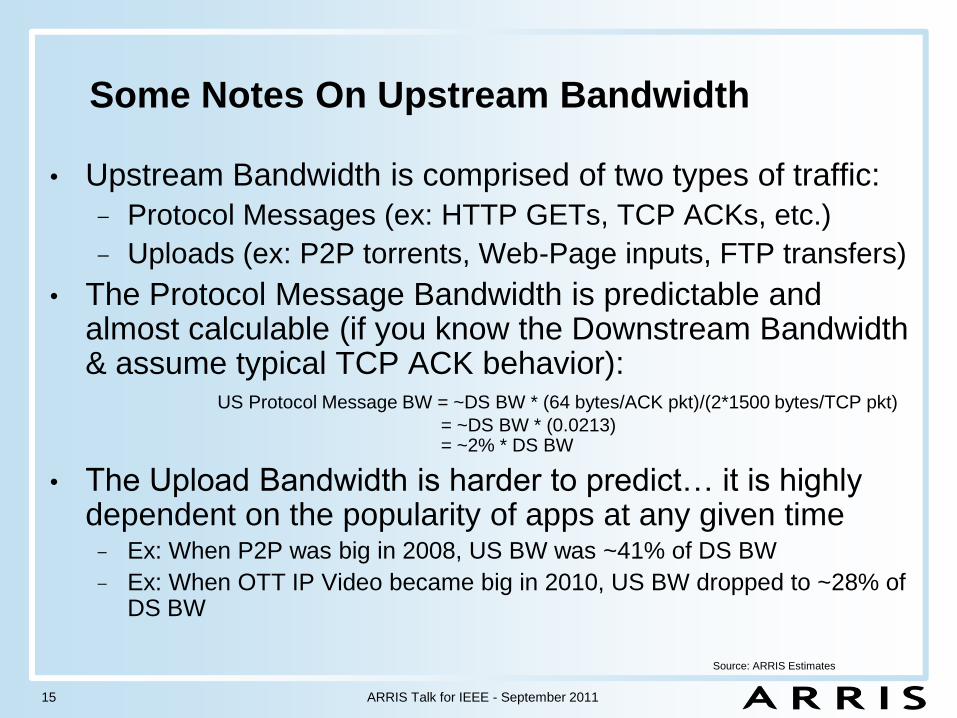
Some Notes On Upstream Bandwidth
• Upstream Bandwidth is comprised of two types of traffic:
− Protocol Messages (ex: HTTP GETs, TCP ACKs, etc.)
− Uploads (ex: P2P torrents, Web-Page inputs, FTP transfers)
• The Protocol Message Bandwidth is predictable and almost calculable (if you know the Downstream Bandwidth & assume typical TCP ACK behavior):
US Protocol Message BW = ~DS BW * (64 bytes/ACK pkt)/(2*1500 bytes/TCP pkt)
= ~DS BW * (0.0213)= ~2% * DS BW
• The Upload Bandwidth is harder to predict… it is highly dependent on the popularity of apps at any given time− Ex: When P2P was big in 2008, US BW was ~41% of DS BW
− Ex: When OTT IP Video became big in 2010, US BW dropped to ~28% of DS BW
ARRIS Talk for IEEE - September 201115
Source: ARRIS Estimates
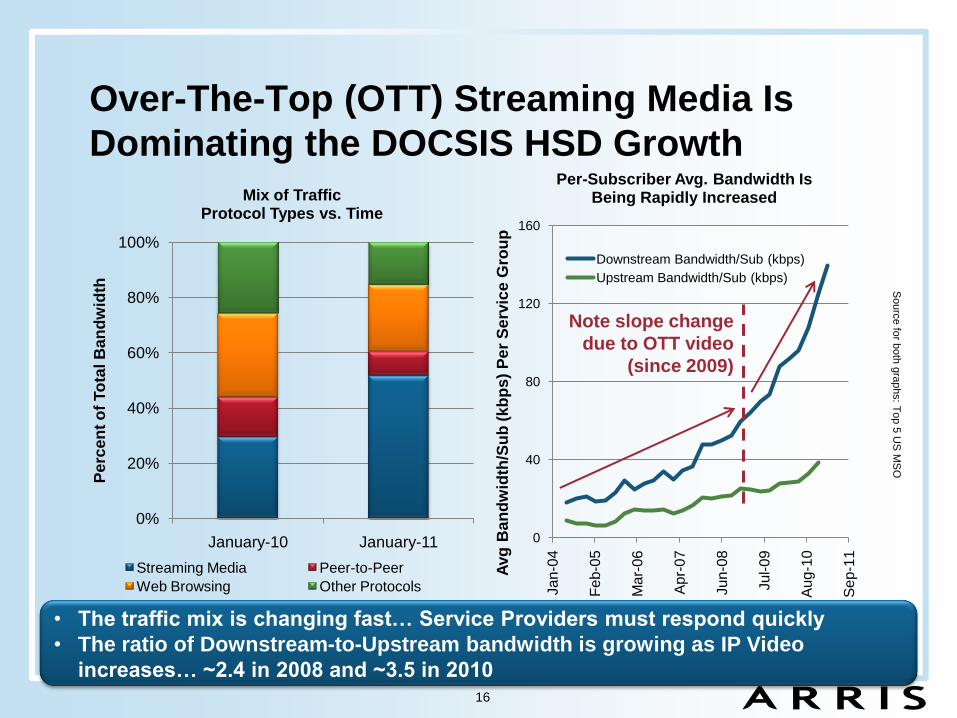
Over-The-Top (OTT) Streaming Media Is
Dominating the DOCSIS HSD Growth
0%
20%
40%
60%
80%
100%
January-10 January-11
Pe
rce
nt
of
To
tal B
an
dw
idth
Mix of Traffic Protocol Types vs. Time
Streaming Media Peer-to-Peer
Web Browsing Other Protocols
0
40
80
120
160
Ja
n-0
4
Feb-0
5
Ma
r-06
Ap
r-07
Ju
n-0
8
Ju
l-09
Au
g-1
0
Se
p-1
1
Avg
Ban
dw
idth
/Su
b (
kb
ps
) P
er
Se
rvic
e G
rou
p
Per-Subscriber Avg. Bandwidth Is Being Rapidly Increased
Downstream Bandwidth/Sub (kbps)
Upstream Bandwidth/Sub (kbps)
16
• The traffic mix is changing fast… Service Providers must respond quickly
• The ratio of Downstream-to-Upstream bandwidth is growing as IP Video
increases… ~2.4 in 2008 and ~3.5 in 2010
Note slope change
due to OTT video
(since 2009)
Sourc
e fo
r both
gra
phs: T
op 5
US
MS
O
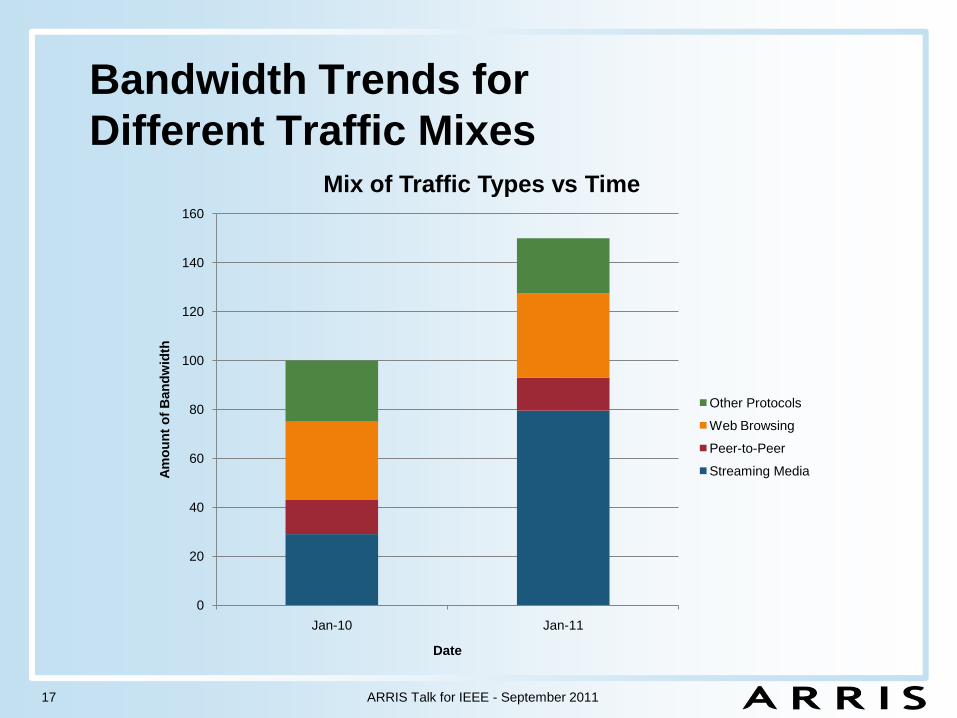
Bandwidth Trends for
Different Traffic Mixes
ARRIS Talk for IEEE - September 201117
0
20
40
60
80
100
120
140
160
Jan-10 Jan-11
Am
ou
nt
of
Ban
dw
idth
Date
Mix of Traffic Types vs Time
Other Protocols
Web Browsing
Peer-to-Peer
Streaming Media
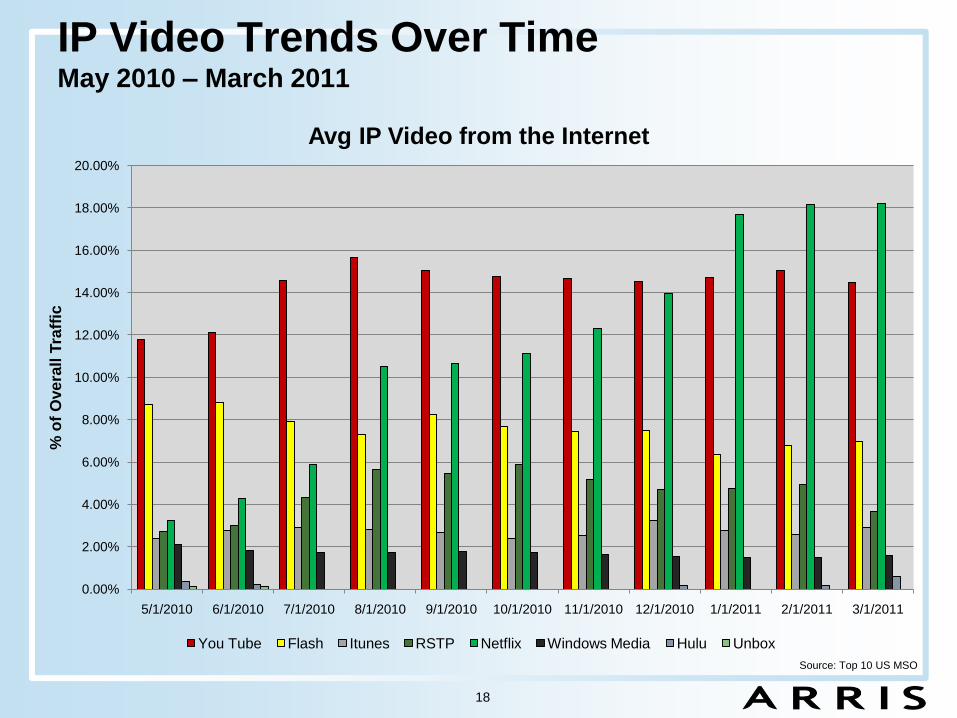
IP Video Trends Over TimeMay 2010 – March 2011
0.00%
2.00%
4.00%
6.00%
8.00%
10.00%
12.00%
14.00%
16.00%
18.00%
20.00%
5/1/2010 6/1/2010 7/1/2010 8/1/2010 9/1/2010 10/1/2010 11/1/2010 12/1/2010 1/1/2011 2/1/2011 3/1/2011
% o
f O
ve
rall
Tra
ffic
Avg IP Video from the Internet
You Tube Flash Itunes RSTP Netflix Windows Media Hulu Unbox
18
Source: Top 10 US MSO
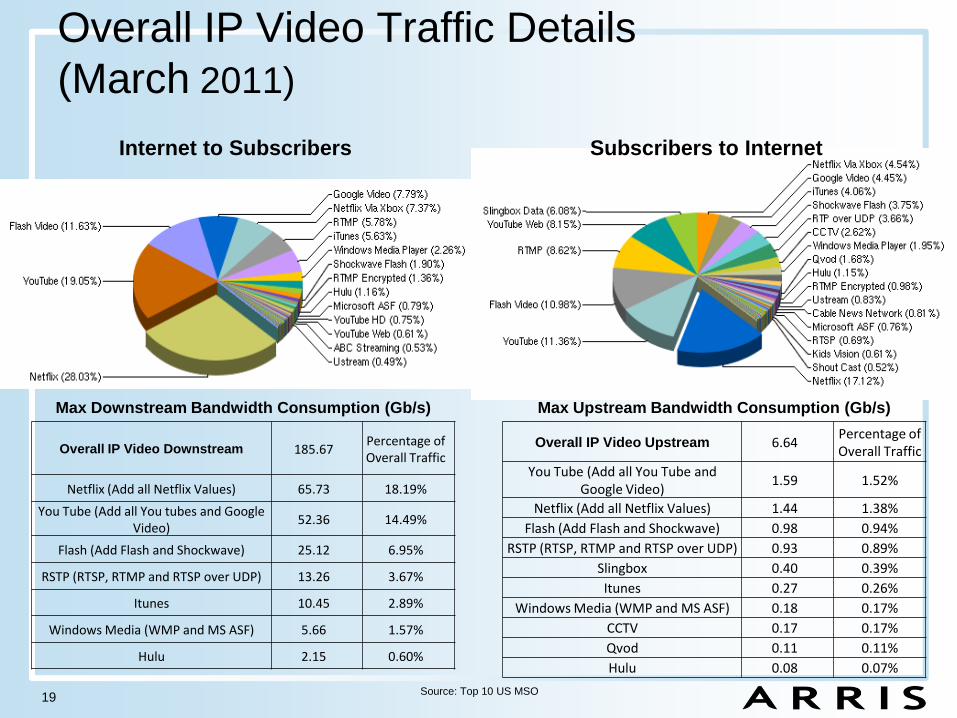
Overall IP Video Traffic Details
(March 2011)
Max Downstream Bandwidth Consumption (Gb/s)
Overall IP Video Upstream 6.64Percentage of Overall Traffic
You Tube (Add all You Tube and Google Video)
1.59 1.52%
Netflix (Add all Netflix Values) 1.44 1.38%
Flash (Add Flash and Shockwave) 0.98 0.94%
RSTP (RTSP, RTMP and RTSP over UDP) 0.93 0.89%
Slingbox 0.40 0.39%
Itunes 0.27 0.26%
Windows Media (WMP and MS ASF) 0.18 0.17%
CCTV 0.17 0.17%
Qvod 0.11 0.11%
Hulu 0.08 0.07%
Overall IP Video Downstream 185.67Percentage of Overall Traffic
Netflix (Add all Netflix Values) 65.73 18.19%
You Tube (Add all You tubes and Google Video)
52.36 14.49%
Flash (Add Flash and Shockwave) 25.12 6.95%
RSTP (RTSP, RTMP and RTSP over UDP) 13.26 3.67%
Itunes 10.45 2.89%
Windows Media (WMP and MS ASF) 5.66 1.57%
Hulu 2.15 0.60%
Max Upstream Bandwidth Consumption (Gb/s)
19
Internet to Subscribers Subscribers to Internet
Source: Top 10 US MSO
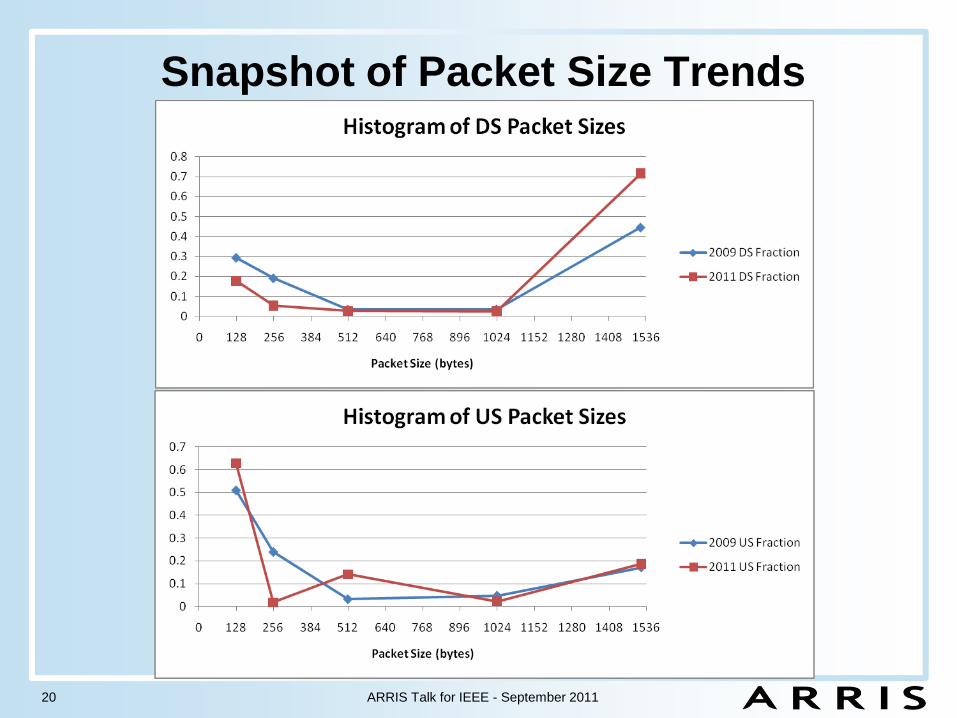
Snapshot of Packet Size Trends
ARRIS Talk for IEEE - September 201120
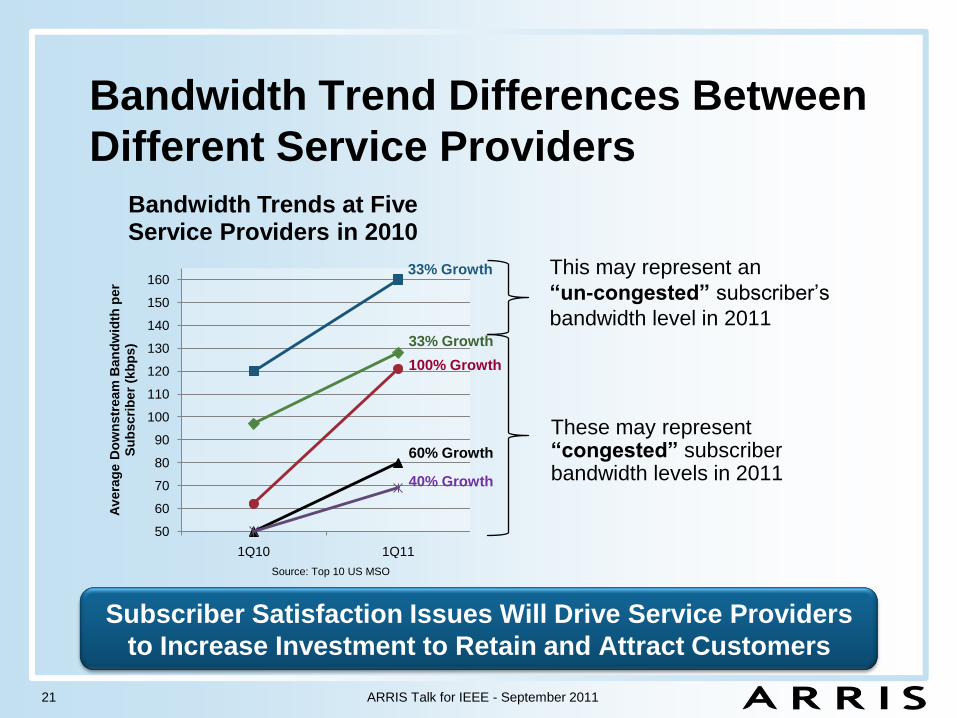
Bandwidth Trend Differences Between
Different Service Providers
ARRIS Talk for IEEE - September 201121
Subscriber Satisfaction Issues Will Drive Service Providers
to Increase Investment to Retain and Attract Customers
This may represent an
“un-congested” subscriber’s
bandwidth level in 2011
These may represent “congested” subscriber bandwidth levels in 2011
50
60
70
80
90
100
110
120
130
140
150
160
1Q10 1Q11
Av
era
ge D
ow
nstr
eam
Ban
dw
idth
per
Su
bscri
ber
(kb
ps)
Bandwidth Trends at Five Service Providers in 2010
33% Growth
33% Growth
100% Growth
60% Growth
40% Growth
Source: Top 10 US MSO
Agenda
• Introduction
• Observed Bandwidth Trends (& Predictions for the
Future)
• Networking Equipment Trends
• Conclusions
ARRIS Talk for IEEE - September 201122
Why Discuss Equipment In A Talk On
Bandwidth Trends?
• In order for the Bandwidth Trends to materialize, the available Equipment MUST be able to support the predicted Bandwidths at acceptable cost levels
• We will explore this topic from the point-of-view of DOCSIS CMTS Equipment, which serve 20-50 “Service Groups”
• For an Typical Single High-Speed Data “Service Group” with ~500 Homes Passed, MSOs predict:
− 2008: 1 DOCSIS Downstream (~40 Mbps)
− 2011: 4 DOCSIS Downstreams (~160 Mbps)
− 2015: ~20 DOCSIS Downstreams (~800 Mbps)
ARRIS Talk for IEEE - September 201123
Source: ARRIS Estimates
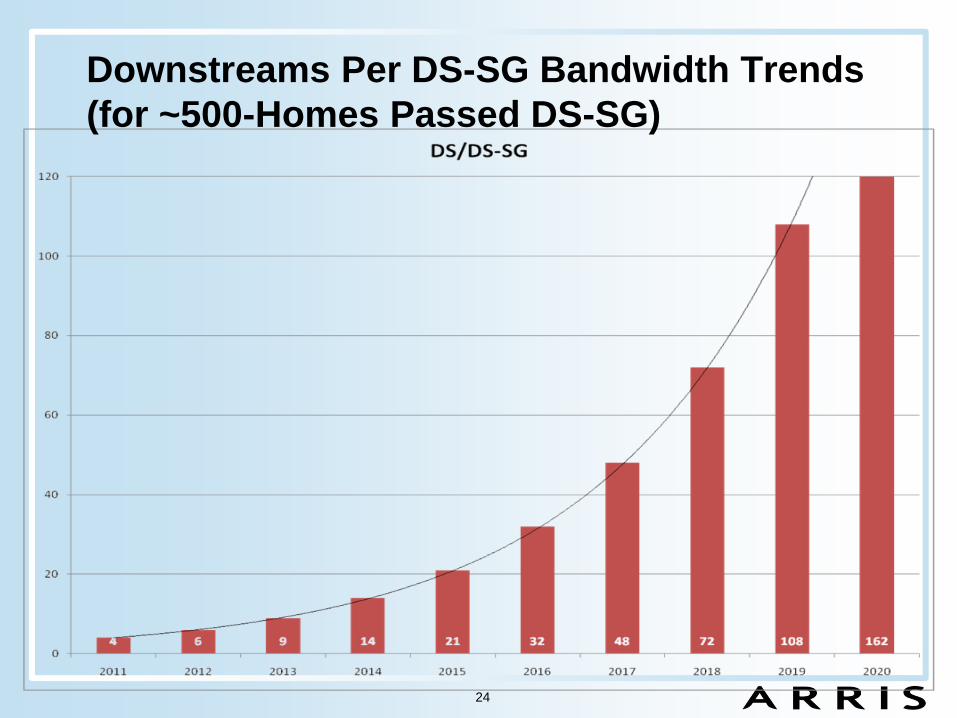
Downstreams Per DS-SG Bandwidth Trends
(for ~500-Homes Passed DS-SG)
24
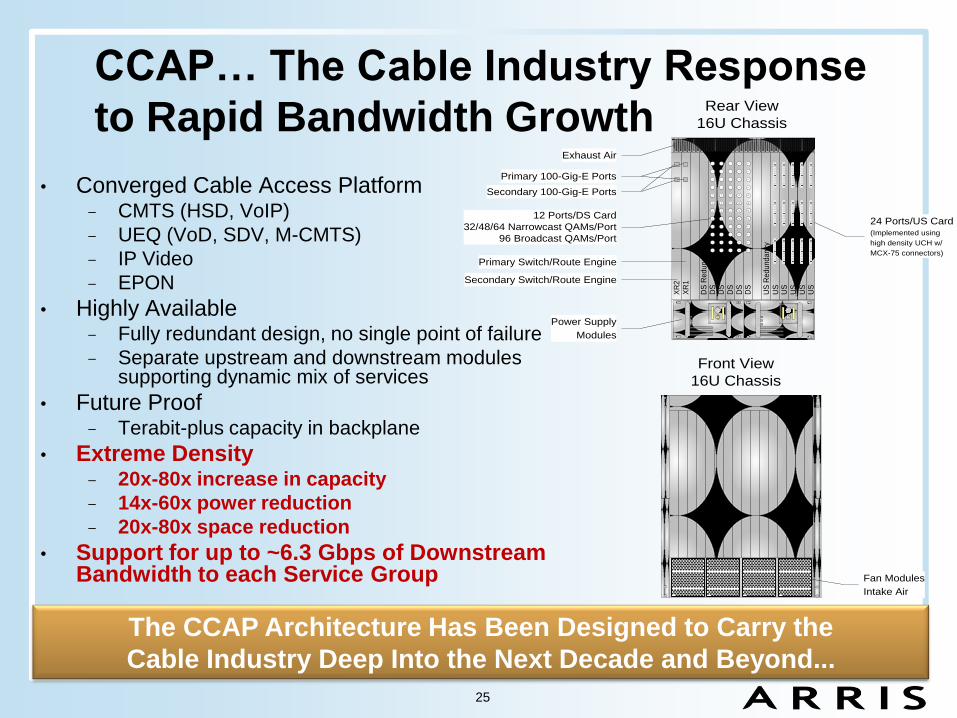
CCAP… The Cable Industry Response
to Rapid Bandwidth Growth
• Converged Cable Access Platform− CMTS (HSD, VoIP)
− UEQ (VoD, SDV, M-CMTS)
− IP Video
− EPON
• Highly Available− Fully redundant design, no single point of failure
− Separate upstream and downstream modules supporting dynamic mix of services
• Future Proof− Terabit-plus capacity in backplane
• Extreme Density− 20x-80x increase in capacity
− 14x-60x power reduction
− 20x-80x space reduction
• Support for up to ~6.3 Gbps of Downstream Bandwidth to each Service Group
25
The CCAP Architecture Has Been Designed to Carry the
Cable Industry Deep Into the Next Decade and Beyond...
US
US
Re
du
nd
an
cyU
SU
SU
SU
S
DS
DS
Re
du
nd
an
cyD
SD
SD
SD
S
XR
1X
R2
Power Supply
Modules
Primary Switch/Route Engine
12 Ports/DS Card
32/48/64 Narrowcast QAMs/Port
96 Broadcast QAMs/Port
Fan Modules
Intake Air
Primary 100-Gig-E Ports
Secondary 100-Gig-E Ports
Exhaust Air
Secondary Switch/Route Engine
24 Ports/US Card(Implemented using
high density UCH w/
MCX-75 connectors)
Front View
16U Chassis
Rear View
16U Chassis
ARRIS Talk for IEEE - September 201126
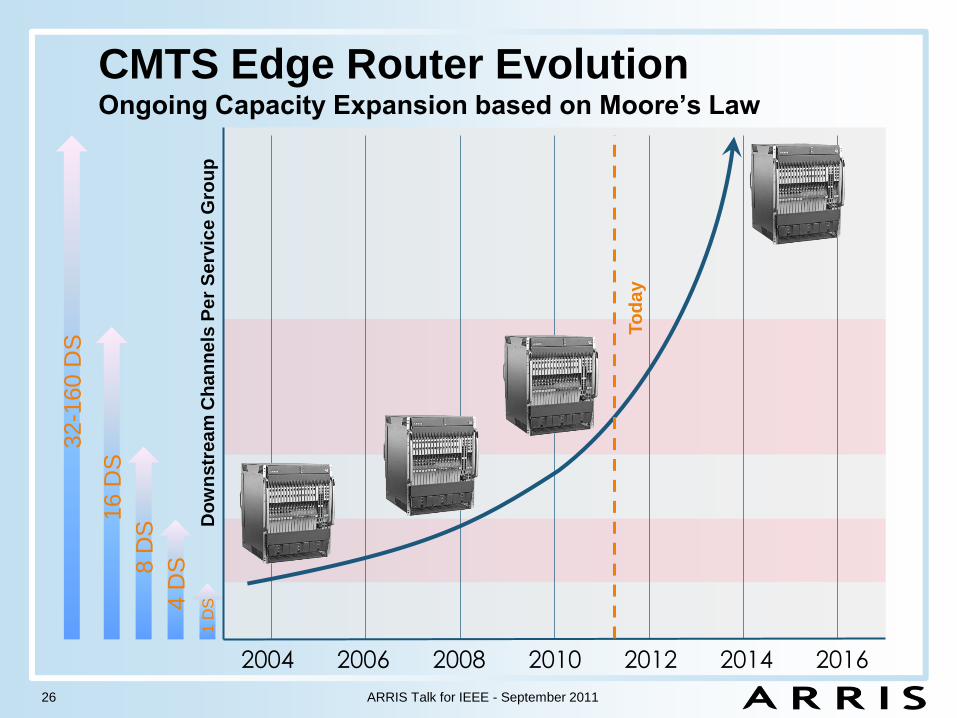
1 D
S4 D
S8 D
S
16 D
S
32-1
60
DS
2004 2006 2008 2010 2012 2014 2016
Do
wn
str
ea
m C
ha
nn
els
Pe
r S
erv
ice
Gro
up
CMTS Edge Router EvolutionOngoing Capacity Expansion based on Moore’s Law
To
da
y
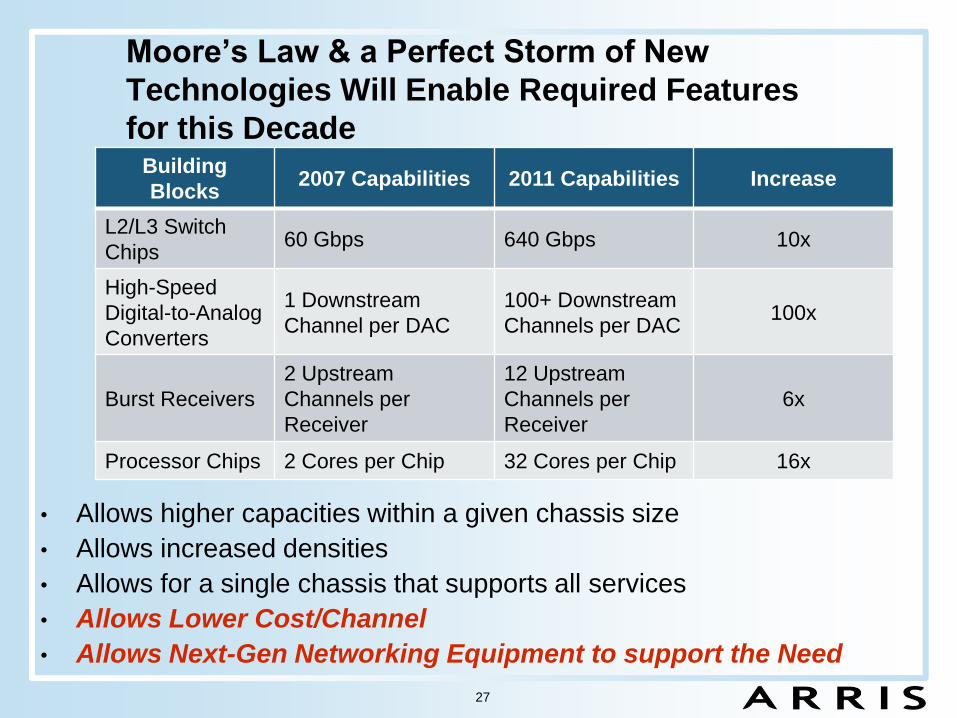
Moore’s Law & a Perfect Storm of New
Technologies Will Enable Required Features
for this Decade
• Allows higher capacities within a given chassis size
• Allows increased densities
• Allows for a single chassis that supports all services
• Allows Lower Cost/Channel
• Allows Next-Gen Networking Equipment to support the Need
27
Building
Blocks2007 Capabilities 2011 Capabilities Increase
L2/L3 Switch
Chips60 Gbps 640 Gbps 10x
High-Speed
Digital-to-Analog
Converters
1 Downstream
Channel per DAC
100+ Downstream
Channels per DAC100x
Burst Receivers
2 Upstream
Channels per
Receiver
12 Upstream
Channels per
Receiver
6x
Processor Chips 2 Cores per Chip 32 Cores per Chip 16x
Agenda
• Introduction
• Observed Bandwidth Trends (& Predictions for the
Future)
• Networking Equipment Trends
• Conclusions
ARRIS Talk for IEEE - September 201128
Conclusions
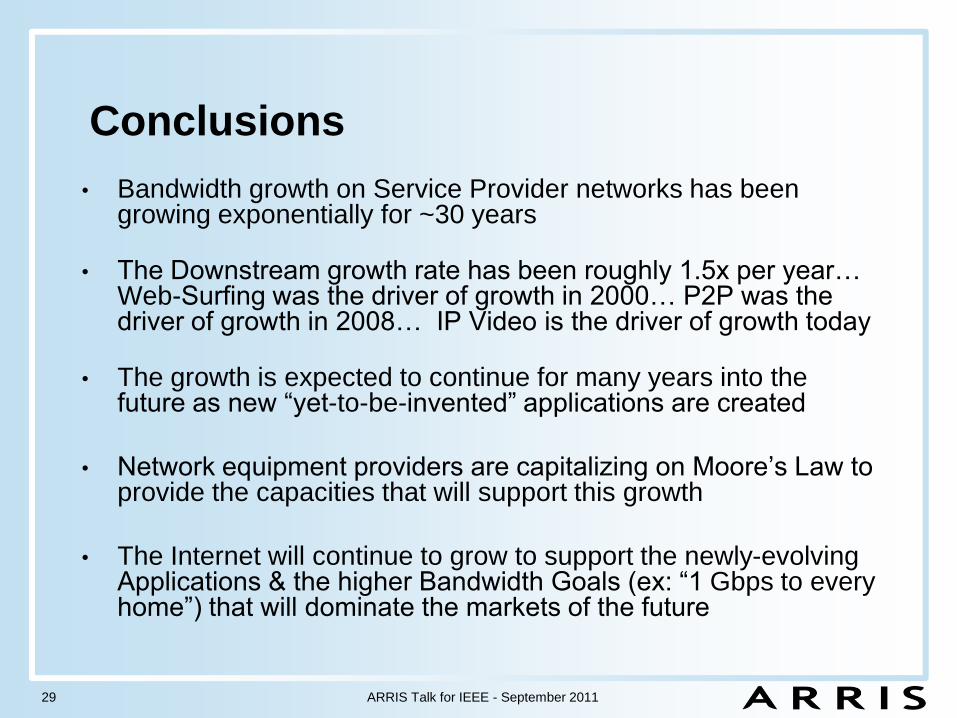
• Bandwidth growth on Service Provider networks has been growing exponentially for ~30 years
• The Downstream growth rate has been roughly 1.5x per year… Web-Surfing was the driver of growth in 2000… P2P was the driver of growth in 2008… IP Video is the driver of growth today
• The growth is expected to continue for many years into the future as new “yet-to-be-invented” applications are created
• Network equipment providers are capitalizing on Moore’s Law to provide the capacities that will support this growth
• The Internet will continue to grow to support the newly-evolving Applications & the higher Bandwidth Goals (ex: “1 Gbps to every home”) that will dominate the markets of the future
ARRIS Talk for IEEE - September 201129
THANK YOU