Embed Size (px)
Citation preview
Investor Presentation
August 2011

Industry Overview
Perfumed Hair Oil Segment
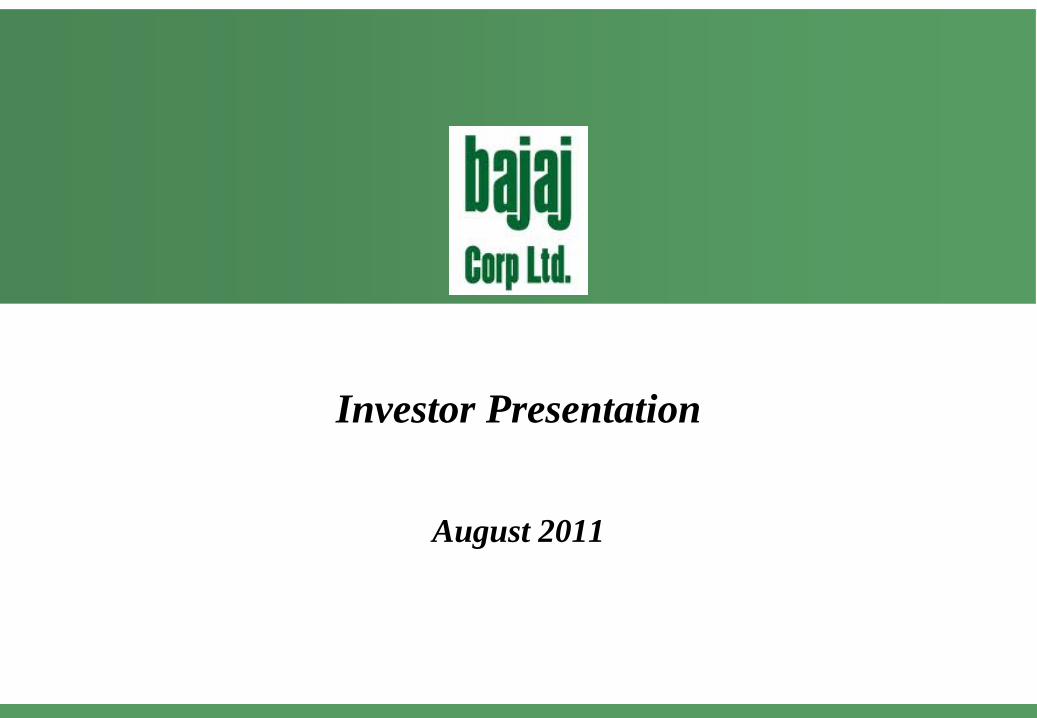
Industry Size and Structure
Hair Oil is > 55% of the overall hair care industry in India
FMCG
Rs.133,876 cr (USD 29.8 bn)
Hair Care
Rs. 10,243 cr (USD 2.3 bn)
Shampoo
Rs. 3277cr
(USD 728 mn)
(32.0%)*
Perfumed Oil
Rs. 3175 cr
(USD 705 mn)
(31.0%)*
Coconut Oil
Rs. 2151 cr
(USD 478 mn)
(21.0%)*
Hair Conditioners
Rs. 204 cr
(USD 45 mn)
(2.0%)*
Hair Dyes
Rs. 1,434 cr
(USD 319 mn)
(14.0%)*
Hair Oil Market
Coconut based
Oils
(50%)*
Heavy Amla
based Oils
(15%)*
Light Hair Oils
(13%)*
Cooling Oils
(12%) *
Others
(10%)*
Source: The AC Nielsen Retail Audit Report.
Only branded products data for CY 2010
* Value based share of Hair Care Market
8% salience
2
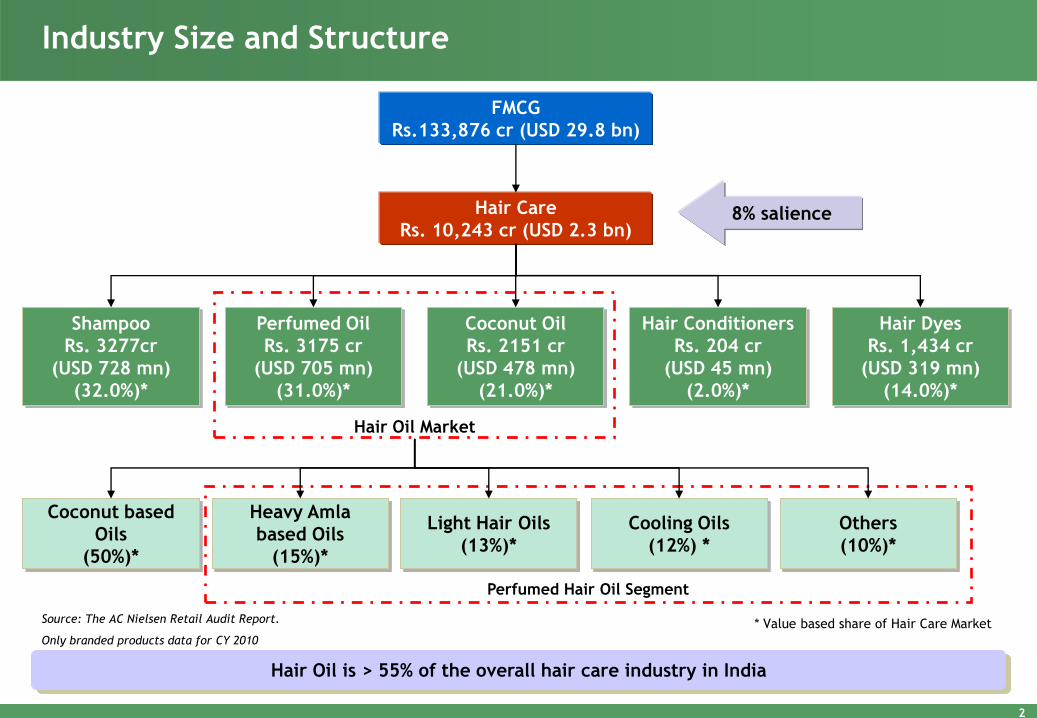
Hair Oil Market in India
Overall Hair Oil Market – Volume Overall Oil Market – Value
Light Hair Oil – Volume Light Hair Oil – Value
Light hair oils is one of the fastest growing segments in the hair oil market in India
Source: The AC Nielsen Retail Audit Report.
(In K
Ltr
) (I
n K
Ltr
)
(Rs.
Cr.
) (R
s. C
r.)
Y-o
-Y 30%
Y
-o-Y
33%
Y-o
-Y 40%
Y-o
-Y 14%
Y-o
-Y 6.7
%
Y-o
-Y 1
6.8
%
11764
15,603
18,390 19,516
22,464
6,169
0
5,000
10,000
15,000
20,000
25,000
06-07 07-08 08-09 09-10 10-11 11-12 (3M)
336
472
610
696
833
237
0
100
200
300
400
500
600
700
800
900
06-07 07-08 08-09 09-10 10-11 11-12 (3M)
Y-o
-Y 18%
Y-o
-Y 6.1
%
Y-o
-Y15.1
%
Y-o
-Y 29%
Y-o
-Y 14%
Y-o
-Y 1
9.7
%
Y-o
-Y 31%
Y-o
-Y 21%
Y-o
-Y 10.5
%
Y-o
-Y 1
7.9
% 132560
172,528 197,057
210,374
245,655
62,413
0
50,000
100,000
150,000
200,000
250,000
300,000
06-07 07-08 08-09 09-10 10-11 11-12 (3M)
2,827
3,707
4,498 4,971
5,862
1,695
0
1,000
2,000
3,000
4,000
5,000
6,000
7,000
06-07 07-08 08-09 09-10 10-11 11-12 (3M)
Q-o
Q
4.8
%
Q-o
--Q
16.5
%
Q-o
--Q
20.9
%
Q-o
-Q
23.8
%
3
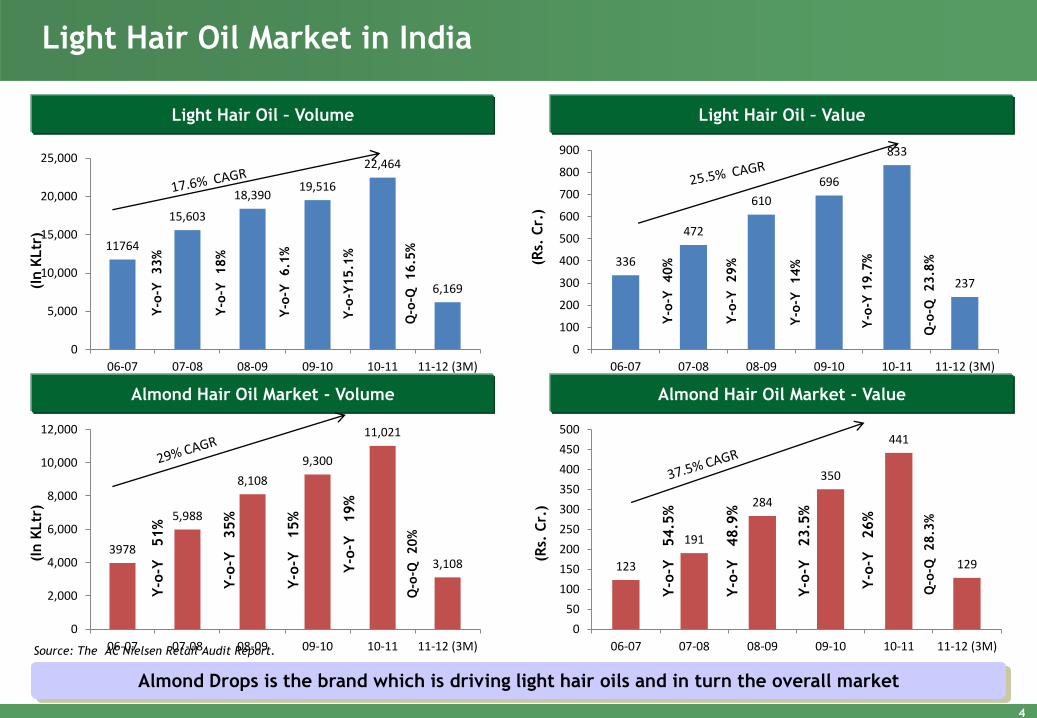
Light Hair Oil Market in India
Light Hair Oil – Volume Light Hair Oil – Value
Almond Hair Oil Market - Volume Almond Hair Oil Market - Value
Almond Drops is the brand which is driving light hair oils and in turn the overall market
Source: The AC Nielsen Retail Audit Report.
(In K
Ltr
)
(Rs.
Cr.
) (R
s. C
r.)
Y-o
-Y 40%
336
472
610
696
833
237
0
100
200
300
400
500
600
700
800
900
06-07 07-08 08-09 09-10 10-11 11-12 (3M)
Y-o
-Y 29%
Y-o
-Y 14%
Y-o
-Y 1
9.7
%
123
191
284
350
441
129
0
50
100
150
200
250
300
350
400
450
500
06-07 07-08 08-09 09-10 10-11 11-12 (3M)
Y-o
-Y 5
4.5
%
Y-o
-Y 4
8.9
%
Y-o
-Y 2
3.5
%
Y-o
-Y 2
6%
3978
5,988
8,108
9,300
11,021
3,108
0
2,000
4,000
6,000
8,000
10,000
12,000
06-07 07-08 08-09 09-10 10-11 11-12 (3M)
Y-o
-Y 5
1%
Y-o
-Y 3
5%
Y-o
-Y 1
5%
Y-o
-Y 1
9%
(In K
Ltr
)
Y-o
-Y 33%
11764
15,603
18,390 19,516
22,464
6,169
0
5,000
10,000
15,000
20,000
25,000
06-07 07-08 08-09 09-10 10-11 11-12 (3M)
Y-o
-Y 18%
Y-o
-Y 6.1
%
Y-o
-Y15.1
%
Q-o
-Q
16.5
%
Q-o
-Q
23.8
%
Q-o
-Q
20%
Q-o
-Q
28.3
%
4
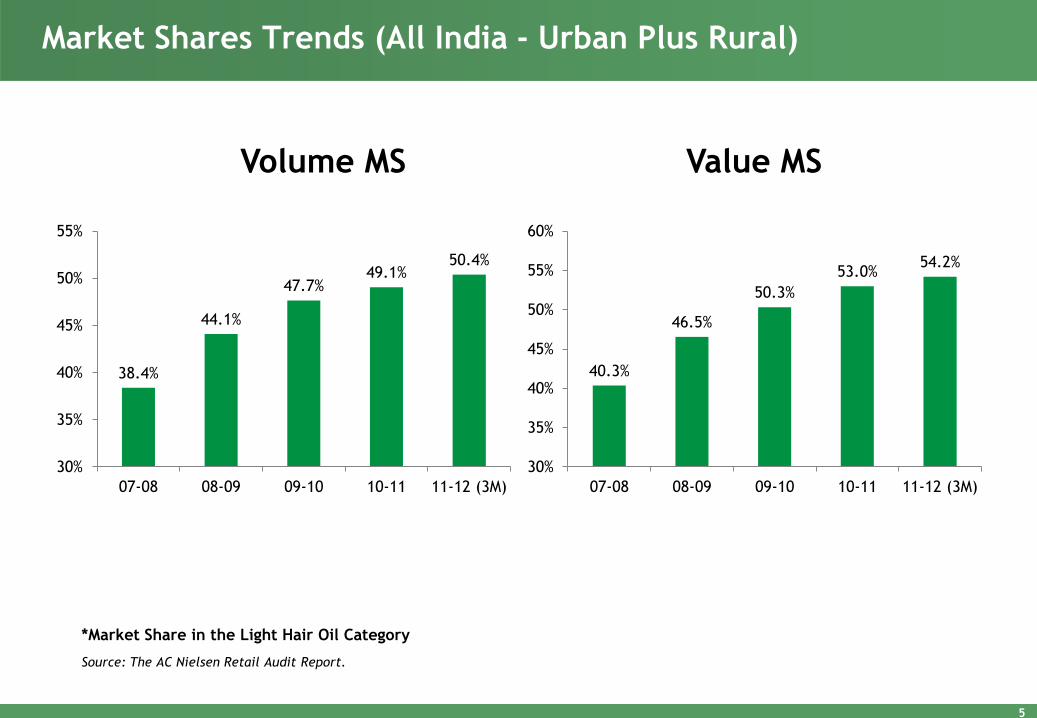
Market Shares Trends (All India - Urban Plus Rural)
Source: The AC Nielsen Retail Audit Report.
*Market Share in the Light Hair Oil Category
38.4%
44.1%
47.7% 49.1%
50.4%
30%
35%
40%
45%
50%
55%
07-08 08-09 09-10 10-11 11-12 (3M)
40.3%
46.5%
50.3%
53.0% 54.2%
30%
35%
40%
45%
50%
55%
60%
07-08 08-09 09-10 10-11 11-12 (3M)
Volume MS Value MS
5
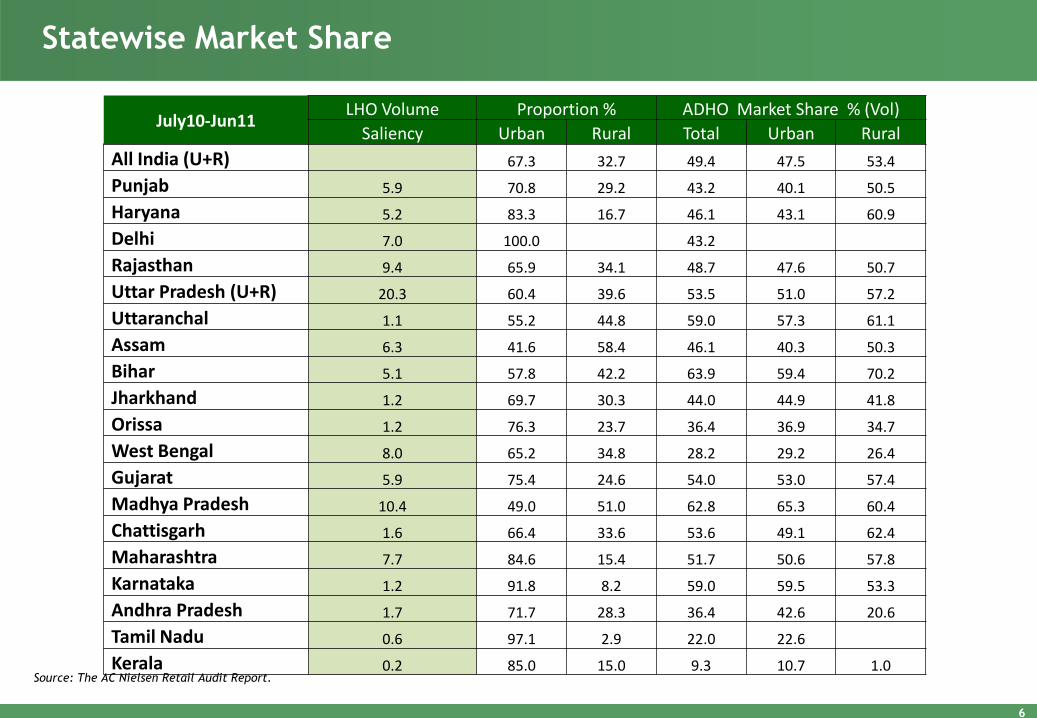
Statewise Market Share
July10-Jun11 LHO Volume Proportion % ADHO Market Share % (Vol)
Saliency Urban Rural Total Urban Rural
All India (U+R) 67.3 32.7 49.4 47.5 53.4
Punjab 5.9 70.8 29.2 43.2 40.1 50.5
Haryana 5.2 83.3 16.7 46.1 43.1 60.9
Delhi 7.0 100.0 43.2
Rajasthan 9.4 65.9 34.1 48.7 47.6 50.7
Uttar Pradesh (U+R) 20.3 60.4 39.6 53.5 51.0 57.2
Uttaranchal 1.1 55.2 44.8 59.0 57.3 61.1
Assam 6.3 41.6 58.4 46.1 40.3 50.3
Bihar 5.1 57.8 42.2 63.9 59.4 70.2
Jharkhand 1.2 69.7 30.3 44.0 44.9 41.8
Orissa 1.2 76.3 23.7 36.4 36.9 34.7
West Bengal 8.0 65.2 34.8 28.2 29.2 26.4
Gujarat 5.9 75.4 24.6 54.0 53.0 57.4
Madhya Pradesh 10.4 49.0 51.0 62.8 65.3 60.4
Chattisgarh 1.6 66.4 33.6 53.6 49.1 62.4
Maharashtra 7.7 84.6 15.4 51.7 50.6 57.8
Karnataka 1.2 91.8 8.2 59.0 59.5 53.3
Andhra Pradesh 1.7 71.7 28.3 36.4 42.6 20.6
Tamil Nadu 0.6 97.1 2.9 22.0 22.6
Kerala 0.2 85.0 15.0 9.3 10.7 1.0 Source: The AC Nielsen Retail Audit Report.
6
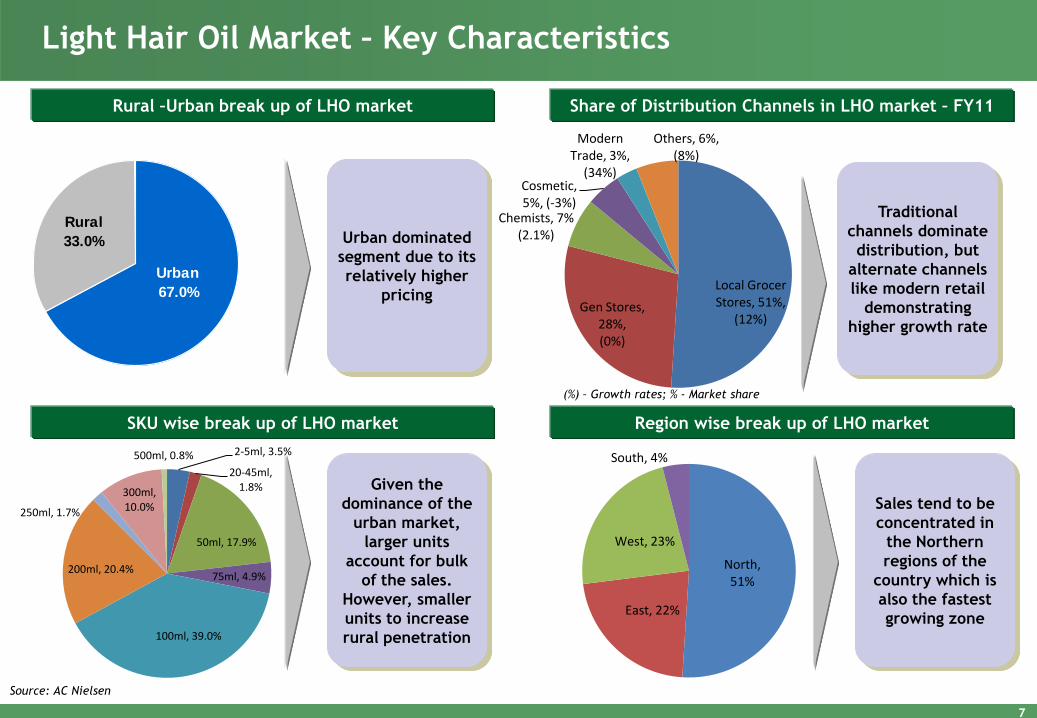
Light Hair Oil Market – Key Characteristics
Rural –Urban break up of LHO market Share of Distribution Channels in LHO market – FY11
SKU wise break up of LHO market Region wise break up of LHO market
Urban dominated
segment due to its
relatively higher
pricing
Given the
dominance of the
urban market,
larger units
account for bulk
of the sales.
However, smaller
units to increase
rural penetration
Sales tend to be
concentrated in
the Northern
regions of the
country which is
also the fastest
growing zone
Source: AC Nielsen
(%) – Growth rates; % - Market share
Urban
67.0%
Rural
33.0%
Traditional
channels dominate
distribution, but
alternate channels
like modern retail
demonstrating
higher growth rate
Local Grocer Stores, 51%,
(12%) Gen Stores,
28%, (0%)
Chemists, 7% (2.1%)
Cosmetic, 5%, (-3%)
Modern Trade, 3%,
(34%)
Others, 6%, (8%)
2-5ml, 3.5%
20-45ml, 1.8%
50ml, 17.9%
75ml, 4.9%
100ml, 39.0%
200ml, 20.4%
250ml, 1.7%
300ml, 10.0%
500ml, 0.8%
North, 51%
East, 22%
West, 23%
South, 4%
7

Company Overview
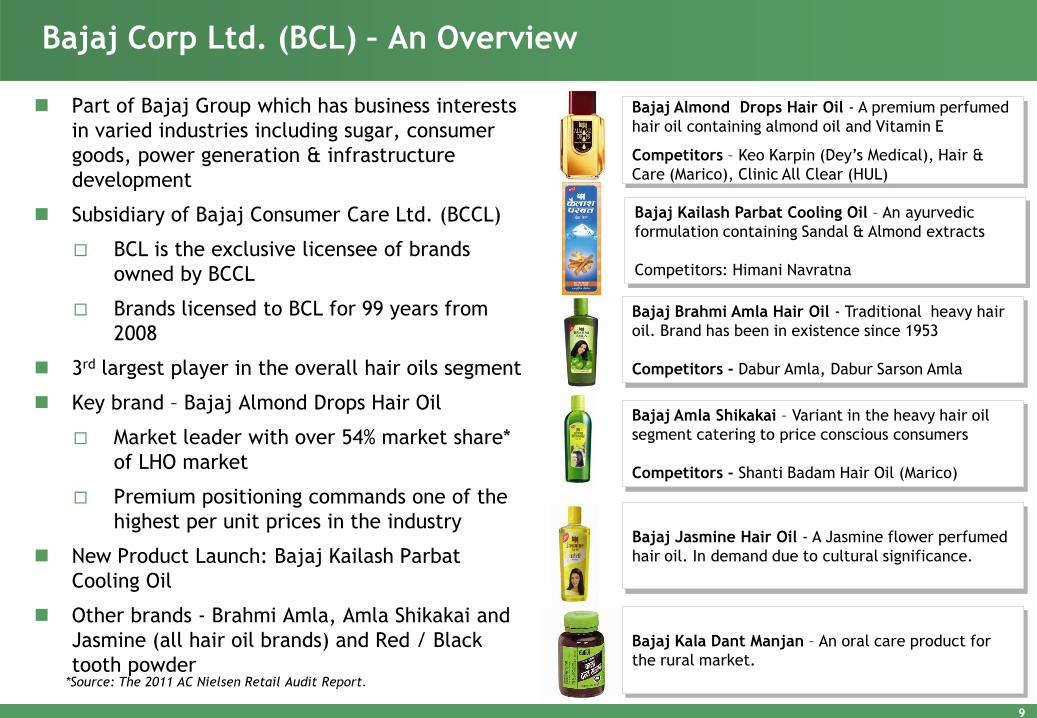
Bajaj Corp Ltd. (BCL) – An Overview
Part of Bajaj Group which has business interests
in varied industries including sugar, consumer
goods, power generation & infrastructure
development
Subsidiary of Bajaj Consumer Care Ltd. (BCCL)
BCL is the exclusive licensee of brands
owned by BCCL
Brands licensed to BCL for 99 years from
2008
3rd largest player in the overall hair oils segment
Key brand – Bajaj Almond Drops Hair Oil
Market leader with over 54% market share*
of LHO market
Premium positioning commands one of the
highest per unit prices in the industry
New Product Launch: Bajaj Kailash Parbat
Cooling Oil
Other brands - Brahmi Amla, Amla Shikakai and
Jasmine (all hair oil brands) and Red / Black
tooth powder
Bajaj Almond Drops Hair Oil - A premium perfumed
hair oil containing almond oil and Vitamin E
Competitors – Keo Karpin (Dey’s Medical), Hair &
Care (Marico), Clinic All Clear (HUL)
Bajaj Brahmi Amla Hair Oil - Traditional heavy hair
oil. Brand has been in existence since 1953
Competitors - Dabur Amla, Dabur Sarson Amla
Bajaj Amla Shikakai – Variant in the heavy hair oil
segment catering to price conscious consumers
Competitors - Shanti Badam Hair Oil (Marico)
Bajaj Jasmine Hair Oil - A Jasmine flower perfumed
hair oil. In demand due to cultural significance.
Bajaj Kala Dant Manjan – An oral care product for
the rural market.
*Source: The 2011 AC Nielsen Retail Audit Report.
Bajaj Kailash Parbat Cooling Oil – An ayurvedic
formulation containing Sandal & Almond extracts
Competitors: Himani Navratna
9
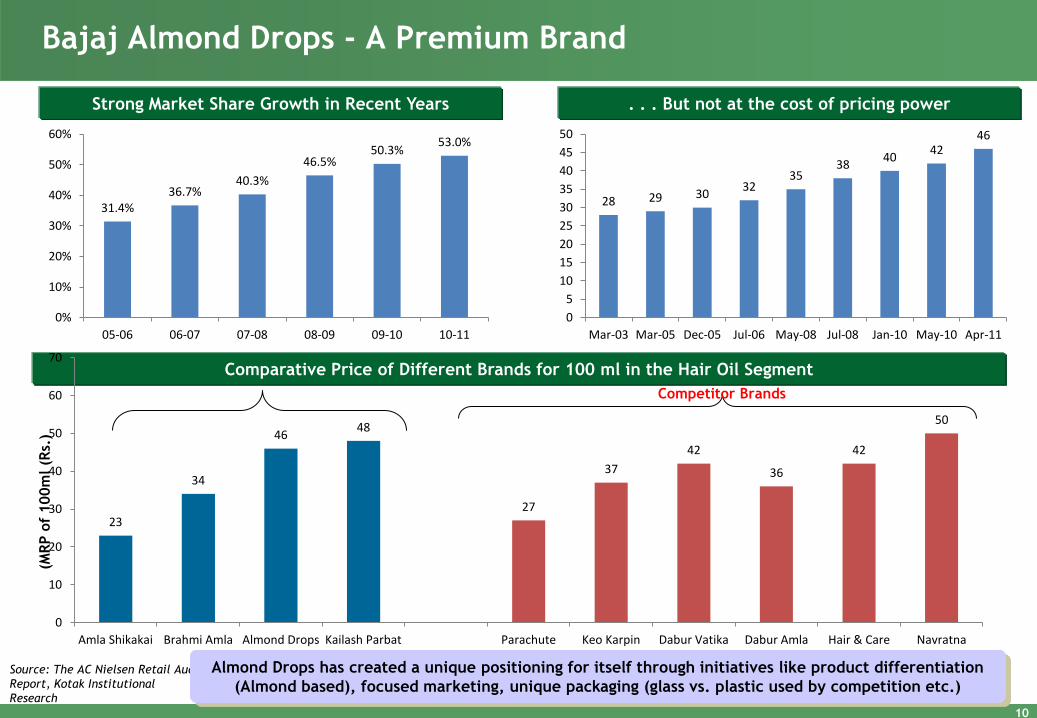
Bajaj Almond Drops - A Premium Brand
Source: The AC Nielsen Retail Audit
Report, Kotak Institutional
Research
Almond Drops has created a unique positioning for itself through initiatives like product differentiation
(Almond based), focused marketing, unique packaging (glass vs. plastic used by competition etc.)
. . . But not at the cost of pricing power
Comparative Price of Different Brands for 100 ml in the Hair Oil Segment
Strong Market Share Growth in Recent Years
(MR
P o
f 100m
l (R
s.)
Competitor Brands
31.4% 36.7%
40.3%
46.5% 50.3%
53.0%
0%
10%
20%
30%
40%
50%
60%
05-06 06-07 07-08 08-09 09-10 10-11
23
34
46 48
27
37
42
36
42
50
0
10
20
30
40
50
60
70
Amla Shikakai Brahmi Amla Almond Drops Kailash Parbat Parachute Keo Karpin Dabur Vatika Dabur Amla Hair & Care Navratna
28 29 30 32
35 38
40 42
46
0
5
10
15
20
25
30
35
40
45
50
Mar-03 Mar-05 Dec-05 Jul-06 May-08 Jul-08 Jan-10 May-10 Apr-11
10
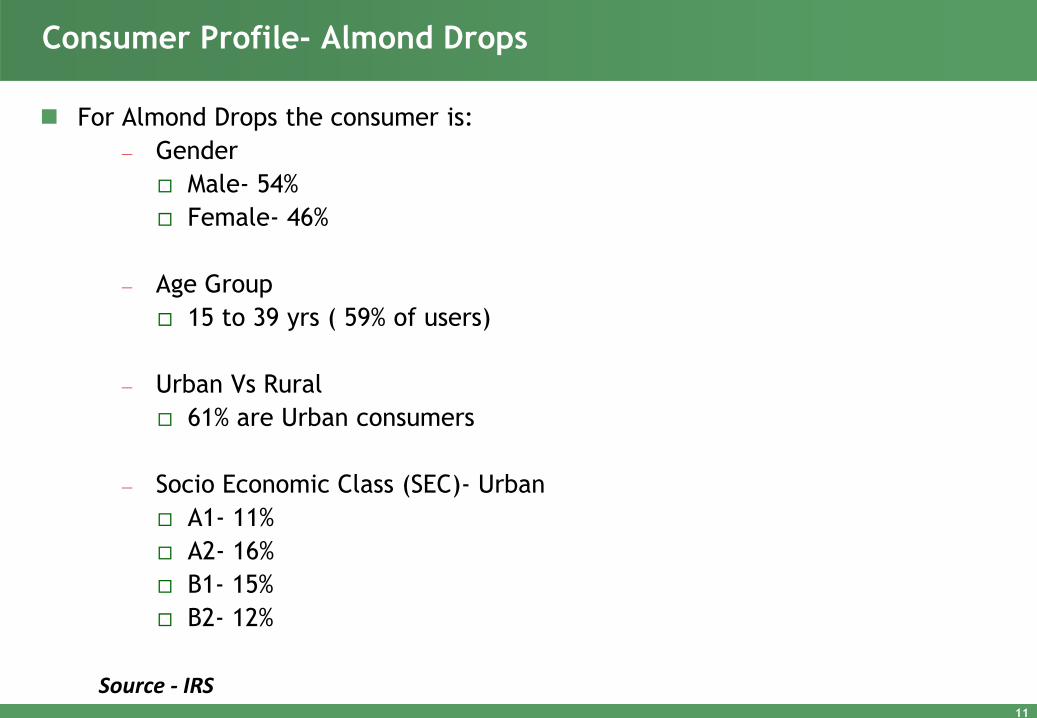
Consumer Profile- Almond Drops
For Almond Drops the consumer is:
— Gender
Male- 54%
Female- 46%
— Age Group
15 to 39 yrs ( 59% of users)
— Urban Vs Rural
61% are Urban consumers
— Socio Economic Class (SEC)- Urban
A1- 11%
A2- 16%
B1- 15%
B2- 12%
Source - IRS 11
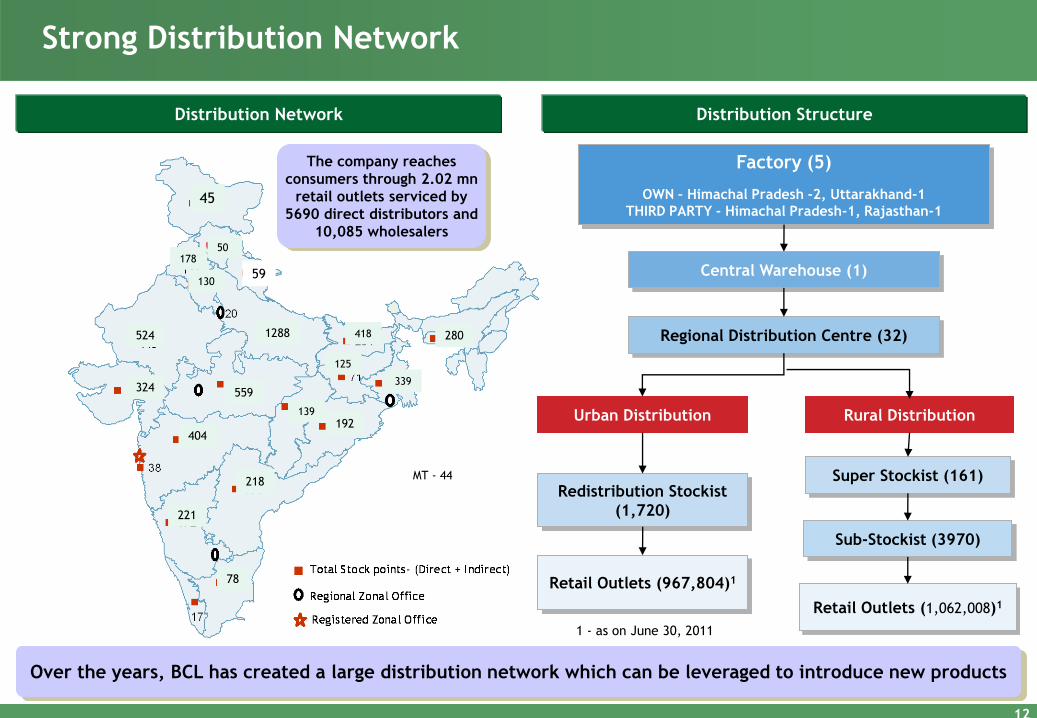
Strong Distribution Network
Over the years, BCL has created a large distribution network which can be leveraged to introduce new products
Factory (5)
OWN – Himachal Pradesh -2, Uttarakhand-1
THIRD PARTY - Himachal Pradesh-1, Rajasthan-1
Central Warehouse (1)
Regional Distribution Centre (32)
Urban Distribution Rural Distribution
Redistribution Stockist
(1,720)
Retail Outlets (967,804)1
1 - as on June 30, 2011
Super Stockist (161)
Sub-Stockist (3970)
Retail Outlets (1,062,008)1
Distribution Network Distribution Structure
The company reaches
consumers through 2.02 mn
retail outlets serviced by
5690 direct distributors and
10,085 wholesalers
45
50
1288
130
178
524
559
418
125
339
192 139
404
218
221
78
280
324
MT - 44
59
12
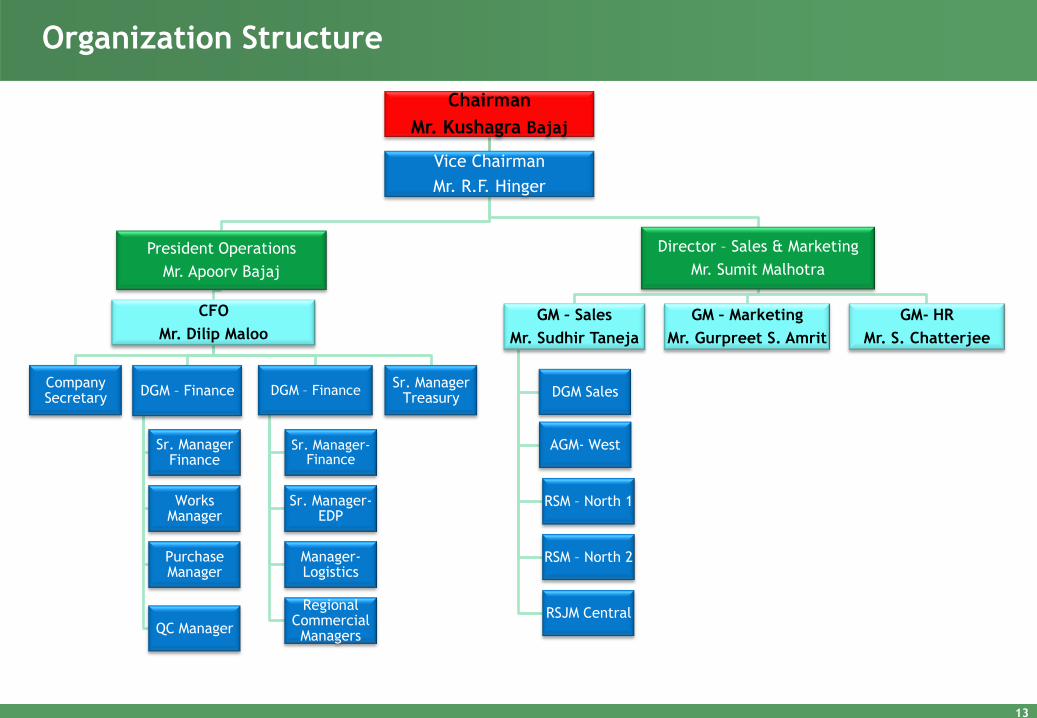
Organization Structure
Chairman
Mr. Kushagra Bajaj
Vice Chairman
Mr. R.F. Hinger
President Operations
Mr. Apoorv Bajaj
CFO
Mr. Dilip Maloo
Company Secretary
DGM – Finance
Sr. Manager Finance
Works Manager
Purchase Manager
QC Manager
DGM – Finance
Sr. Manager- Finance
Sr. Manager- EDP
Manager- Logistics
Regional Commercial Managers
Sr. Manager Treasury
Director – Sales & Marketing
Mr. Sumit Malhotra
GM – Sales
Mr. Sudhir Taneja
DGM Sales
AGM- West
RSM – North 1
RSM – North 2
RSJM Central
GM – Marketing
Mr. Gurpreet S. Amrit
GM- HR
Mr. S. Chatterjee
13
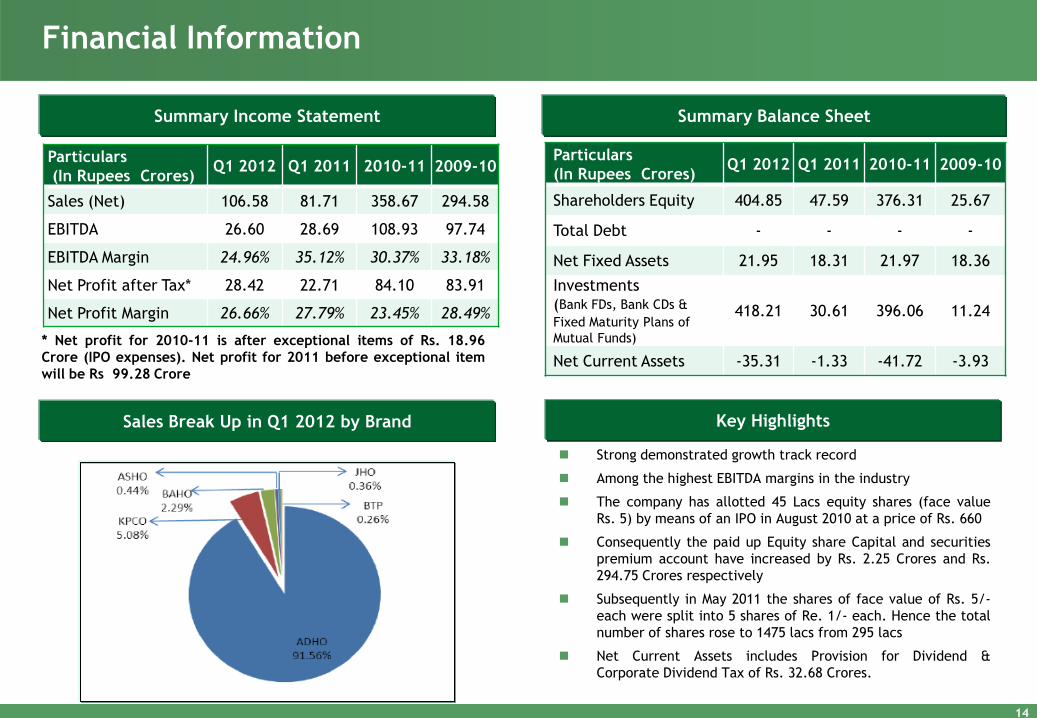
Financial Information
Summary Income Statement Summary Balance Sheet
Particulars
(In Rupees Crores) Q1 2012 Q1 2011 2010-11 2009-10
Sales (Net) 106.58 81.71 358.67 294.58
EBITDA 26.60 28.69 108.93 97.74
EBITDA Margin 24.96% 35.12% 30.37% 33.18%
Net Profit after Tax* 28.42 22.71 84.10 83.91
Net Profit Margin 26.66% 27.79% 23.45% 28.49%
Sales Break Up in Q1 2012 by Brand Key Highlights
Strong demonstrated growth track record
Among the highest EBITDA margins in the industry
The company has allotted 45 Lacs equity shares (face value
Rs. 5) by means of an IPO in August 2010 at a price of Rs. 660
Consequently the paid up Equity share Capital and securities
premium account have increased by Rs. 2.25 Crores and Rs.
294.75 Crores respectively
Subsequently in May 2011 the shares of face value of Rs. 5/-
each were split into 5 shares of Re. 1/- each. Hence the total
number of shares rose to 1475 lacs from 295 lacs
Net Current Assets includes Provision for Dividend &
Corporate Dividend Tax of Rs. 32.68 Crores.
* Net profit for 2010-11 is after exceptional items of Rs. 18.96
Crore (IPO expenses). Net profit for 2011 before exceptional item
will be Rs 99.28 Crore
Particulars
(In Rupees Crores) Q1 2012 Q1 2011 2010-11 2009-10
Shareholders Equity 404.85 47.59 376.31 25.67
Total Debt - - - -
Net Fixed Assets 21.95 18.31 21.97 18.36
Investments
(Bank FDs, Bank CDs &
Fixed Maturity Plans of
Mutual Funds)
418.21 30.61 396.06 11.24
Net Current Assets -35.31 -1.33 -41.72 -3.93
14
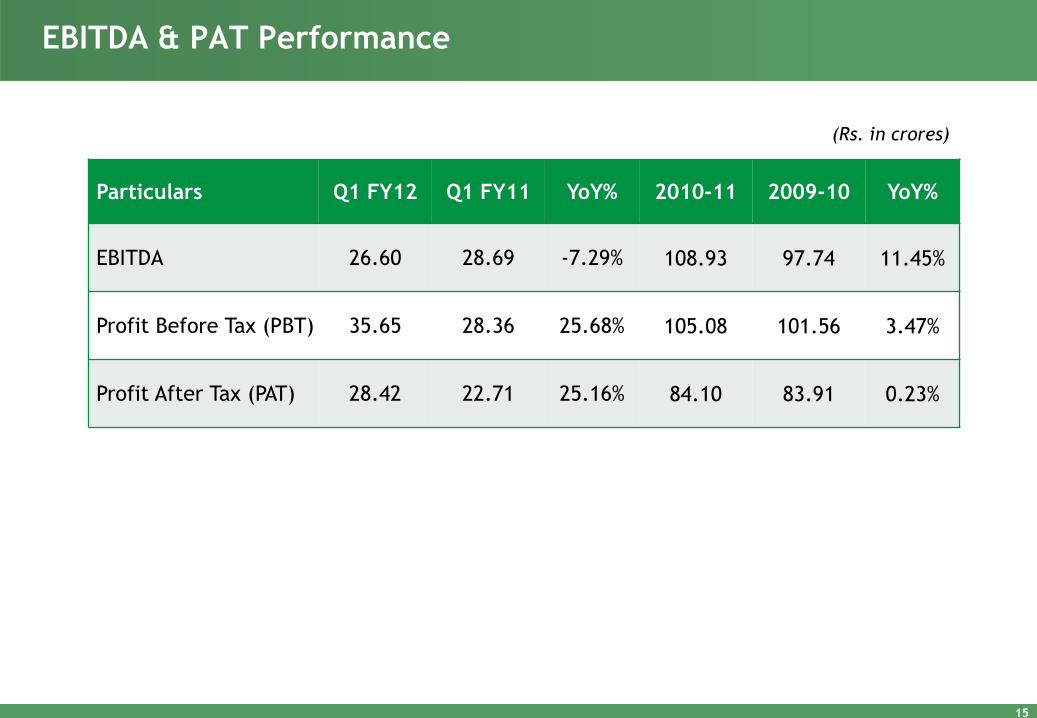
EBITDA & PAT Performance
Particulars Q1 FY12 Q1 FY11 YoY% 2010-11 2009-10 YoY%
EBITDA 26.60 28.69 -7.29% 108.93 97.74 11.45%
Profit Before Tax (PBT) 35.65 28.36 25.68% 105.08 101.56 3.47%
Profit After Tax (PAT) 28.42 22.71 25.16% 84.10 83.91 0.23%
(Rs. in crores)
15
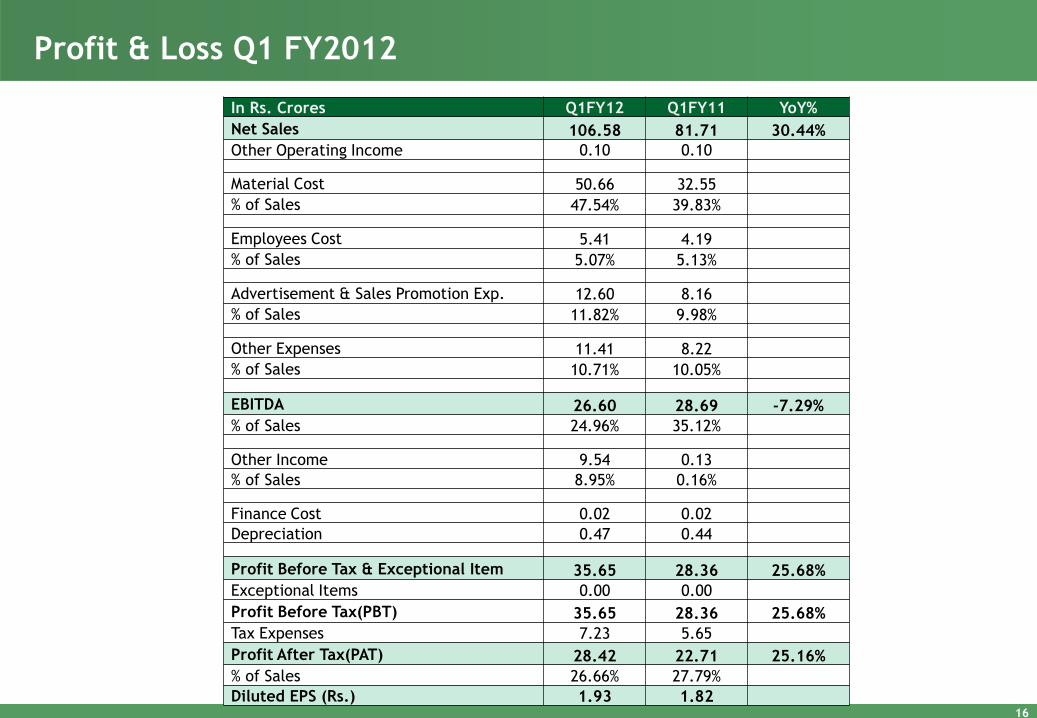
Profit & Loss Q1 FY2012
In Rs. Crores Q1FY12 Q1FY11 YoY%
Net Sales 106.58 81.71 30.44%
Other Operating Income 0.10 0.10
Material Cost 50.66 32.55
% of Sales 47.54% 39.83%
Employees Cost 5.41 4.19
% of Sales 5.07% 5.13%
Advertisement & Sales Promotion Exp. 12.60 8.16
% of Sales 11.82% 9.98%
Other Expenses 11.41 8.22
% of Sales 10.71% 10.05%
EBITDA 26.60 28.69 -7.29%
% of Sales 24.96% 35.12%
Other Income 9.54 0.13
% of Sales 8.95% 0.16%
Finance Cost 0.02 0.02
Depreciation 0.47 0.44
Profit Before Tax & Exceptional Item 35.65 28.36 25.68%
Exceptional Items 0.00 0.00
Profit Before Tax(PBT) 35.65 28.36 25.68%
Tax Expenses 7.23 5.65
Profit After Tax(PAT) 28.42 22.71 25.16%
% of Sales 26.66% 27.79%
Diluted EPS (Rs.) 1.93 1.82 16
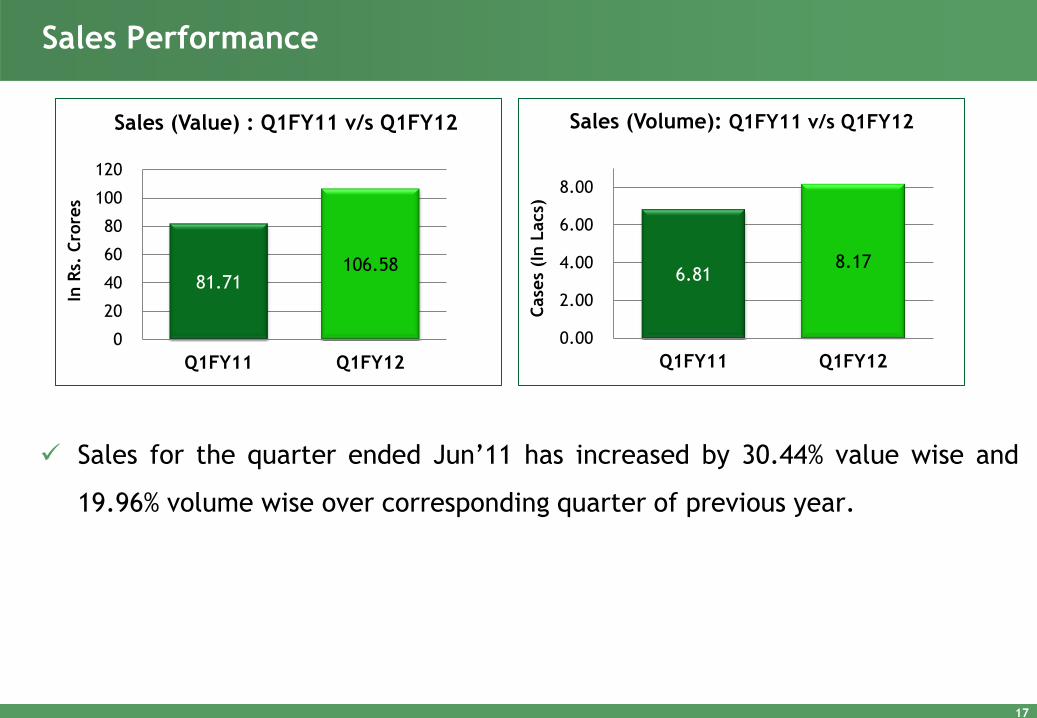
Sales for the quarter ended Jun’11 has increased by 30.44% value wise and
19.96% volume wise over corresponding quarter of previous year.
Sales Performance
17
81.71 106.58
0
20
40
60
80
100
120
Q1FY11 Q1FY12
In R
s. C
rore
s
Sales (Value) : Q1FY11 v/s Q1FY12
6.81 8.17
0.00
2.00
4.00
6.00
8.00
Q1FY11 Q1FY12
Case
s (I
n L
acs)
Sales (Volume): Q1FY11 v/s Q1FY12
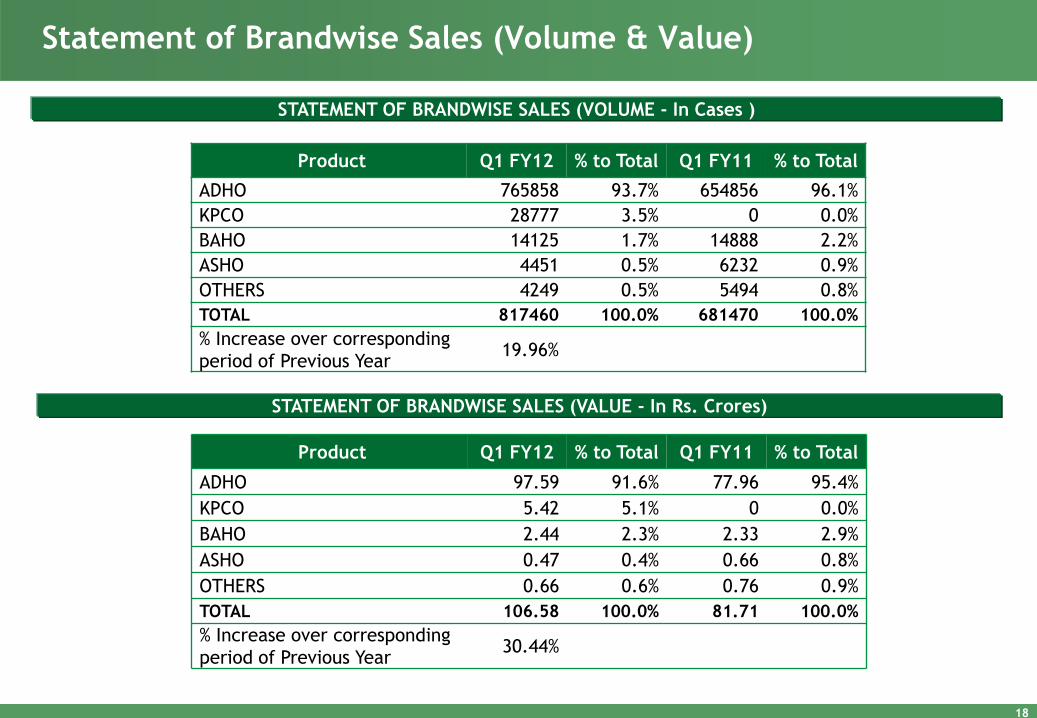
Statement of Brandwise Sales (Volume & Value)
STATEMENT OF BRANDWISE SALES (VOLUME - In Cases )
STATEMENT OF BRANDWISE SALES (VALUE - In Rs. Crores)
Product Q1 FY12 % to Total Q1 FY11 % to Total
ADHO 765858 93.7% 654856 96.1%
KPCO 28777 3.5% 0 0.0%
BAHO 14125 1.7% 14888 2.2%
ASHO 4451 0.5% 6232 0.9%
OTHERS 4249 0.5% 5494 0.8%
TOTAL 817460 100.0% 681470 100.0%
% Increase over corresponding
period of Previous Year 19.96%
Product Q1 FY12 % to Total Q1 FY11 % to Total
ADHO 97.59 91.6% 77.96 95.4%
KPCO 5.42 5.1% 0 0.0%
BAHO 2.44 2.3% 2.33 2.9%
ASHO 0.47 0.4% 0.66 0.8%
OTHERS 0.66 0.6% 0.76 0.9%
TOTAL 106.58 100.0% 81.71 100.0%
% Increase over corresponding
period of Previous Year 30.44%
18
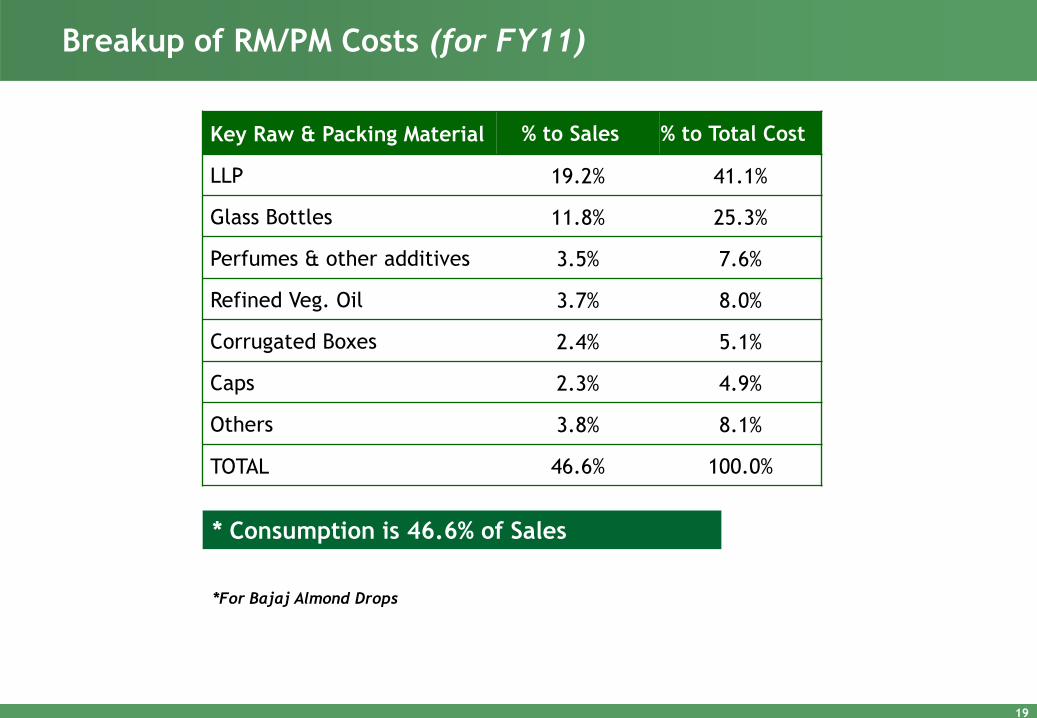
Breakup of RM/PM Costs (for FY11)
Key Raw & Packing Material % to Sales % to Total Cost
LLP 19.2% 41.1%
Glass Bottles 11.8% 25.3%
Perfumes & other additives 3.5% 7.6%
Refined Veg. Oil 3.7% 8.0%
Corrugated Boxes 2.4% 5.1%
Caps 2.3% 4.9%
Others 3.8% 8.1%
TOTAL 46.6% 100.0%
* Consumption is 46.6% of Sales
*For Bajaj Almond Drops
19
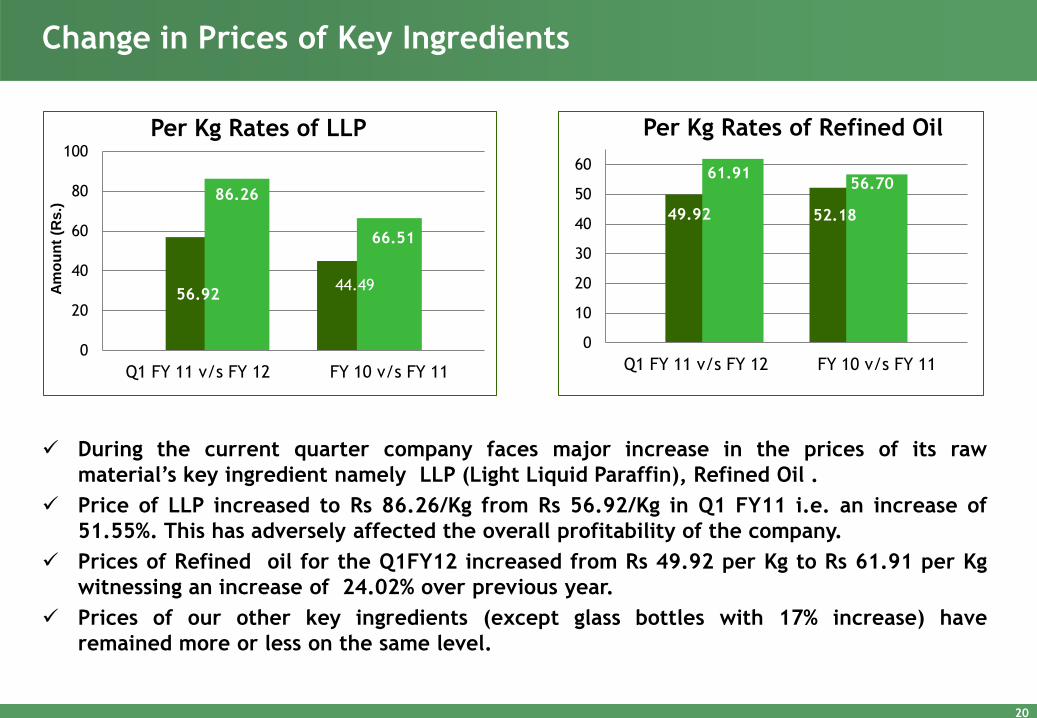
During the current quarter company faces major increase in the prices of its raw
material’s key ingredient namely LLP (Light Liquid Paraffin), Refined Oil .
Price of LLP increased to Rs 86.26/Kg from Rs 56.92/Kg in Q1 FY11 i.e. an increase of
51.55%. This has adversely affected the overall profitability of the company.
Prices of Refined oil for the Q1FY12 increased from Rs 49.92 per Kg to Rs 61.91 per Kg
witnessing an increase of 24.02% over previous year.
Prices of our other key ingredients (except glass bottles with 17% increase) have
remained more or less on the same level.
Change in Prices of Key Ingredients
20
44.49 56.92
66.51
86.26
0
20
40
60
80
100
Q1 FY 11 v/s FY 12 FY 10 v/s FY 11
Am
ou
nt
(Rs
.)
Per Kg Rates of LLP
52.18 49.92
56.70 61.91
0
10
20
30
40
50
60
Q1 FY 11 v/s FY 12 FY 10 v/s FY 11
Per Kg Rates of Refined Oil
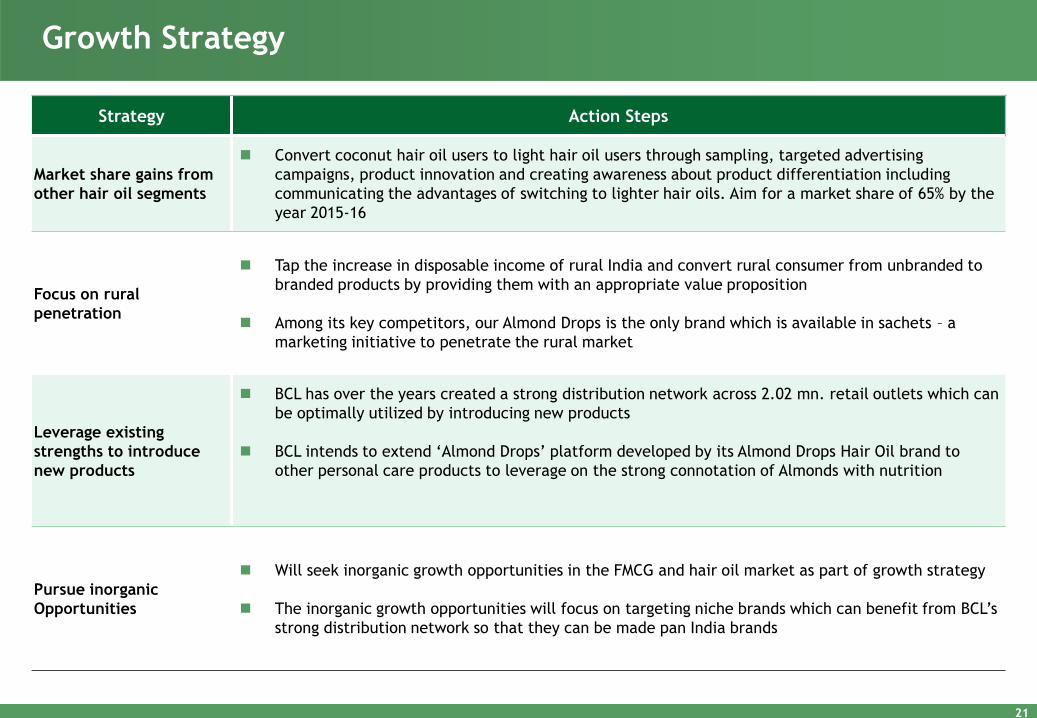
Growth Strategy
Strategy Action Steps
Market share gains from
other hair oil segments
Convert coconut hair oil users to light hair oil users through sampling, targeted advertising
campaigns, product innovation and creating awareness about product differentiation including
communicating the advantages of switching to lighter hair oils. Aim for a market share of 65% by the
year 2015-16
Focus on rural
penetration
Tap the increase in disposable income of rural India and convert rural consumer from unbranded to
branded products by providing them with an appropriate value proposition
Among its key competitors, our Almond Drops is the only brand which is available in sachets – a
marketing initiative to penetrate the rural market
Leverage existing
strengths to introduce
new products
BCL has over the years created a strong distribution network across 2.02 mn. retail outlets which can
be optimally utilized by introducing new products
BCL intends to extend ‘Almond Drops’ platform developed by its Almond Drops Hair Oil brand to
other personal care products to leverage on the strong connotation of Almonds with nutrition
Pursue inorganic
Opportunities
Will seek inorganic growth opportunities in the FMCG and hair oil market as part of growth strategy
The inorganic growth opportunities will focus on targeting niche brands which can benefit from BCL’s
strong distribution network so that they can be made pan India brands
21