Embed Size (px)
Citation preview
Bajaj Finance Limited
Q4 FY14 Presentation
14th May 2014
Presentation Path
2
• Bajaj Finance product suite 3
• Business/Product launch journey 4
• Bajaj group structure 5
• Bajaj Finserv group - Executive summary 6
• Lending industry opportunity 7
• Executive summary 8
• Products & key characteristics 10
• Strong distribution reach 11
• Key performance highlights for the year 12
• Summary financial statement 13
• Financial performance trends Q3 FY14 14
• Management discussion 15
• Key performance highlights for the quarter 17
• Credit Quality Portfolio composition 20
• Product per customer 22
• EMI Card franchise 24
• NPA provisioning standards 25
Bajaj Finance product suite
3
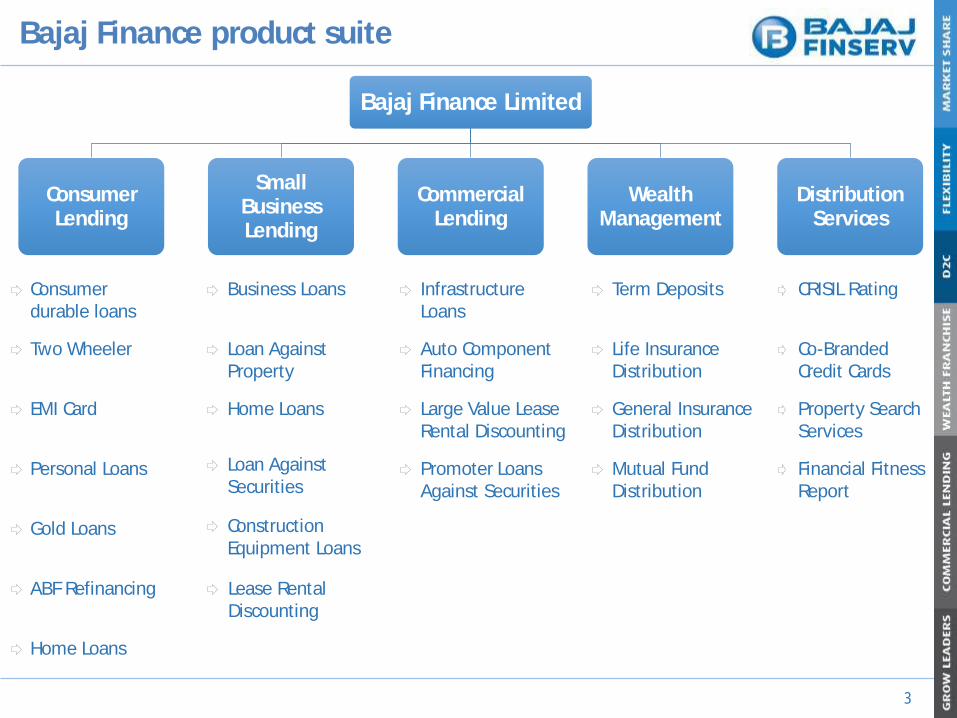
Bajaj Finance Limited
Consumer Lending
Small Business Lending
Commercial Lending
Wealth Management
Distribution Services
Consumer durable loans
Two Wheeler
EMI Card
Personal Loans
Gold Loans
ABF Refinancing
Home Loans
Business Loans
Loan Against Property
Home Loans
Loan Against Securities
Construction Equipment Loans
Infrastructure Loans
Auto Component Financing
Large Value Lease Rental Discounting
Promoter Loans Against Securities
Term Deposits
Life Insurance Distribution
General Insurance Distribution
Mutual Fund Distribution
CRISIL Rating
Co-Branded Credit Cards
Property SearchServices
Financial FitnessReport
Lease Rental Discounting
Business/Product launch journey
4
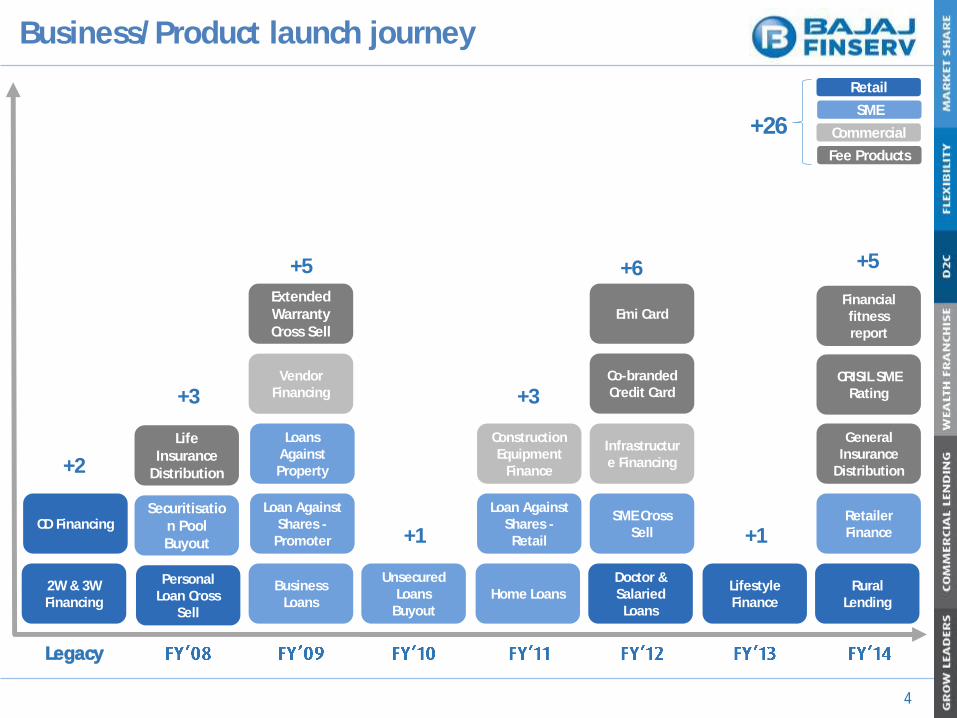
2W & 3W Financing
CD Financing
Legacy
Personal Loan Cross
Sell
Unsecured Loans
Buyout
Construction Equipment
Finance
Home Loans
Loan Against Shares -Retail
Securitisation Pool Buyout
Life Insurance
Distribution
Loans Against Property
Business Loans
Loan Against Shares -
Promoter
Vendor Financing
Extended Warranty Cross Sell
SME Cross Sell
Doctor & Salaried Loans
Infrastructure Financing
Co-branded Credit Card
Lifestyle Finance
General Insurance
Distribution
Rural Lending
Retailer Finance
SME
Retail
Fee Products
Commercial
+2
+3
+5
+1
+3
+6
+1
+5
+26
Emi CardFinancial fitness report
CRISIL SME Rating
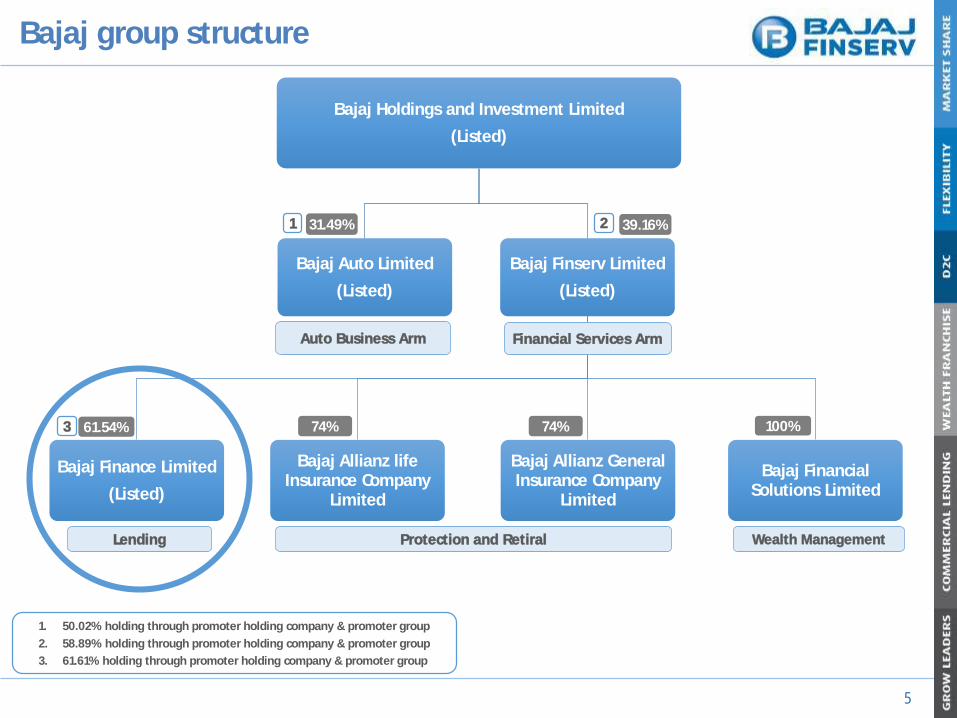
Bajaj group structure
5
Bajaj Holdings and Investment Limited
(Listed)
Bajaj Auto Limited
(Listed)
Bajaj Finserv Limited
(Listed)
Bajaj Finance Limited
(Listed)
Bajaj Allianz life Insurance Company
Limited
Bajaj Allianz General Insurance Company
Limited
Bajaj Financial Solutions Limited
1. 50.02% holding through promoter holding company & promoter group
2. 58.89% holding through promoter holding company & promoter group
3. 61.61% holding through promoter holding company & promoter group
Auto Business Arm Financial Services Arm
31.49% 39.16%
61.54% 74% 100%
Wealth ManagementLending Protection and Retiral
1 2
3 74%
Bajaj Finserv group - Executive summary
6
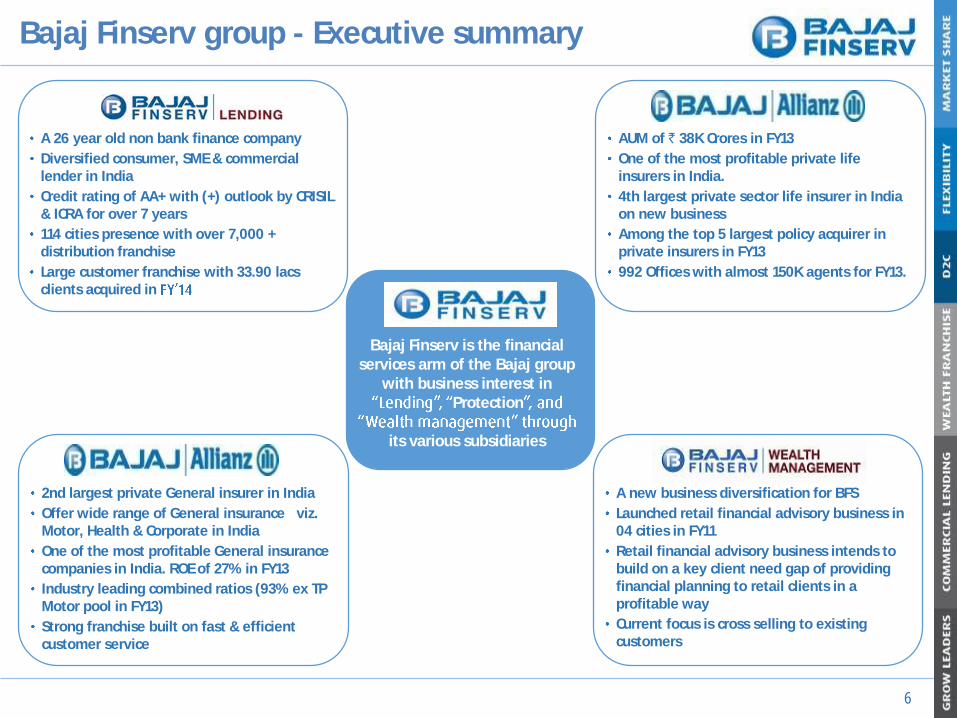
A 26 year old non bank finance company
Diversified consumer, SME & commercial lender in India
Credit rating of AA+ with (+) outlook by CRISIL & ICRA for over 7 years
114 cities presence with over 7,000 + distribution franchise
Large customer franchise with 33.90 lacsclients acquired in
AUM of ` 38K Crores in FY13
One of the most profitable private life insurers in India.
4th largest private sector life insurer in India on new business
Among the top 5 largest policy acquirer in private insurers in FY13
992 Offices with almost 150K agents for FY13.
A new business diversification for BFS
Launched retail financial advisory business in 04 cities in FY11
Retail financial advisory business intends to build on a key client need gap of providing financial planning to retail clients in a profitable way
Current focus is cross selling to existing customers
2nd largest private General insurer in India
Offer wide range of General insurance viz. Motor, Health & Corporate in India
One of the most profitable General insurance companies in India. ROE of 27% in FY13
Industry leading combined ratios (93% ex TP Motor pool in FY13)
Strong franchise built on fast & efficient customer service
Bajaj Finserv is the financial services arm of the Bajaj group
with business interest in Protection
its various subsidiaries
Lending industry opportunity
7
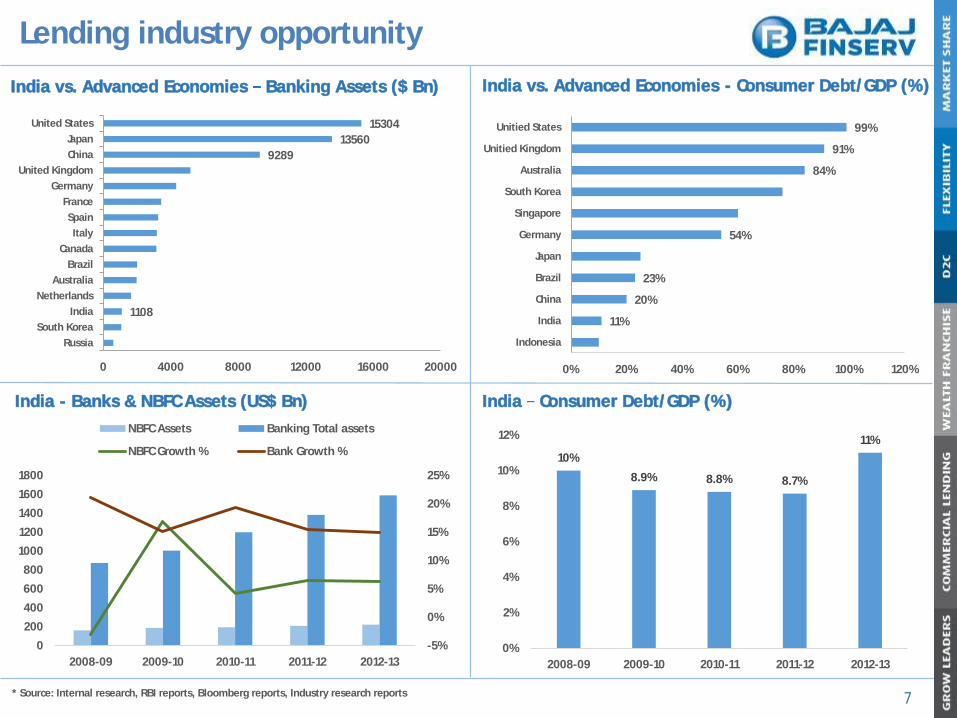
India vs. Advanced Economies Banking Assets ($ Bn)
India - Banks & NBFC Assets (US$ Bn)
India vs. Advanced Economies - Consumer Debt/GDP (%)
India Consumer Debt/GDP (%)
-5%
0%
5%
10%
15%
20%
25%
0
200
400
600
800
1000
1200
1400
1600
1800
2008-09 2009-10 2010-11 2011-12 2012-13
NBFC Assets Banking Total assets
NBFC Growth % Bank Growth %10%
8.9% 8.8% 8.7%
11%
0%
2%
4%
6%
8%
10%
12%
2008-09 2009-10 2010-11 2011-12 2012-13
11%
20%
23%
54%
84%
91%
99%
0% 20% 40% 60% 80% 100% 120%
Indonesia
India
China
Brazil
Japan
Germany
Singapore
South Korea
Australia
Unitied Kingdom
Unitied States
* Source: Internal research, RBI reports, Bloomberg reports, Industry research reports
1108
9289
13560
15304
0 4000 8000 12000 16000 20000
Russia
South Korea
India
Netherlands
Australia
Brazil
Canada
Italy
Spain
France
Germany
United Kingdom
China
Japan
United States
Executive summary
8
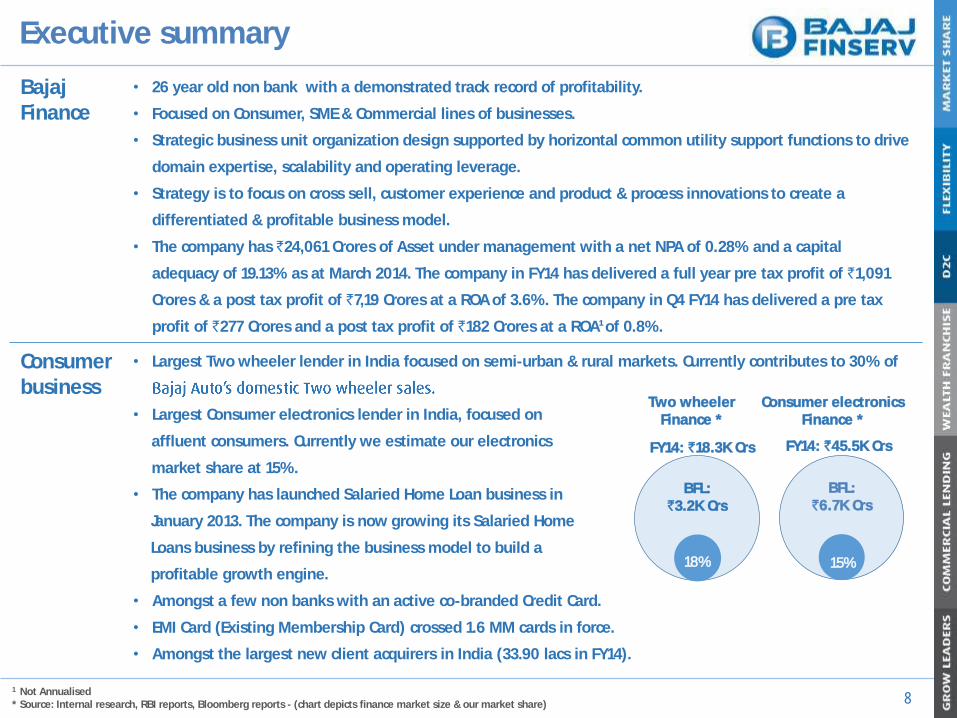
Bajaj Finance
• 26 year old non bank with a demonstrated track record of profitability.
• Focused on Consumer, SME & Commercial lines of businesses.
• Strategic business unit organization design supported by horizontal common utility support functions to drive
domain expertise, scalability and operating leverage.
• Strategy is to focus on cross sell, customer experience and product & process innovations to create a
differentiated & profitable business model.
• The company has `24,061 Crores of Asset under management with a net NPA of 0.28% and a capital
adequacy of 19.13% as at March 2014. The company in FY14 has delivered a full year pre tax profit of `1,091
Crores & a post tax profit of `7,19 Crores at a ROA of 3.6%. The company in Q4 FY14 has delivered a pre tax
profit of `277 Crores and a post tax profit of `182 Crores at a ROA1 of 0.8%.
Consumerbusiness
• Largest Two wheeler lender in India focused on semi-urban & rural markets. Currently contributes to 30% of
• Largest Consumer electronics lender in India, focused on
affluent consumers. Currently we estimate our electronics
market share at 15%.
• The company has launched Salaried Home Loan business in
January 2013. The company is now growing its Salaried Home
Loans business by refining the business model to build a
profitable growth engine.
• Amongst a few non banks with an active co-branded Credit Card.
• EMI Card (Existing Membership Card) crossed 1.6 MM cards in force.
• Amongst the largest new client acquirers in India (33.90 lacs in FY14).
FY14: `45.5K Crs
Consumer electronics Finance *
FY14: `18.3K Crs
Two wheeler Finance *
1 Not Annualised * Source: Internal research, RBI reports, Bloomberg reports - (chart depicts finance market size & our market share)
BFL: `6.7K Crs
15%
BFL: `3.2K Crs
18%
Executive summary (cont..)
9
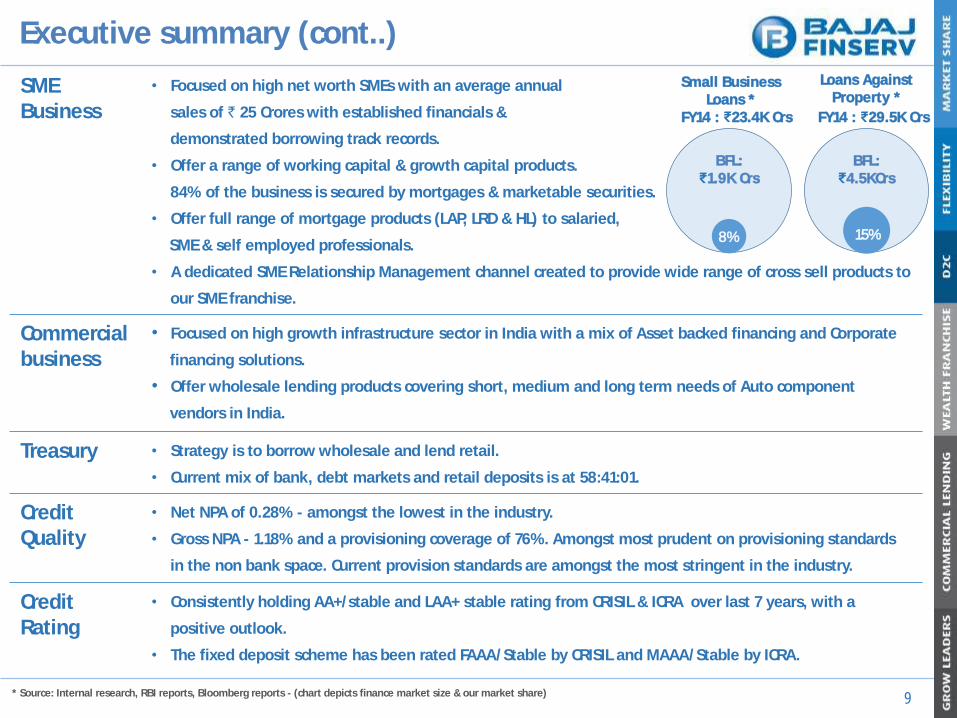
SME Business
• Focused on high net worth SMEs with an average annual
sales of ` 25 Crores with established financials &
demonstrated borrowing track records.
• Offer a range of working capital & growth capital products.
84% of the business is secured by mortgages & marketable securities.
• Offer full range of mortgage products (LAP, LRD & HL) to salaried,
SME & self employed professionals.
• A dedicated SME Relationship Management channel created to provide wide range of cross sell products to
our SME franchise.
Commercialbusiness
• Focused on high growth infrastructure sector in India with a mix of Asset backed financing and Corporate
financing solutions.
• Offer wholesale lending products covering short, medium and long term needs of Auto component
vendors in India.
Treasury • Strategy is to borrow wholesale and lend retail.
• Current mix of bank, debt markets and retail deposits is at 58:41:01.
Credit Quality
• Net NPA of 0.28% - amongst the lowest in the industry.
• Gross NPA - 1.18% and a provisioning coverage of 76%. Amongst most prudent on provisioning standards
in the non bank space. Current provision standards are amongst the most stringent in the industry.
CreditRating
• Consistently holding AA+/stable and LAA+ stable rating from CRISIL & ICRA over last 7 years, with a
positive outlook.
• The fixed deposit scheme has been rated FAAA/Stable by CRISIL and MAAA/Stable by ICRA.
* Source: Internal research, RBI reports, Bloomberg reports - (chart depicts finance market size & our market share)
FY14 : ₹23.4K Crs
Small Business Loans *
FY14 : ₹29.5K Crs
Loans Against Property *
BFL: ₹1.9K Crs
8%
BFL: ₹4.5KCrs
15%
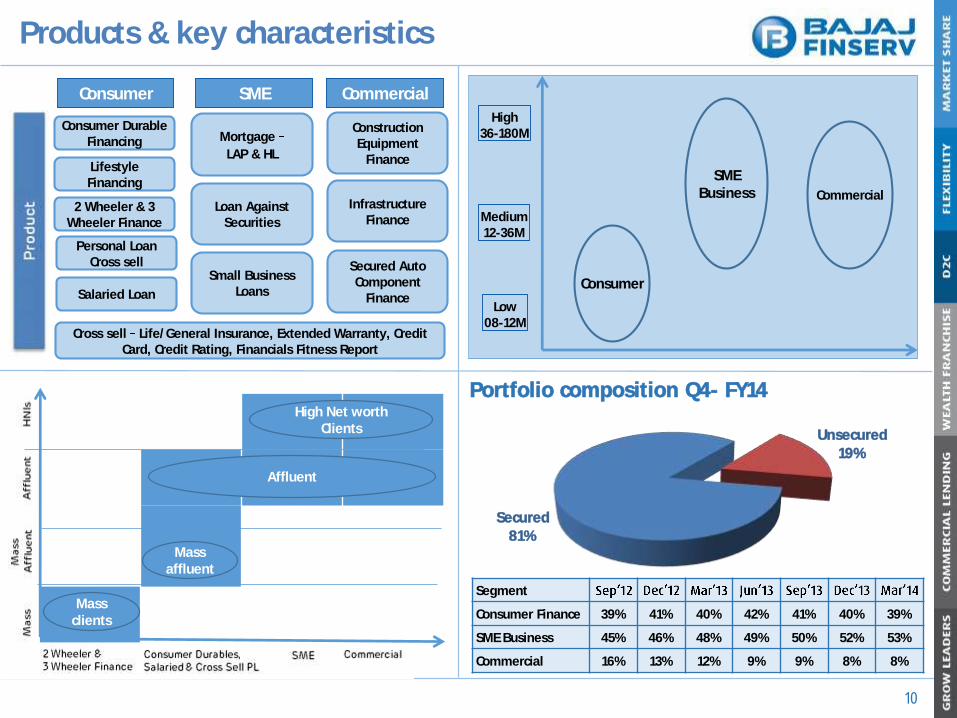
Products & key characteristics
Mortgage
LAP & HL
Loan Against Securities
Small Business Loans
Consumer Durable Financing
2 Wheeler & 3 Wheeler Finance
Consumer SME Commercial
Construction Equipment
Finance
Infrastructure Finance
Secured Auto Component
Finance
Cross sell Life/General Insurance, Extended Warranty, Credit Card, Credit Rating, Financials Fitness Report
Lifestyle Financing
Personal Loan Cross sell
Salaried LoanLow
08-12M
Medium12-36M
High36-180M
Consumer
SMEBusiness Commercial
Segment
Consumer Finance 39% 41% 40% 42% 41% 40% 39%
SME Business 45% 46% 48% 49% 50% 52% 53%
Commercial 16% 13% 12% 9% 9% 8% 8%
Portfolio composition Q4- FY14
Secured
81%
Unsecured19%
Affluent
High Net worth Clients
Mass affluent
Mass clients
10
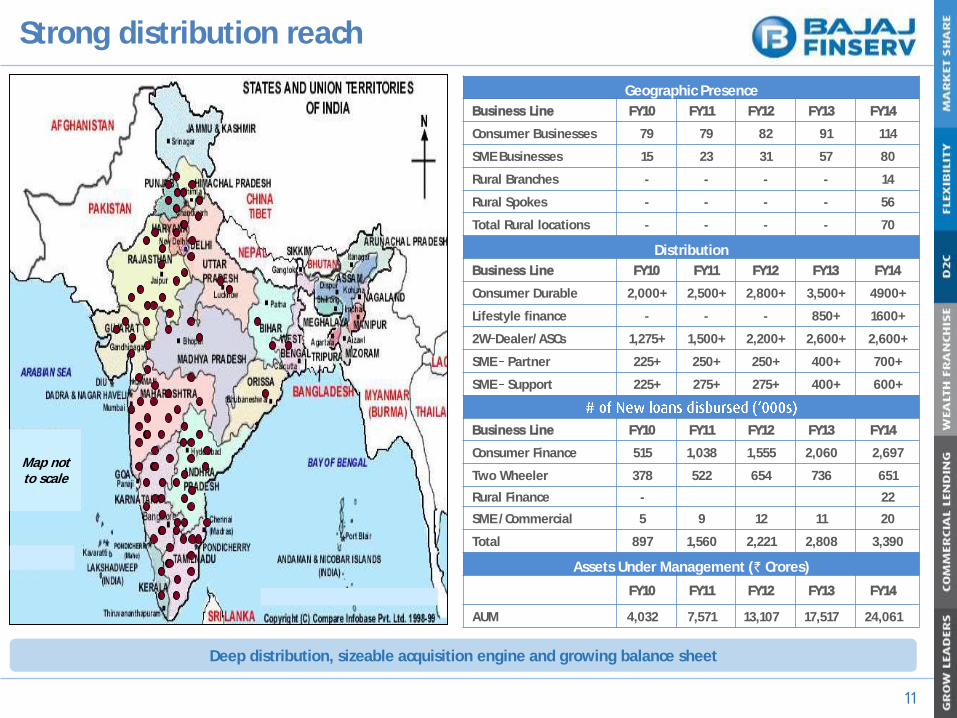
Strong distribution reach
11
Map not to scale
Deep distribution, sizeable acquisition engine and growing balance sheet
Geographic Presence
Business Line FY10 FY11 FY12 FY13 FY14
Consumer Businesses 79 79 82 91 114
SME Businesses 15 23 31 57 80
Rural Branches - - - - 14
Rural Spokes - - - - 56
Total Rural locations - - - - 70
Distribution
Business Line FY10 FY11 FY12 FY13 FY14
Consumer Durable 2,000+ 2,500+ 2,800+ 3,500+ 4900+
Lifestyle finance - - - 850+ 1600+
2W Dealer/ASCs 1,275+ 1,500+ 2,200+ 2,600+ 2,600+
SME Partner 225+ 250+ 250+ 400+ 700+
SME Support 225+ 275+ 275+ 400+ 600+
Business Line FY10 FY11 FY12 FY13 FY14
Consumer Finance 515 1,038 1,555 2,060 2,697
Two Wheeler 378 522 654 736 651
Rural Finance - 22
SME /Commercial 5 9 12 11 20
Total 897 1,560 2,221 2,808 3,390
Assets Under Management (` Crores)
FY10 FY11 FY12 FY13 FY14
AUM 4,032 7,571 13,107 17,517 24,061
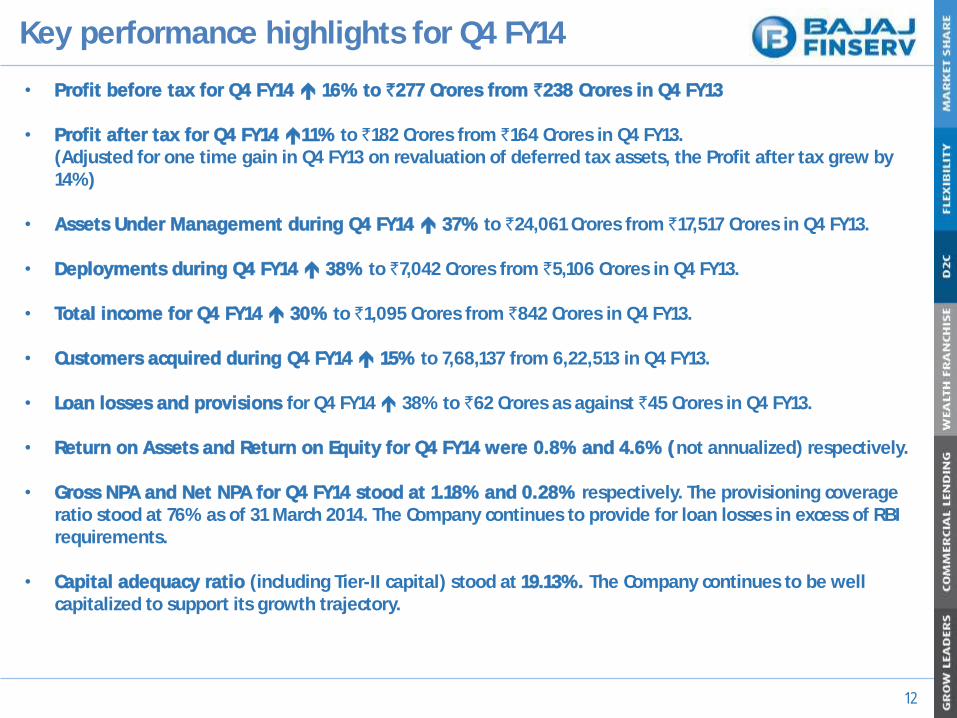
Key performance highlights for Q4 FY14
12
• Profit before tax for Q4 FY14 16% to `277 Crores from `238 Crores in Q4 FY13
• Profit after tax for Q4 FY14 11% to `182 Crores from `164 Crores in Q4 FY13. (Adjusted for one time gain in Q4 FY13 on revaluation of deferred tax assets, the Profit after tax grew by 14%)
• Assets Under Management during Q4 FY14 37% to `24,061 Crores from `17,517 Crores in Q4 FY13.
• Deployments during Q4 FY14 38% to `7,042 Crores from `5,106 Crores in Q4 FY13.
• Total income for Q4 FY14 30% to `1,095 Crores from `842 Crores in Q4 FY13.
• Customers acquired during Q4 FY14 15% to 7,68,137 from 6,22,513 in Q4 FY13.
• Loan losses and provisions for Q4 FY14 38% to `62 Crores as against `45 Crores in Q4 FY13.
• Return on Assets and Return on Equity for Q4 FY14 were 0.8% and 4.6% (not annualized) respectively.
• Gross NPA and Net NPA for Q4 FY14 stood at 1.18% and 0.28% respectively. The provisioning coverage ratio stood at 76% as of 31 March 2014. The Company continues to provide for loan losses in excess of RBI requirements.
• Capital adequacy ratio (including Tier-II capital) stood at 19.13%. The Company continues to be well capitalized to support its growth trajectory.
Key performance highlights for FY14
13
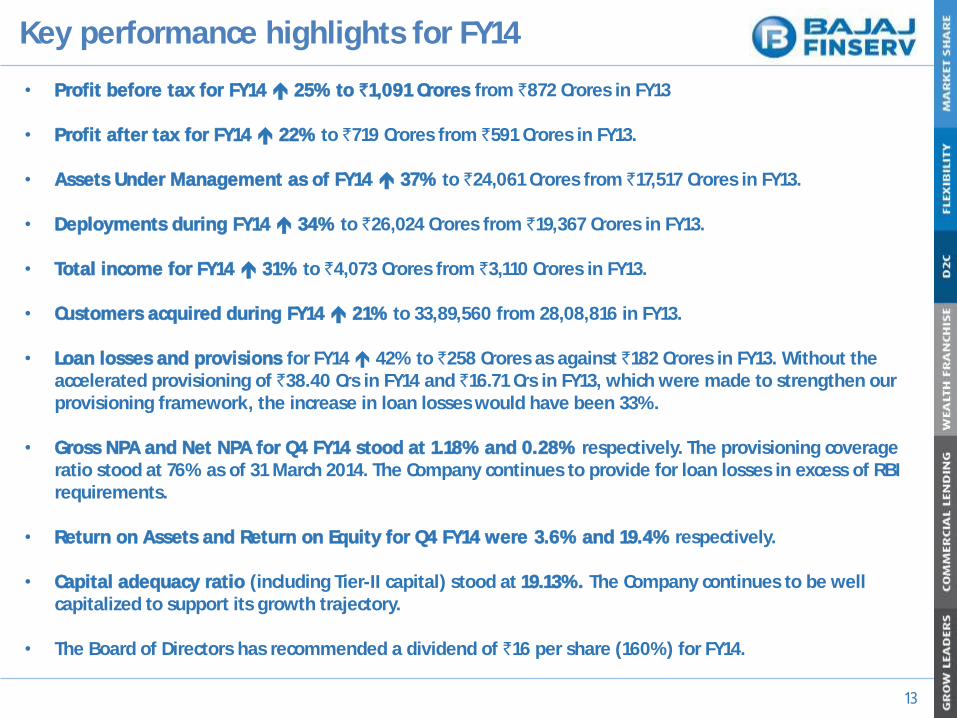
• Profit before tax for FY14 25% to `1,091 Crores from `872 Crores in FY13
• Profit after tax for FY14 22% to `719 Crores from `591 Crores in FY13.
• Assets Under Management as of FY14 37% to `24,061 Crores from `17,517 Crores in FY13.
• Deployments during FY14 34% to `26,024 Crores from `19,367 Crores in FY13.
• Total income for FY14 31% to `4,073 Crores from `3,110 Crores in FY13.
• Customers acquired during FY14 21% to 33,89,560 from 28,08,816 in FY13.
• Loan losses and provisions for FY14 42% to `258 Crores as against `182 Crores in FY13. Without the accelerated provisioning of `38.40 Crs in FY14 and `16.71 Crs in FY13, which were made to strengthen our provisioning framework, the increase in loan losses would have been 33%.
• Gross NPA and Net NPA for Q4 FY14 stood at 1.18% and 0.28% respectively. The provisioning coverage ratio stood at 76% as of 31 March 2014. The Company continues to provide for loan losses in excess of RBI requirements.
• Return on Assets and Return on Equity for Q4 FY14 were 3.6% and 19.4% respectively.
• Capital adequacy ratio (including Tier-II capital) stood at 19.13%. The Company continues to be well capitalized to support its growth trajectory.
• The Board of Directors has recommended a dividend of `16 per share (160%) for FY14.
Summary Financial Statement
14* Quarterly numbers are not annualized
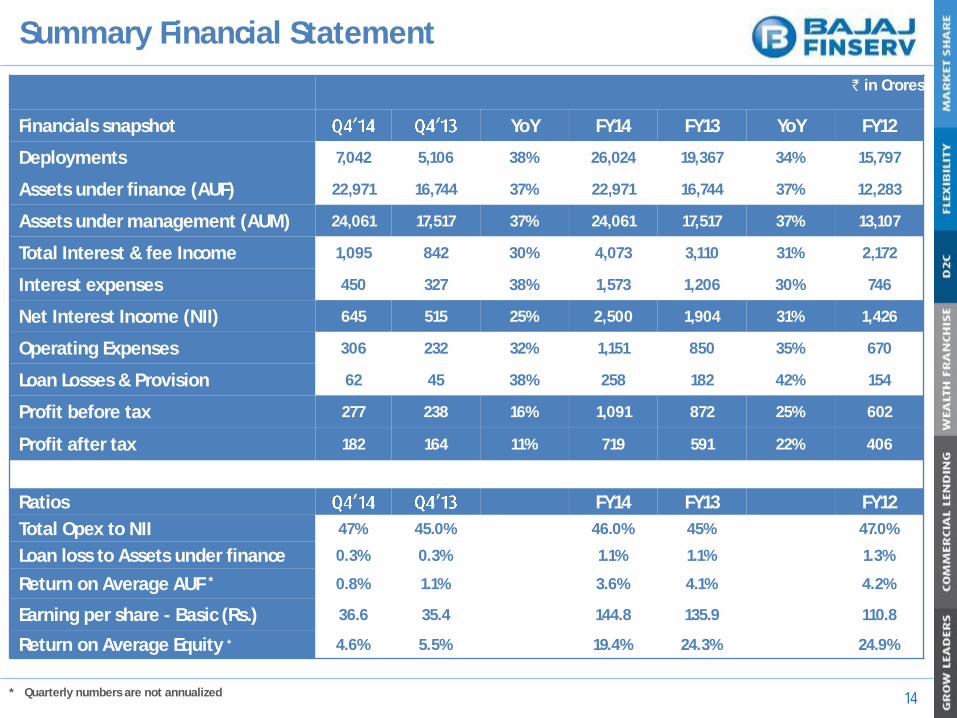
` in Crores
Financials snapshot YoY FY14 FY13 YoY FY12
Deployments 7,042 5,106 38% 26,024 19,367 34% 15,797
Assets under finance (AUF) 22,971 16,744 37% 22,971 16,744 37% 12,283
Assets under management (AUM) 24,061 17,517 37% 24,061 17,517 37% 13,107
Total Interest & fee Income 1,095 842 30% 4,073 3,110 31% 2,172
Interest expenses 450 327 38% 1,573 1,206 30% 746
Net Interest Income (NII) 645 515 25% 2,500 1,904 31% 1,426
Operating Expenses 306 232 32% 1,151 850 35% 670
Loan Losses & Provision 62 45 38% 258 182 42% 154
Profit before tax 277 238 16% 1,091 872 25% 602
Profit after tax 182 164 11% 719 591 22% 406
Ratios FY14 FY13 FY12
Total Opex to NII 47% 45.0% 46.0% 45% 47.0%
Loan loss to Assets under finance 0.3% 0.3% 1.1% 1.1% 1.3%
Return on Average AUF * 0.8% 1.1% 3.6% 4.1% 4.2%
Earning per share - Basic (Rs.) 36.6 35.4 144.8 135.9 110.8
Return on Average Equity * 4.6% 5.5% 19.4% 24.3% 24.9%
Management discussion
15
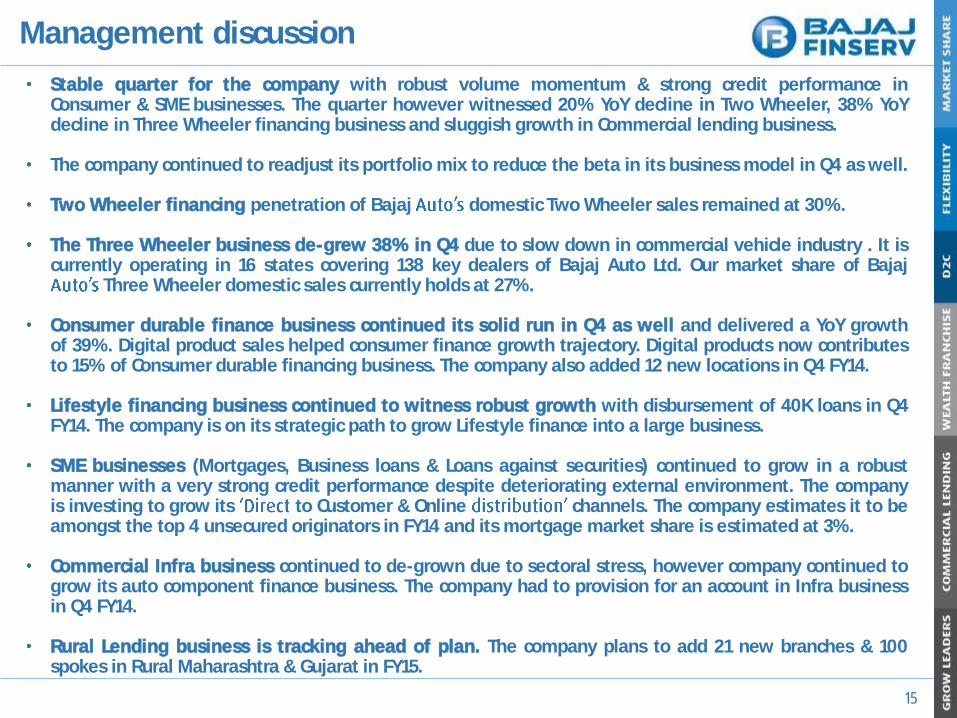
Stable quarter for the company with robust volume momentum & strong credit performance inConsumer & SME businesses. The quarter however witnessed 20% YoY decline in Two Wheeler, 38% YoYdecline in Three Wheeler financing business and sluggish growth in Commercial lending business.
The company continued to readjust its portfolio mix to reduce the beta in its business model in Q4 as well.
Two Wheeler financing penetration of Bajaj domestic Two Wheeler sales remained at 30%.
The Three Wheeler business de-grew 38% in Q4 due to slow down in commercial vehicle industry . It iscurrently operating in 16 states covering 138 key dealers of Bajaj Auto Ltd. Our market share of Bajaj
Three Wheeler domestic sales currently holds at 27%.
Consumer durable finance business continued its solid run in Q4 as well and delivered a YoY growthof 39%. Digital product sales helped consumer finance growth trajectory. Digital products now contributesto 15% of Consumer durable financing business. The company also added 12 new locations in Q4 FY14.
Lifestyle financing business continued to witness robust growth with disbursement of 40K loans in Q4FY14. The company is on its strategic path to grow Lifestyle finance into a large business.
SME businesses (Mortgages, Business loans & Loans against securities) continued to grow in a robustmanner with a very strong credit performance despite deteriorating external environment. The companyis investing to grow its to Customer & Online channels. The company estimates it to beamongst the top 4 unsecured originators in FY14 and its mortgage market share is estimated at 3%.
Commercial Infra business continued to de-grown due to sectoral stress, however company continued togrow its auto component finance business. The company had to provision for an account in Infra businessin Q4 FY14.
Rural Lending business is tracking ahead of plan. The company plans to add 21 new branches & 100spokes in Rural Maharashtra & Gujarat in FY15.
Management discussion (cont
16
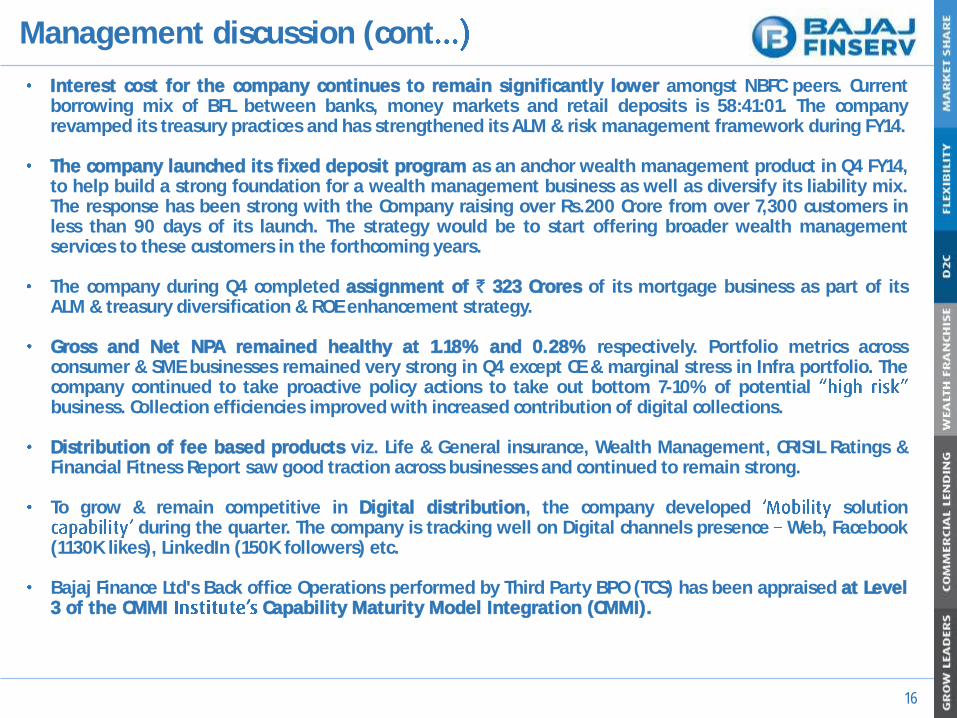
Interest cost for the company continues to remain significantly lower amongst NBFC peers. Currentborrowing mix of BFL between banks, money markets and retail deposits is 58:41:01. The companyrevamped its treasury practices and has strengthened its ALM & risk management framework during FY14.
The company launched its fixed deposit program as an anchor wealth management product in Q4 FY14,to help build a strong foundation for a wealth management business as well as diversify its liability mix.The response has been strong with the Company raising over Rs.200 Crore from over 7,300 customers inless than 90 days of its launch. The strategy would be to start offering broader wealth managementservices to these customers in the forthcoming years.
The company during Q4 completed assignment of ` 323 Crores of its mortgage business as part of itsALM & treasury diversification & ROE enhancement strategy.
Gross and Net NPA remained healthy at 1.18% and 0.28% respectively. Portfolio metrics acrossconsumer & SME businesses remained very strong in Q4 except CE & marginal stress in Infra portfolio. Thecompany continued to take proactive policy actions to take out bottom 7-10% of potentialbusiness. Collection efficiencies improved with increased contribution of digital collections.
Distribution of fee based products viz. Life & General insurance, Wealth Management, CRISIL Ratings &Financial Fitness Report saw good traction across businesses and continued to remain strong.
To grow & remain competitive in Digital distribution, the company developed solutionduring the quarter. The company is tracking well on Digital channels presence Web, Facebook
(1130K likes), LinkedIn (150K followers) etc.
Bajaj Finance Ltd's Back office Operations performed by Third Party BPO (TCS) has been appraised at Level3 of the CMMI Capability Maturity Model Integration (CMMI).
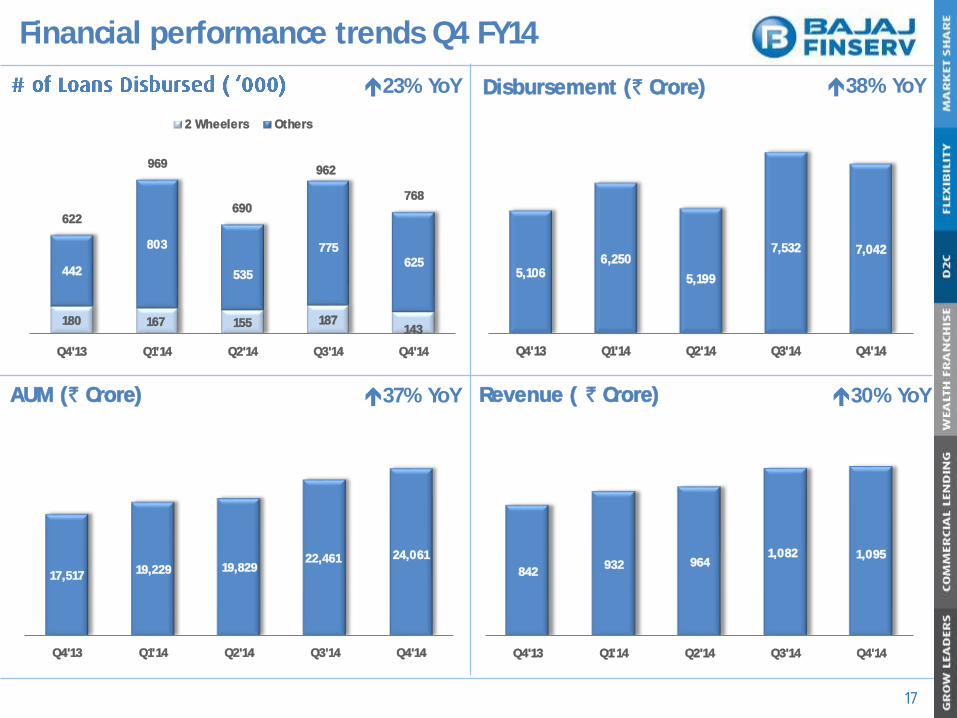
Financial performance trends Q4 FY14
17
AUM (` Crore)
Disbursement (` Crore)
Revenue ( ` Crore)
23% YoY 38% YoY
37% YoY 30% YoY
180 167 155 187143
442
803
535
775625
622
969
690
962
768
Q4'13 Q1'14 Q2'14 Q3'14 Q4'14
2 Wheelers Others
5,1066,250
5,199
7,532 7,042
Q4'13 Q1'14 Q2'14 Q3'14 Q4'14
17,517 19,229 19,82922,461 24,061
Q4'13 Q1'14 Q2'14 Q3'14 Q4'14
842932 964
1,082 1,095
Q4'13 Q1'14 Q2'14 Q3'14 Q4'14
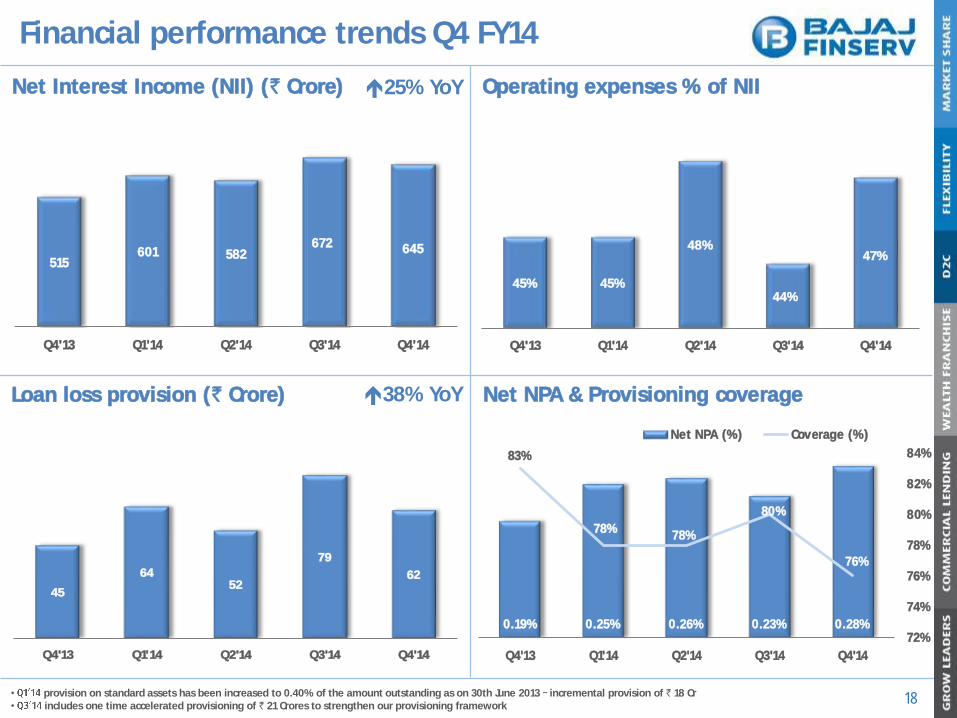
Financial performance trends Q4 FY14
18
Net Interest Income (NII) (` Crore)
Loan loss provision (` Crore)
Operating expenses % of NII
Net NPA & Provisioning coverage
25% YoY
38% YoY
515601 582
672 645
Q4'13 Q1'14 Q2'14 Q3'14 Q4'14
45% 45%
48%
44%
47%
Q4'13 Q1'14 Q2'14 Q3'14 Q4'14
45
6452
79
62
Q4'13 Q1'14 Q2'14 Q3'14 Q4'14
0.19% 0.25% 0.26% 0.23% 0.28%
83%
78%78%
80%
76%
72%
74%
76%
78%
80%
82%
84%
Q4'13 Q1'14 Q2'14 Q3'14 Q4'14
Net NPA (%) Coverage (%)
• provision on standard assets has been increased to 0.40% of the amount outstanding as on 30th June 2013 incremental provision of ` 18 Cr• includes one time accelerated provisioning of ` 21 Crores to strengthen our provisioning framework
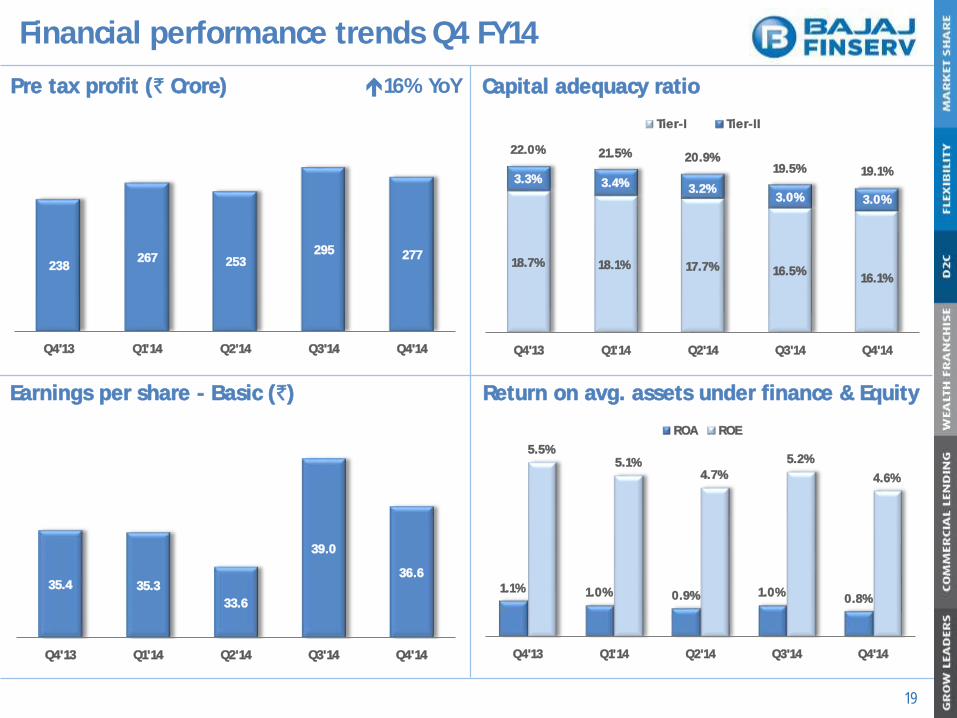
Financial performance trends Q4 FY14
19
Pre tax profit (` Crore)
Earnings per share - Basic (`)
Capital adequacy ratio16% YoY
Return on avg. assets under finance & Equity
238267 253
295 277
Q4'13 Q1'14 Q2'14 Q3'14 Q4'14
1.1% 1.0% 0.9% 1.0%0.8%
5.5%5.1%
4.7%
5.2%
4.6%
Q4'13 Q1'14 Q2'14 Q3'14 Q4'14
ROA ROE
35.4 35.3
33.6
39.0
36.6
Q4'13 Q1'14 Q2'14 Q3'14 Q4'14
18.7% 18.1% 17.7% 16.5%16.1%
3.3% 3.4% 3.2%3.0% 3.0%
22.0% 21.5% 20.9%19.5% 19.1%
Q4'13 Q1'14 Q2'14 Q3'14 Q4'14
Tier-I Tier-II
0.00%
2.00%
4.00%
6.00%
8.00%
10.00%
12.00%
14.00%
J U N ' 1 2 S E P ' 1 2 D E C ' 1 2 M A R ' 1 3 J U N ' 1 3 S E P ' 1 3 D E C ' 1 3 M A R ' 1 4
1st Bucket 2nd Bucket 3rd Bucket 4th Bucket 5th Bucket 5+ Bucket
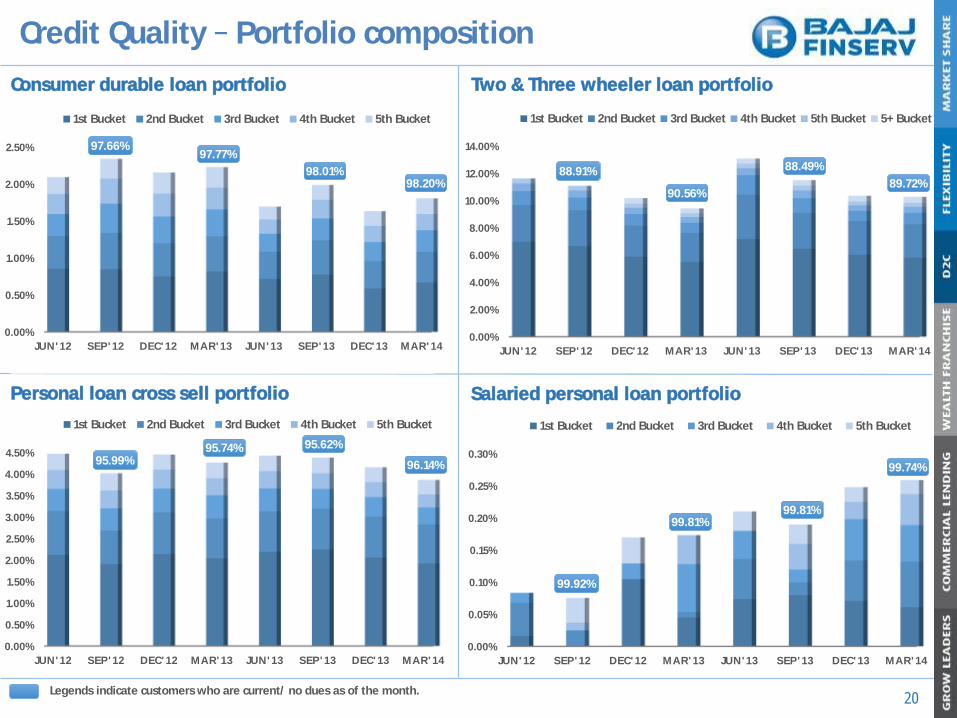
Credit Quality Portfolio composition
20
Consumer durable loan portfolio
Personal loan cross sell portfolio
Two & Three wheeler loan portfolio
Salaried personal loan portfolio
0.00%
0.50%
1.00%
1.50%
2.00%
2.50%
J U N ' 1 2 S E P ' 1 2 D E C ' 1 2 M A R ' 1 3 J U N ' 1 3 S E P ' 1 3 D E C ' 1 3 M A R ' 1 4
1st Bucket 2nd Bucket 3rd Bucket 4th Bucket 5th Bucket
97.77%
98.01%98.20%
97.66%
0.00%
0.50%
1.00%
1.50%
2.00%
2.50%
3.00%
3.50%
4.00%
4.50%
J U N ' 1 2 S E P ' 1 2 D E C ' 1 2 M A R ' 1 3 J U N ' 1 3 S E P ' 1 3 D E C ' 1 3 M A R ' 1 4
1st Bucket 2nd Bucket 3rd Bucket 4th Bucket 5th Bucket
95.74% 95.62%
96.14%95.99%
90.56%
88.49%
89.72%88.91%
0.00%
0.05%
0.10%
0.15%
0.20%
0.25%
0.30%
J U N ' 1 2 S E P ' 1 2 D E C ' 1 2 M A R ' 1 3 J U N ' 1 3 S E P ' 1 3 D E C ' 1 3 M A R ' 1 4
1st Bucket 2nd Bucket 3rd Bucket 4th Bucket 5th Bucket
99.81%99.81%
99.74%
99.92%
Legends indicate customers who are current/ no dues as of the month.
0.00%
0.05%
0.10%
0.15%
0.20%
0.25%
0.30%
0.35%
0.40%
0.45%
J U N ' 1 2 S E P ' 1 2 D E C ' 1 2 M A R ' 1 3 J U N ' 1 3 S E P ' 1 3 D E C ' 1 3 M A R ' 1 4
1st Bucket 2nd Bucket 3rd Bucket 4th Bucket 5th Bucket 5+ Bucket
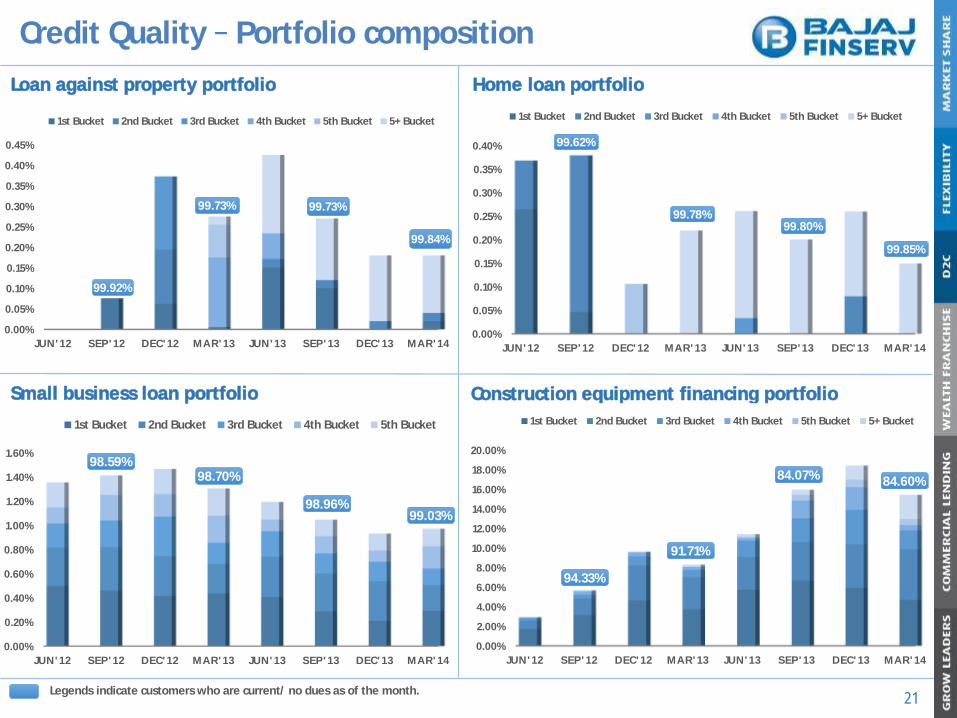
Credit Quality Portfolio composition
21
Loan against property portfolio
Small business loan portfolio
Home loan portfolio
Construction equipment financing portfolio
99.73% 99.73%
99.84%
99.92%
0.00%
0.05%
0.10%
0.15%
0.20%
0.25%
0.30%
0.35%
0.40%
J U N ' 1 2 S E P ' 1 2 D E C ' 1 2 M A R ' 1 3 J U N ' 1 3 S E P ' 1 3 D E C ' 1 3 M A R ' 1 4
1st Bucket 2nd Bucket 3rd Bucket 4th Bucket 5th Bucket 5+ Bucket
99.62%
99.85%
99.80%99.78%
0.00%
0.20%
0.40%
0.60%
0.80%
1.00%
1.20%
1.40%
1.60%
J U N ' 1 2 S E P ' 1 2 D E C ' 1 2 M A R ' 1 3 J U N ' 1 3 S E P ' 1 3 D E C ' 1 3 M A R ' 1 4
1st Bucket 2nd Bucket 3rd Bucket 4th Bucket 5th Bucket
98.70%
98.96%99.03%
98.59%
0.00%
2.00%
4.00%
6.00%
8.00%
10.00%
12.00%
14.00%
16.00%
18.00%
20.00%
J U N ' 1 2 S E P ' 1 2 D E C ' 1 2 M A R ' 1 3 J U N ' 1 3 S E P ' 1 3 D E C ' 1 3 M A R ' 1 4
1st Bucket 2nd Bucket 3rd Bucket 4th Bucket 5th Bucket 5+ Bucket
Legends indicate customers who are current/ no dues as of the month.
91.71%
84.07% 84.60%
94.33%
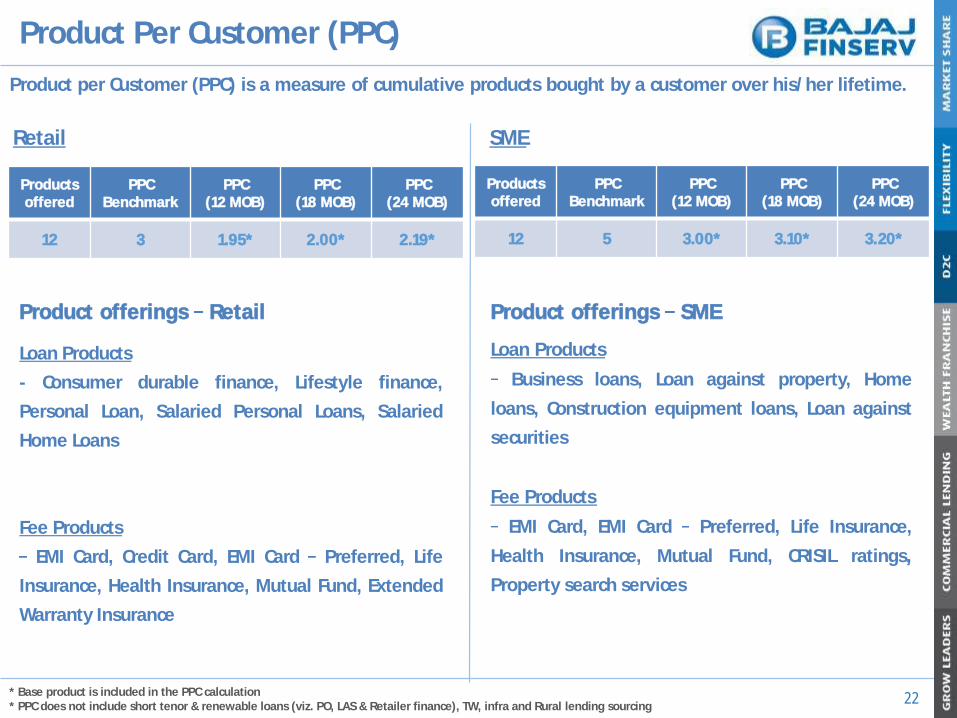
Product Per Customer (PPC)
22
Product per Customer (PPC) is a measure of cumulative products bought by a customer over his/her lifetime.
* Base product is included in the PPC calculation* PPC does not include short tenor & renewable loans (viz. PO, LAS & Retailer finance), TW, infra and Rural lending sourcing
Products offered
PPCBenchmark
PPC(12 MOB)
PPC(18 MOB)
PPC(24 MOB)
12 3 1.95* 2.00* 2.19*
Products offered
PPCBenchmark
PPC(12 MOB)
PPC(18 MOB)
PPC(24 MOB)
12 5 3.00* 3.10* 3.20*
Retail
Product offerings Retail
Loan Products
- Consumer durable finance, Lifestyle finance,
Personal Loan, Salaried Personal Loans, Salaried
Home Loans
Fee Products
EMI Card, Credit Card, EMI Card Preferred, Life
Insurance, Health Insurance, Mutual Fund, Extended
Warranty Insurance
Product offerings SME
Loan Products
Business loans, Loan against property, Home
loans, Construction equipment loans, Loan against
securities
Fee Products
EMI Card, EMI Card Preferred, Life Insurance,
Health Insurance, Mutual Fund, CRISIL ratings,
Property search services
SME
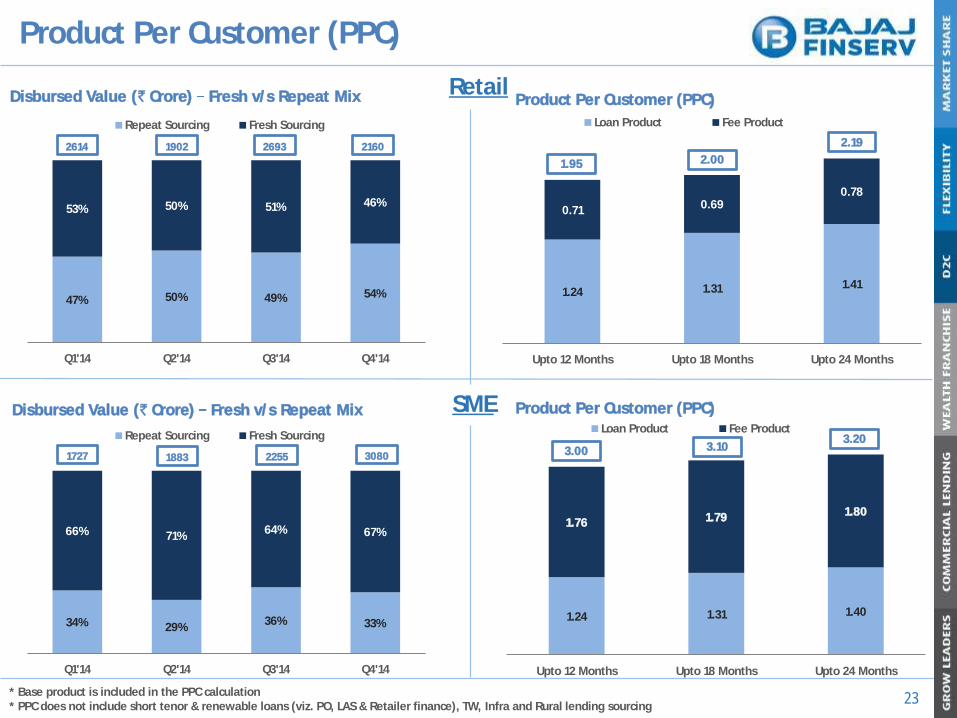
47% 50% 49% 54%
53% 50% 51% 46%
Q1'14 Q2'14 Q3'14 Q4'14
Repeat Sourcing Fresh Sourcing
2614 1902 2693 2160
Product Per Customer (PPC)
23
Retail
SME
Disbursed Value (` Crore) Fresh v/s Repeat Mix Product Per Customer (PPC)
34% 29%36% 33%
66% 71%64% 67%
Q1'14 Q2'14 Q3'14 Q4'14
Repeat Sourcing Fresh Sourcing
Disbursed Value (` Crore) Fresh v/s Repeat Mix
1.24 1.31 1.40
1.76 1.79 1.80
Upto 12 Months Upto 18 Months Upto 24 Months
Loan Product Fee Product
Product Per Customer (PPC)
1.24 1.31 1.41
0.71 0.690.78
Upto 12 Months Upto 18 Months Upto 24 Months
Loan Product Fee Product
2.19
2.001.95
1727 1883 2255 3080
3.203.103.00
* Base product is included in the PPC calculation* PPC does not include short tenor & renewable loans (viz. PO, LAS & Retailer finance), TW, Infra and Rural lending sourcing
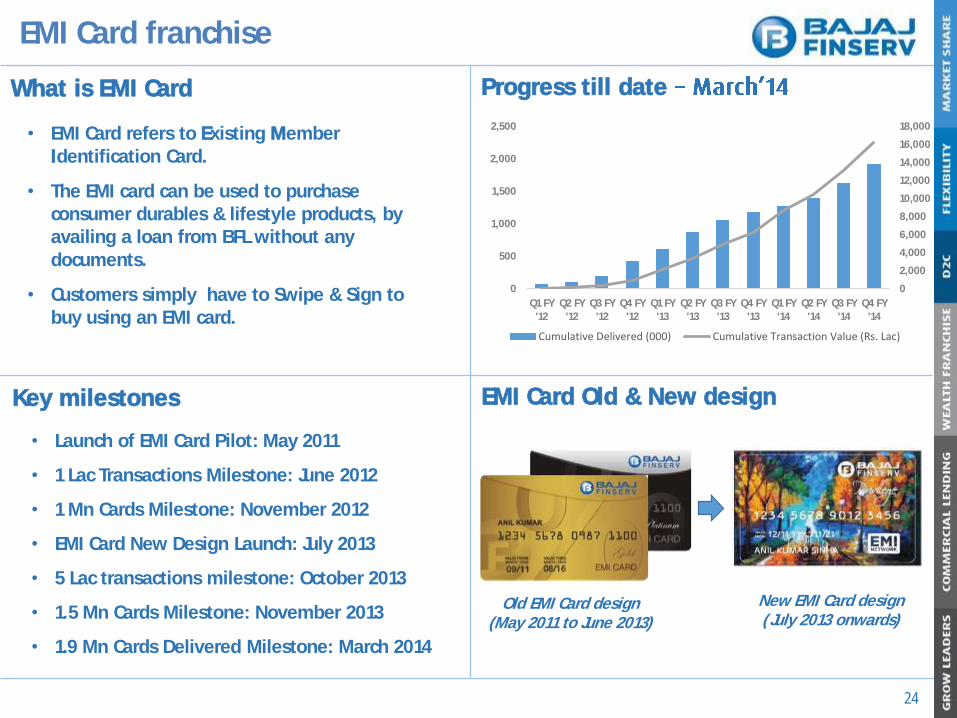
EMI Card franchise
24
What is EMI Card
• EMI Card refers to Existing Member Identification Card.
• The EMI card can be used to purchase consumer durables & lifestyle products, by availing a loan from BFL without any documents.
• Customers simply have to Swipe & Sign to buy using an EMI card.
Progress till date
Key milestones EMI Card Old & New design
Old EMI Card design (May 2011 to June 2013)
New EMI Card design (July 2013 onwards)
• Launch of EMI Card Pilot: May 2011
• 1 Lac Transactions Milestone: June 2012
• 1 Mn Cards Milestone: November 2012
• EMI Card New Design Launch: July 2013
• 5 Lac transactions milestone: October 2013
• 1.5 Mn Cards Milestone: November 2013
• 1.9 Mn Cards Delivered Milestone: March 2014
0
2,000
4,000
6,000
8,000
10,000
12,000
14,000
16,000
18,000
0
500
1,000
1,500
2,000
2,500
Q1 FY'12
Q2 FY'12
Q3 FY'12
Q4 FY'12
Q1 FY'13
Q2 FY'13
Q3 FY'13
Q4 FY'13
Q1 FY'14
Q2 FY'14
Q3 FY'14
Q4 FY'14
Cumulative Delivered (000) Cumulative Transaction Value (Rs. Lac)
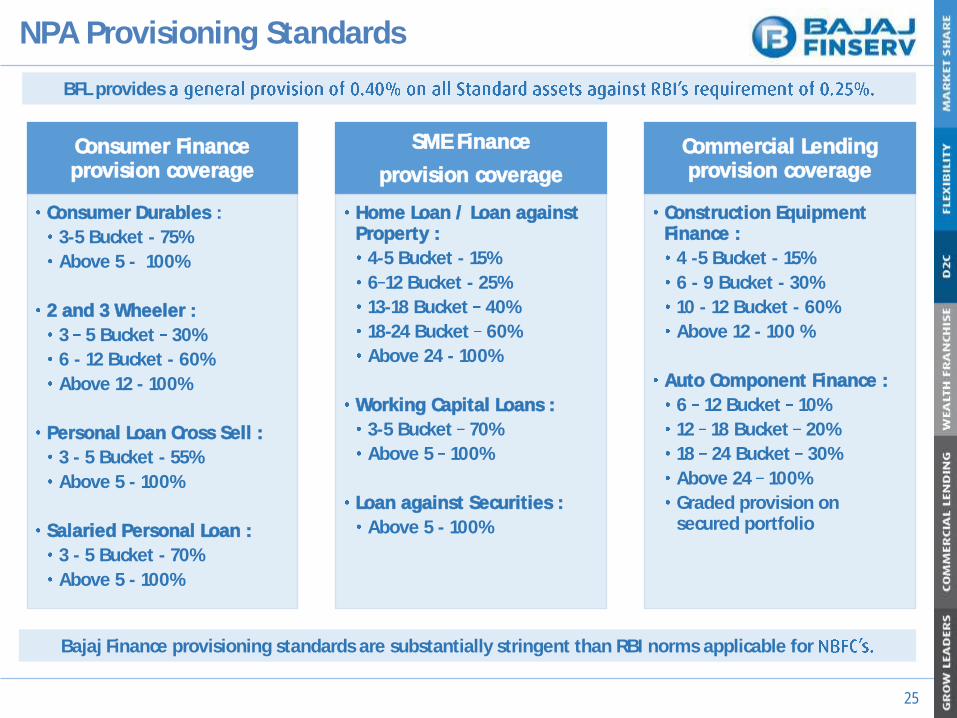
NPA Provisioning Standards
25
Consumer Finance provision coverage
Consumer Durables :
3-5 Bucket - 75%
Above 5 - 100%
2 and 3 Wheeler :
3 5 Bucket 30%
6 - 12 Bucket - 60%
Above 12 - 100%
Personal Loan Cross Sell :
3 - 5 Bucket - 55%
Above 5 - 100%
Salaried Personal Loan :
3 - 5 Bucket - 70%
Above 5 - 100%
SME Finance
provision coverage
Home Loan / Loan against Property :
4-5 Bucket - 15%
6 12 Bucket - 25%
13-18 Bucket 40%
18-24 Bucket 60%
Above 24 - 100%
Working Capital Loans :
3-5 Bucket 70%
Above 5 100%
Loan against Securities :
Above 5 - 100%
Commercial Lending provision coverage
Construction Equipment Finance :
4 -5 Bucket - 15%
6 - 9 Bucket - 30%
10 - 12 Bucket - 60%
Above 12 - 100 %
Auto Component Finance :
6 12 Bucket 10%
12 18 Bucket 20%
18 24 Bucket 30%
Above 24 100%
Graded provision on secured portfolio
BFL provides
Bajaj Finance provisioning standards are substantially stringent than RBI norms applicable for
Disclaimer
26
This presentation has been prepared by Bajaj Finance Limited (the solely for your information and for your use. This presentation is for information purposes onlywithout specific regards to specific objectives, financial situations or needs of any particular person and does not constitute and should not be deemed to constitute or formpart of any offer or invitation or inducement to sell or issue any securities, or any solicitation of any offer to purchase or subscribe for, any securities of the Company, nor shallit or any part of it or the fact of its distribution form the basis of, or be relied upon in connection with, any contract or commitment therefor. The financial information in thispresentation may have been re-classified and reformatted for the purposes of this presentation. You may also refer to the audited financial statements of the Companybefore making any decision on the basis of this information.
This presentation contains statements that may not be based on historical information or facts but that may constitute forward-looking statements. These forward lookingstatements include descriptions regarding the intent, belief or current expectations of the Company or its directors and officers with respect to the results of operations andfinancial condition of the Company. These statements can be recognized by the use of words such as plans will estimates projects or other words ofsimilar meaning. Such forward-looking statements are not guarantees of future performance and involve risks and uncertainties, and actual results may differ from those insuch forward-looking statements as a result of various factors and assumptions which the Company presently believes to be reasonable in light of its operating experience inrecent years but these assumptions may prove to be incorrect. Any opinion, estimate or projection constitutes a judgment as of the date of this presentation, and there canbe no assurance that future results or events will be consistent with any such opinion, estimate or projection. Actual results may differ materially from these forward lookingstatements due to a number of factors, including changes or developments in the business, its market and competitive environment, the ability toimplement its proposed strategies and initiatives and/or due and political, economic, regulatory or social conditions in India and other factors relevant to the business of theCompany. The Company does not undertake to revise any forward-looking statement that may be made from time to time by or on behalf of the Company. Norepresentation, warranty, guarantee or undertaking, express or implied, is or will be made as to, and no reliance should be placed on, the accuracy, completeness,correctness or fairness of the information, estimates, projections and opinions contained in this presentation. Potential investors must make their own assessment of therelevance, accuracy and adequacy of the information contained in this presentation and must make such independent investigation as they may consider necessary orappropriate for such purpose. This presentation does not constitute and should not be considered as a recommendation by the Company that any investor should subscribefor, purchase or sell any of Company's securities. By viewing this presentation you acknowledge that you will be solely responsible for your own assessment of the marketand the market position of the Company and that you will conduct your own analysis and be solely responsible for forming your own view of the potential futureperformance of the business of the Company. Any opinions expressed in this presentation are subject to change without notice. None of the Company, book running leadmanagers, their affiliates, agents or advisors, the placement agents, promoters or any other persons that may participate in any offering of any securities of the Companyshall have any responsibility or liability whatsoever for any loss howsoever arising from this presentation or its contents or otherwise arising in connection therewith.
This presentation and its contents are confidential and should not be distributed, published or reproduced, in whole or part, or disclosed by recipients directly or indirectly toany other person. In particular, this presentation is not directed at or accessible by persons located in the United States, Canada Australia or Japan and this presentation is notfor publication or distribution or release in the United States, Australia, Canada or Japan or in any other country where such distribution may lead to a breach of any law orregulatory requirement. The information contained herein does not constitute or form part of an offer or solicitation of an offer to purchase or subscribe for securities for salein the United States, Australia, Canada or Japan or any other jurisdiction where such distribution may lead to a breach of any law or regulatory requirement. The securitiesreferred to herein have not been and will not be registered under the United States Securities Act of 1933, as amended, and may not be offered or sold in the United States orabsent registration or an applicable exemption from registration.
This presentation is not intended to be a prospectus or preliminary placement document or final placement document under the Securities Exchange Board of India (Issue ofCapital and Disclosure Requirements) Regulations, 2009, as amended. Please also refer to the statement of financial and segmental results required by Indian regulations thathas been filed with the stock exchanges in India and is available in our website http://www.bajajfinservlending.in/. This presentation may not be all inclusive and may notcontain all of the information that you may consider material.
Viewing this information may not be lawful in certain jurisdictions. In other jurisdictions only certain categories of person may be allowed to view this information. Anyperson who wishes to view this site must first satisfy themselves that they are not subject to any local requirements which prohibit or restrict them from doing so. If you arenot permitted to view this presentation on this website or are in any doubt as to whether you are permitted to view these materials, please exit this webpage

Bajaj Finance Limited
Q4 FY14 Presentation
Thank you
14th May 2014