Embed Size (px)
Citation preview

Bach Harrison Youth Survey Results for 2006
Report for Sample School This report was prepared for the Sample State by: Bach Harrison, L.L.C. 116 S. 500 E. Salt Lake City, UT 84102 (801) 359-2064
Your State Logo, name, address or any contractor information

Year of Survey
Number Percent Number Percent Number Percent Number Percent
Total Students 2119 100 2731 100 3025 100 18579 100Grade8 1030 36.3 1003 36.7 1064 35.2 6207 33.410 976 37.6 1018 37.3 1083 35.8 6688 36.012 113 26.1 710 26.0 878 29.0 5684 30.6GenderMale 948 48.4 1317 48.4 1516 50.8 9125 49.9Female 1012 51.6 1405 51.6 1468 49.2 9167 50.1EthnicityWhite 1772 84.8 2315 85.5 2492 83.4 15485 84.6African American 24 1.1 24 0.9 128 4.3 166 0.9Native American 79 3.8 103 3.8 169 5.7 1316 7.2Hispanic 105 5.0 133 4.9 44 1.5 492 2.7Asian 51 1.7 223 1.2Pacific Islander 22 0.7 110 0.6* 2000 & 2002 categories Asian and Pacific Islander were combined as 'Asian or Pacific Islander'
1.7*47*1.4*30*
2004Table 1. Characteristics of Participants
0 State0 State200420062004
Contents: Introduction Building a Strategic Prevention Framework Tools for Assessment and Planning Practical Implications of the Bach Harrison Youth Survey How to Read the Charts Data Charts: • Substance Use &
Antisocial Behavior • Risk & Protective
Factor Profiles Risk and Protective Factor Scale Definitions Data Tables Contacts for Prevention
The Risk and Protective
Factor Model of Prevention
Many states and local agencies have adopted the Risk and Protective Factor Model to guide their prevention efforts. The Risk and Protective Factor Model of Prevention is based on the simple premise that to prevent a problem from happening, we need to identify the factors that increase the risk of that problem developing and then find ways to reduce the risks. Just as medical researchers have found risk factors for heart disease such as diets high in fat, lack of exercise, and smoking; a team of researchers at the University of Washington have defined a set of risk factors for youth problem behaviors. Risk factors are charac-teristics of school, community, and family environments, as well as characteristics of students and their peer groups that are known to predict increased likelihood of drug use, delinquency, school dropout, teen pregnancy, and violent behavior among youth. Dr. J. David Hawkins, Dr. Richard F. Catalano, and their colleagues at the University of Washington, Social Development Research Group have investigated the relationship between risk and protective factors and youth problem behavior. For example, they have found that children who live in families with high levels of conflict are more likely to become involved in problem behaviors such as delinquency and drug use than children who live in families with low levels of family conflict. Protective factors exert a positive influence or buffer against the negative influence of risk, thus reducing the likelihood that adolescents will engage in problem behaviors.
2006 Sample State
Bach Harrison Youth Survey
School Summary Report for Sample School
This report summarizes the findings from the Sample State Bach Harrison Youth Survey that was conducted during the spring of 2006 in grades 8, 10, and 12. The survey has been conducted every other year since 1998 by the Sample State Department of Public Health and Human Services, Division of Substance Abuse. The results for your school are presented along with comparisons to the results for the Sample State. The survey was designed to assess adolescent substance use, anti-social behavior, and the risk and protective factors that predict these adolescent problem behaviors. Table 1 contains the characteristics of the students who completed the survey from your school, and the Sample State, compared to the past years of data.
Introduction
2

P
Building a Strategic revention Framework
The Prevention Needs Assessment Survey is an important part of the Substance Abuse and Mental Health Services Administration (SAMHSA) Center for Substance Abuse Prevention (CSAP) Strategic Prevention Framework Process. CSAP created this 5-step model to guide states and communities through the process of creating a planned, data-driven, effective, and sustainable prevention program. The information presented in this section is taken from CSAP’s Strategic Prevention Framework State Incentive Grants Request for Application. Step 1: Profile Population Needs, Resources, and Readiness to Address the Problems and Gaps in Service Delivery
• Community Needs Assessment: The results of this survey (presented in this Profile Report and in results reported at the State level) will help you to identify needs for prevention. States should consider administering a survey such as the Bach Harrison Youth Survey biannually to assess adolescent substance use, anti-social behavior, and many of the risk and protective factors that predict adolescent problem behaviors. While planning prevention services, communities are urged to collect and use multiple data sources, including archival and social indicators, assessment of existing resources, key informant interviews, as well as data from this survey.
• Community Resource Assessment: It is likely that existing agencies and programs are already addressing some the prioritized risk and protective factors. It is important to identify the assets and resources already available in the community and the gaps in services and capacity.
• Community Readiness Assessment: It is very important for states and communities to have the commitment and support of their members and ample resources to implement effective prevention efforts. Therefore, the readiness and capacity of communities and resources to act should also be assessed.
Step 2: Mobilize and/or Build Capacity to Address Needs: Engagement of key stakeholders at the State and community levels is critical to plan and implement successful prevention activities that will be sustained over time. Some of the key tasks to mobilize the state and communities are to work with leaders and stakeholders to build coalitions, provide training, leverage resources, and help sustain activities.
Step 3: Develop a Comprehensive Strategic Plan: States and communities should develop a strategic plan that
articulates not only a vision for the prevention activities, but also strategies for organizing and implementing prevention efforts. The strategic plan should be based on documented needs, build on identified resources/strengths, set measurable objectives, and identify how progress will be monitored. Plans should be adjusted with ongoing needs assessment and monitoring activities. The issue of sustainability should be kept in mind throughout each step of planning and implementation.
Step 4: Implement Evidence-based Prevention Programs and Infrastructure Development Activities: By measuring risk and protective factors in a population, prevention programs can be implemented that will reduce the elevated risk factors and increase the protective factors. For example, if academic failure is identified as a prioritized risk factor in a community, then mentoring, tutoring, and increased opportunities and rewards for classroom participation can be provided to improve academic performance. After completing Steps 1, 2, and 3, communities will be able to choose prevention programs that fit the Strategic Framework of the community, match the population served, and are scientifically proven to work. The Western Center for the Application of Prevention Technology website (www.westcapt.org) contains a search engine for identifying Best Practice Programs.
Step 5: Monitor Process, Evaluate Effectiveness, Sustain Effective Programs/Activities, and Improve or
Replace Those That Fail: Finally, ongoing monitoring and evaluation are essential to determine if the outcomes desires are achieved and to assess program effectiveness, assess service delivery quality, identify successes, encourage needed improvement, and promote sustainability of effective policies, programs, and practices.
3
MEASURE U
Risk FactorsProtective Factors
Substance UseAntisocial Behaviors
School and Community Improvement Using Survey Data
Tools for Assessment and Planning
Why Conduct the Prevention Needs Assessment Survey? Data from the Bach Harrison Youth Survey can be used to help school and community planners assess current conditions and prioritize areas of greatest need. Each risk and protective factor can be linked to specific types of interventions that have been shown to be effective in either reducing risk(s) or enhancing protection(s). The steps outlined here will help your school and community make key decisions regarding allocation of resources, how and when to address specific needs, and which strategies are most effective and known to
roduce results. p
What are the numbers telling you? Review the charts and data tables presented in this report. Using the table below, note your findings as you discuss the following questions. • Which 3-5 risk factors appear to be higher than you would want? • Which 3-5 protective factors appear to be lower than you would want? • Which levels of 30-day drug use are increasing and/or unacceptably high?
o Which substances are your students using the most? o At which grades do you see unacceptable usage levels?
• Which levels of antisocial behaviors are increasing and/or unacceptably high?
o Which behaviors are your students exhibiting the most? o At which grades do you see unacceptable behavior levels?
How to decide if a rate is “unacceptable.” • Look across the charts – which items stand out as either much higher
or much lower than the other? • Compare your data with statewide, and national data – differences
of 5% between local and other data are probably significant. • Determine the standards and values held within your community –
For example: Is it acceptable in your community for 50% of high school seniors to drink alcohol regularly even when the statewide percentage is 60%?
Use these data for planning. • Substance use and antisocial behavior data – raise awareness about
the problems and promote dialogue • Risk and protective factor data – identify exactly where the community
needs to take action • Promising approaches – access resources listed on the last page of this
report for ideas about programs that have proven effective in addressing the risk factors that are high in your community, and improving the protective factors that are low
nacceptable Rate #1
Unacceptable Rate #2
Unacceptable Rate #3
Unacceptable Rate #4
4
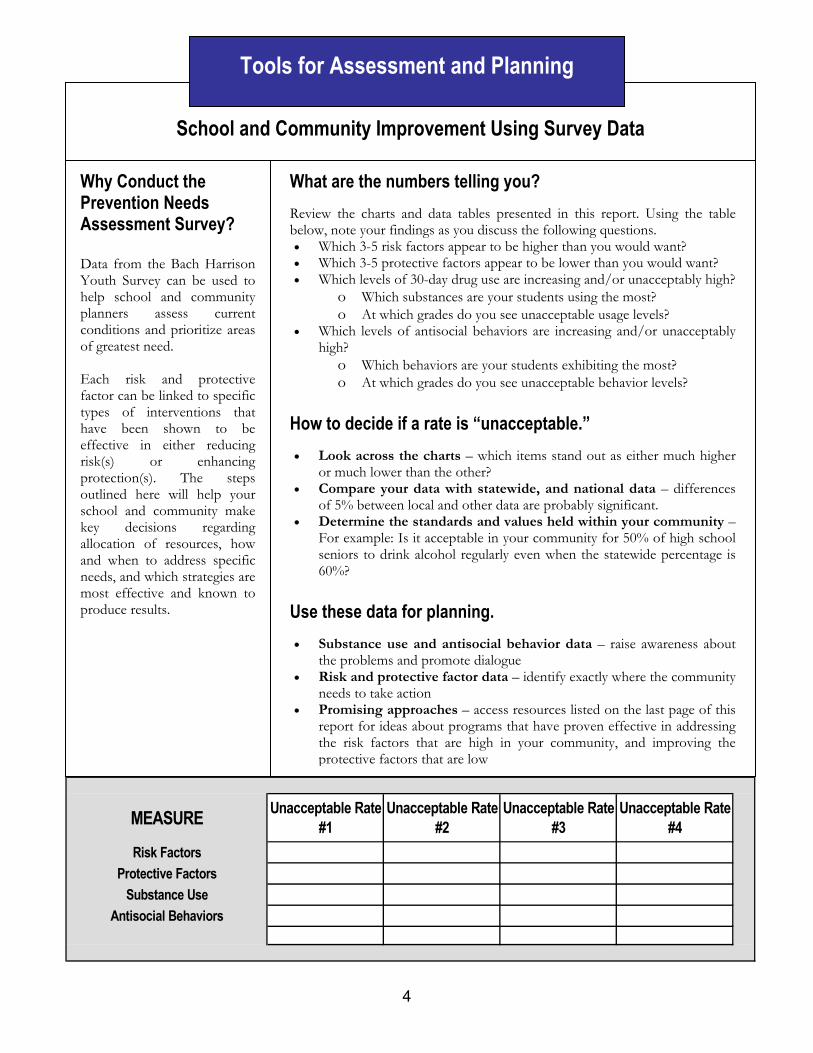
No Child Left Behind The Safe and Drug Free Schools and Communities secti schools and communities use six Principles of Effectivene prevention and intervention programs. First introduced i Effectiveness outline a data-driven process for ensuring Principles of Effectiveness stipulate that local prevention pr
• be based on a needs assessment using objective• target specific performance objectives, • be based on scientific research and be proven t• be based on the analysis of predictor variables s• include meaningful and on-going parental input• have periodic evaluations of established perform
The results of the Bach Harrison Youth Survey presented in NCLB Act. The Substance Use and Antisocial Behavior cha and Protective Factor charts provide information related t planning framework helps schools meet all of the Principle the NCLB Act.
How to Read the CharAntisocial Be
on of the No Child Left Behind Act (NCLB) requires thatss to guide their decisions and spending on federally fundedn 1998 by the Department of Education, the Principles ofthat prevention programs achieve the desired results. The
ograms and activities must:
data regarding the incidence of drug use and violence,
o reduce violence or drug use, uch as risk and protective factors, in program implementation, and ance measures.
this report can help your school community comply with therts provide information related to Principle 1 above. The Risko Principle 4. Overall, using the Risk and Protective factorss of Effectiveness, and thereby assists schools to comply with
Practical Implications of the PNA
ts: Substance Use and havior Charts
•
•
•
•
There are three types of charts presented in thisreport: 1) substance use and antisocial behaviorcharts, 2) risk factor charts, and 3) protective factorcharts. All the charts show the results of the 2000,2002, and 2006 PNA Surveys, and the actualpercentages from the charts are presented in Tables 3through 9.
Substance Use and Antisocial BehaviorCharts This report contains information about alcohol,tobacco and other drug use (referred to as ATOD usethroughout this report) and other problem behaviorsof students. The bars on each chart represent thepercentage of students in that grade who reported thebehavior. The four sections in the charts representdifferent types of problem behaviors. The definitionsof each of the types of behavior are provided below.
• Ever-used is a measure of the percentage ofstudents who tried the particular substance atleast once in their lifetime and is used to show
5
the percentage of students who have hadexperience with a particular substance. 30-day use is a measure of the percentage ofstudents who used the substance at least once inthe 30 days prior to taking the survey and is a moresensitive indicator of the level of current use of the substance. Binge drinking and Pack or more of cigarettesper day are measures of heavy use of alcohol and tobacco. Binge drinking is defined as having five or more drinks in a row during the two weeks prior to taking the survey. Antisocial behavior (ASB) is a measure of the percentage of students who report anyinvolvement with the eight antisocial behaviorslisted in the charts in the past year. In the charts,antisocial behavior will often be abreviated as ASB. Dots are used on the charts to show the overallstate average of all of the youth in each grade who participated in the survey for each behavior. More information about the dots is contained on the following page.

How to Read the Charts: Risk and Protective Factor Charts
Risk and Protective Factor Charts There are three components of the risk and protective factor charts that are key to understanding the information that the charts contain: 1) the cut-points for the risk and protective factor scales, 2) the dots that indicate the state values, and 3) the dashed lines that indicate a more “national” value. Cut-Points Before the percentage of youth at risk on a given scale could be calculated, a scale value or cut-pointneeded to be determined that would separate the at-risk group from the not at-risk group. The Bach Harrison Youth Survey was designed to assess adolescent substance use, anti-social behavior, and the risk and protective factors that predict these adolescent problem behaviors. Since the Bach Harrison Youth Survey had been given to over 200,000 youth nationwide, it was possible to select two groups of youth, one that was more at risk for problem behaviors and another group that was less at risk. A cut-point score was then determined for each risk and protective factor scale that best divided the youth from the two groups into their appropriate group, more at-risk or less at-risk. The criteria for separating youth into the more at-risk and the less at-risk groups included academic grades (the more at-risk group received “D” and “F” grades, the less at-risk group received “A” and “B” grades), ATOD use (the more at-risk group had more regular use, the less at-risk group had no drug use and use of alcohol or tobacco on only a few occasions), and antisocial behavior (the more at-risk group had two or more serious delinquent acts in the past year, the less at-risk group had no serious delinquent acts). The cut-points that were determined by analyzing the results of the more at-risk and less at-risk groups will remain constant and will be used to produce the profiles for future surveys.
Since the cut-points for each scale will remain fixed,the percentage of youth above the cut-point on a scale (at-risk) will provide a method for evaluating the progress of prevention programs over time. For example, if the percentage of youth at riskfor family conflict in a community prior to implementing a community-wide family/parenting program was 60% and then decreased to 45% oneyear after the program was implemented, the programwould be viewed as helping to reduce family conflict. Dots The dots on the charts represent the percentage of all of the youth surveyed from Montana who reported‘elevated risk’ or ‘elevated protection’. Thecomparison to the state-wide sample provides additional information for your community in determining the relative importance of each risk orprotective factor level. Scanning across the charts, you can easily determine which factors are most (orleast) prevalent for your community. This is the firststep in identifying the levels of risk and protectionthat are operating in your community and whichfactors your community may choose to address.
Dashed Line Levels of risk and protection in your community also can be compared to a more national sample. The dashed line on each risk and protective factor chartrepresents the percentage of youth at risk or with protection for the seven state sample upon which thecut-points were developed. The seven states included in the norm group were Colorado, Illinois, Kansas, Maine, Oregon, Utah, and Washington. All the stateshave a mix of urban and rural students. Brief definitions of the risk and protective factors areprovided following the profile charts. For moreinformation about risk and protective factors, please refer to the resources listed on the last page of thisreport under Contacts for Prevention.
6

SAMPLE SCHOOL ATOD USE AND ANTISOCIAL BEHAVIOR
0
10
20
30
40
50
60
70
80
90
100A
lcoh
ol
Cig
aret
tes
Che
win
g To
bacc
o
Mar
ijuan
a
Inha
lant
s
Hal
luci
noge
ns
Coc
aine
Stim
ulan
ts
Seda
tives
Opi
ates
Ecst
asy
Alc
ohol
Cig
aret
tes
Che
win
g To
bacc
o
Mar
ijuan
a
Inha
lant
s
Hal
luci
noge
ns
Coc
aine
Stim
ulan
ts
Seda
tives
Opi
ates
Ecst
asy
Bin
ge D
rinki
ng
Pack
of C
igar
ette
s pe
r Day
Susp
ende
d fr
om S
choo
l
Dru
nk o
r Hig
h at
Sch
ool
Sold
Ille
gal D
rugs
Stol
en a
Veh
icle
Bee
n A
rres
ted
Atta
cked
to H
arm
Car
ried
a H
andg
un
Han
dgun
to S
choo
l
Perc
enta
ges
(%)
School 2004
School 2006
State 2006
Ever Used 30-Day Use Heavy Use Antisocial
2006 Student Survey, Grade 8
7

SAMPLE SCHOOL ATOD USE AND ANTISOCIAL BEHAVIOR
0
10
20
30
40
50
60
70
80
90
100A
lcoh
ol
Cig
aret
tes
Che
win
g To
bacc
o
Mar
ijuan
a
Inha
lant
s
Hal
luci
noge
ns
Coc
aine
Stim
ulan
ts
Seda
tives
Opi
ates
Ecst
asy
Alc
ohol
Cig
aret
tes
Che
win
g To
bacc
o
Mar
ijuan
a
Inha
lant
s
Hal
luci
noge
ns
Coc
aine
Stim
ulan
ts
Seda
tives
Opi
ates
Ecst
asy
Bin
ge D
rinki
ng
Pack
of C
igar
ette
s pe
r Day
Susp
ende
d fr
om S
choo
l
Dru
nk o
r Hig
h at
Sch
ool
Sold
Ille
gal D
rugs
Stol
en a
Veh
icle
Bee
n A
rres
ted
Atta
cked
to H
arm
Car
ried
a H
andg
un
Han
dgun
to S
choo
l
Perc
enta
ges
(%)
School 2004
School 2006
State 2006
Ever Used 30-Day Use Heavy Use Antisocial
2006 Student Survey, Grade 10
8

SAMPLE SCHOOL ATOD USE AND ANTISOCIAL BEHAVIOR
0
10
20
30
40
50
60
70
80
90
100A
lcoh
ol
Cig
aret
tes
Che
win
g To
bacc
o
Mar
ijuan
a
Inha
lant
s
Hal
luci
noge
ns
Coc
aine
Stim
ulan
ts
Seda
tives
Opi
ates
Ecst
asy
Alc
ohol
Cig
aret
tes
Che
win
g To
bacc
o
Mar
ijuan
a
Inha
lant
s
Hal
luci
noge
ns
Coc
aine
Stim
ulan
ts
Seda
tives
Opi
ates
Ecst
asy
Bin
ge D
rinki
ng
Pack
of C
igar
ette
s pe
r Day
Susp
ende
d fr
om S
choo
l
Dru
nk o
r Hig
h at
Sch
ool
Sold
Ille
gal D
rugs
Stol
en a
Veh
icle
Bee
n A
rres
ted
Atta
cked
to H
arm
Car
ried
a H
andg
un
Han
dgun
to S
choo
l
Perc
enta
ges
(%)
School 2004
School 2006
State 2006
Ever Used 30-Day Use Heavy Use Antisocial
2006 Student Survey, Grade 12
9

SAMPLE SCHOOL RISK PROFILE
0
10
20
30
40
50
60
70
80
90
100Lo
w N
eigh
borh
ood
Atta
chm
ent
Com
mun
ity D
isor
gani
zatio
n
Tran
sitio
ns &
Mob
ility
Law
s &
Nor
ms
Favo
r Dru
g U
se
Perc
eive
d A
vaila
bilit
y of
Dru
gs
Perc
eive
d A
vaila
bilit
y of
Han
dgun
s
Poor
Fam
ily M
anag
emen
t
Fam
ily C
onfli
ct
Fam
ily H
isto
ry o
f Ant
isoc
ial B
ehav
ior
Pare
nt A
ttitu
des
Favo
rabl
e to
ASB
Pare
nt A
ttitu
des
Favo
r Dru
g U
se
Aca
dem
ic F
ailu
re
Low
Com
mitm
ent t
o Sc
hool
Reb
ellio
usne
ss
Early
Initi
atio
n of
ASB
Early
Initi
atio
n of
Dru
g U
se
Atti
tude
s Fa
vora
ble
to A
SB
Atti
tude
s Fa
vora
ble
to D
rug
Use
Perc
eive
d R
isk
of D
rug
Use
Inte
ract
ion
with
Ant
isoc
ial P
eers
Frie
nd's
Use
of D
rugs
Sens
atio
n Se
ekin
g
Rew
ards
for A
SB
Dep
ress
ive
Sym
ptom
s
Inte
ntio
n to
Use
ATO
Ds
Perc
enta
ge o
f You
th a
t Ris
k
School 2004School 20067 State NormState 2006
Community Family School Peer / Individual
2006 Student Survey, Grade 8
10

SAMPLE SCHOOL RISK PROFILE
0
10
20
30
40
50
60
70
80
90
100Lo
w N
eigh
borh
ood
Atta
chm
ent
Com
mun
ity D
isor
gani
zatio
n
Tran
sitio
ns &
Mob
ility
Law
s &
Nor
ms
Favo
r Dru
g U
se
Perc
eive
d A
vaila
bilit
y of
Dru
gs
Perc
eive
d A
vaila
bilit
y of
Han
dgun
s
Poor
Fam
ily M
anag
emen
t
Fam
ily C
onfli
ct
Fam
ily H
isto
ry o
f Ant
isoc
ial B
ehav
ior
Pare
nt A
ttitu
des
Favo
rabl
e to
ASB
Pare
nt A
ttitu
des
Favo
r Dru
g U
se
Aca
dem
ic F
ailu
re
Low
Com
mitm
ent t
o Sc
hool
Reb
ellio
usne
ss
Early
Initi
atio
n of
ASB
Early
Initi
atio
n of
Dru
g U
se
Atti
tude
s Fa
vora
ble
to A
SB
Atti
tude
s Fa
vora
ble
to D
rug
Use
Perc
eive
d R
isk
of D
rug
Use
Inte
ract
ion
with
Ant
isoc
ial P
eers
Frie
nd's
Use
of D
rugs
Sens
atio
n Se
ekin
g
Rew
ards
for A
SB
Dep
ress
ive
Sym
ptom
s
Inte
ntio
n to
Use
ATO
Ds
Perc
enta
ge o
f You
th a
t Ris
k
School 2004School 20067 State NormState 2006
Community Family School Peer / Individual
2006 Student Survey, Grade 10
11

SAMPLE SCHOOL RISK PROFILE
0
10
20
30
40
50
60
70
80
90
100Lo
w N
eigh
borh
ood
Atta
chm
ent
Com
mun
ity D
isor
gani
zatio
n
Tran
sitio
ns &
Mob
ility
Law
s &
Nor
ms
Favo
r Dru
g U
se
Perc
eive
d A
vaila
bilit
y of
Dru
gs
Perc
eive
d A
vaila
bilit
y of
Han
dgun
s
Poor
Fam
ily M
anag
emen
t
Fam
ily C
onfli
ct
Fam
ily H
isto
ry o
f Ant
isoc
ial B
ehav
ior
Pare
nt A
ttitu
des
Favo
rabl
e to
ASB
Pare
nt A
ttitu
des
Favo
r Dru
g U
se
Aca
dem
ic F
ailu
re
Low
Com
mitm
ent t
o Sc
hool
Reb
ellio
usne
ss
Early
Initi
atio
n of
ASB
Early
Initi
atio
n of
Dru
g U
se
Atti
tude
s Fa
vora
ble
to A
SB
Atti
tude
s Fa
vora
ble
to D
rug
Use
Perc
eive
d R
isk
of D
rug
Use
Inte
ract
ion
with
Ant
isoc
ial P
eers
Frie
nd's
Use
of D
rugs
Sens
atio
n Se
ekin
g
Rew
ards
for A
SB
Dep
ress
ive
Sym
ptom
s
Inte
ntio
n to
Use
ATO
Ds
Perc
enta
ge o
f You
th a
t Ris
k
School 2004School 20067 State NormState 2006
Community Family School Peer / Individual
2006 Student Survey, Grade 12
12

SAMPLE SCHOOL PROTECTIVE PROFILE
0
10
20
30
40
50
60
70
80
90
100O
ppor
tuni
ties
for
Pros
ocia
l Inv
olve
men
t
Rew
ards
for P
roso
cial
Invo
lvem
ent
Fam
ily A
ttach
men
t
Opp
ortu
nitie
s fo
rPr
osoc
ial I
nvol
vem
ent
Rew
ards
for P
roso
cial
Invo
lvem
ent
Opp
ortu
nitie
s fo
rPr
osoc
ial I
nvol
vmen
t
Rew
ards
for P
roso
cial
Invo
lvem
ent
Rel
igio
sity
Soci
al S
kills
Bel
ief i
n th
e M
oral
Ord
er
Inte
ract
ion
with
Pros
ocia
l Pee
rs
Opp
ortu
nitie
s fo
rPr
osoc
ial I
nvol
vem
ent
Rew
ards
for P
roso
cial
Invo
lvem
ent
Perc
enta
ge o
f You
th w
ith P
rote
ctiv
e Fa
ctor
School 2004School 20067 State NormState 2006
2006 Student Survey, Grade 8 Community Family School Peer / Individual
13

SAMPLE SCHOOL PROTECTIVE PROFILE
0
10
20
30
40
50
60
70
80
90
100O
ppor
tuni
ties
for
Pros
ocia
l Inv
olve
men
t
Rew
ards
for P
roso
cial
Invo
lvem
ent
Fam
ily A
ttach
men
t
Opp
ortu
nitie
s fo
rPr
osoc
ial I
nvol
vem
ent
Rew
ards
for P
roso
cial
Invo
lvem
ent
Opp
ortu
nitie
s fo
rPr
osoc
ial I
nvol
vmen
t
Rew
ards
for P
roso
cial
Invo
lvem
ent
Rel
igio
sity
Soci
al S
kills
Bel
ief i
n th
e M
oral
Ord
er
Inte
ract
ion
with
Pros
ocia
l Pee
rs
Opp
ortu
nitie
s fo
rPr
osoc
ial I
nvol
vem
ent
Rew
ards
for P
roso
cial
Invo
lvem
ent
Perc
enta
ge o
f You
th w
ith P
rote
ctiv
e Fa
ctor
School 2004School 20067 State NormState 2006
2006 Student Survey, Grade 10 Community Family School Peer / Individual
14

SAMPLE SCHOOL PROTECTIVE PROFILE
0
10
20
30
40
50
60
70
80
90
100O
ppor
tuni
ties
for
Pros
ocia
l Inv
olve
men
t
Rew
ards
for P
roso
cial
Invo
lvem
ent
Fam
ily A
ttach
men
t
Opp
ortu
nitie
s fo
rPr
osoc
ial I
nvol
vem
ent
Rew
ards
for P
roso
cial
Invo
lvem
ent
Opp
ortu
nitie
s fo
rPr
osoc
ial I
nvol
vmen
t
Rew
ards
for P
roso
cial
Invo
lvem
ent
Rel
igio
sity
Soci
al S
kills
Bel
ief i
n th
e M
oral
Ord
er
Inte
ract
ion
with
Pros
ocia
l Pee
rs
Opp
ortu
nitie
s fo
rPr
osoc
ial I
nvol
vem
ent
Rew
ards
for P
roso
cial
Invo
lvem
ent
Perc
enta
ge o
f You
th w
ith P
rote
ctiv
e Fa
ctor
School 2004School 20067 State NormState 2006
2006 Student Survey, Grade 12 Community Family School Peer / Individual
15

Table 2. Risk and Protective Factor Scale Definitions
Community Domain Risk Factors Community and Personal Transitions & Mobility
Neighborhoods with high rates of residential mobility have been shown to have higher rates of juvenile crime and drug selling, while children who experience frequent residential moves and stressful life transitions have been shown to have higher risk for school failure, delinquency, and drug use.
Community Disorganization Research has shown that neighborhoods with high population density, lack of natural surveillance of public places, physical deterioration, and high rates of adult crime also have higher rates of juvenile crime and drug selling.
Low Neighborhood Attachment
A low level of bonding to the neighborhood is related to higher levels of juvenile crime and drug selling.
Laws and Norms Favorable Toward Drug Use
Research has shown that legal restrictions on alcohol and tobacco use, such as raising the legal drinking age, restricting smoking in public places, and increased taxation have been followed by decreases in consumption. Moreover, national surveys of high school seniors have shown that shifts in normative attitudes toward drug use have preceded changes in prevalence of use.
Perceived Availability of Drugs and Handguns
The availability of cigarettes, alcohol, marijuana, and other illegal drugs has been related to the use of these substances by adolescents. The availability of handguns is also related to a higher risk of crime and substance use by adolescents.
Community Domain Protective Factors Opportunities for Positive Involvement
When opportunities are available in a community for positive participation, children are less likely to engage in substance use and other problem behaviors.
Rewards for Positive Involvement
Rewards for positive participation in activities helps children bond to the community, thus lowering their risk for substance use.
Family Domain Risk Factors Family History of Antisocial Behavior
When children are raised in a family with a history of problem behaviors (e.g., violence or ATOD use), the children are more likely to engage in these behaviors.
Family Conflict Children raised in families high in conflict, whether or not the child is directly involved in the conflict, appear at risk for both delinquency and drug use.
Parental Attitudes Favorable Toward Antisocial Behavior & Drugs
In families where parents use illegal drugs, are heavy users of alcohol, or are tolerant of children’s use, children are more likely to become drug abusers during adolescence. The risk is further increased if parents involve children in their own drug (or alcohol) using behavior, for example, asking the child to light the parent’s cigarette or get the parent a beer from the refrigerator.
Poor Family Management Parents’ use of inconsistent and/or unusually harsh or severe punishment with their children places them at higher risk for substance use and other problem behaviors. Also, parents’ failure to provide clear expectations and to monitor their children’s behavior makes it more likely that they will engage in drug abuse whether or not there are family drug problems
Family Domain Protective Factors Family Attachment Young people who feel that they are a valued part of their family are less likely to engage in substance
use and other problem behaviors.
Opportunities for Positive Involvement
Young people who are exposed to more opportunities to participate meaningfully in the responsibilities and activities of the family are less likely to engage in drug use and other problem behaviors.
Rewards for Positive Involvement
When parents, siblings, and other family members praise, encourage, and attend to things done well by their child, children are less likely to engage in substance use and problem behaviors.
School Domain Risk Factors Academic Failure Beginning in the late elementary grades (grades 4-6) academic failure increases the risk of both drug
abuse and delinquency. It appears that the experience of failure itself, for whatever reasons, increases the risk of problem behaviors.
16

Table 2. Risk and Protective Factor Scale Definitions (Continued) Low Commitment to School Surveys of high school seniors have shown that the use of hallucinogens, cocaine, heroin, stimulants, and
sedatives or non-medically prescribed tranquilizers is significantly lower among students who expect to attend college than among those who do not. Factors such as liking school, spending time on homework, and perceiving the coursework as relevant are also negatively related to drug use.
School Domain Protective Factors Opportunities for Positive Involvement
When young people are given more opportunities to participate meaningfully in important activities at school, they are less likely to engage in drug use and other problem behaviors.
Rewards for Positive Involvement
When young people are recognized and rewarded for their contributions at school, they are less likely to be involved in substance use and other problem behaviors
Peer-Individual Risk Factors Early Initiation of Antisocial Behavior and Drug Use
Early onset of drug use predicts misuse of drugs. The earlier the onset of any drug use, the greater the involvement in other drug use and the greater frequency of use. Onset of drug use prior to the age of 15 is a consistent predictor of drug abuse, and a later age of onset of drug use has been shown to predict lower drug involvement and a greater probability of discontinuation of use.
Attitudes Favorable Toward Antisocial Behavior and Drug Use
During the elementary school years, most children express anti-drug, anti-crime, and pro-social attitudes and have difficulty imagining why people use drugs or engage in antisocial behaviors. However, in middle school, as more youth are exposed to others who use drugs and engage in antisocial behavior, their attitudes often shift toward greater acceptance of these behaviors. Youth who express positive attitudes toward drug use and antisocial behavior are more likely to engage in a variety of problem behaviors, including drug use.
Friends' Use of Drugs Young people who associate with peers who engage in alcohol or substance abuse are much more likely to engage in the same behavior. Peer drug use has consistently been found to be among the strongest predictors of substance use among youth. Even when young people come from well-managed families and do not experience other risk factors, spending time with friends who use drugs greatly increases the risk of that problem developing.
Interaction with Antisocial Peers
Young people who associate with peers who engage in problem behaviors are at higher risk for engaging in antisocial behavior themselves.
Perceived Risk of Drug Use Young people who do not perceive drug use to be risky are far more likely to engage in drug use. Rewards for Antisocial Behavior
Young people who receive rewards for their antisocial behavior are at higher risk for engaging further in antisocial behavior and substance use.
Rebelliousness Young people who do not feel part of society, are not bound by rules, don’t believe in trying to be successful or responsible, or who take an active rebellious stance toward society, are at higher risk of abusing drugs. In addition, high tolerance for deviance, a strong need for independence and normlessness have all been linked with drug use.
Sensation Seeking Young people who seek out opportunities for dangerous, risky behavior in general are at higher risk for participating in drug use and other problem behaviors.
Intention to Use ATODs Many prevention programs focus on reducing the intention of participants to use ATODs later in life. Reduction of intention to use ATODs often follows successful prevention interventions.
Depressive Symptoms Young people who are depressed are overrepresented in the criminal justice system and are more likely to use drugs. Survey research and other studies have shown a link between depression and other youth problem behaviors.
Gang Involvement Youth who belong to gangs are more at risk for antisocial behavior and drug use.
Peer-Individual Protective Factors Religiosity Young people who regularly attend religious services are less likely to engage in problem behaviors.
Social Skills Young people who are socially competent and engage in positive interpersonal relations with their peers are less likely to use drugs and engage in other problem behaviors.
Belief in the Moral Order Young people who have a belief in what is “right” or “wrong” are less likely to use drugs.
Prosocial Involvement Participation in positive school and community activities helps provide protection for youth.
Prosocial Norms Young people who view working hard in school and the community are less likely to engage in problem behavior.
Involvement with Prosocial Peers
Young people who associate with peers who engage in prosocial behavior are more protected from engaging in antisocial behavior and substance use.
17

Year Survey CompletedSchool 2002
School 2006
State 2006
School 2002
School 2006
State 2006
School 2002
School 2006
State 2006
Number of Youth 1003 1064 6207 1018 1083 6688 710 878 5684
Drug UsedSchool 2002
School 2006
State 2006
School 2002
School 2006
State 2006
School 2002
School 2006
State 2006
Alcohol 55.82 47.61 54.59 72.93 69.64 73.84 83.33 81.04 84.62Cigarettes 35.52 26.34 32.36 43.38 40.66 43.77 55.92 53.97 57.59Chewing Tobacco 7.53 4.68 11.40 14.77 13.79 22.84 21.64 27.69 31.77Marijuana 25.53 15.27 18.09 40.99 43.65 39.94 49.43 52.86 53.58Inhalants 15.76 14.44 15.49 11.64 12.98 13.02 9.17 9.68 11.48Hallucinogens 4.03 1.79 1.81 6.93 7.07 5.76 10.58 11.35 10.24Cocaine 3.11 1.68 1.72 4.14 4.50 3.92 8.17 8.70 8.51Stimulants 4.25 1.68 2.52 6.61 6.53 5.77 8.06 10.33 9.30Sedatives 2.64 0.49 1.14 2.08 3.52 2.59 3.39 4.38 4.16Opiates 8.66 7.95 9.73 13.55 16.04 15.81 15.25 20.71 18.98Ecstasy 4.78 1.79 2.05 5.06 4.04 3.71 7.36 7.25 5.16Any Drug 35.97 29.23 32.50 49.26 52.68 49.77 54.47 59.90 60.21
* not available, question not included in survey
Table 3. Number of Students Who Completed the Survey
Table 4. Percentage of Students Who Used ATODs During Their Lifetime
18

Drug UsedSchool 2002
School 2006
State 2006
School 2002
School 2006
State 2006
School 2002
School 2006
State 2006
Alcohol 25.00 17.40 24.16 45.28 43.88 46.18 54.34 53.17 60.46Cigarettes 10.26 7.45 10.78 18.39 15.49 18.74 22.30 24.66 28.14Chewing Tobacco 1.64 0.87 3.94 4.56 4.87 9.87 5.67 11.66 14.15Marijuana 12.94 6.44 8.01 25.62 21.16 20.54 26.03 26.75 26.16Inhalants 6.34 4.71 5.41 1.68 3.21 3.10 1.27 1.53 1.72Hallucinogens 1.41 0.50 0.83 2.47 1.57 1.73 1.83 3.10 2.47Cocaine 1.01 0.50 0.83 1.67 1.66 1.33 2.40 2.48 2.28Stimulants 1.81 0.50 0.89 2.86 1.86 1.85 2.68 4.84 3.10Sedatives 1.32 0.40 0.41 0.30 1.09 0.76 0.57 1.30 0.81Opiates 4.25 2.97 4.28 7.12 7.16 7.13 6.22 9.39 8.18Ecstasy 1.53 0.89 0.77 2.27 1.08 0.91 1.84 0.94 0.89Any Drug 20.68 13.55 15.89 31.77 28.22 27.12 30.47 33.54 32.00
Drug UsedSchool 2002
School 2006
State 2006
School 2002
School 2006
State 2006
School 2002
School 2006
State 2006
Binge Drinking 15.20 10.66 16.23 27.29 27.49 32.26 34.80 39.79 44.40Pack of Cigarettes per Day 0.51 0.10 0.43 1.59 0.93 1.15 2.27 3.33 2.93
BehaviorSchool 2002
School 2006
State 2006
School 2002
School 2006
State 2006
School 2002
School 2006
State 2006
Suspended from School 12.20 7.98 11.41 8.02 9.87 9.84 5.50 7.53 7.89Drunk or High at School 12.54 8.22 10.74 26.11 23.47 24.96 26.62 31.68 29.82Sold Illegal Drugs 6.34 2.60 3.54 11.25 11.16 9.82 10.70 11.26 11.40Stolen a Vehicle 4.22 3.15 4.28 3.05 4.50 4.03 1.41 1.96 1.75Been Arrested 7.65 6.56 6.62 9.19 9.15 8.92 6.78 6.23 8.40Attacked to Harm 14.16 14.31 14.80 8.52 14.61 14.37 6.07 9.76 11.19Carried a Handgun 4.81 6.48 8.11 5.82 5.07 7.44 3.24 5.52 7.61Handgun to School 0.30 0.67 0.84 0.69 1.32 1.07 0.14 0.69 0.89
* not available, question not included in survey
Table 7. Percentage of Students With Antisocial Behavior in the Past Year
Table 6. Percentage of Students With Heavy Use of Alcohol and Cigarettes
Table 5. Percentage of Students Who Used ATODs During the Past 30 Days
19

Risk FactorSchool 2002
School 2006
State 2006
School 2002
School 2006
State 2006
School 2002
School 2006
State 2006
Community DomainLow Neighborhood Attachment 35.86 32.15 33.84 40.06 36.22 39.73 42.73 37.09 41.80Community Disorganization 33.92 22.66 31.41 37.09 33.77 40.02 33.96 25.12 35.32Transitions & Mobility 42.16 43.91 44.54 41.53 46.73 49.13 40.06 41.84 45.54Laws & Norms Favor Drug Use 35.77 26.68 36.04 49.65 39.01 44.77 43.84 36.23 41.81Perceived Availability of Drugs 53.46 31.09 39.42 64.89 55.68 52.65 64.60 56.92 51.39Perceived Availability of Handguns 42.24 38.54 48.06 29.39 28.04 35.89 35.51 32.90 43.25Family DomainPoor Family Management 47.05 35.71 40.87 40.73 42.02 42.07 45.84 37.57 42.95Family Conflict 48.04 45.35 50.61 33.37 37.74 38.78 30.61 31.89 33.22Family History of Antisocial Behavior 42.45 33.69 41.57 39.02 39.03 43.04 36.44 35.86 40.47Parent Attitudes Favorable to ASB 45.47 46.97 53.85 48.68 55.12 57.03 43.58 49.64 56.12Parent Attitudes Favor Drug Use 32.66 26.80 34.13 47.36 48.20 51.96 48.41 51.31 54.61School DomainAcademic Failure 46.19 42.07 46.81 42.25 42.98 46.38 30.55 35.30 39.92Low Commitment to School 44.26 38.10 45.77 51.53 47.99 49.19 45.70 45.49 49.41Peer-Individual DomainRebelliousness 43.75 37.94 43.16 48.70 52.38 48.35 44.73 44.06 44.73Early Initiation of ASB 30.15 28.87 32.63 30.51 31.51 36.03 26.34 28.62 31.74Early Initiation of Drug Use 39.64 25.98 32.88 39.88 29.70 30.95 37.75 32.21 35.20Attitudes Favorable to ASB 40.76 35.59 43.30 50.20 51.55 51.80 41.41 43.50 49.22Attitudes Favorable to Drug Use 32.83 22.28 30.54 49.21 44.37 42.18 42.88 43.23 43.30Intention to Use ATODs 32.31 26.85 34.48 44.94 46.82 47.99 28.67 35.07 35.38Perceived Risk of Drug Use 35.87 32.42 38.84 42.76 40.68 39.21 46.10 45.39 46.65Interaction with Antisocial Peers 49.04 38.13 44.47 47.43 52.72 48.71 46.81 46.02 47.65Friend's Use of Drugs 46.81 31.78 41.07 48.91 46.22 44.60 42.25 41.62 40.46Sensation Seeking 61.28 66.60 66.94 57.75 66.51 65.08 50.78 60.55 63.60Rewards for ASB 47.22 39.80 49.62 48.66 52.84 52.90 55.76 67.46 66.50Depressive Symptoms 45.29 42.90 46.88 41.18 47.73 47.01 35.50 37.75 37.94
Table 8. Percentage of Students Reporting Risk
20

Protective FactorSchool 2002
School 2006
State 2006
School 2002
School 2006
State 2006
School 2002
School 2006
State 2006
Community DomainOpportunities for Prosocial Involvement 66.93 68.07 62.16 61.82 63.66 58.86 62.22 61.74 60.13Rewards for Prosocial Involvement 36.47 42.83 41.18 37.97 46.73 48.53 37.32 45.47 49.01Family DomainFamily Attachment 54.26 58.78 56.49 48.71 50.83 50.59 60.74 63.02 63.28Opportunities for Prosocial Involvement 61.58 69.25 63.87 57.82 57.67 57.30 56.39 60.54 60.10Rewards for Prosocial Involvement 60.99 70.80 65.21 54.15 57.83 56.55 54.26 60.31 58.48School DomainOpportunities for Prosocial Involvment 68.00 74.90 66.48 61.61 69.56 64.29 61.81 68.35 66.27Rewards for Prosocial Involvement 55.00 61.60 56.00 55.82 66.32 66.19 42.51 46.07 51.60Peer-Individual DomainReligiosity 60.39 62.62 54.66 56.27 54.42 48.01 73.02 78.53 72.75Social Skills 64.55 69.14 62.40 52.96 54.75 50.32 67.23 64.95 60.85Belief in the Moral Order 57.30 66.02 61.16 63.19 62.90 64.11 52.90 51.47 50.38Interaction with Prosocial Peers * 65.49 56.97 * 50.48 51.30 * 48.00 46.80Opportunities for Prosocial Involvement * 55.13 49.76 * 45.00 47.78 * 42.61 45.71Rewards for Prosocial Involvement * 69.95 63.51 * 54.89 57.32 * 47.44 49.14
* not available, question not included in survey
Table 9. Percentage of Students Reporting Protection
21

Contacts for Prevention
This Report Was Prepared for the Sample State by: Bach Harrison, L.L.C. Salt Lake City, UT 84102 116 S. 500 E. Salt Lake City, UT 84102 http://www.bach-harrison.com (801) 359-2064
R. Steven Harrison, Ph.D. Paris Bach-Harrison, B
Additional Information About the Sample State 2006 Bach Harrison Youth Survey The survey booklets were designed and scanned, the data analyzed, and the various reports produced by Bach Harrison, L.L.C., under contract with the Sample State, Division of Substance Abuse.
22
![BACH MAN - Интериор-И ООДinterior-i.bg/userfiles/editor/file/KONTAKTI[3].pdf · BACH MAN GERMAN DESIGN AWARD SPECIAL 2016 BACH MAN . BACH MAN BACH MAN 68,7 1392 103](https://img.pdfslide.us/doc/110x75/600386df3b10f646d72fb612/bach-man-interior-ibguserfileseditorfilekontakti3pdf.jpg)


![Johann Sebastian Bach BACH COLLEGIUM JAPAN …BIS-SACD-1981-booklet...Johann Sebastian Bach BACH COLLEGIUM JAPAN ... [Tromba da tirarsi in BWV140] ... ruft uns die Stimme. Bach Collegium](https://img.pdfslide.us/doc/110x75/5b18c8407f8b9a19258c1e2d/johann-sebastian-bach-bach-collegium-japan-bis-sacd-1981-bookletjohann-sebastian.jpg)