Embed Size (px)
Citation preview
Commercial-in-Confidence Report No. B1660A/017/LT February 2000
BABER BRIDGE HOUNSLOW A315
STRENGTHENING AND LOAD TESTING
London Borough Hounslow Environmental Services Department Civic Centre Lampton Road HOUNSLOW Middlesex TW3 4DN
London Borough Hounslow Environmental Services Department Civic Centre Lampton Road HOUNSLOW Middlesex TW3 4DN
Gifford and Partners Carlton House
Ringwood Road Woodlands
Southampton SO40 7HT
Commercial-in-Confidence
Revision Record
Rev. Date By Summary of Changes Chkd Aprvd
BABER BRIDGE HOUNSLOW A315
STRENGTHENING AND LOAD TESTING
CONTROLLED DOCUMENT
Gifford and Partners Document No: B1660A/017/LT
Status: Final Copy No:
Name Signature Date
Prepared by: G P Tilly
Checked: P A Jackson
Gifford Approved: G P Tilly
Client Accepted:
Baber Bridge Hounslow A315 Gifford and Partners Page i Report No. B1660A/017/LT Strengthening And Load Testing February 2000
BABER BRIDGE HOUNSLOW A315
STRENGTHENING AND LOAD TESTING
C O N T E N T S Page
1. INTRODUCTION ............................................................................................. 1
1.1 Background ................................................................................................ 1
1.2 The Bridge.................................................................................................. 2
2. STRENGTH ASSESSMENT ............................................................................ 4
2.1 Condition of the Arch Barrel....................................................................... 4
2.2 Location and Condition of Utilities ............................................................. 4
3. FINITE DISCRETE ELEMENT ANALYSIS.................................................. 6
3.1 Background ................................................................................................ 6
3.2 Verification of the Methods of Analysis...................................................... 6
4. STRENGTHENING SCHEME ........................................................................ 7
4.1 Analytical Model ........................................................................................ 7
4.2 Disposition of Reinforcement ..................................................................... 9
5. LOAD TESTING ............................................................................................. 11
5.1 Instrumentation......................................................................................... 12
5.2 Load Test Before Strengthening................................................................ 13
5.3 Load Test After Strengthening .................................................................. 15
6. CALCULATED RESPONSES TO LOAD ..................................................... 16
6.1 18 Tonne Load Test .................................................................................. 17
6.2 26 Tonne and 34 Tonne Load Tests .......................................................... 19
6.3 Smart Anchor ........................................................................................... 20
7. CONCLUSIONS.............................................................................................. 20
7.1 Design ...................................................................................................... 20
7.2 Load Tests ................................................................................................ 20
7.3 Smart Anchor ........................................................................................... 20
8. REFERENCES ................................................................................................ 21 APPENDIX A
APPENDIX B
Baber Bridge Hounslow A315 Gifford and Partners Page 1 Report No. B1660A/017/LT Strengthening And Load Testing February 2000
ABSTRACT Baber Bridge, a masonry arch carrying the A315 across the river Crane in Hounslow, was strengthened in December 1999 by the Archtec system. The Archtec system involves insertion of grouted stainless steel reinforcement in to the arch barrel. The strengthening was designed to increase the load carrying capacity by 60 per cent and enable the bridge to carry 40 tonne vehicles. On 14 December 1999, before strengthening, the bridge was load tested using a semi-trailer having a pair of close-spaced rear axles loaded to 18 tonne. After strengthening, on 12 January 2000, the bridge was again load tested. Comparisons of the responses confirmed that the strengthening had stiffened the bridge and reduced deflections by about 20 per cent. Measurements were also made under loads of 26 tonne and 34 tonne. Correlations between calculated and measured responses were very good.
1. INTRODUCTION
1.1 Background
The Environmental Services Department of The London Borough of Hounslow contracted Cintec International Ltd to strengthen Baber Bridge to a load carrying capacity of 40 tonne assessment live load. As part of the programme of work Gifford and Partners designed a strengthening scheme using Cintec anchors and carried out structural analyses before and after strengthening. The Transport Research Laboratory load tested the bridge, also before and after strengthening. Cintec were also asked to investigate the feasibility of strengthening the parapets to vehicle containment standard, and installing transverse tie-bars to restrain the spandrel walls. Schemes were prepared by Gifford and Partners but in the event did not proceed. The design to strengthen the parapet is outlined in Appendix A. Baber Bridge is located on the A315, a heavily trafficked two-lane single carriageway road. The bridge crosses the River Crane near to Feltham and south-east of London Heathrow Airport. The River Crane is normally slow moving and fairly shallow; at the time the site was inspected the depth was 0.5 to 1.0m. However, it is prone to rapid rises in level during storm conditions. The bed was fairly firm and composed of gravel and stones. There was no towpath or access beneath the bridge. In view of the heavy traffic on the A315, Cintec was instructed to work from beneath the bridge to avoid road closures.
Baber Bridge Hounslow A315 Gifford and Partners Page 2 Report No. B1660A/017/LT Strengthening And Load Testing February 2000
1.2 The Bridge
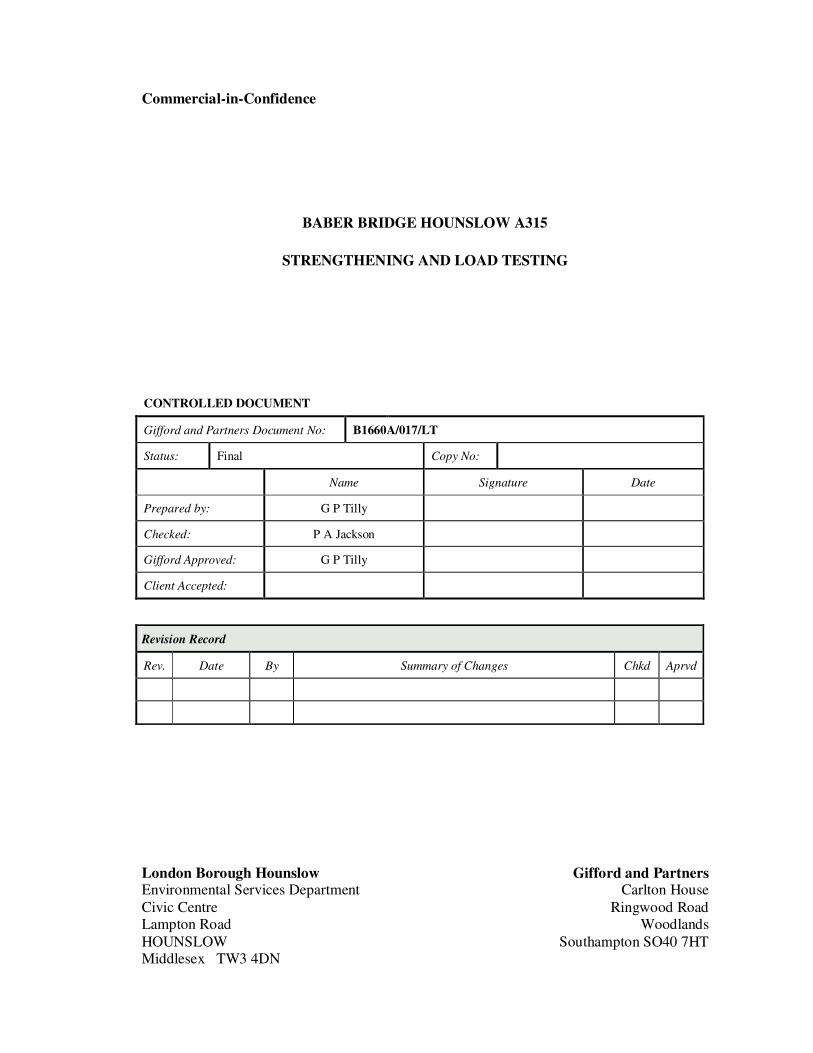
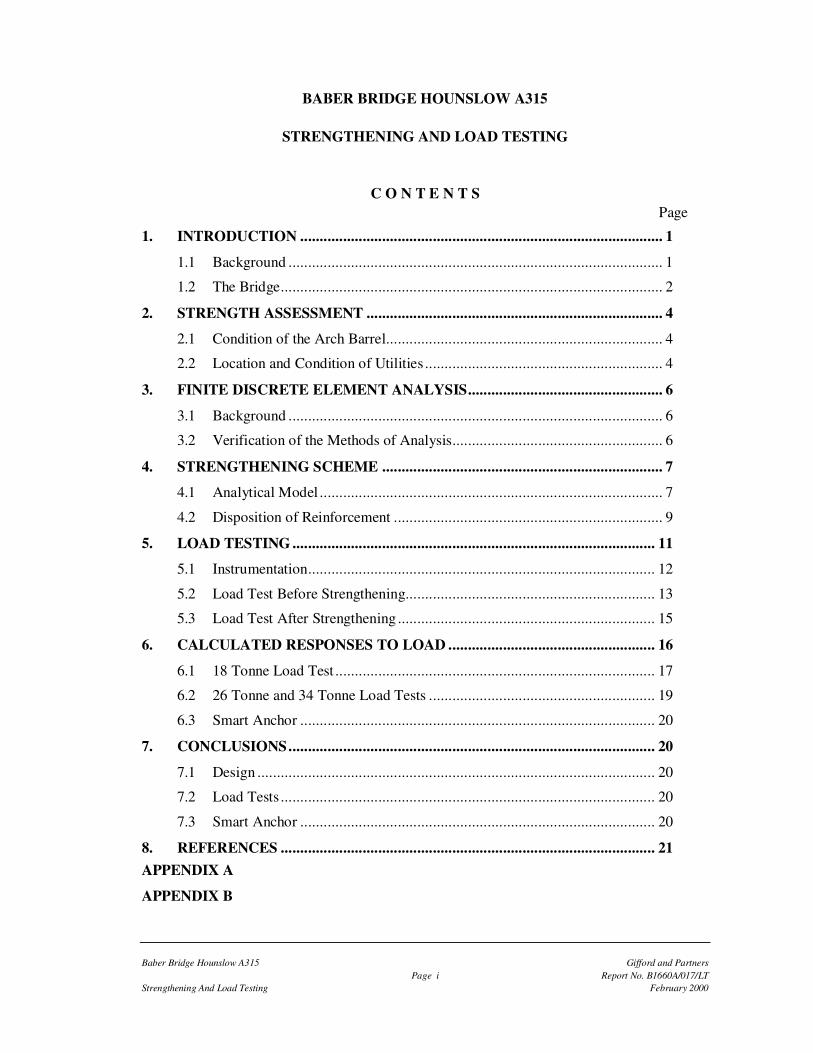
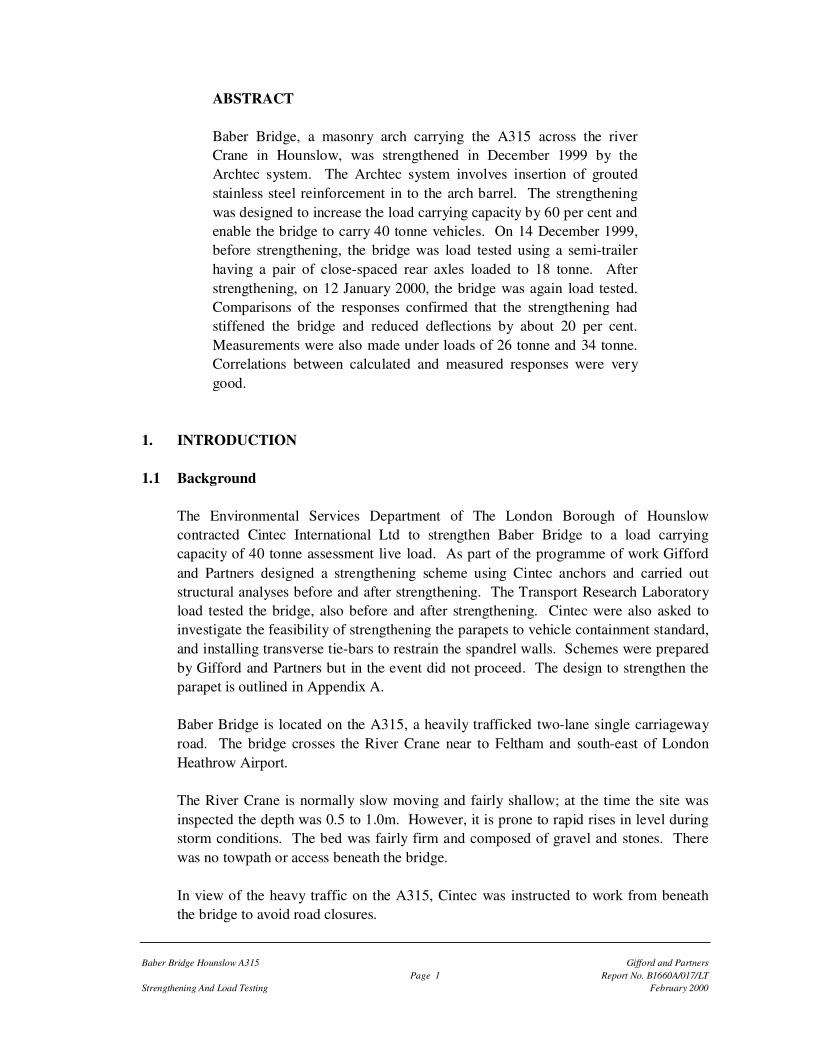
Baber Bridge is a single-span brick arch constructed circa 1798, having a span of 6.08m on the southern (downstream) side and 7.73m on the northern (upstream) side, see Figures 1 to 5. It was believed that it had been asymmetrically widened some time after original construction. On the south side there was a footpath with a raised kerb. The parapets were constructed in brick, uniform with the rest of the bridge. The intrados and southern elevation, up to the base of the parapet, had been gunited. The gunite exhibited fine map cracking which had initiated through shrinkage when it was originally placed. There was a longitudinal crack on the intrados indicating splitting between the spandrel and barrel. This is a fairly common occurrence and is not considered to be structurally significant. On occasions transverse tie-bars and pattress plates are often fitted to restrain outward movement of the spandrels. The exposed brickwork was soft and friable and this may have been the reason why the rest of the bridge had been gunited.
Figure 1 South Elevation Figure 2 North Elevation
Figure 3 Roadway
Baber Bridge Hounslow A315 Gifford and Partners Page 3 Report No. B1660A/017/LT Strengthening And Load Testing February 2000
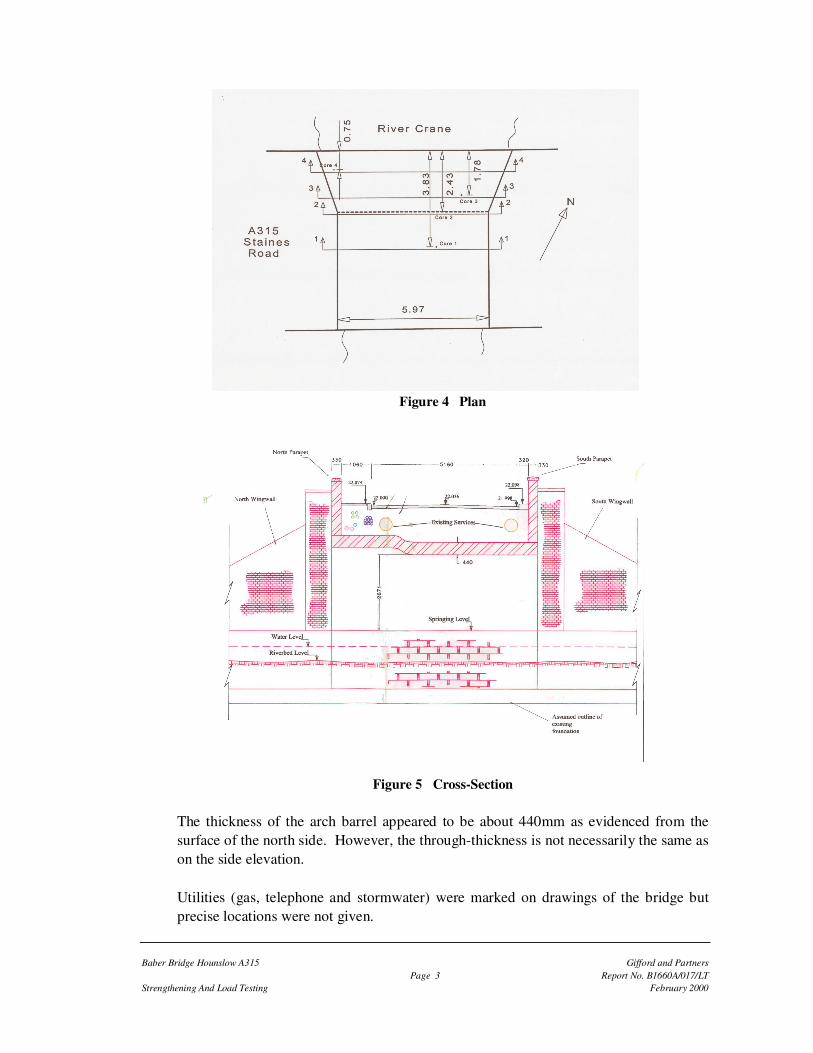
Figure 4 Plan
Figure 5 Cross-Section The thickness of the arch barrel appeared to be about 440mm as evidenced from the surface of the north side. However, the through-thickness is not necessarily the same as on the side elevation. Utilities (gas, telephone and stormwater) were marked on drawings of the bridge but precise locations were not given.

Baber Bridge Hounslow A315 Gifford and Partners Page 4 Report No. B1660A/017/LT Strengthening And Load Testing February 2000
2. STRENGTH ASSESSMENT The load carrying capacity had been previously assessed and found to be inadequate, using the MEXE method and the MAFEA program (Masonry Arch Finite Element Analysis). The Assessment Engineer considered the MEXE method to be the more meaningful in this instance. Bearing in mind the friable brickwork and the need for guniting, a condition factor of 0.6 was assigned. Gifford carried out further MEXE sensitivity analyses and confirmed that, with axle lift-off accounted, the strength is insufficient. As part of the design procedure towards strengthening the bridge, it was necessary to carry out a more comprehensive structural analysis using ELFEN (Welsh for element), a discrete element program. This was also required in support of the load tests to be carried out by TRL.
2.1 Condition of the Arch Barrel Investigative coring was carried out to provide information required for the ELFEN analyses: • thickness of the brick arch barrel • condition of the brick in the barrel • thickness of the gunite cover Messrs Castle and Prior carried out the work on 25 August 1999. Four 50mm diameter cores were drilled into the intrados and the results were as follows: • the brick barrel is a minimum 440mm thick • brickwork in the northern (upstream) section of the barrel is in good condition • brickwork in the southern (downstream) section is in poor condition • thickness of the gunite varies between 35mm and 55mm, it is reinforced with steel
wire mesh of 2mm diameter, and is in good condition The poor condition of the brickwork on the southern side of the bridge is consistent with the need to preserve and strengthen it with reinforced gunite.
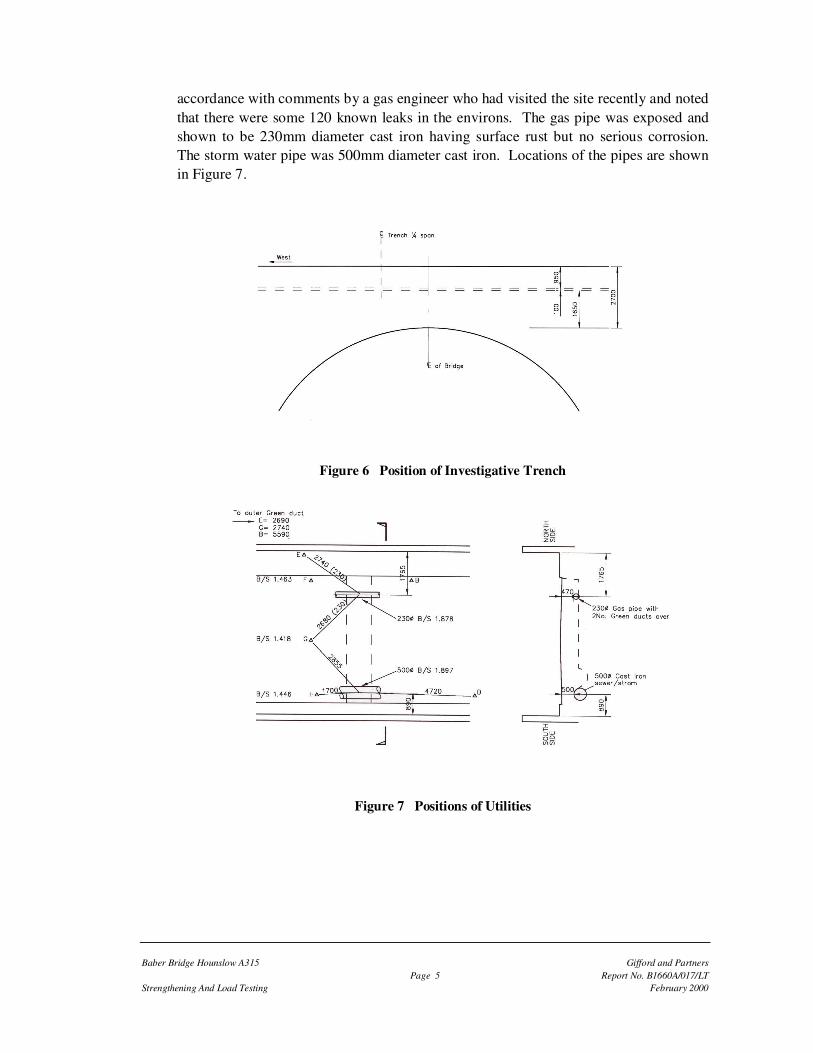
2.2 Location and Condition of Utilities A small trench was dug across the width of the bridge on the night of 13 December in order to determine the position of the utilities, and most importantly, gas and storm water pipes that could be damaged by injudicious load testing. The location of the trench is shown in Figure 6. Prior to digging, it was noted that there appeared to be a smell of gas and, as the trench was dug, the smell became stronger. This was in
Baber Bridge Hounslow A315 Gifford and Partners Page 5 Report No. B1660A/017/LT Strengthening And Load Testing February 2000
accordance with comments by a gas engineer who had visited the site recently and noted that there were some 120 known leaks in the environs. The gas pipe was exposed and shown to be 230mm diameter cast iron having surface rust but no serious corrosion. The storm water pipe was 500mm diameter cast iron. Locations of the pipes are shown in Figure 7.
Figure 6 Position of Investigative Trench
Figure 7 Positions of Utilities
Baber Bridge Hounslow A315 Gifford and Partners Page 6 Report No. B1660A/017/LT Strengthening And Load Testing February 2000
3. FINITE DISCRETE ELEMENT ANALYSIS 3.1 Background
The origins of the discrete element technique can be traced back to the late 1960s when it was developed to investigate the behaviour of jointed rock. Later improvements included the introduction of deformable behaviour and more recently work has concentrated on improved physical models and better computational efficiency. The computer program ELFEN by Rockfield Software Ltd at The University of Wales, Swansea, represents the state of the art in this technology. Gifford and Partners exclusively use ELFEN, the only industrial quality finite discrete element package in the construction industry. The finite discrete element method is well suited to simulation of non-homogenised continua such as masonry, concrete and soil. By representing separate parts that can deform and interact with each other, highly dynamic and non-linear systems, both in two-dimension and three-dimension, can be modelled more simply at a fundamental level. Many thousands of parts can be represented each with prescribed friction/contact laws at their boundaries. The capability to evolve further parts by fracturing into separate fragments is also possible by using limiting tension non-linear material models and advanced mesh adaptivity schemes. Efficient solvers based on explicit dynamic algorithms enable many classes of problem to be solved that would be near impossible by conventional analysis. Typical applications include.
• Numerical simulation of masonry used for buildings and bridges under dynamic
and static loads. Considerable experience has been gained in seismic, blast and ultimate static strength applications.
• Numerical modelling of vehicle impact with experience gained in crashing of light
passenger vehicles and the simulation of major vessel collision protection systems. • The prediction of the ultimate strength of complex reinforced concrete assemblies
in bridges. 3.2 Verification of the Methods of Analysis
In view of the fact that the ELFEN structural analysis is in advance of the state-of-the-art represented in current standards and other programs, it was verified against full-scale tests on Torksey Bridge and laboratory large scale model tests conducted by TRL1,2,3. Torksey Bridge was located across a drainage channel near the village of Torksey, Lincs. It had a span of 4.9m and was constructed in brick. The arch barrel was composed of three rings. The spandrels were disconnected from the barrel by wide cracks so that behaviour could be approximated to two-dimensional. In November
Baber Bridge Hounslow A315 Gifford and Partners Page 7 Report No. B1660A/017/LT Strengthening And Load Testing February 2000
1996, it was tested to collapse using a transverse line load at the quarter-span3. The collapse load was 109 tonne compared with a calculated value, using ELFEN, of 108 tonne. A full-scale model brick arch, very similar to Torksey Bridge, was constructed in the TRL laboratory2. The arch barrel was composed of three rings of brick, the rings being separated by layers of sand so that they were not bonded together. This represents the commonly found fault in arch barrels of ring separation. The arch was 5m span, 1.25m rise at mid-span and 2m wide. There were no spandrels but, instead, steel containment walls, not connected to the arch barrel, enable fill to be placed and compacted in the normal way. This generated a two-dimensional structural action similar to that at Torksey. Loading was by a hydraulic jack positioned on a transverse beam so that a nominal line load was applied across the top of the model bridge at its quarter-point. Loading was applied in increments of 1.0 tonne. When the response became significantly non-linear, the control was changed to deflection. This enabled the load-deflection characteristics to be fully investigated and the collapse mechanism to be observed beyond maximum load. The model bridge failed at a load of 20 tonne compared with the calculated value of 18.6 tonne. An identical model arch was constructed in the laboratory using the same formwork and lime-based mortar. The same bricklayer was employed to ensure the same quality of construction. The model was strengthened using eight Cintec anchors positioned longitudinally in the arch ring and tangential to the curvature. The work was carried out from the top of the arch. Loading was applied in the same way as for the un-strengthened arch. Failure occurred at 41 tonne, an increase in strength of over 100 per cent.
4. STRENGTHENING SCHEME
4.1 Analytical Model The bridge structure, including the brick barrel, abutments, fill and Cintec anchors, was analysed using the Archtec version of ELFEN. A two-dimensional plane strain model was written to meet the requirements of Baber Bridge and the general modelling procedures developed by Gifford for analyses of masonry structures were followed.
Baber Bridge Hounslow A315 Gifford and Partners Page 8 Report No. B1660A/017/LT Strengthening And Load Testing February 2000
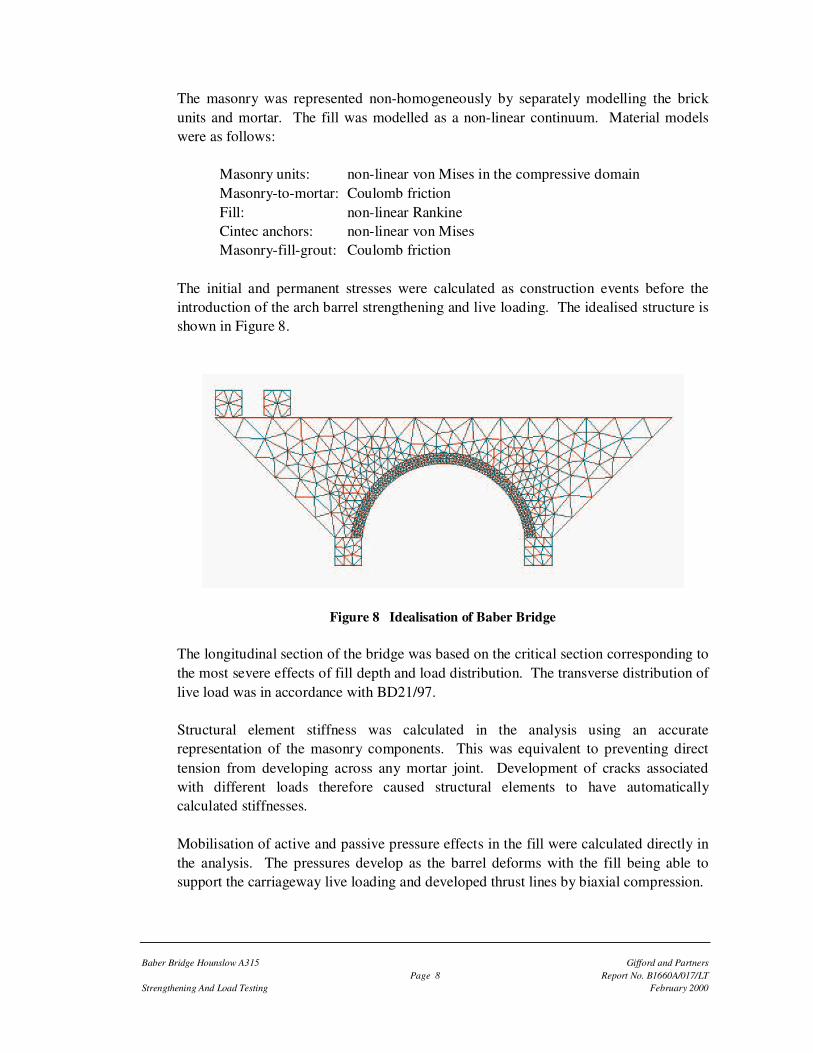
The masonry was represented non-homogeneously by separately modelling the brick units and mortar. The fill was modelled as a non-linear continuum. Material models were as follows: Masonry units: non-linear von Mises in the compressive domain Masonry-to-mortar: Coulomb friction Fill: non-linear Rankine Cintec anchors: non-linear von Mises Masonry-fill-grout: Coulomb friction The initial and permanent stresses were calculated as construction events before the introduction of the arch barrel strengthening and live loading. The idealised structure is shown in Figure 8.
Figure 8 Idealisation of Baber Bridge
The longitudinal section of the bridge was based on the critical section corresponding to the most severe effects of fill depth and load distribution. The transverse distribution of live load was in accordance with BD21/97. Structural element stiffness was calculated in the analysis using an accurate representation of the masonry components. This was equivalent to preventing direct tension from developing across any mortar joint. Development of cracks associated with different loads therefore caused structural elements to have automatically calculated stiffnesses. Mobilisation of active and passive pressure effects in the fill were calculated directly in the analysis. The pressures develop as the barrel deforms with the fill being able to support the carriageway live loading and developed thrust lines by biaxial compression.
Baber Bridge Hounslow A315 Gifford and Partners Page 9 Report No. B1660A/017/LT Strengthening And Load Testing February 2000
Material properties adopted for the analysis were as follows: Masonry type: brick Mortar: 1:3 lime/sand Characteristic strength: 2.3N/mm2
For Cintec anchors: Reinforcement type: Stainless steel Type 2 ribbed Characteristic strength: 490N/mm2
Grout/masonry ultimate shear strength: 1.8N/mm2
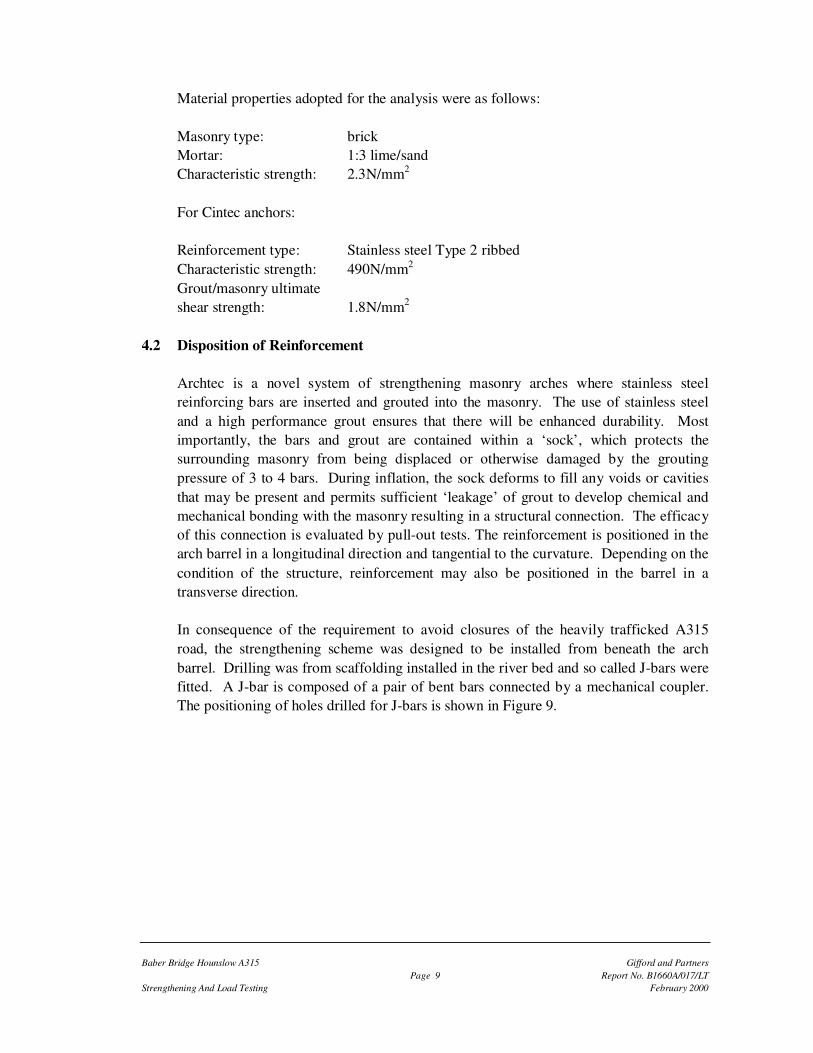
4.2 Disposition of Reinforcement Archtec is a novel system of strengthening masonry arches where stainless steel reinforcing bars are inserted and grouted into the masonry. The use of stainless steel and a high performance grout ensures that there will be enhanced durability. Most importantly, the bars and grout are contained within a ‘sock’, which protects the surrounding masonry from being displaced or otherwise damaged by the grouting pressure of 3 to 4 bars. During inflation, the sock deforms to fill any voids or cavities that may be present and permits sufficient ‘leakage’ of grout to develop chemical and mechanical bonding with the masonry resulting in a structural connection. The efficacy of this connection is evaluated by pull-out tests. The reinforcement is positioned in the arch barrel in a longitudinal direction and tangential to the curvature. Depending on the condition of the structure, reinforcement may also be positioned in the barrel in a transverse direction. In consequence of the requirement to avoid closures of the heavily trafficked A315 road, the strengthening scheme was designed to be installed from beneath the arch barrel. Drilling was from scaffolding installed in the river bed and so called J-bars were fitted. A J-bar is composed of a pair of bent bars connected by a mechanical coupler. The positioning of holes drilled for J-bars is shown in Figure 9.
Baber Bridge Hounslow A315 Gifford and Partners Page 10 Report No. B1660A/017/LT Strengthening And Load Testing February 2000
Figure 9 J-bar Detail
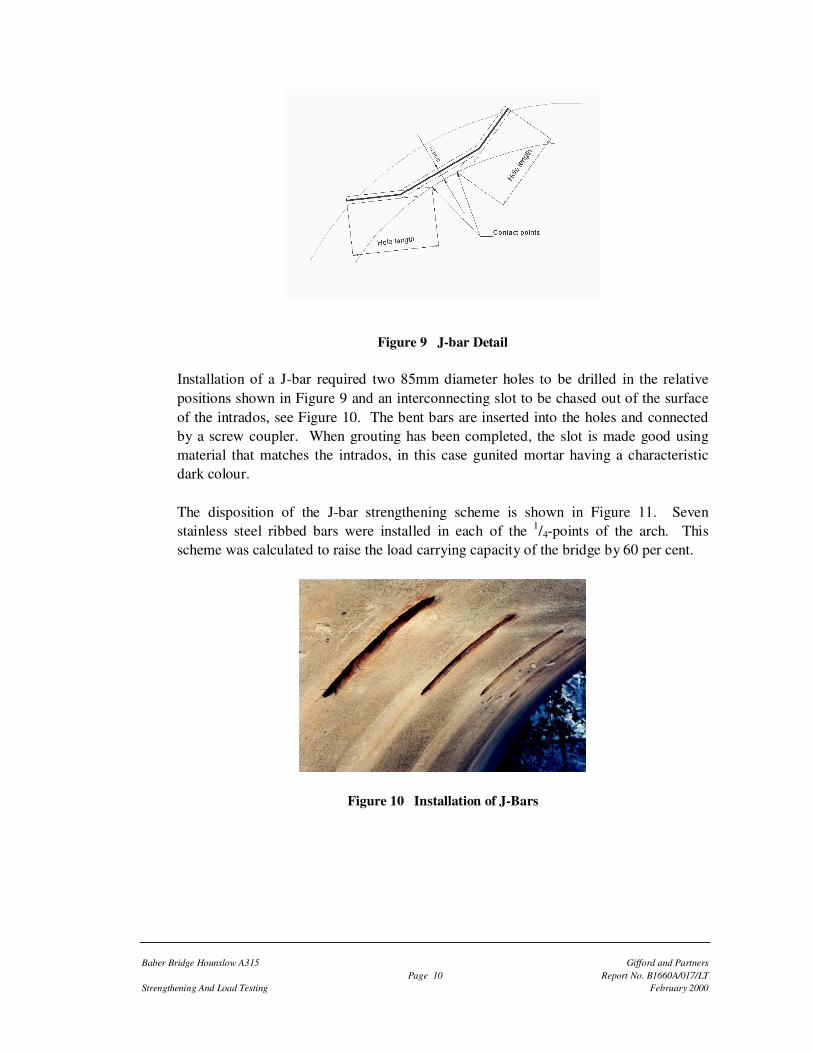
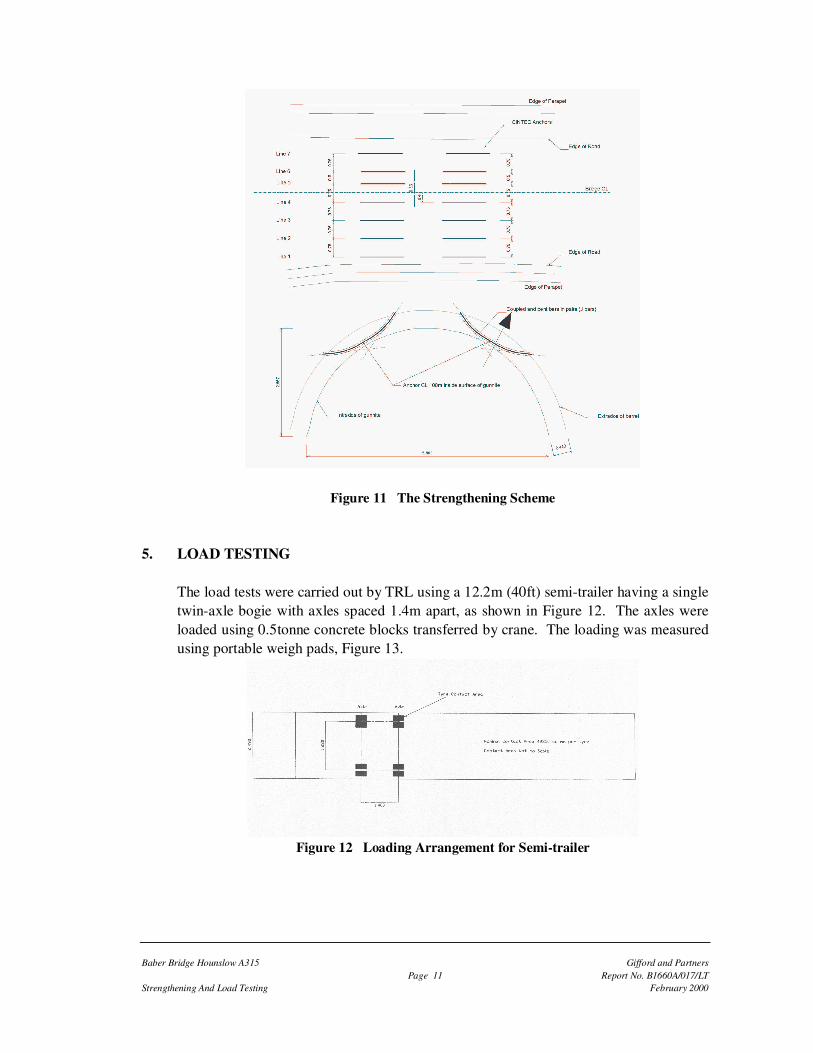
Installation of a J-bar required two 85mm diameter holes to be drilled in the relative positions shown in Figure 9 and an interconnecting slot to be chased out of the surface of the intrados, see Figure 10. The bent bars are inserted into the holes and connected by a screw coupler. When grouting has been completed, the slot is made good using material that matches the intrados, in this case gunited mortar having a characteristic dark colour. The disposition of the J-bar strengthening scheme is shown in Figure 11. Seven stainless steel ribbed bars were installed in each of the 1/4-points of the arch. This scheme was calculated to raise the load carrying capacity of the bridge by 60 per cent.
Figure 10 Installation of J-Bars
Baber Bridge Hounslow A315 Gifford and Partners Page 11 Report No. B1660A/017/LT Strengthening And Load Testing February 2000
Figure 11 The Strengthening Scheme
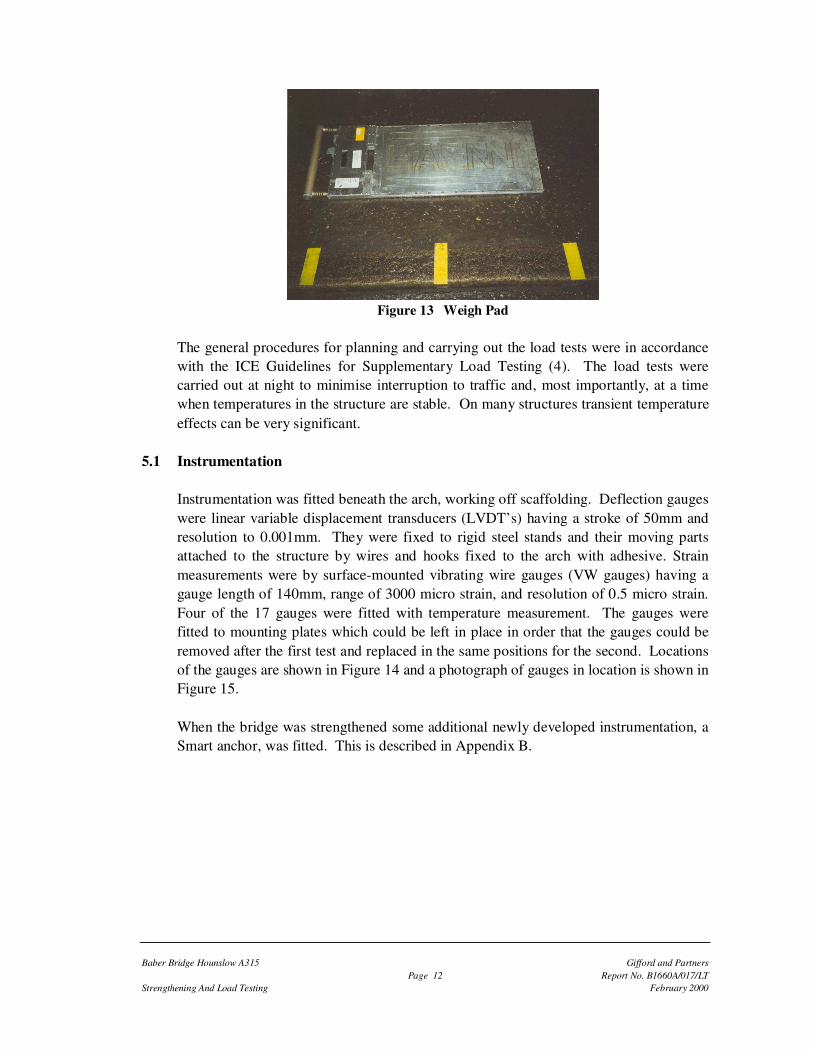
5. LOAD TESTING The load tests were carried out by TRL using a 12.2m (40ft) semi-trailer having a single twin-axle bogie with axles spaced 1.4m apart, as shown in Figure 12. The axles were loaded using 0.5tonne concrete blocks transferred by crane. The loading was measured using portable weigh pads, Figure 13.
Figure 12 Loading Arrangement for Semi-trailer
Baber Bridge Hounslow A315 Gifford and Partners Page 12 Report No. B1660A/017/LT Strengthening And Load Testing February 2000
Figure 13 Weigh Pad
The general procedures for planning and carrying out the load tests were in accordance with the ICE Guidelines for Supplementary Load Testing (4). The load tests were carried out at night to minimise interruption to traffic and, most importantly, at a time when temperatures in the structure are stable. On many structures transient temperature effects can be very significant.
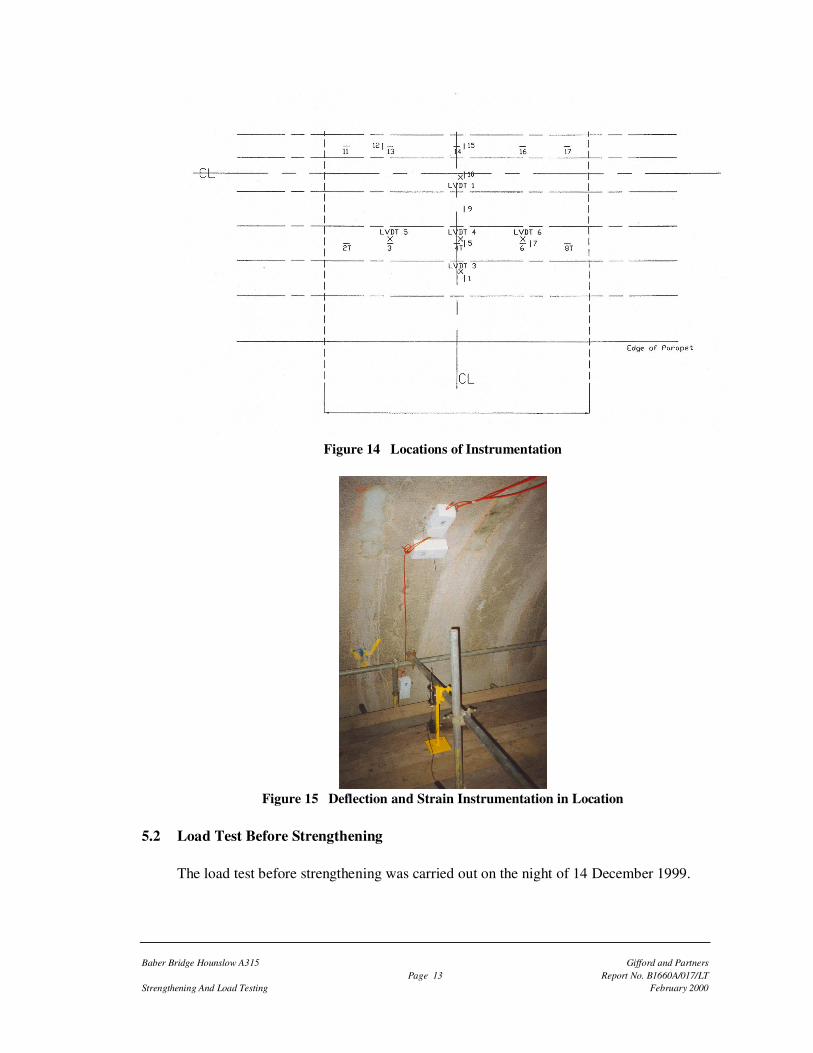
5.1 Instrumentation Instrumentation was fitted beneath the arch, working off scaffolding. Deflection gauges were linear variable displacement transducers (LVDT’s) having a stroke of 50mm and resolution to 0.001mm. They were fixed to rigid steel stands and their moving parts attached to the structure by wires and hooks fixed to the arch with adhesive. Strain measurements were by surface-mounted vibrating wire gauges (VW gauges) having a gauge length of 140mm, range of 3000 micro strain, and resolution of 0.5 micro strain. Four of the 17 gauges were fitted with temperature measurement. The gauges were fitted to mounting plates which could be left in place in order that the gauges could be removed after the first test and replaced in the same positions for the second. Locations of the gauges are shown in Figure 14 and a photograph of gauges in location is shown in Figure 15. When the bridge was strengthened some additional newly developed instrumentation, a Smart anchor, was fitted. This is described in Appendix B.
Baber Bridge Hounslow A315 Gifford and Partners Page 13 Report No. B1660A/017/LT Strengthening And Load Testing February 2000
Figure 14 Locations of Instrumentation
Figure 15 Deflection and Strain Instrumentation in Location
5.2 Load Test Before Strengthening
The load test before strengthening was carried out on the night of 14 December 1999.
Baber Bridge Hounslow A315 Gifford and Partners Page 14 Report No. B1660A/017/LT Strengthening And Load Testing February 2000
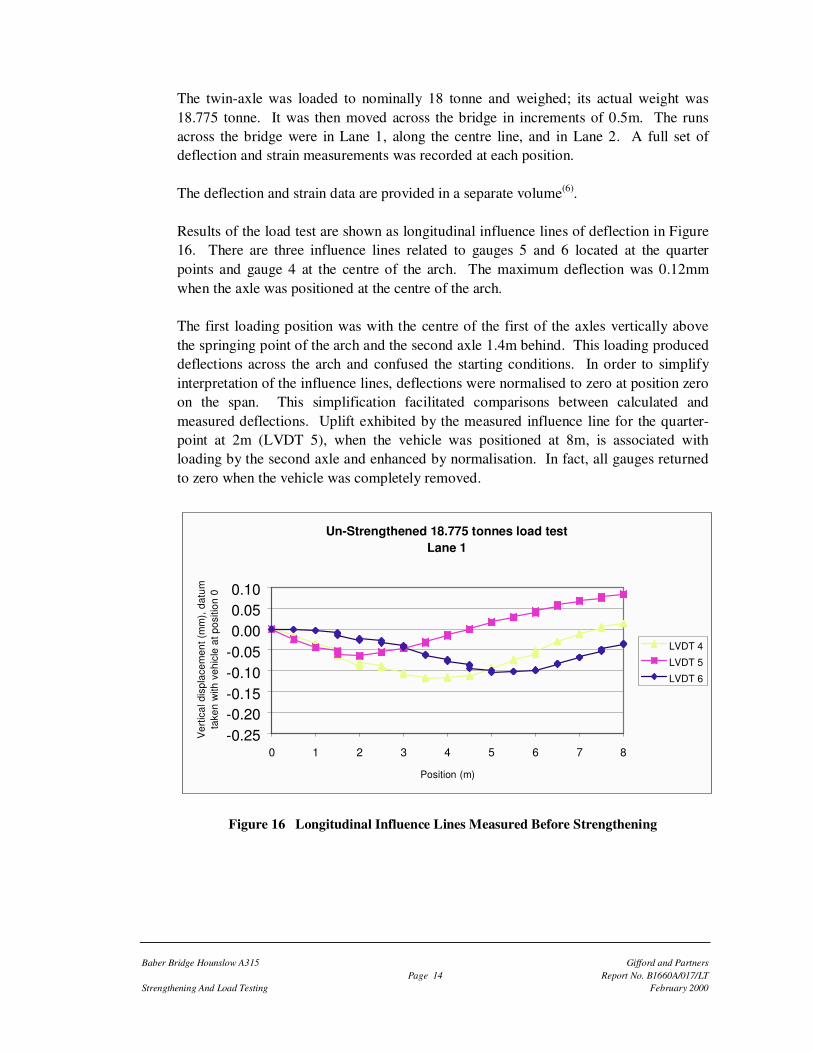
The twin-axle was loaded to nominally 18 tonne and weighed; its actual weight was 18.775 tonne. It was then moved across the bridge in increments of 0.5m. The runs across the bridge were in Lane 1, along the centre line, and in Lane 2. A full set of deflection and strain measurements was recorded at each position. The deflection and strain data are provided in a separate volume(6). Results of the load test are shown as longitudinal influence lines of deflection in Figure 16. There are three influence lines related to gauges 5 and 6 located at the quarter points and gauge 4 at the centre of the arch. The maximum deflection was 0.12mm when the axle was positioned at the centre of the arch. The first loading position was with the centre of the first of the axles vertically above the springing point of the arch and the second axle 1.4m behind. This loading produced deflections across the arch and confused the starting conditions. In order to simplify interpretation of the influence lines, deflections were normalised to zero at position zero on the span. This simplification facilitated comparisons between calculated and measured deflections. Uplift exhibited by the measured influence line for the quarter-point at 2m (LVDT 5), when the vehicle was positioned at 8m, is associated with loading by the second axle and enhanced by normalisation. In fact, all gauges returned to zero when the vehicle was completely removed.
Un-Strengthened 18.775 tonnes load testLane 1
-0.25-0.20-0.15-0.10-0.050.000.050.10
0 1 2 3 4 5 6 7 8
Position (m)
Ver
tical
dis
plac
emen
t (m
m),
dat
um
take
n w
ith v
ehic
le a
t pos
ition
0
LVDT 4
LVDT 5
LVDT 6
Figure 16 Longitudinal Influence Lines Measured Before Strengthening
Baber Bridge Hounslow A315 Gifford and Partners Page 15 Report No. B1660A/017/LT Strengthening And Load Testing February 2000
Strengthened 18.775 tonnes load test resultsLane 1
-0.20
-0.15
-0.10
-0.05
0.00
0.05
0.10
0.15
0.20
0 1 2 3 4 5 6 7 8
Position (m)
Ver
tical
dis
plac
emen
t(m
m),
dat
um ta
ken
with
veh
icle
at p
ositi
on 0
LVDT4
LVDT5
LVDT6
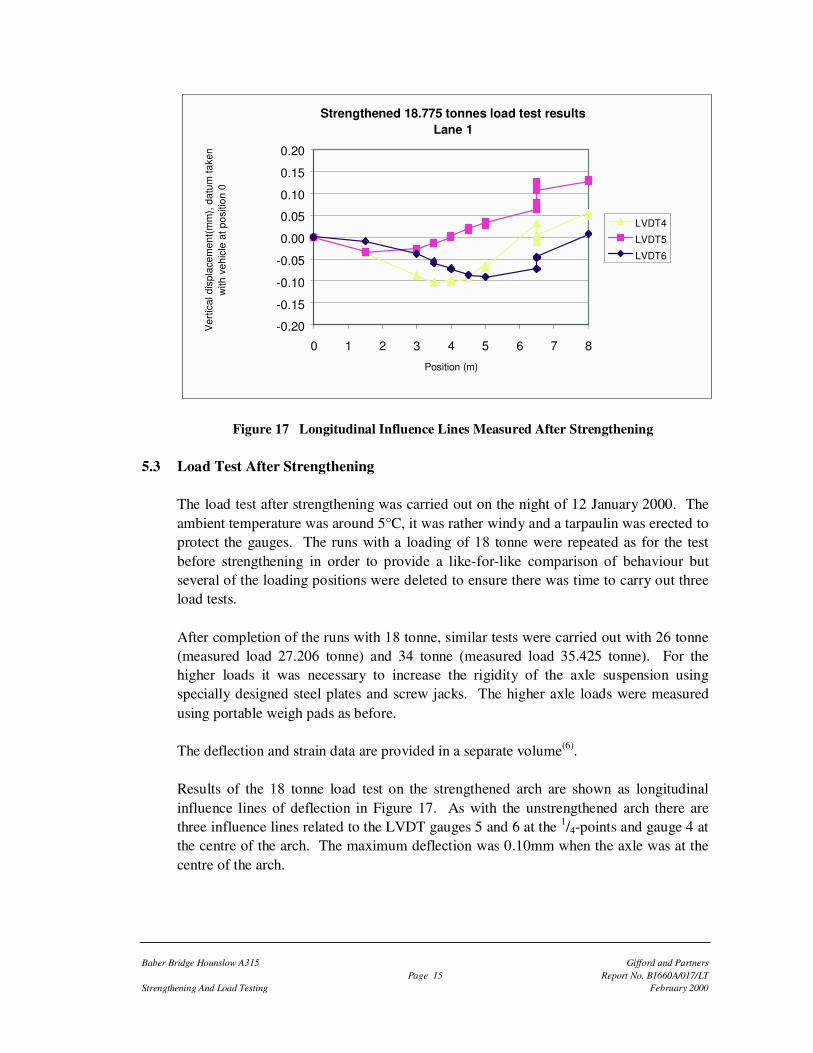
Figure 17 Longitudinal Influence Lines Measured After Strengthening
5.3 Load Test After Strengthening
The load test after strengthening was carried out on the night of 12 January 2000. The ambient temperature was around 5°C, it was rather windy and a tarpaulin was erected to protect the gauges. The runs with a loading of 18 tonne were repeated as for the test before strengthening in order to provide a like-for-like comparison of behaviour but several of the loading positions were deleted to ensure there was time to carry out three load tests. After completion of the runs with 18 tonne, similar tests were carried out with 26 tonne (measured load 27.206 tonne) and 34 tonne (measured load 35.425 tonne). For the higher loads it was necessary to increase the rigidity of the axle suspension using specially designed steel plates and screw jacks. The higher axle loads were measured using portable weigh pads as before. The deflection and strain data are provided in a separate volume(6). Results of the 18 tonne load test on the strengthened arch are shown as longitudinal influence lines of deflection in Figure 17. As with the unstrengthened arch there are three influence lines related to the LVDT gauges 5 and 6 at the 1/4-points and gauge 4 at the centre of the arch. The maximum deflection was 0.10mm when the axle was at the centre of the arch.
Baber Bridge Hounslow A315 Gifford and Partners Page 16 Report No. B1660A/017/LT Strengthening And Load Testing February 2000
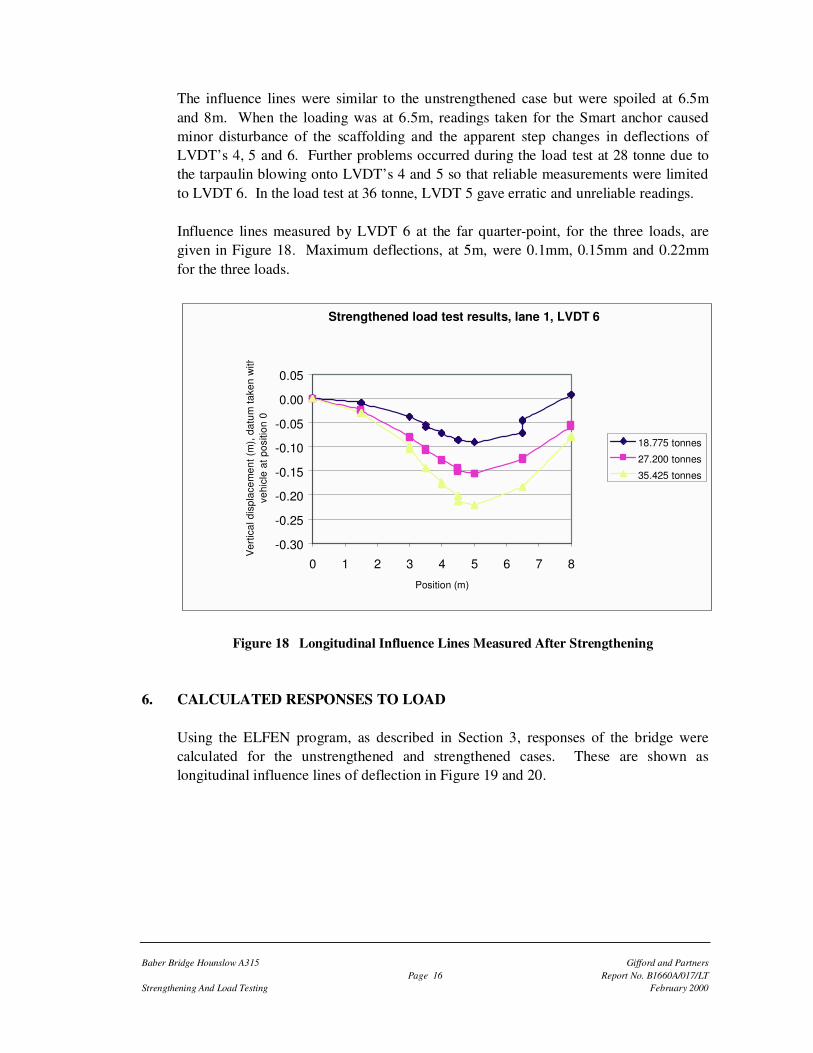
The influence lines were similar to the unstrengthened case but were spoiled at 6.5m and 8m. When the loading was at 6.5m, readings taken for the Smart anchor caused minor disturbance of the scaffolding and the apparent step changes in deflections of LVDT’s 4, 5 and 6. Further problems occurred during the load test at 28 tonne due to the tarpaulin blowing onto LVDT’s 4 and 5 so that reliable measurements were limited to LVDT 6. In the load test at 36 tonne, LVDT 5 gave erratic and unreliable readings. Influence lines measured by LVDT 6 at the far quarter-point, for the three loads, are given in Figure 18. Maximum deflections, at 5m, were 0.1mm, 0.15mm and 0.22mm for the three loads.
Strengthened load test results, lane 1, LVDT 6
-0.30
-0.25
-0.20
-0.15
-0.10
-0.05
0.00
0.05
0 1 2 3 4 5 6 7 8
Position (m)
Ver
tical
dis
plac
emen
t (m
), d
atum
take
n w
ith
vehi
cle
at p
ositi
on 0
18.775 tonnes
27.200 tonnes
35.425 tonnes
Figure 18 Longitudinal Influence Lines Measured After Strengthening
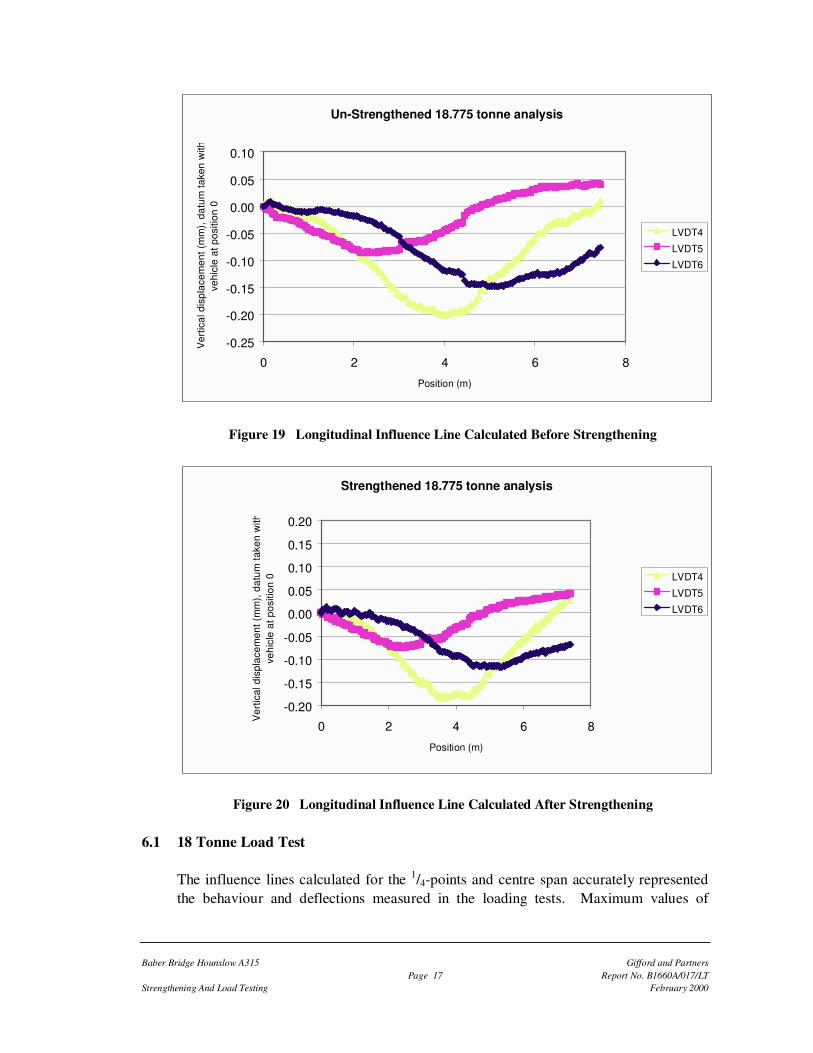
6. CALCULATED RESPONSES TO LOAD Using the ELFEN program, as described in Section 3, responses of the bridge were calculated for the unstrengthened and strengthened cases. These are shown as longitudinal influence lines of deflection in Figure 19 and 20.
Baber Bridge Hounslow A315 Gifford and Partners Page 17 Report No. B1660A/017/LT Strengthening And Load Testing February 2000
Un-Strengthened 18.775 tonne analysis
-0.25
-0.20
-0.15
-0.10
-0.05
0.00
0.05
0.10
0 2 4 6 8
Position (m)
Ver
tical
dis
plac
emen
t (m
m),
dat
um ta
ken
with
ve
hicl
e at
pos
ition
0
LVDT4
LVDT5
LVDT6
Figure 19 Longitudinal Influence Line Calculated Before Strengthening
Strengthened 18.775 tonne analysis
-0.20
-0.15
-0.10
-0.05
0.00
0.05
0.10
0.15
0.20
0 2 4 6 8
Position (m)
Ver
tical
dis
plac
emen
t (m
m),
dat
um ta
ken
with
ve
hicl
e at
pos
ition
0 LVDT4
LVDT5
LVDT6
Figure 20 Longitudinal Influence Line Calculated After Strengthening
6.1 18 Tonne Load Test
The influence lines calculated for the 1/4-points and centre span accurately represented the behaviour and deflections measured in the loading tests. Maximum values of
Baber Bridge Hounslow A315 Gifford and Partners Page 18 Report No. B1660A/017/LT Strengthening And Load Testing February 2000
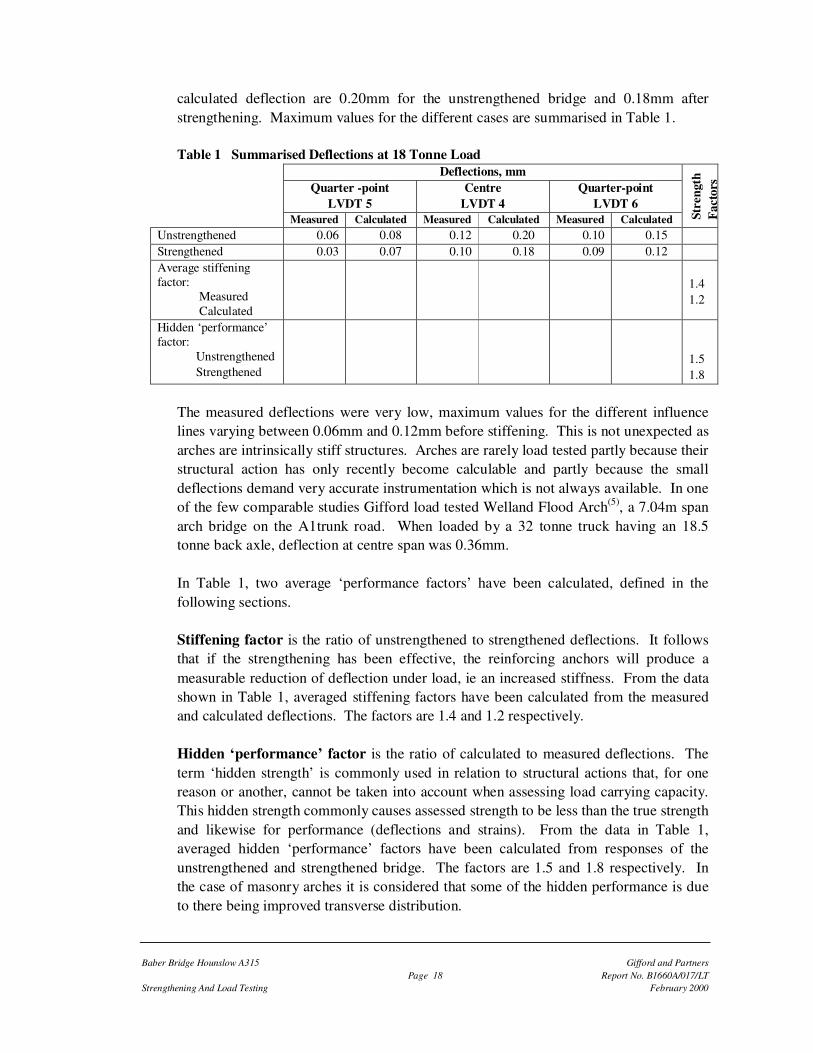
calculated deflection are 0.20mm for the unstrengthened bridge and 0.18mm after strengthening. Maximum values for the different cases are summarised in Table 1. Table 1 Summarised Deflections at 18 Tonne Load
Deflections, mm Quarter -point
LVDT 5 Centre
LVDT 4 Quarter-point
LVDT 6 Measured Calculated Measured Calculated Measured Calculated St
reng
th
Fact
ors
Unstrengthened 0.06 0.08 0.12 0.20 0.10 0.15 Strengthened 0.03 0.07 0.10 0.18 0.09 0.12 Average stiffening factor: Measured Calculated
1.4 1.2
Hidden ‘performance’ factor: Unstrengthened Strengthened
1.5 1.8
The measured deflections were very low, maximum values for the different influence lines varying between 0.06mm and 0.12mm before stiffening. This is not unexpected as arches are intrinsically stiff structures. Arches are rarely load tested partly because their structural action has only recently become calculable and partly because the small deflections demand very accurate instrumentation which is not always available. In one of the few comparable studies Gifford load tested Welland Flood Arch(5), a 7.04m span arch bridge on the A1trunk road. When loaded by a 32 tonne truck having an 18.5 tonne back axle, deflection at centre span was 0.36mm. In Table 1, two average ‘performance factors’ have been calculated, defined in the following sections. Stiffening factor is the ratio of unstrengthened to strengthened deflections. It follows that if the strengthening has been effective, the reinforcing anchors will produce a measurable reduction of deflection under load, ie an increased stiffness. From the data shown in Table 1, averaged stiffening factors have been calculated from the measured and calculated deflections. The factors are 1.4 and 1.2 respectively. Hidden ‘performance’ factor is the ratio of calculated to measured deflections. The term ‘hidden strength’ is commonly used in relation to structural actions that, for one reason or another, cannot be taken into account when assessing load carrying capacity. This hidden strength commonly causes assessed strength to be less than the true strength and likewise for performance (deflections and strains). From the data in Table 1, averaged hidden ‘performance’ factors have been calculated from responses of the unstrengthened and strengthened bridge. The factors are 1.5 and 1.8 respectively. In the case of masonry arches it is considered that some of the hidden performance is due to there being improved transverse distribution.

Baber Bridge Hounslow A315 Gifford and Partners Page 19 Report No. B1660A/017/LT Strengthening And Load Testing February 2000
6.2 26 Tonne and 34 Tonne Load Tests
The calculated influence lines for the higher loads are shown in Figure 21. As for the 18 tonne test, the calculated influence lines accurately represented the behaviour and deflections measured in the loading tests.
Strengthened load test results, lane 1, LVDT 6
-0.30
-0.25
-0.20
-0.15
-0.10
-0.05
0.00
0.05
0 1 2 3 4 5 6 7 8
Position (m)
Ver
tical
dis
plac
emen
t (m
), d
atum
take
n w
ith
vehi
cle
at p
ositi
on 0
18.775 tonnes
27.200 tonnes
35.425 tonnes
Figure 21 Longitudinal Influence Lines Calculated After Strengthening
Maximum deflections at the 6m quarter-point (LVDT6) are compared with the measured values in Table 2. Table 2 Summarised Deflections at 18, 26 and 34 Tonne
Nominal Load, tonne 18 26 34 Measured load, tonne 18.775 27.200 35.425 Measured deflection (LVDT6), mm 0.10 0.15 0.22 Calculated deflection, mm 0.12 0.18 0.25
The designed increase in ultimate capacity of the bridge was 60 per cent. This bears a sensible relationship to the stiffening factors which indicate increases in stiffness of 20 per cent calculated and 40 per cent measured. The designed action of the anchors is to strengthen against the formation of hinges near to the 1/4-points. Increased stiffness, although a secondary issue, is a useful indication that the anchors are effective.
Baber Bridge Hounslow A315 Gifford and Partners Page 20 Report No. B1660A/017/LT Strengthening And Load Testing February 2000
6.3 Smart Anchor Measurements from the prototype Smart anchor (Appendix B) indicate that the J-bars attracted stress and acted compositely with the structure of the arch barrel. This is reassuring as it confirms that grouting of the anchor has successfully connected it to the brickwork.
7. CONCLUSIONS
7.1 Design (i) A scheme to strengthen the masonry parapets of Baber Bridge to P2 containment
was successfully designed, Appendix A. In the event it was not implemented. (ii) Archtec strengthening was designed and installed to raise the load carrying
capacity by 60 per cent. The strengthening and performance of the bridge were calculated using the ELFEN program.
7.2 Load Tests
(i) Supplementary load tests were carried out before strengthening using a semi-
trailer having a twin-axle close spaced bogey loaded to 18 tonne. The maximum measured vertical deflection was 0.12mm at centre span.
(ii) Load tests were also carried out after strengthening. Under the 18 tonne axle load, the maximum deflection was 0.10mm at centre span, 20 per cent less than unstrengthened.
(iii) Calculated deflections under 18, 26 and 34 tonne nominal axle loads correlated very well with measured values. The calculated values were consistently higher than measured and responses were essentially linear.
(iv) Responses calculated using the ELFEN program correctly predicted the shapes of the influence lines and provided deflections that were consistently greater than the measured values. This is encouraging as it indicates a degree of conservatism in the analysis and design.
(v) Under the 18 tonne axle load, average stiffening factors were found to be 1.2 calculated and 1.4 measured. Average hidden ‘performance’ factors were 1.5 unstrengthened and 1.8 strengthened.
7.3 Smart Anchor
(i) A prototype Smart anchor was installed as part of the strengthening. The load
tests confirmed that it attracted stress and acted compositely with the arch barrel.
Baber Bridge Hounslow A315 Gifford and Partners Page 21 Report No. B1660A/017/LT Strengthening And Load Testing February 2000
8. REFERENCES
1. J Page, A Guide to Repair and Strengthening Techniques for Brick and Stone Masonry Arch Bridges. TRL Contractor Report 284, Crowthorne, 1996
2. S K Sumon and N Ricketts, Strengthening of Masonry Arch Bridges. Chapter in Arch Bridges. Publ Thomas Telford, London, 1995
3. J Page. Load Tests to Collapse on Two Arch Bridges at Torksey and Shinafoot. TRL Research Report 159, Crowthorne, 1988
4. The Institution of Civil Engineer. Guidelines for the Supplementary Load Testing of Bridges. Publ Thomas Telford, 1998.
5. S Mehrkar-Asl. Load Testing of Welland Flood Arch No. 2. Unpublished Report, 1999. 6. Baber Bridge Hounslow A315. Strengthening and Load Testing. Appendix C Test Data
1999.
Baber Bridge Hounslow A315 Gifford and Partners Page A1 Report No. B1660A/017/LT Strengthening And Load Testing February 2000
APPENDIX A
DESIGN OF PARAPET STRENGTHENING
Baber Bridge Hounslow A315 Gifford and Partners Page A2 Report No. B1660A/017/LT Strengthening And Load Testing February 2000
In the meeting held on 18 November 1999 at Hounslow it was agreed that Gifford and Partners would investigate strengthening the parapets to vehicle containment standards. On investigation it was found that this would have required largely rebuilding them, partly in order to achieve the required high strength but also because of the geometric requirements. The P6 standard requires a height of 1.5m which is well in excess of the present height. A further problem with the P6 standard was the requirement for progressively increasing strength. This aims to make the fixings stronger than the parapet and the structure supporting the parapet stronger than the fixings to ensure that failure of the parapet does not lead to major damage to the bridge. This would have required major strengthening works to the bridge itself which was not considered viable. It was therefore decided to consider strengthening to P2 standards. A strengthening scheme was devised based on BD 52/93 requirements for in situ reinforced concrete P2 parapets. Because of the differences between existing masonry and new concrete construction, it was not possible to follow all the detailed requirements of the standard. The strengthening was, however, designed to achieve the strength specified by the standard. This was achieved by designing Cintec anchors to enable the masonry wall to act as a reinforced masonry wall. Because the wall is substantially thicker than a conventional concrete P2 parapet, it was possible to achieve the strength under reversed moments which the standard would require, without providing anchors on both faces. This was done by placing the anchors further from the tension face than normal, enabling them to resist moments in either direction. The design called for 16 mm high yield vertical ties at 1m centres and for two 12mm longitudinal ties. It was not possible to prove that the connection between the spandrel walls and the rest of the bridge was strong enough to resist the forces imposed by the design impact with the parapet. Also, the design described above assumes that the parapets are fixed at a point reasonably close below the carriageway surface. If the parapet was fixed at a lower position, more vertical anchors would be required. It was therefore necessary to design additional transverse ties to hold the parapet in place. 16mm high yield ties at 2m centres provided the required strength. In the event, it was decided not to proceed with parapet strengthening and the design work was therefore abortive.
Baber Bridge Hounslow A315 Gifford and Partners Page B1 Report No. B1660A/017/LT Strengthening And Load Testing February 2000
APPENDIX B
SMART ANCHOR
Baber Bridge Hounslow A315 Gifford and Partners Page B2 Report No. B1660A/017/LT Strengthening And Load Testing February 2000
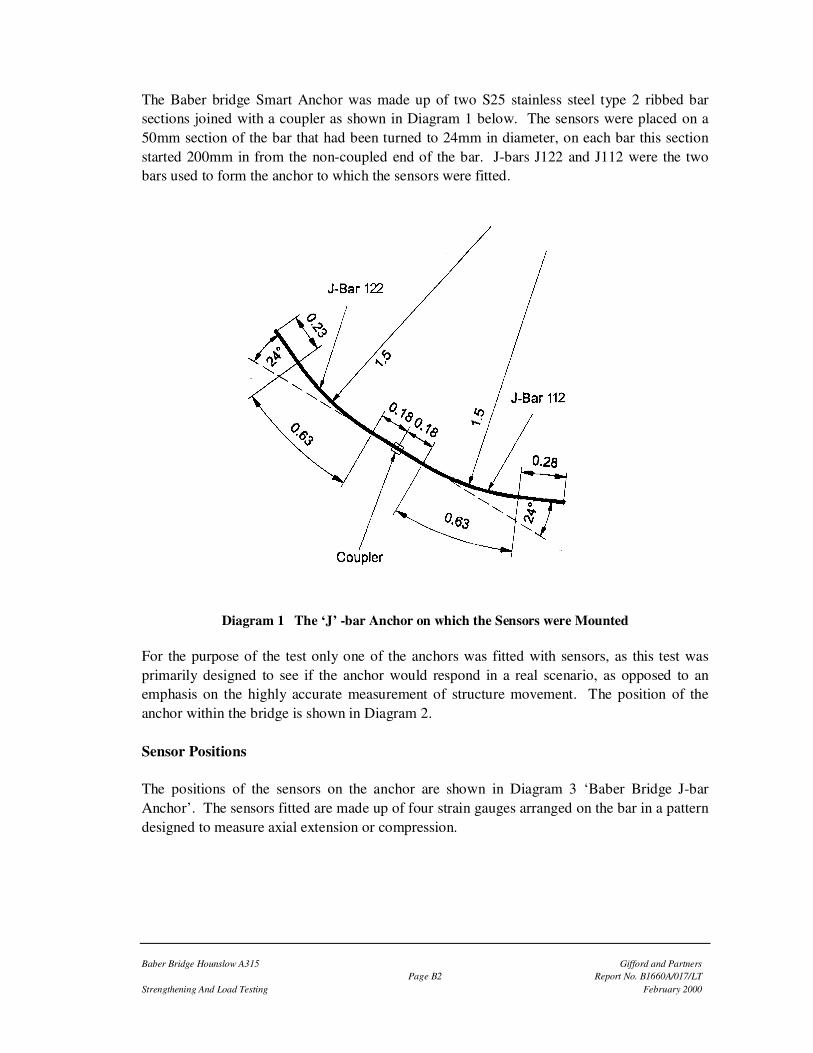
The Baber bridge Smart Anchor was made up of two S25 stainless steel type 2 ribbed bar sections joined with a coupler as shown in Diagram 1 below. The sensors were placed on a 50mm section of the bar that had been turned to 24mm in diameter, on each bar this section started 200mm in from the non-coupled end of the bar. J-bars J122 and J112 were the two bars used to form the anchor to which the sensors were fitted.
Diagram 1 The ‘J’ -bar Anchor on which the Sensors were Mounted
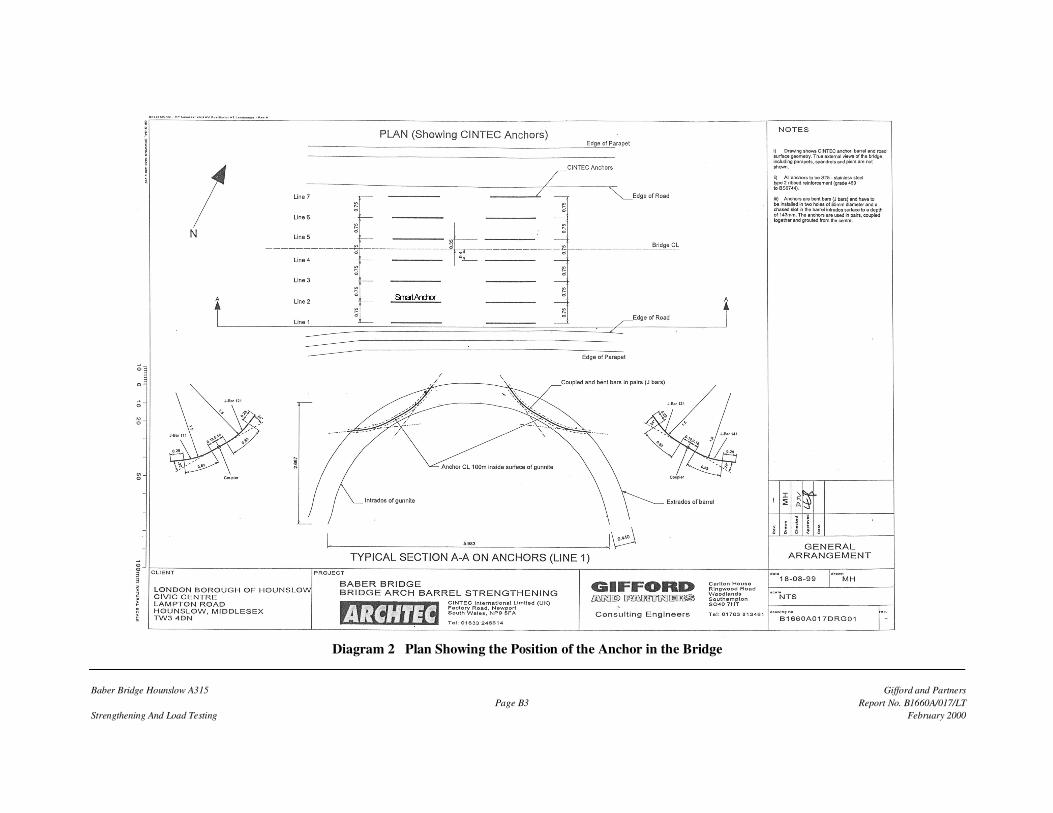
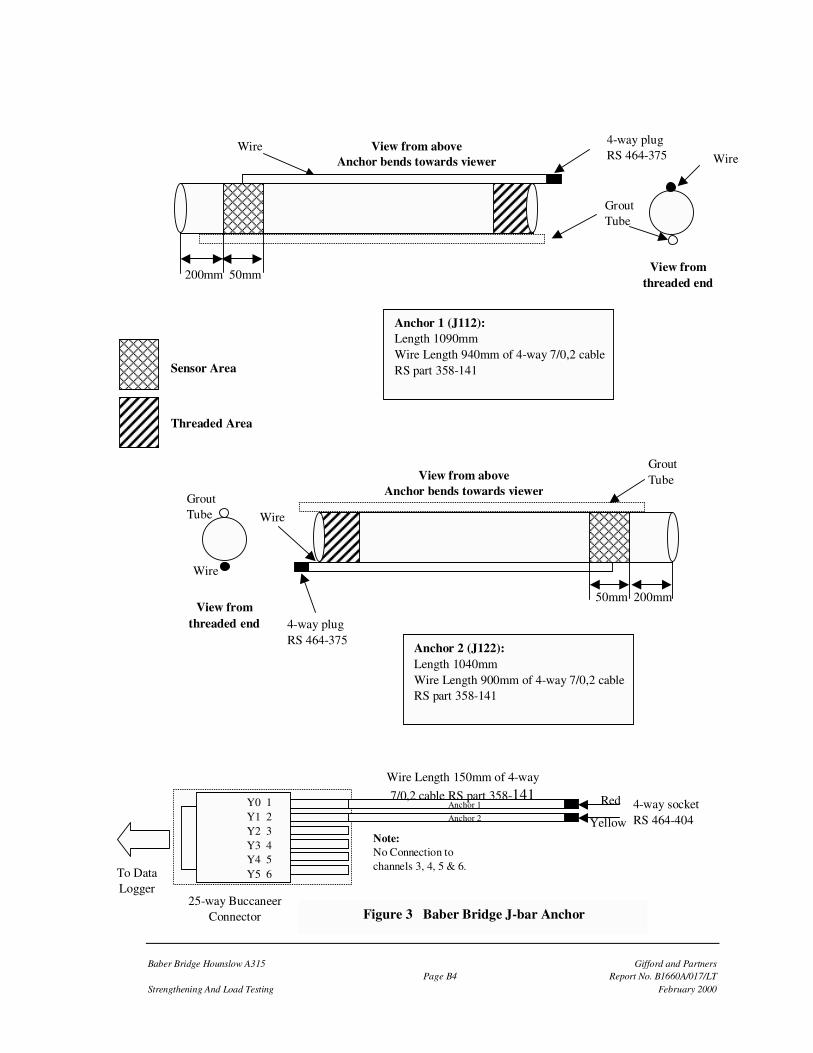
For the purpose of the test only one of the anchors was fitted with sensors, as this test was primarily designed to see if the anchor would respond in a real scenario, as opposed to an emphasis on the highly accurate measurement of structure movement. The position of the anchor within the bridge is shown in Diagram 2. Sensor Positions The positions of the sensors on the anchor are shown in Diagram 3 ‘Baber Bridge J-bar Anchor’. The sensors fitted are made up of four strain gauges arranged on the bar in a pattern designed to measure axial extension or compression.
Baber Bridge Hounslow A315 Gifford and Partners Page B3 Report No. B1660A/017/LT Strengthening And Load Testing February 2000
Diagram 2 Plan Showing the Position of the Anchor in the Bridge

Baber Bridge Hounslow A315 Gifford and Partners Page B4 Report No. B1660A/017/LT Strengthening And Load Testing February 2000
Wire
Grout Tube
Anchor 1 (J112): Length 1090mm Wire Length 940mm of 4-way 7/0,2 cable RS part 358-141
Sensor Area
Threaded Area
Wire
4-way plug RS 464-375
View from threaded end
View from above Anchor bends towards viewer
200mm 50mm
Wire
Anchor 2 (J122): Length 1040mm Wire Length 900mm of 4-way 7/0,2 cable RS part 358-141
Y0 1 Y1 2 Y2 3 Y3 4 Y4 5 Y5 6
25-way Buccaneer Connector
4-way socket RS 464-404
Wire Length 150mm of 4-way 7/0,2 cable RS part 358-141
Note: No Connection to channels 3, 4, 5 & 6. To Data
Logger
Grout Tube
Wire Grout Tube
4-way plug RS 464-375
View from threaded end
View from above Anchor bends towards viewer
50mm 200mm
Anchor 1
Anchor 2
Red
Yellow
Figure 3 Baber Bridge J-bar Anchor
Baber Bridge Hounslow A315 Gifford and Partners Page B5 Report No. B1660A/017/LT Strengthening And Load Testing February 2000
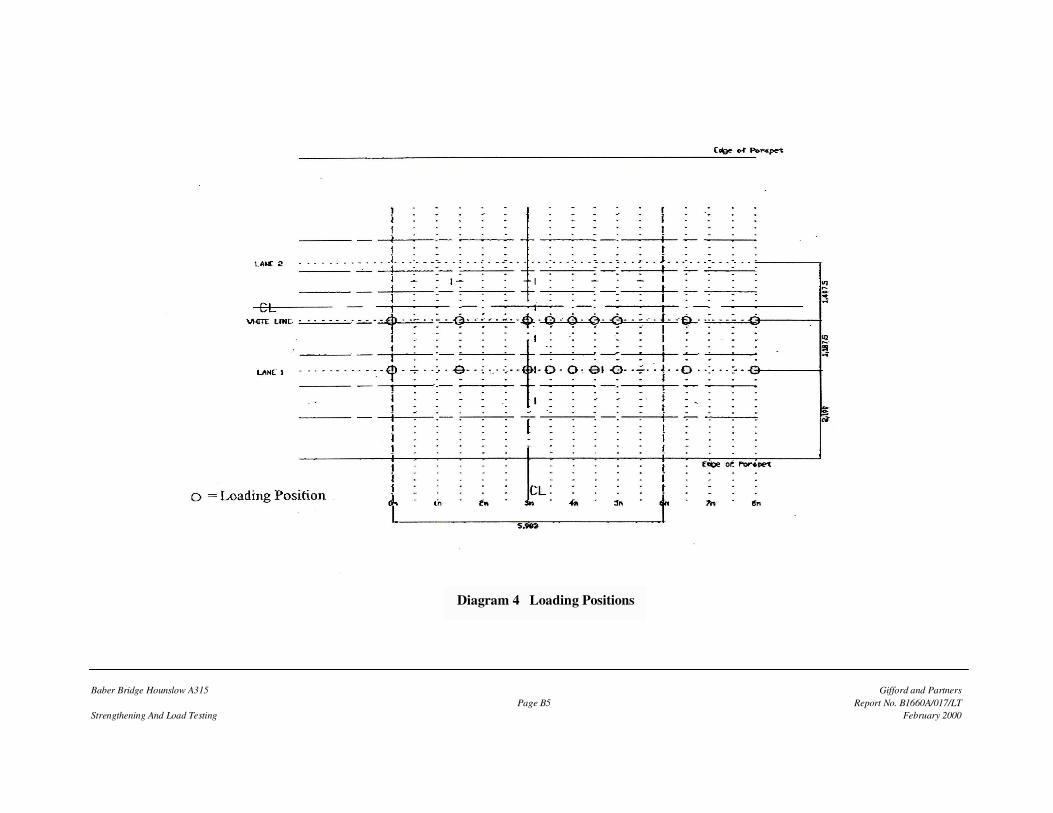
Diagram 4 Loading Positions
Baber Bridge Hounslow A315 Gifford and Partners Page B6 Report No. B1660A/017/LT Strengthening And Load Testing February 2000
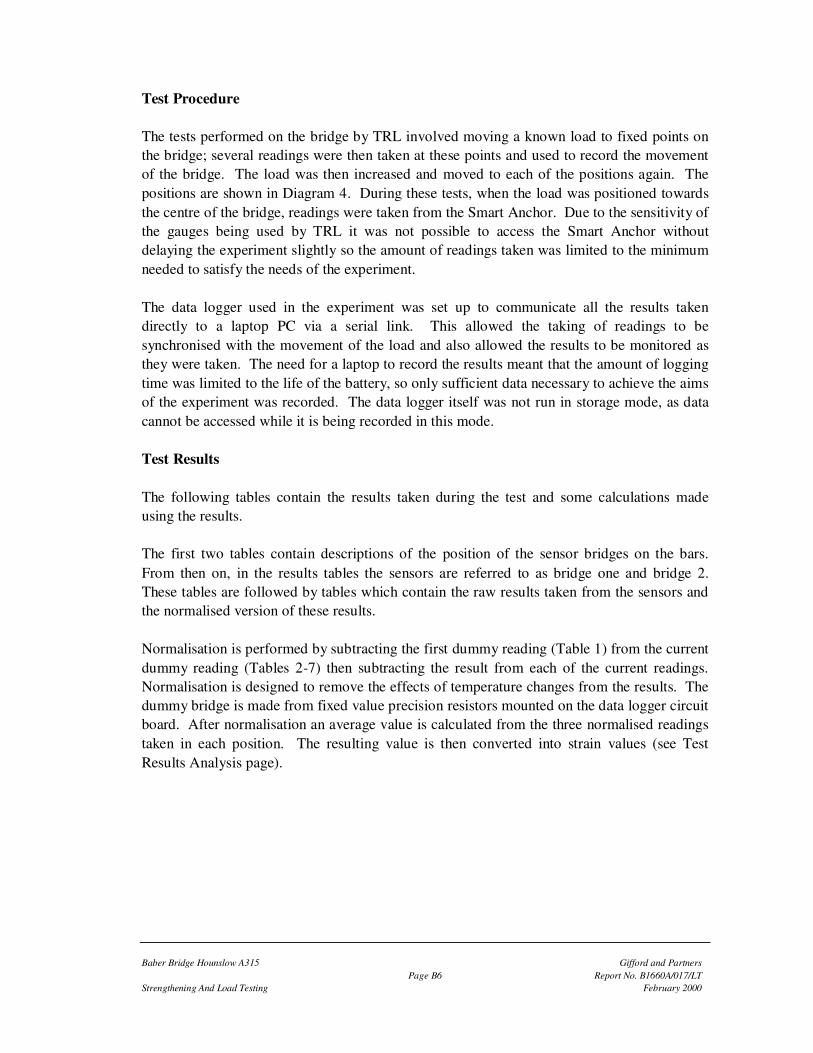
Test Procedure The tests performed on the bridge by TRL involved moving a known load to fixed points on the bridge; several readings were then taken at these points and used to record the movement of the bridge. The load was then increased and moved to each of the positions again. The positions are shown in Diagram 4. During these tests, when the load was positioned towards the centre of the bridge, readings were taken from the Smart Anchor. Due to the sensitivity of the gauges being used by TRL it was not possible to access the Smart Anchor without delaying the experiment slightly so the amount of readings taken was limited to the minimum needed to satisfy the needs of the experiment. The data logger used in the experiment was set up to communicate all the results taken directly to a laptop PC via a serial link. This allowed the taking of readings to be synchronised with the movement of the load and also allowed the results to be monitored as they were taken. The need for a laptop to record the results meant that the amount of logging time was limited to the life of the battery, so only sufficient data necessary to achieve the aims of the experiment was recorded. The data logger itself was not run in storage mode, as data cannot be accessed while it is being recorded in this mode. Test Results The following tables contain the results taken during the test and some calculations made using the results. The first two tables contain descriptions of the position of the sensor bridges on the bars. From then on, in the results tables the sensors are referred to as bridge one and bridge 2. These tables are followed by tables which contain the raw results taken from the sensors and the normalised version of these results. Normalisation is performed by subtracting the first dummy reading (Table 1) from the current dummy reading (Tables 2-7) then subtracting the result from each of the current readings. Normalisation is designed to remove the effects of temperature changes from the results. The dummy bridge is made from fixed value precision resistors mounted on the data logger circuit board. After normalisation an average value is calculated from the three normalised readings taken in each position. The resulting value is then converted into strain values (see Test Results Analysis page).
Baber Bridge Hounslow A315 Gifford and Partners Page B7 Report No. B1660A/017/LT Strengthening And Load Testing February 2000
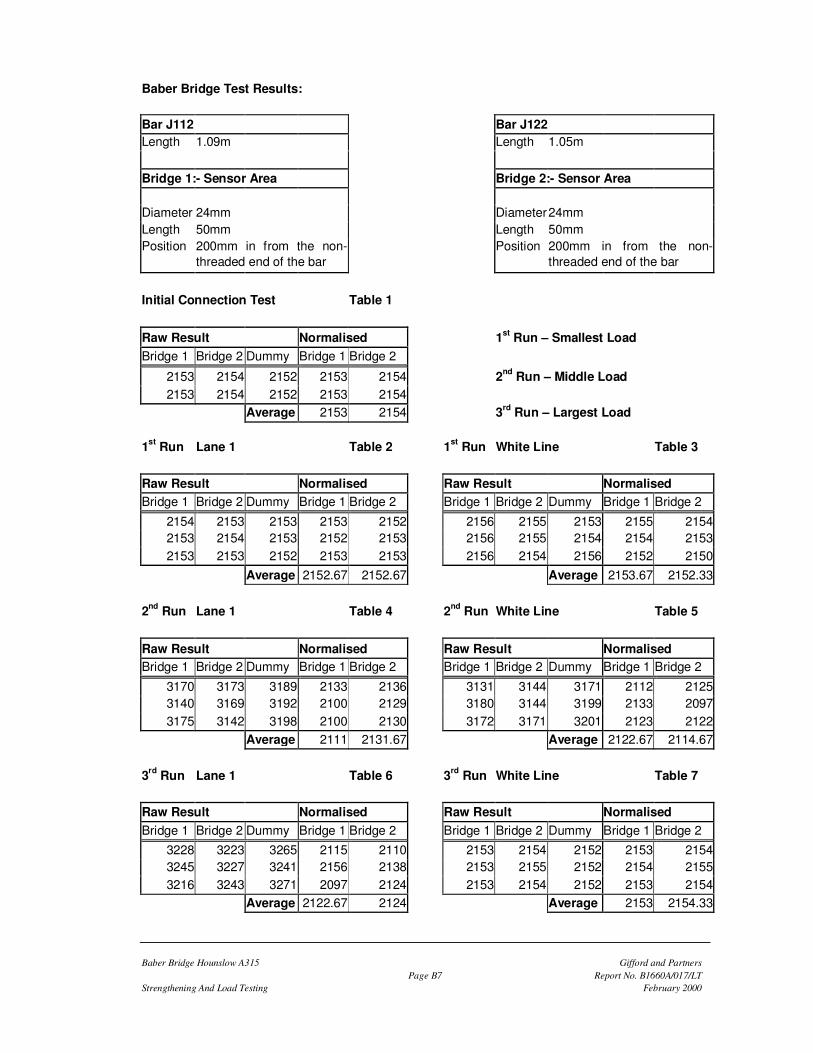
Baber Bridge Test Results: Bar J112 Bar J122 Length 1.09m Length 1.05m Bridge 1:- Sensor Area Bridge 2:- Sensor Area Diameter 24mm Diameter 24mm Length 50mm Length 50mm Position 200mm in from the non-
threaded end of the bar Position 200mm in from the non-
threaded end of the bar
Initial Connection Test Table 1
Raw Result Normalised 1st Run – Smallest Load Bridge 1 Bridge 2 Dummy Bridge 1 Bridge 2
2153 2154 2152 2153 2154 2nd Run – Middle Load 2153 2154 2152 2153 2154
Average 2153 2154 3rd Run – Largest Load 1st Run Lane 1 Table 2 1st Run White Line Table 3 Raw Result Normalised Raw Result Normalised Bridge 1 Bridge 2 Dummy Bridge 1 Bridge 2 Bridge 1 Bridge 2 Dummy Bridge 1 Bridge 2
2154 2153 2153 2153 2152 2156 2155 2153 2155 21542153 2154 2153 2152 2153 2156 2155 2154 2154 21532153 2153 2152 2153 2153 2156 2154 2156 2152 2150
Average 2152.67 2152.67 Average 2153.67 2152.33 2nd Run Lane 1 Table 4 2nd Run White Line Table 5
Raw Result Normalised Raw Result Normalised Bridge 1 Bridge 2 Dummy Bridge 1 Bridge 2 Bridge 1 Bridge 2 Dummy Bridge 1 Bridge 2
3170 3173 3189 2133 2136 3131 3144 3171 2112 21253140 3169 3192 2100 2129 3180 3144 3199 2133 20973175 3142 3198 2100 2130 3172 3171 3201 2123 2122
Average 2111 2131.67 Average 2122.67 2114.67 3rd Run Lane 1 Table 6 3rd Run White Line Table 7 Raw Result Normalised Raw Result Normalised Bridge 1 Bridge 2 Dummy Bridge 1 Bridge 2 Bridge 1 Bridge 2 Dummy Bridge 1 Bridge 2
3228 3223 3265 2115 2110 2153 2154 2152 2153 21543245 3227 3241 2156 2138 2153 2155 2152 2154 21553216 3243 3271 2097 2124 2153 2154 2152 2153 2154
Average 2122.67 2124 Average 2153 2154.33
Baber Bridge Hounslow A315 Gifford and Partners Page B8 Report No. B1660A/017/LT Strengthening And Load Testing February 2000
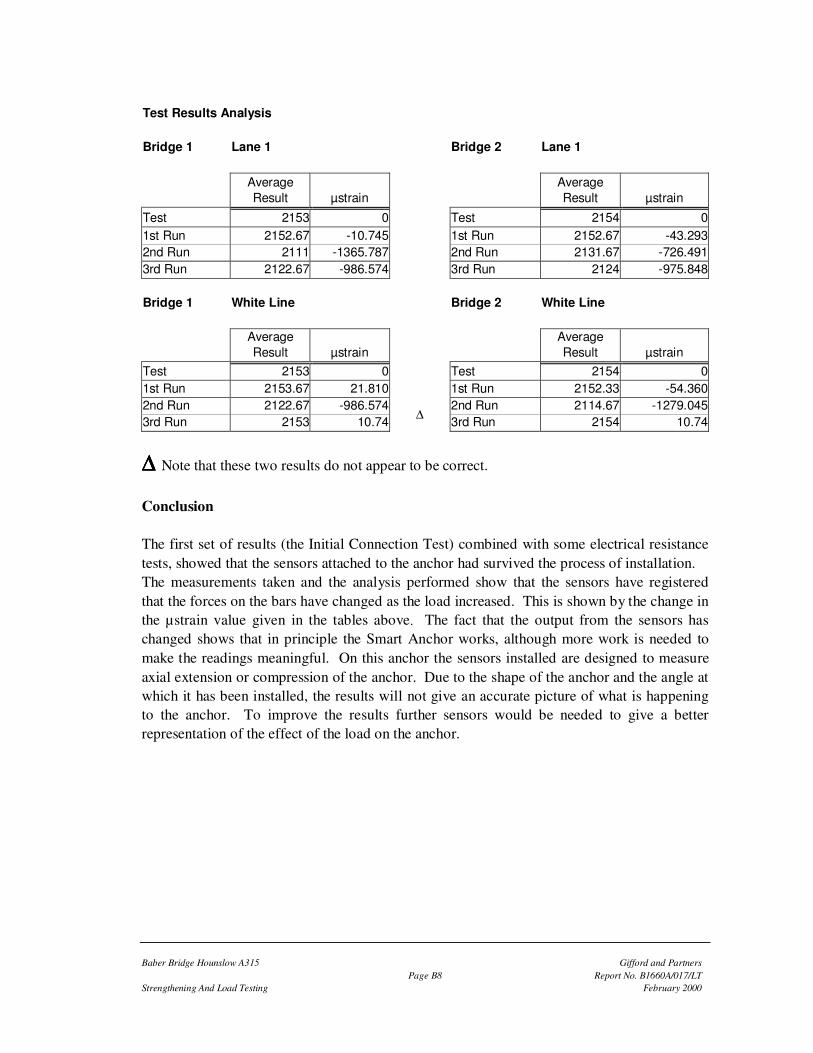
Test Results Analysis Bridge 1 Lane 1 Bridge 2 Lane 1
Average Result
µstrain
Average Result
µstrain
Test 2153 0 Test 2154 0 1st Run 2152.67 -10.745 1st Run 2152.67 -43.293 2nd Run 2111 -1365.787 2nd Run 2131.67 -726.491 3rd Run 2122.67 -986.574 3rd Run 2124 -975.848 Bridge 1 White Line Bridge 2 White Line
Average Result
µstrain
Average Result
µstrain
Test 2153 0 Test 2154 0 1st Run 2153.67 21.810 1st Run 2152.33 -54.360 2nd Run 2122.67 -986.574 2nd Run 2114.67 -1279.045 3rd Run 2153 10.74 3rd Run 2154 10.74
∆
∆∆∆∆ Note that these two results do not appear to be correct. Conclusion The first set of results (the Initial Connection Test) combined with some electrical resistance tests, showed that the sensors attached to the anchor had survived the process of installation. The measurements taken and the analysis performed show that the sensors have registered that the forces on the bars have changed as the load increased. This is shown by the change in the µstrain value given in the tables above. The fact that the output from the sensors has changed shows that in principle the Smart Anchor works, although more work is needed to make the readings meaningful. On this anchor the sensors installed are designed to measure axial extension or compression of the anchor. Due to the shape of the anchor and the angle at which it has been installed, the results will not give an accurate picture of what is happening to the anchor. To improve the results further sensors would be needed to give a better representation of the effect of the load on the anchor.