Embed Size (px)
Citation preview
۸٤
CHAPTER THREE
BILL HILLIER MAPPING METHOD:
Basis Of Space Syntax Technique
3.1. INTRODUCTION
How to describe space? How to analyse urban fabric according to objective
way? How to predict movement and usage from a spatial structure? How to
evaluate the design of an area ? How to measure the connection of spaces?
How to investigate society-space relation?
These questions will be tackled by extending a coherent family of ideas and
analytical techniques: Space syntax.
Space syntax, originated and developed
in the 1970s at the Bartlett Unit for
Architectural studies, University College, London (Hi
llier,1988;Hillier &
Hanson; Hillier et al.
, 1983; 1989a
;1989b;), is a robust technique that can be
used to describe and analyse patterns of architectural space both at the
building and urban level. It's how to establish an objective way to evaluate
and investigate the relationships between the morphological structure of
man-made environments and social structures or events. “Space syntax is a
set of techniques for the analysis of spatial configurations of all kinds,
especially where spatial configuration seems to be a significant aspect of
human affairs, as it is in buildings and cities.”1 Space syntax is also defined
as “a family of technique for representing and analysing spatial layout of all
kinds”( Hillier 1999:
165).It attempts to explain human behaviors and social
activities from a spatial configuration point of view (Hillier
,1997).
1
space syntax laboratory ,retrieve on 7th
may 2008,“ http://www.spacesyntax.org
/introduction/ index. asp”

۸٥
- Space syntax has been used in a wide range of research projects. Hillier
et al (1987a) made an analysis of house genotypes. Peponis et al (1990)
looked at the function of morphological structure of buildings in the way
finding process. Hanson (1989) described the sociocultural implications of
different plans for the rebuilding of London after the great fire. Miller
(1989) used space syntax as a tool in the process of urban renewal in a
Swedish town. Hillier et al (1989b) attempted to predict spatial patterns of
crime in urban areas
, and De Holanda (1989) was concerned with social
implications of different ways of structuring city-form in the third world.
Mills (1989) showed how the spatial structure of townships acts as a
mechanism of control in the apartheid ideology. Last and most important,
the relationship between the morphological structure of urban areas and
(mostly pedestrian) movement patterns has been researched frequently (
Hillier 1988;
Hillier and Hanson, 1984; Hillier et al.
, 1983
; 1987b; 1989a;
1990; Peponis et al.
, 1989)2.
3.2. THE IMPORTANCE OF ANALYZING THE SPACE
Space is the unit within which all human activities occur. It reflects the
social and cultural aspects of the city. The effect of space on people, how
they use it and interact with each other within it are all need to be grasped. It
is necessary to understand space from a functional perspective in terms of
what people do in it. We should think of space not as the background to
human activity, as we think of it as a background to objects, but as intrinsic
aspect of human beings do (Vaughan
, 2007). Space can be described in three
geometric ideas: linearly when people move in it, convex space( in which
every point can see each other ) when they interact within it and finally
isovist which from any point of space can be seen as a variably shaped, often
2
Environment and Planning B; planning and design,1993“ Space syntax: standardised
integration measures and some simulations”

۸٦
spiky visual field ( Benedikt,
1979). All these geometric ideas will be
defined in more detail in this chapter.
Figure 3.1. Relation between space and activity: Space is not a background of
activity but an intrinsic aspect of it. (source: Vaughan
, 2007)
3.3. WHAT IS SPATIAL CONFIGURATION?
It is clearly accepted that city is the container of activities, in its spaces
many human behaviors like eating, gathering, interacting and dwelling
occur, having their spatial form. There is an expected relation between space
and its use lies in the relation between configuration of people and
configuration of space. Configuration as defined in Hillier's book space is
the machine is “ a set of interdependent relations in which each is determined
by its relation to all the others”
(Hillier, 1996: 24). The arrangement of
spaces in such a way influences the use of them according to how we relate
these spaces to each other. For example,
figures 3.
2.
a and 3.2.b show two
different types of spatial configuration, although they seem similar in
adjacency and number of cells, they are totally different in underneath
topology( Hillier,
1996).
Regarding to the principle of permeability, it is clear that the position of
doors in the two figures is quite different, therefore has its influence on the
privacy of spaces, that eventually determine the use of space, so spatial
configuration needs to be analyzed and understood ( Hillier,
1996).

۸۷
F
igure 3.2. Spatial configuration. (source: Hillier,
1996)
3.4. UNIT OF SPACE SYNTAX TECHNIQUE
Every point in the space has one and two dimensional aspects, the one
dimensional is called axiality; the other is called convexity :
3.4
.1 Axiality
It is to draw the longest and fewest lines that covers the system, the product
is called axial map. It offers the most globalizing perspective, as an axial line
will extend as long as at least one point is visible and directly accessible (
Hillier et al.,
1983). Axial lines are used when studying movement.
3.4
.2 Convexity
A convex space is defined as “ a space that will not contain concave parts” (
Hillier et al.,
1983). It is an area outlined by a border of straight lines, any

۸۸
two points in this convex space can be joined by a straight line which doesn't
go outside the space.
Convex map consists of the largest and fattest convex spaces that cover the
area ( Hillier et al., 1983; S
zalapaj, 2001). The convex space offers the most
localized perspective because any selected point taken within it appearing
visible and directly accessible to all other points within that same space (
Hillier et al.,
1983). Convex spaces are used when studying interaction.
a) Convex space b) Concave space c) Axial line
e) Axial map d) Convex map
Figure 3.3. Space syntax tools ( source: Hillier et al.,
1983)
3.4
.3. Isovist
The key criterion in defining isovist is how far can one see or move from
every point in the space. Isovist analysis has been developed in landscape
studies and is integral to GIS (Rana,2002).
Benedikt (1979) adopted the term
isovist from Tandy (1967) who had used it to describe landscapes. Isovist
field is in itself a measure of the morphology of the system, it can be
generated automatically by using a software such as Depthmap from
Turner, Omnivista from Dalton. Isovist is defined as “the set of all points
visible from a given vantage point in space and with respect to an

۸۹
environment”
( Benedikt, 1979
: 47). It is the field of view within which the
entire space boundaries can be defined through the transportation of
observer's eye
around 360 ْwithout geometric obstacle. The boundary-shape
of an isovist is sensitive to location of point of seeing when the space is non-
convex, as there would be many isovists with different shapes. It is used
when examining complex patterns of behavior.
(source:
Batty& Rana, 2002) (source: http://wiki. uelceca. net/
2007/2008/files/ doc+essay.pdf)
Figure 3.4. Isovist.
3.5. THE CONCEPT OF DEPTH
The main interest in space syntax has not been in creating axial lines or
maps, but in examining and interpreting relationships between lines that
cover such map
(Batty & Rana, 2002). Space syntax measures distance
between spaces topologically, this topological distance is called depth. Depth
means number of intervening lines that must be crossed to get from space to
another, the minimum number of steps means shallowness (integration),
whereas the maximum number of ones means segregation.
3.6. INTEGRATION
3.6.
1. The Correlation Between Integration and Depth
Integration is the fewer intervening lines which need to be passed through to
go from a line to every other line. It's in contrast with mean depth ( obtained

۹۰
by dividing the total depth by k, the number of spaces in the system), the
most integrated lines means minimum depth. In other words, integration α
1/mean Depth so The more segregated spaces means higher depth.
Maximum depth( least integrated )
Minimum depth(most integrated)
Figure3.5.Relation between integration and depth (source: Hillier et al.,
1983).
3.6
.2. Measuring Integration
If the axial lines of an area have been drawn, it is possible to choose any line
and place all lines that join directly with it on a separate level until we cover
the whole system, then the number of levels required to join up all lines in
the system can be specified and values of integration, and depth can be
calculated (Hillier et al.,
1983). As shown in figure
3.6.
, by starting at line 7,
we can see that it is only connected to line 5. then line 5 is connected to line
6 and 4. By placing each direct connection on a separate level, we find that

۹۱
for line 7 we need four levels to join up the system. Similarly, f
or line 4 we
can see that it's directly connected to lines 2,3 and 5. then
line 5 is connected
to line 6 and 7, moreover line 2 is connected to line 1. Continuing as before
we see that we
need 3 levels to join up all the system, so line 4 is more
integrated than line 7 because it needs fewer number of levels
(3). To
calculate the mean depth of a certain line multiply the number of the lines on
a level by the level number, sum across levels and divide by the number of
lines( Hillier et al.,
1983). An integration value can then be calculated as
actual integration value = 1/ mean depth.
F
igure 3.6. Simple model of axial lines( source: Hillier et al.,
1983)
Space 4 mean depth = ( (3x1)
+ (3x2) ) / 6 = 1.5
Space 7 mean depth = ( (1x1) + (2x2) + (3x3) ) / 6 = 2.3
Integration value α 1 / mean depth
Figure 3.7. Simple justified graphs. ( source: Hillier et al.,
1983)
۹۲
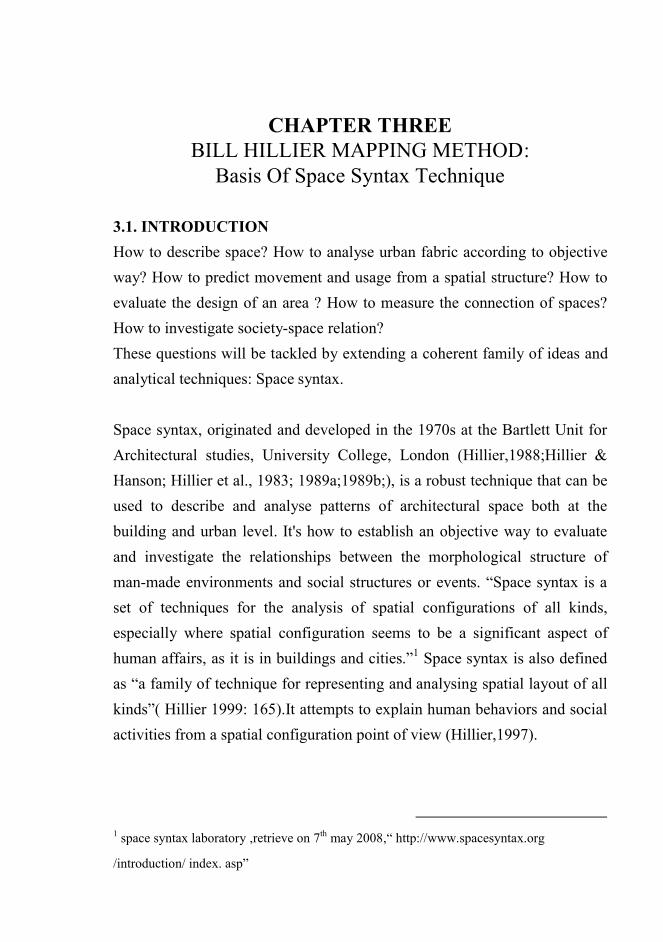
3.6
.3. The Integration Core
Every axial line in the axial map has an integration value that differs from
line to another, this integration value reflects its importance and how it
relates to all other spaces. If the integration values of lines be sorted and
ranked from the highest to the lowest, the lines of highest
( 25% of high
integration lines is recommended for small settlements of less than 100 lines.
10% is the recommended value for the integration core of larger settlement)
integration values can then be specified and presented on the map. These
most integrated val
ues (10%) is called integration core and can be
distinguished on the map by a heavy black
lines as shown in figure 3.8. In
good systems, the integration core relates to all other areas. This means
where ever you are in the system, you are never away from a high
integration line (Hillier et al.,
1983). The most integrated lines in an urban
plan will represent the skeleton of the mental map because those lines are the
most familiar to people.
F
igure3.
8. Example of axial map analysis according to space syntax technique:
Darker lines is the most integrated, while light gray is segregated (source: Kim Y
O
, 1999 ).
۹۳
3.6
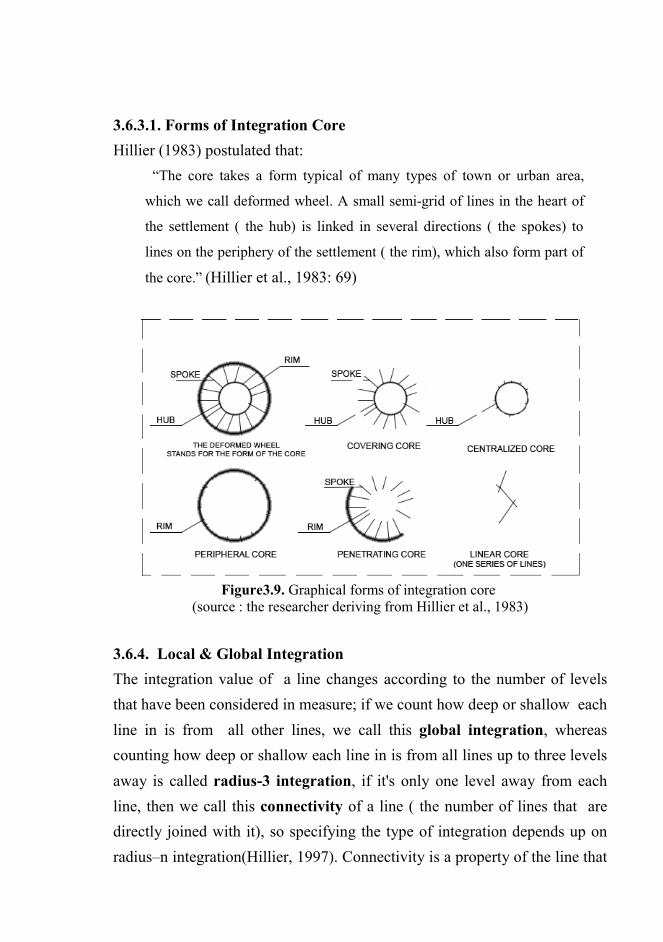
.3.1. Forms of Integration Core
Hillier (1983) postulated that:
“The core takes a form typical of many types of town or urban area,
which we call deformed wheel. A small semi-grid of lines in the heart of
the settlement ( the hub) is linked in several directions ( the spokes) to
lines on the periphery of the settlement ( the rim), which also form part of
the core.” (Hillier et al.,
1983:
69)
F
igure3.9. Graphical forms of integration core
(source : the researcher deriving from Hillier et al.,
1983)
3.6
.4. Local & Global Integration
The integration value of a line changes according to the number of levels
that have been considered in measure; if we count how deep or shallow each
line in is from all other lines, we call this global integration, whereas
counting how deep or shallow each line in is from all lines up to three levels
away is called radius-
3 integration, if it's only one level away from each
line, then we call this connectivity of a line ( the number of lines that are
directly joined with it), so specifying the type of integration depends up on
radius–n integration(Hillier,
1997). Connectivity is a property of the line that
۹٤
can be seen from the line, whereas global integration couldn't be seen from
the line, as it requires knowledge of the system as a whole, it considers the
relationship between each line and all other lines regardless how far they go,
so it's a global measure (Hillier et al.,
1983).
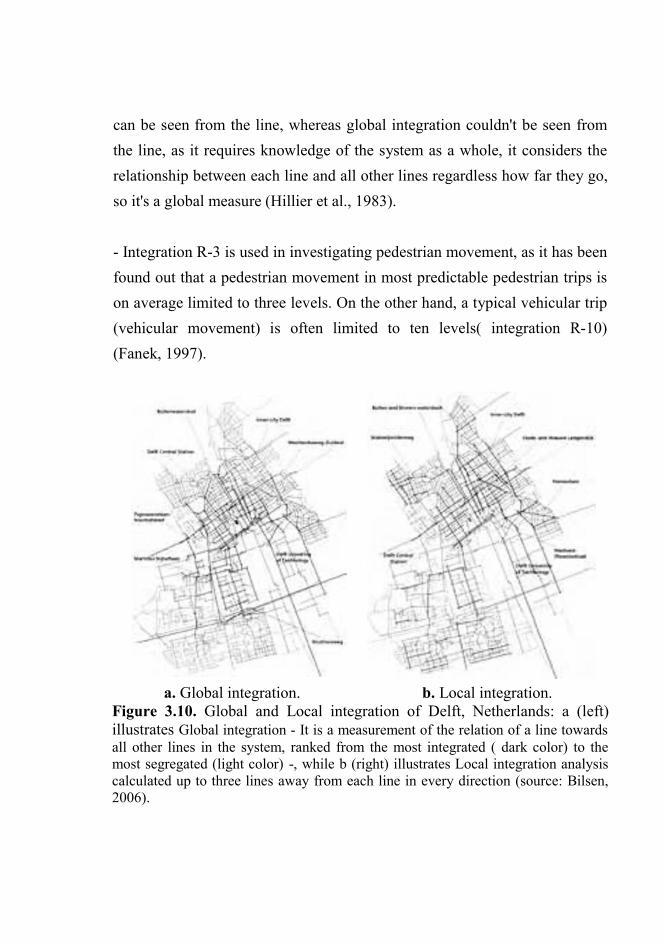
- Integration R-
3 is used in investigating pedestrian movement, as it has been
found out that a pedestrian movement in most predictable pedestrian trips is
on average limited to three levels. On the other hand, a typical vehicular trip
(vehicular movement) is often limited to ten levels( integration R-
10)
(Fanek, 1997).
a. Global integration. b. Local integration.
Figure 3.10. Global and Local integration of Delft, Netherlands: a (left)
illustrates Global integration - It is a measurement of the relation of a line towards
all other lines in the system, ranked from the most integrated ( dark color) to the
most segregated (light color) -, while b (right) illustrates Local integration analysis
calculated up to three lines away from each line in every direction (source: Bilsen,
2006).

۹٥
3.6.5. Intelligibility
Intelligibility is a key property of the spatial structure of towns. It's an
indicator of the quality of an environment as being easily navigable. Figure
3.1
1.a. looks like an intelligible when seen from above in two dimension, but
it may not be intelligible when one moves about in it, in contrast figure 3.11.
b. may be intelligible (Hillier et al.,
1983); so the variables affecting
intelligibility need to be grasped. The intelligibility is defined as “ the degree
to which what can be seen and experienced locally in the system allows the
large–scale system to be learnt without conscious efforts” ( Hillier, 1996:
171).
b) The map of Apt in the south of France
seems Unintelligible ( source: Hillier et
al.,
1983)
a) The pattern seems Intelligible
when seen from above ( source:
Hillier,1996)
Figure3.11. Example of intelligible and unintelligible patterns.
Intelligibility of space is “a measure of the relationship between the overall
urban space and local features” (
Szalapaj, 2001: 41). The definition concerns
the relation between connectivity of space(local measure) and its global
integration, it means how spatial configuration can be read from its parts. In
other words, how the observer can be informed about his position within the
spatial system as a whole from every location that he potentially occupy “
The key to understanding parts and whole is understanding the relation

۹٦
between the different radii of integration” (Hillier, 1996:
127).The most
integrated area will be visited more, thus it will be more familiar, even
though integration had no direct effect on familiarity. An intelligible system
is one in which well-connected spaces also tend to be well-integrated ones
and vise versa. In an intelligible world the correlation between local and
global properties of space is perfect, so the whole can be read from the part.
Conversely, if the correlation is poor, the product will be unintelligible
environment, so the people may lose their way. Later,
Hillier (1996) explains
this notion using a scattergram that shows the correlation between
connectivity and integration. He notes that the degree of intelligibility can be
predicted by looking at the form of the scatter. If the points form a straight
line rising at 45 degree from bottom left to top right, then this implies a good
correlation between local and global integration. Consequently, The system
would be highly intelligible ( Hillier,
1996). For example, in figu
re 3.12.a
the points form a tighter and linear scatter which indicates a perfect
correlation, and therefore a greater intelligibility. On the contrary, figure
3.12.b shows that the scatter is diffused indicating that the correlation is
poor. Thus, revealing unintelligible world.
F
igure 3.12.a. Intelligible spatial layout (source: Kim Y O
, 1999) F
igure 3.12.b. Unintelligible spatial
layout (source: Kim Y O
, 1999)
۹۷
3.6.6. What Is A Synergy Value?
Synergy is simply the correlation between local (radius
3) and global
integrations. It is a different kind of intelligibility in so much, as it is about
the relationship between the local and global structure.
Radius 3 is not as
local as connectivity, but it is the best correlate, for example, of pedestrian
movement rates, and seems to give a good indication of the local pedestrian
scale structure of urban areas. Its correlation with the global integration
measure is, therefore, perhaps an indication of the relationship between the
local economy of neighbourhoods and the whole city economy. Do the
routes which connect the whole pass through the same spaces as those which
form the heart of the neighbourhood? In the modern city one of the effects of
zonal planning and traffic engineering has been to separate the global route
structure from the local neighbourhood (in order to speed car traffic), and we
would expect this to be shown by a reduction of synergy. We would also
expect a reduction of intelligibility, but this would be shown in the
scattergram as a small number of the most integrated spaces (the main traffic
routes) also being poorly locally connected3.
3.6.7. Movement Pattern
It's widely accepted that there is a relation between the spatial configuration
and the likelihood of encounters, this relation is called natural movement
(Hillier, 1996). Natural movement is “ the proportion of movement on each
line that is determined by the structure of the urban grid itself rather than by
the presence of specific attractors or magnets.” (Hillier, 1996:
120). Even
though, integration of an urban plan is purely spatial analysis, it has proved a
strong predictor of movement patterns, both pedestrian and vehicular
(Hillier,
2004). If the integration values of an area have been measured; and
3 From a discussion through e-mail between the researcher and both of professor Alan Penn
and Dr. Ruth Conroy Dalton.

۹۸
a street survey of counting the number of people who are passed when an
observer walks 100m/ min. has been carried out, then the usage and pattern
of movement can be predicted, as streets from which other streets can be
accessed with minimum intervening lines attract more people. Thus, attract
retail and other land uses that rely on the volume of pedestrian traffic, and
consequently the volumes of both pedestrian and uses are multiplied, as the
allocated functions then increase the importance of the location itself and
attract other functions, this phenomena is what Hillier has called Multiplier
effect
(Hillier,1996). This indicates that the pattern of movement is a
function of its pattern of integration (Hillier et al.,
1983). This principle of
predicting movement pattern and usage could be used as an evaluative tool
in design and redevelopment of urban areas.
Figure 3.13. shows a
scattergram between encounters on the horizontal axe against integration on
the vertical.
Figure 3.13. Scattergram between encounters and integration.
3.7. WHAT IS A CONTROL VALUE?
Control is defined as “ the degree of choice that each space represent for its
immediate neighbours as a space to move to” (Hillier et al., 1983
: 237). It is
the sum of the reciprocal of the connectivity of its neighbours. It has been
determined that each line starts with a control value of 1. Each line will

۹۹
distribute its initial value of 1 equally to lines with which it intersects. Each
line will give and take control values depending on the number of lines that
intersect with it, these control values reflect the influence of each line over
those intersected with it.
Figure 3.14
. shows that line 1 intersects with two
lines, it will distribute its initial control value equally to line 2 and 6 by
giving each a value of 0.5. Similarly,
line 3 will give line 2 a value of 0.5
and line 4 will give line 2 a value of 0.333. consequently, the control value
of line 2 equals the sum of 0.5, 0.5 and 0.333, the resulting control value of
1.333 is higher than it had initially. Other lines may get control values less
than their initial ones such as
line 6 which has control value of 0.833.
F
igure 3.14. Axial lines demonstrating the control value.
3.8. AXMAN SOFTWARE
It is a computer aided design program created by Nick Dalton at University
College London. By creating an axial map and inserting it into Axman
software, all syntax values such as Depth, Connectivity, Integration R=n and
Control can be obtained, as Axman applies space syntax methodology using
programmed mathematical processes. “Axman constructs a graph of the

۱۰۰
configuration of axial lines, interpreting the lines as the graphs nodes and
connections between lines as the edge of the graph”4. Axman is included in
the Macintosh Bundle.
3.9. UCL DEPTHMAP
Depthmap, created by Alasdair Turner at University College London, is an
application used in visibility analysis of architectural and urban systems.
Axial maps can be entered to the program and analyzed according to Space
syntax principles. UCL Depthmap can perform many types of analyses such
as the original visibility analysis, generation and analysis of axial maps as
well as segment analysis. The program was first written for the Silicon
Graphics IRIX operating system as a simple isovist processing program in
1998. It is designed
to run on Windows 2000 and XP operating systems5.
Figure 3.15. UCL Depthmap interface.
4 http://www.spacesyntax.org/software/macbundle.asp.
5 http://www.spacesyntax.org/software/DepthMap.asp.

۱۰۱
3.10. CRITICISM ON SPACE SYNTAX
Although space syntax is widely used and published since few decades, the
validity of technique is controversial. The limitations of space syntax can be
presented in the following points:
1-
Discarding of metric and 3D information:
Ratti (2004) argued that space
syntax measures the distance between spaces topologically neglecting metric
distance and this is hard to be accepted. H
illier (2004) claimed that space
syntax is not enough for social behavior interpretation, as it has noting to say
about pedestrian choice make, so it need to cooperate with other suitable
variables to do so. He argued that there is a conflict between the metric and
topological relations, as considering metric distance instead of topological
one will always presents the geometric center of the system as most
integrated (because it is metrically closer to all other parts of the system) and
presents the geometric edges as most segregated, this means that the
boundary of the model will be affected by the choice of its position.
Some architects reject the analysis based on space syntax because it is not
three dimensional and can not therefore have much to say about visual
quality. Consequently, Space syntax ignores the superficial appearance of
the environment, including surface colors, textures and patterns. Ratti stated
that there are many factors can generate movement such as bus stop and
taller building.
As space syntax neglect 3D information, then it's hard to
differentiate between a pedestrian pavement and an urban highway when
counting on axial map.
2- Redundancy and ambiguity of terms used in space syntax: The terms used
by Hillier in writing space syntax are complicated and ambiguous.
Moreover, some of these terms are similar in the meaning. For instance, both
of depth and integration mean the same thing. Thus, this produces
redundancy.

۱۰۲
3-
Lawrence (1990) argued that space syntax technique is inadequate in
projecting society's norms.
Likewise, Edmund Leach (1978) argued that the
generative syntax can not be inferred by just looking to the two dimensional
urban pattern of a settlement, and even if we could be sure of what
generative syntactic rules have been, nothing could be inferred about the
society that makes the use of the resultant settlement. On the contrary, Hillier
suggested that social interaction results from the spatial configuration of an
urban layout. This claim is impossible to be tested, as our today urban
lifestyle is totally different from that existed when Hillier built his thoughts6.
4- “The danger of planners using space syntax without understanding of the
ideologies behind it which might lead to “ other equally important design
issues being treated as
secondary ”( McLeish,1987:108)”7.
5- Space syntax has nothing to say about many properties of urban layout
such as property of shape, and the angular size of the turns. Although axial
maps may speculate main and sub roads through lengths of axial lines, it has
nothing to say directly about road width. In other words, pattern of axial
maps may reveal existence of hierarchy of roads while it is actually not.
Hierarchy of roads can not be obscured in wayfinding and orientation issue.
This point will be discussed in more detail in the empirical part.
6
Salheen, M., 2001, A comprehensive analysis of pedestrian environment: The case study
of Cairo city center, Ph.D. thesis , Heriot-Watt University, Edinburgh College of Art,
Faculty of Environmental Studies, School of Architecture.
7 ipid.

۱۰۳
3.11. CONCLUSION
In this chapter, we have briefly introduced the basic elements of space
syntax. For instance, illustrating the concept of spatial configuration,
defining the tools of spaces syntax analysis ( convex space and axial line ),
explaining the notion of depth and integration and how to measure them. We
have also mentioned the difference between global and local integration and
how the correlation between them can be used as an evaluative tool of good
urban areas properties in the light of intelligibility principle. After that, we
identified another important term used in space syntax, it is the control value
of a line, illustrating its meaning and how can it be calculated manually.
In the last part of this section, the relationship between integration and
pattern of movement have been discussed, illustrating how can spatial
pattern predicts usage. A scattergram is presented to make better
understanding of the correlation between space syntax and spatial behavior.
There are other specialized terms used in space syntax such as centrality and
choice have not been mentioned in this research study, as they have little
significance for it.
Finally, we have discussed the criticism against space syntax especially the
aband
on of metric and 3D information, the argument between Hillier and C.
Ratti has been discussed in order to support
or refute metric and 3D
information.
![Surgical echnique - Acumed › system › files › Acumed... · Acumed Polarus 3 Solution Surgical echnique System Features [continued] Low-Profile Screw 4.3 mm low-profile hexalobe](https://img.pdfslide.us/doc/110x75/5f21975916b34d48e73f191d/surgical-echnique-acumed-a-system-a-files-a-acumed-acumed-polarus-3.jpg)