Embed Size (px)
Citation preview

Azimuthal (sometimes called zenithal) projections classified by
projection center
Next blue pictures are taken from ESRI:s web pages:
Understanding Map Projections
perspective projections
Perspective azimuthal projections are subdivided into projections with negative and positive transformations. In the former the region being mapped is projected onto the pictorial plane with straight lines of sight from a point in space situated on the concave side of this surface and in the latter on the convex side of the surface being mapped.
Perspective azimuthal projections
When using perspective azimuthal projections, the Earth is generally considered to be a sphere. Sometimes for design of maps of medium-sized and small regions (less than 1000000 km^2) and at scales larger than 1:10000000 it is necessary to take into account the ellipsoidal shape.

Gnomonic projection displays all great
circles as straight lines
shortest route between two locations in reality corresponds to that on the map
Meridians and the Equator are great circles, they are always shown as straight lines

Gnomonic projectionhttp://
www.progonos.com/furuti/MapProj/Normal/ProjAz/projAz.html

Gnomonic
• Neither conformal nor equal area
• Less than one hemisphere may be shown
• No distortion at the center
• Distortion and scale rapidly increase away from the center
• Directions from the center are true
• Used only in the spherical form
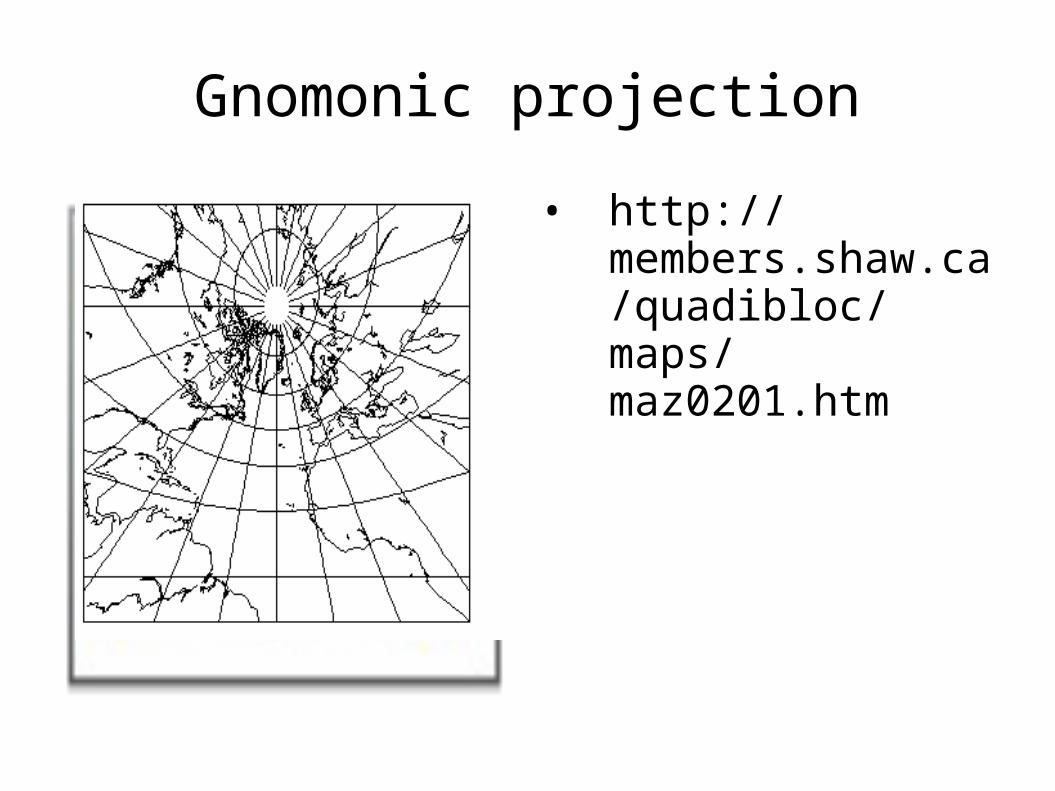
Gnomonic projection
• http://members.shaw.ca/quadibloc/maps/maz0201.htm

Gnomonic projection
• http://en.wikipedia.org/wiki/File:Gnomonic_Projection_Polar.jpg
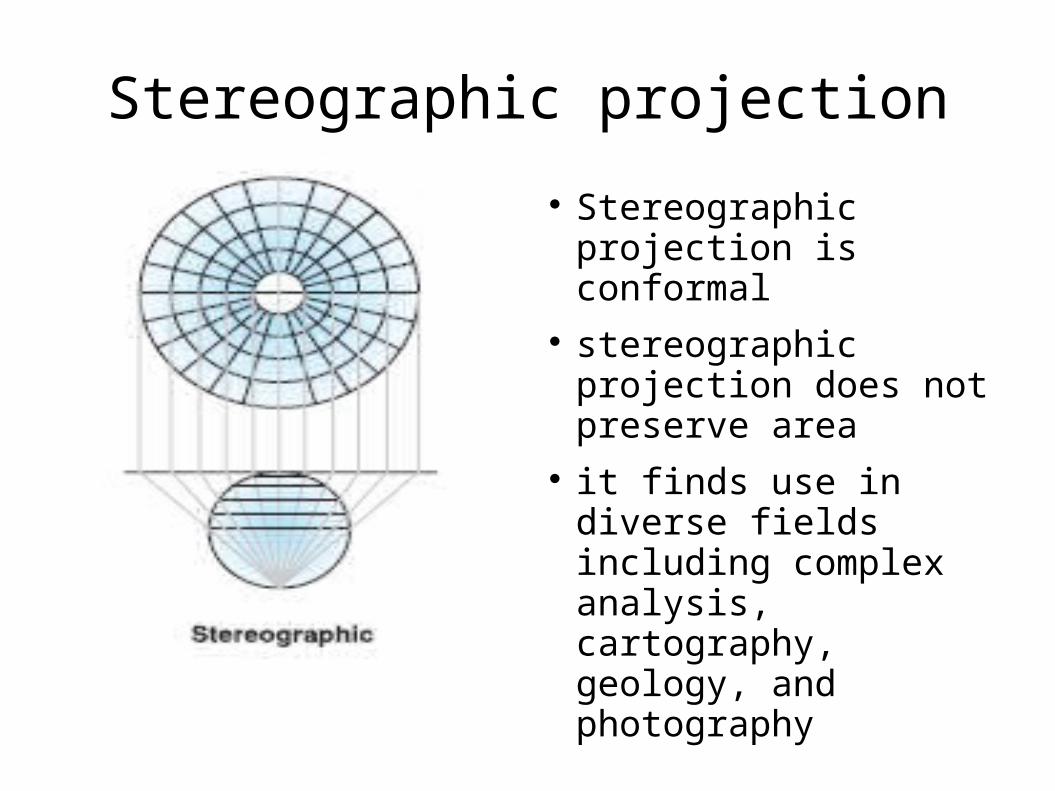
Stereographic projection
Stereographic projection is conformal
stereographic projection does not preserve area
it finds use in diverse fields including complex analysis, cartography, geology, and photography
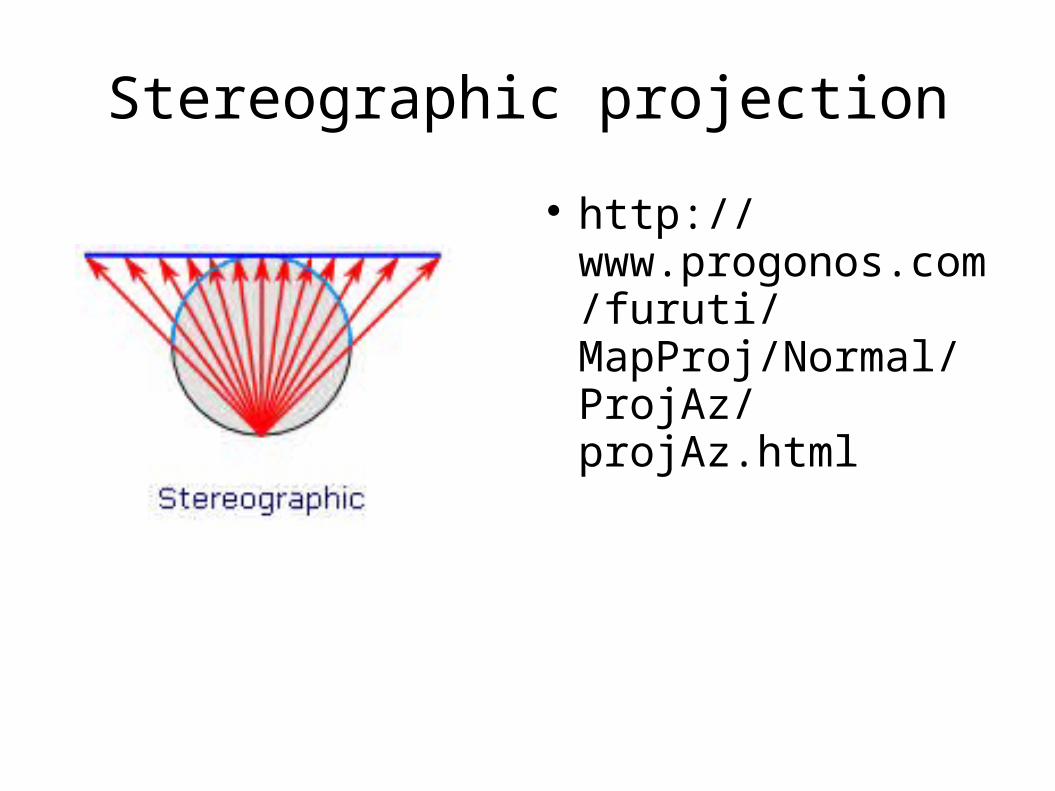
Stereographic projection
http://www.progonos.com/furuti/MapProj/Normal/ProjAz/projAz.html
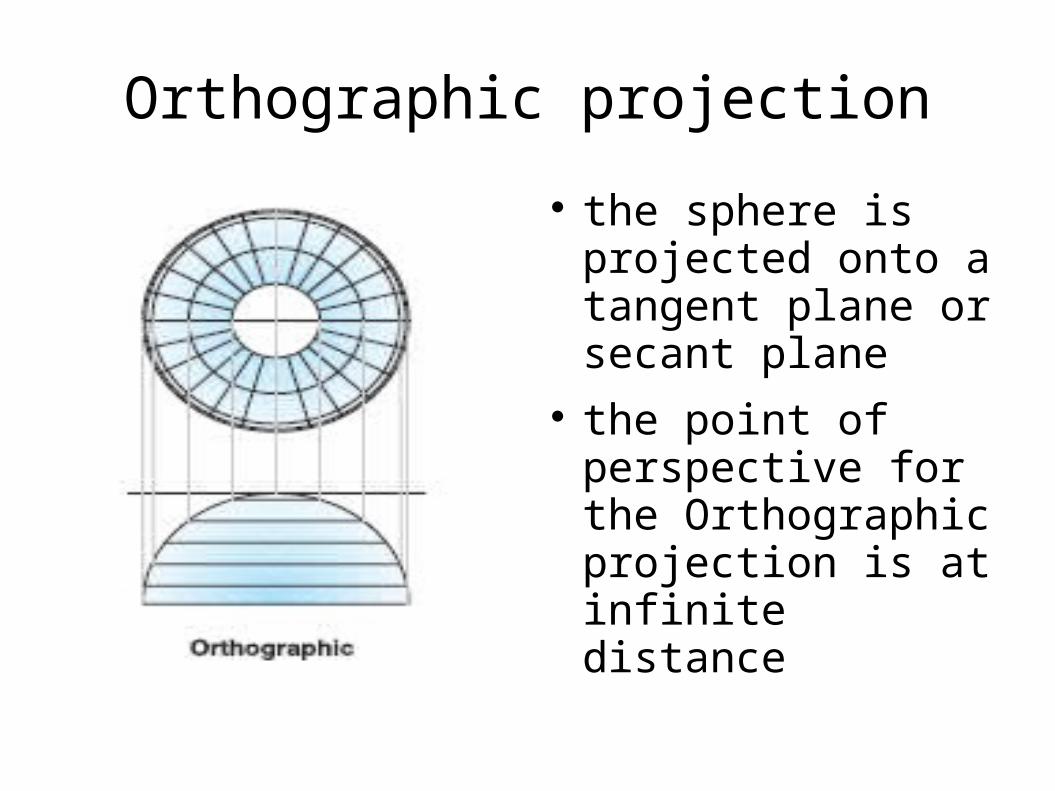
Orthographic projection
the sphere is projected onto a tangent plane or secant plane
the point of perspective for the Orthographic projection is at infinite distance
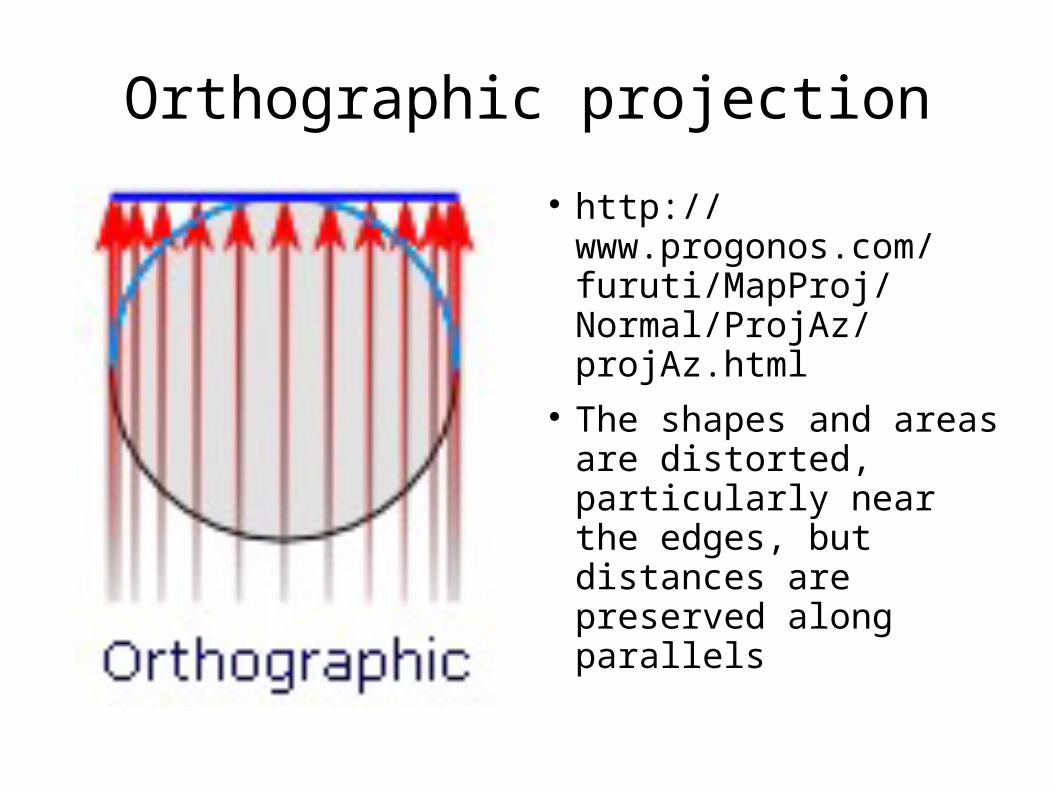
Orthographic projection
http://www.progonos.com/furuti/MapProj/Normal/ProjAz/projAz.html
The shapes and areas are distorted, particularly near the edges, but distances are preserved along parallels
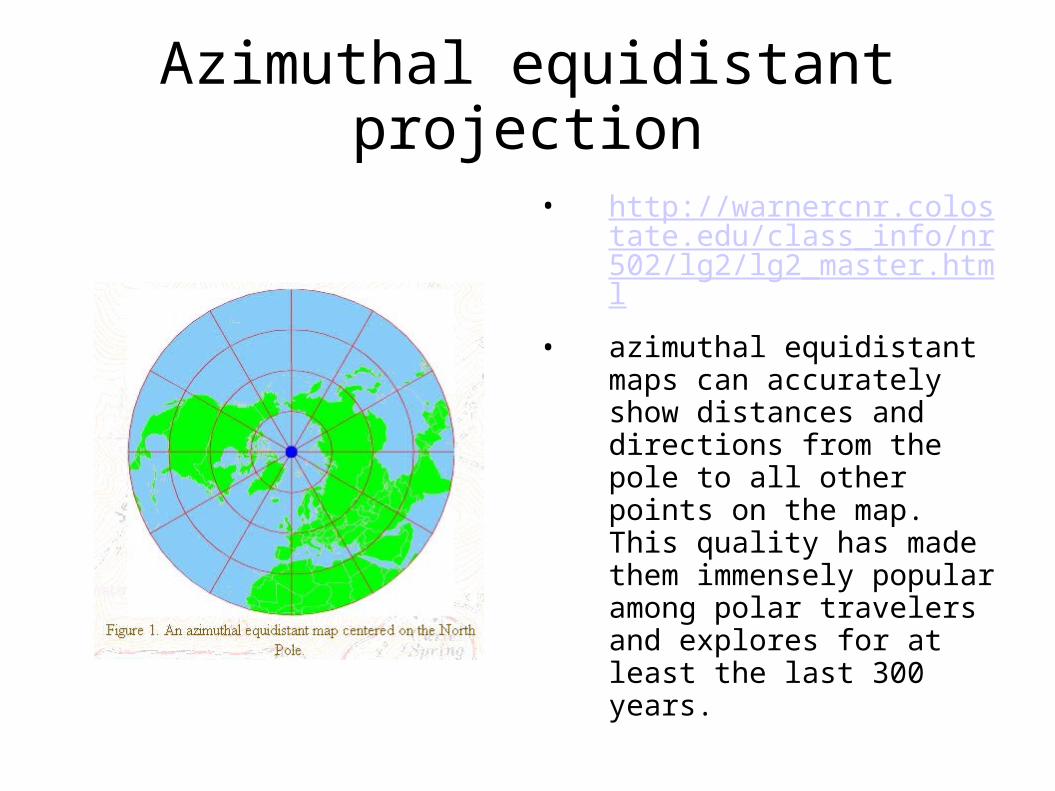
Azimuthal equidistant projection
• http://warnercnr.colostate.edu/class_info/nr502/lg2/lg2_master.html
• azimuthal equidistant maps can accurately show distances and directions from the pole to all other points on the map. This quality has made them immensely popular among polar travelers and explores for at least the last 300 years.

Azimuthal equidistant projection
• many cartographers recommend that you limit azimuthal equidistant maps to a region within 30 degrees of latitude and/or longitude of the point of tangency. Beyond this 30-degree range, the amount of shape distortion in the map increases rapidly.
Azimuthal projections
• On azimutal projections, parallels or almucantars are reprensented by concentric circles and meridians or verticals are represented by straight lines passing through the center of the circles at angles equal to the difference between the corresponding longitudes of the meridians.
Lambert azimuthal equal area projection
http://upload.wikimedia.org/wikipedia/commons/3/37/Lambert-azimuthal-equal-area.jpg
Pages 29-34 from the Map Projections for Europe
Map Projections for the Layman
• http://www.ec-gis.org/sdi/publist/pdfs/annoni-etal2003eur.pdf

The use of Map Projections
Geographical maps(source: Bugayevskiy, Snyder)
• Compare regions with various physical-geographical characteristics, administrative units
• Study the extent of shorelines, rivers, roads, lines of communication, boundaties, relief features, outline of shorelines, mountain ridges, direction of winds and currents
• Good choice: Equidistant or nearly equidistant projection
Physical maps
• Relief and hydrography is of primary importance on these maps
• Comparison of outlines and directions of river flow, valleys, mountain ranges, areas of basins, mountainous features as well
• Good choice: equidistant or nearly equidistant projection, also low area distortion
Climatic and meteorological maps
• For climatic maps which patterns are studied with help of isolines it is important to preserve low area distortion
• If it is necessary to interpolate intermediate values of functions using isolines and to determine gradients, conformal projections are good
• Sometimes also equidistant or nearly equidistant
• Gnomonic projection, if it is necessary to show great circles as straight lines
Geological maps
• The most important thing is to eliminate area distortion, the portrayal of outlines and shapes are being of lesser importance except some maps, which emphasize geological faults
• Equal-area projection is a good choice
Tectonic, geomorphologic and relief maps
• Projection requirements vary for these topics
• When it is necesssary to represent accurately the areas of regions with geological folds, various types of sedimentation, or basins, as well as the area between high plateaus, it is good take projection with low area distortion
• If directions of faults, mountain ranges and ridges, the shapes and directions of rivers and the shapes of valleys are important, equidistant will be good
Seismic maps
• On those maps used for measuring distances from earthquake epicenters, it is important to avoid visible distortion of distance
• On maps relatively small scales and covering large areas, projections on which it is possible to take into account the effect of scale distortion
• To measure distances along orthodromes from a single seismic station, maps on the azimuthal equidistant projections are more suitable
Maps of soils, the Earth's surface and the ocean floors
• Sometimes it is necessary to determine areas of soil zones and various types of earth, the requirements are the same as those for geological maps
– Eliminate area distortion
– Equal-area projections
Maps of flora and fauna
• Choose a projection with slight area distortion rather than truly equal area projections
• The graticules of these maps should make it possible to compare areas of various latitude zones

Administrative and political maps
• Cartographic information is normally estimated visually from administrative and political maps of territories
• If administrative map is used to determine areas, then area distortion must not influence the results
• The use of equal-area projections for political maps of the world can result in great distortion of the outlines and shapes of the territories of many countries
Political maps
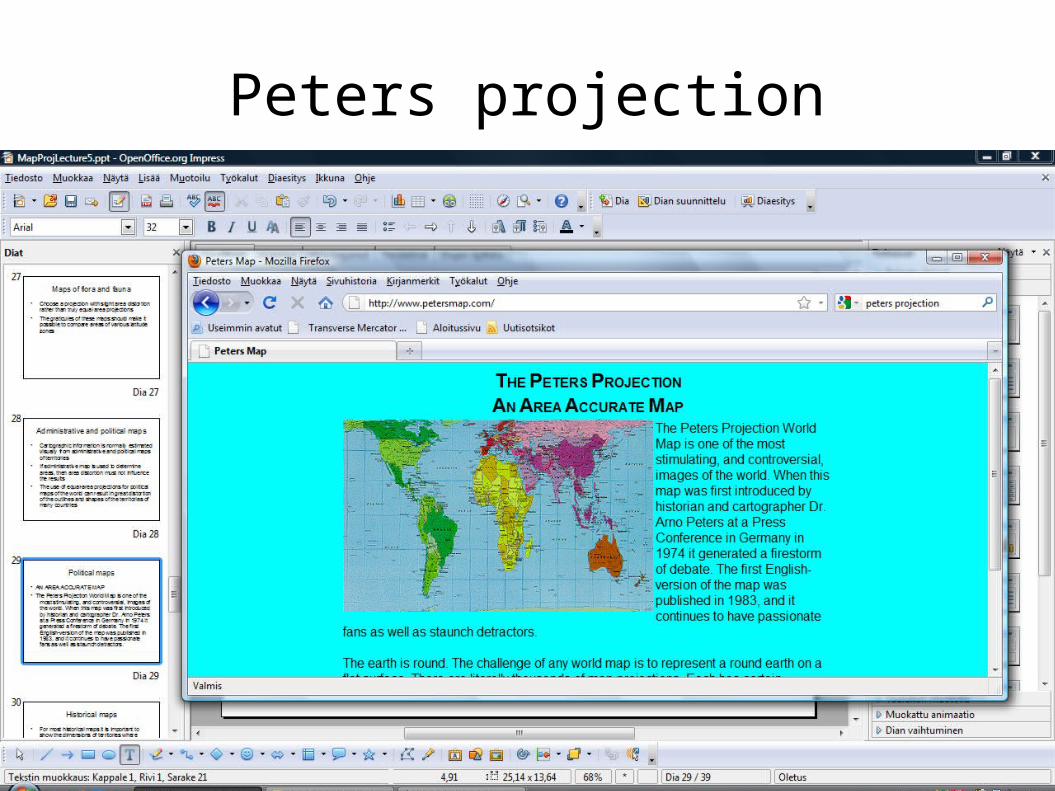
• AN AREA ACCURATE MAP
• The Peters Projection World Map is one of the most stimulating, and controversial, images of the world. When this map was first introduced by historian and cartographer Dr. Arno Peters at a Press Conference in Germany in 1974 it generated a firestorm of debate. The first English-version of the map was published in 1983, and it continues to have passionate fans as well as staunch detractors.
Peters projection
Historical maps
• For most historical maps it is important to show the dimensions of territories where historical events took place, the quality of outlines and shapes is of secondary importance
• Projections with little distortion of area are preferable to those that are equal area

Historical maps
• For most historical maps it is important to show the dimensions of territories where historical events took place, the quality of outlines and shapes is of secondary importance
• Projections with little distortion of area are preferable to those that are equal area
Maps of population
• Population density is almost always compared with areas → equal-area projections are good
• When the migration of peoples on maps of world population is shown, it is necessary to resort to projections with low distortion of direction
Maps of service lines and communications
• On projections that are equal area or with distortion characteristics close to equal area for general maps of continents, directions and the extent of roads and routes are distorted relatively little
• On sea charts Mercator projection
• When studying the density of road networks it is better for projections to have low area distortion
• Azimuthal equidistant projections for shortest distances from capitals

Samples of projections
http://www.mathworks.com/access/helpdesk/help/toolbox/map/f4-4154.html
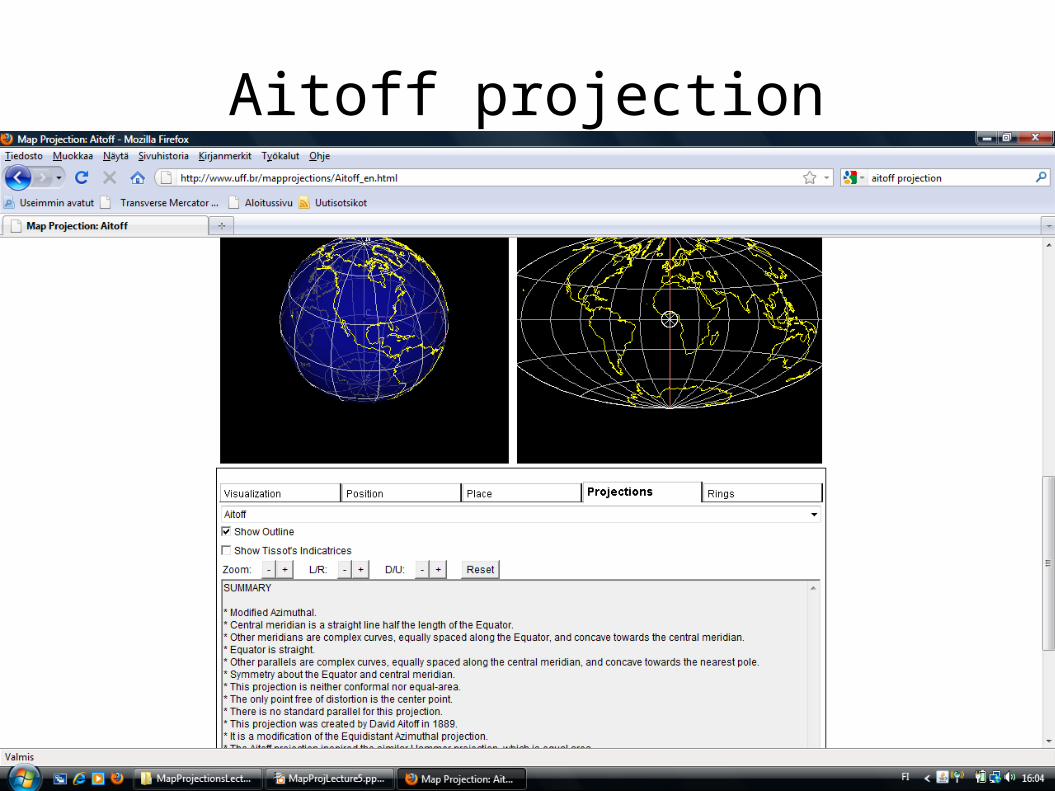
Aitoff projection
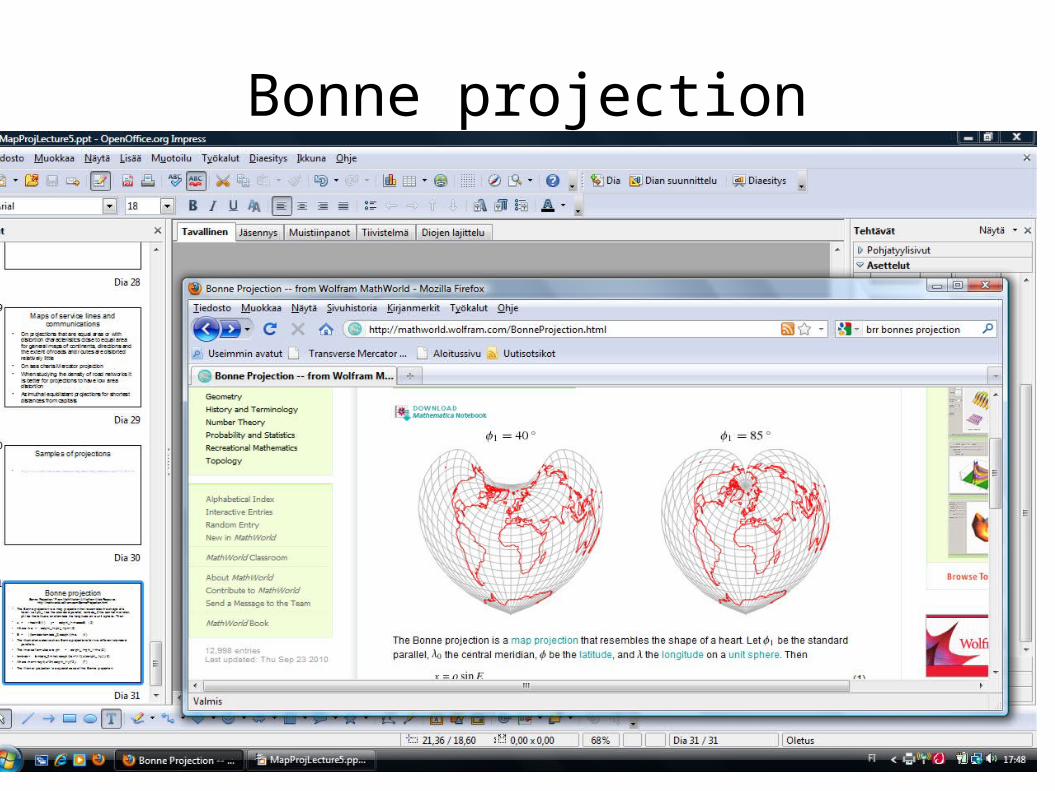
Bonne projectionBonne Projection." From MathWorld--A Wolfram Web Resource.
http://mathworld.wolfram.com/BonneProjection.html
• The Bonne projection is a map projection that resembles the shape of a heart.
• The Werner projection is a special case of the Bonne projection.
Bonne projection
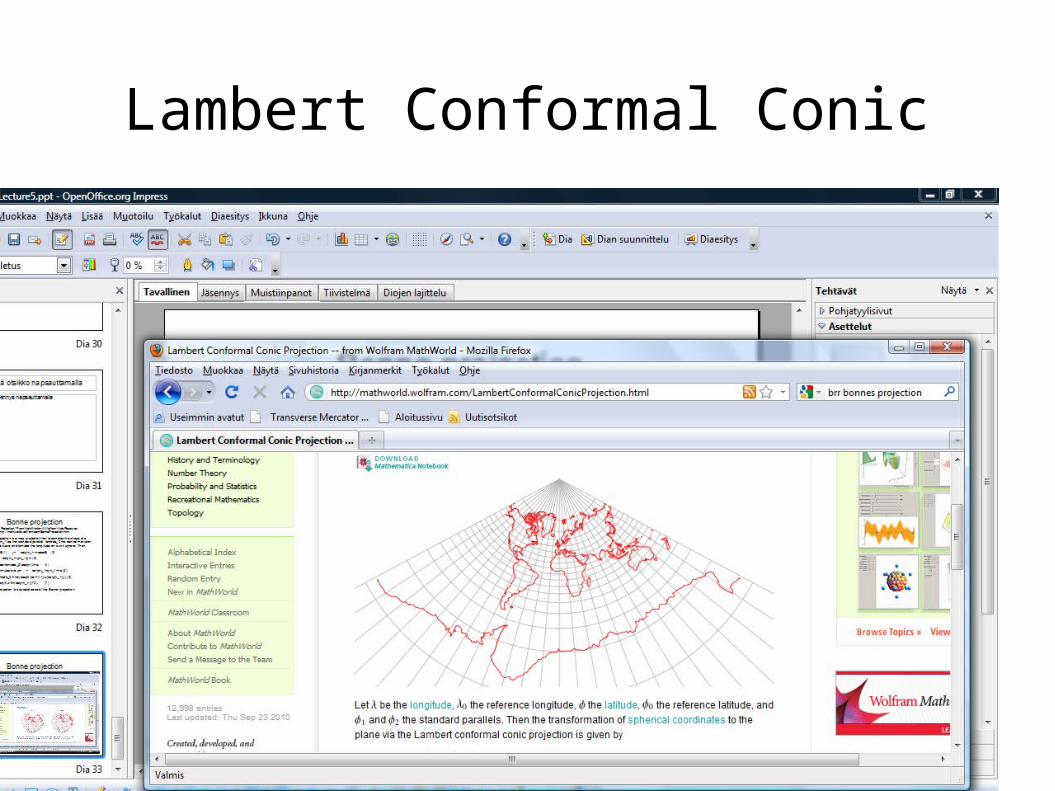
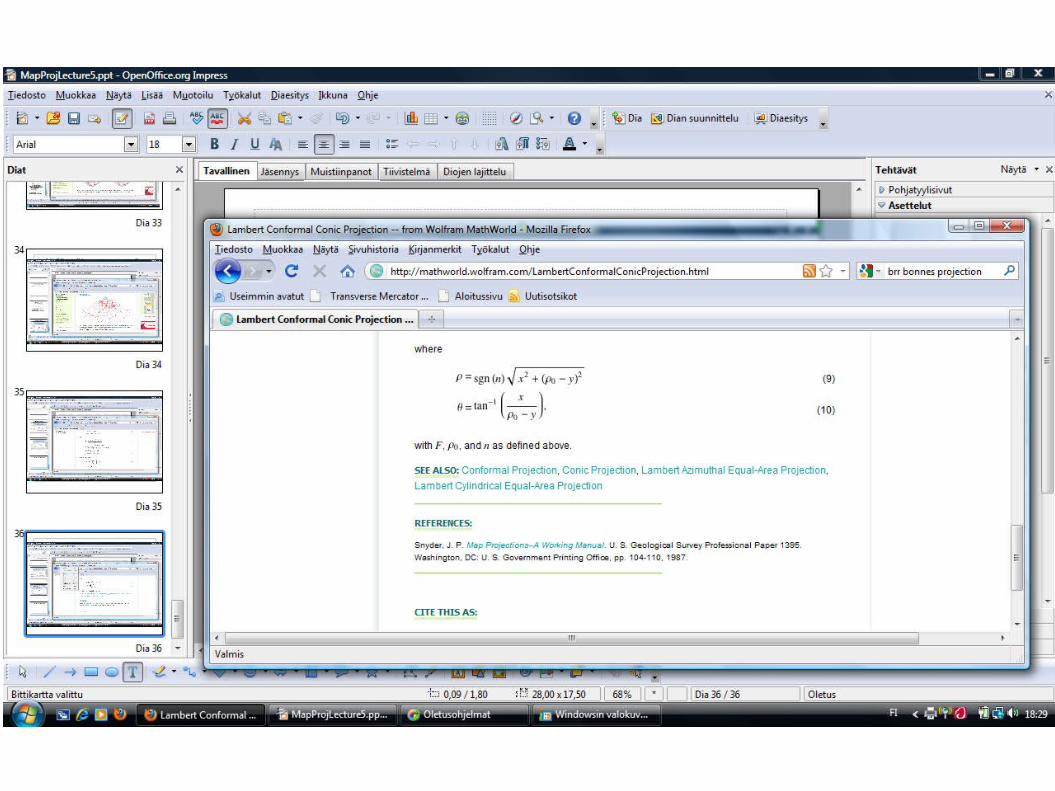
Lambert Conformal Conic
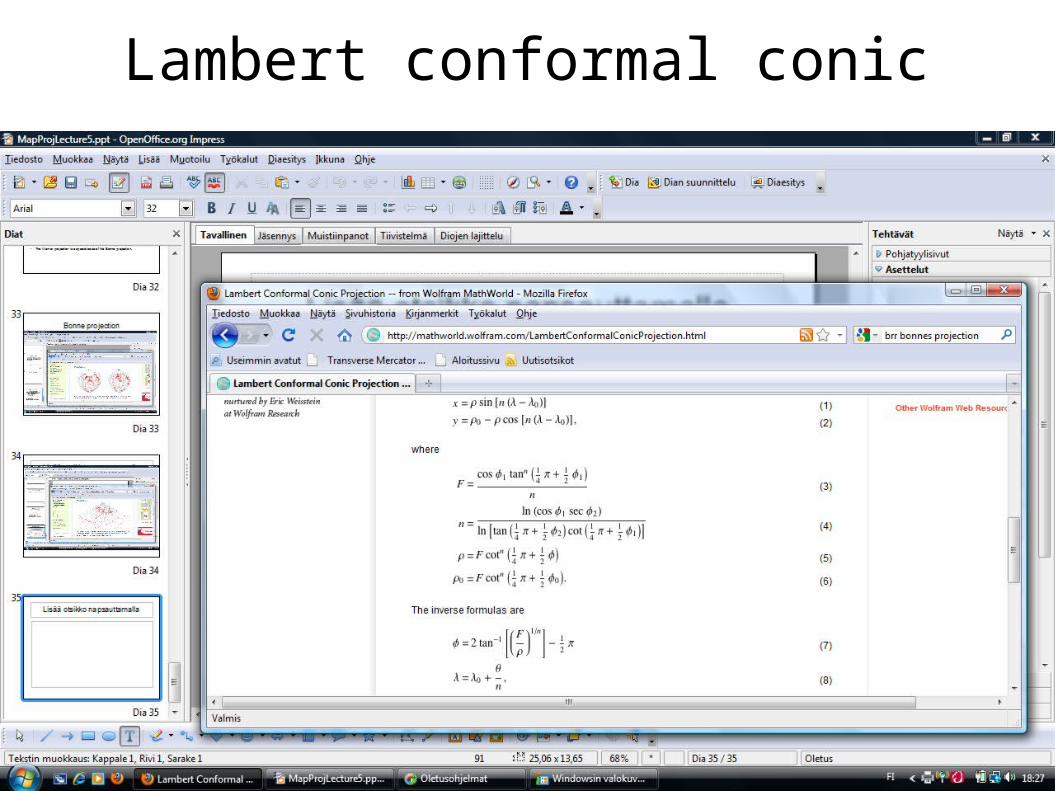
Lambert conformal conic
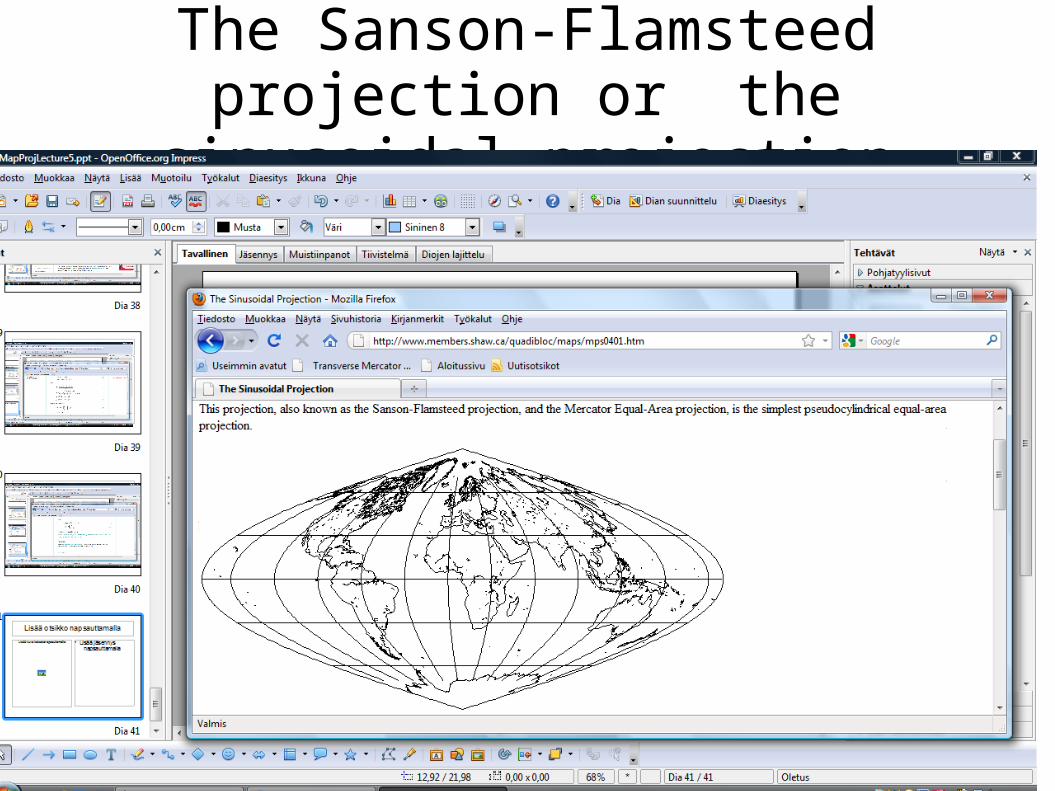
The Sanson-Flamsteed projection or the sinusoidal projection
Sinusoidal projection
• the width of a degree of longitude is proportional to the cosine of the latitude. Hence, if we space the parallels of latitude uniformly on the map, and make the scale of longitude always proportional to the cosine of the latitude, areas will be correct.
• Continents distant from the prime meridian are sheared, giving them a very distorted appearance in this projection.
Sinusoidal projection
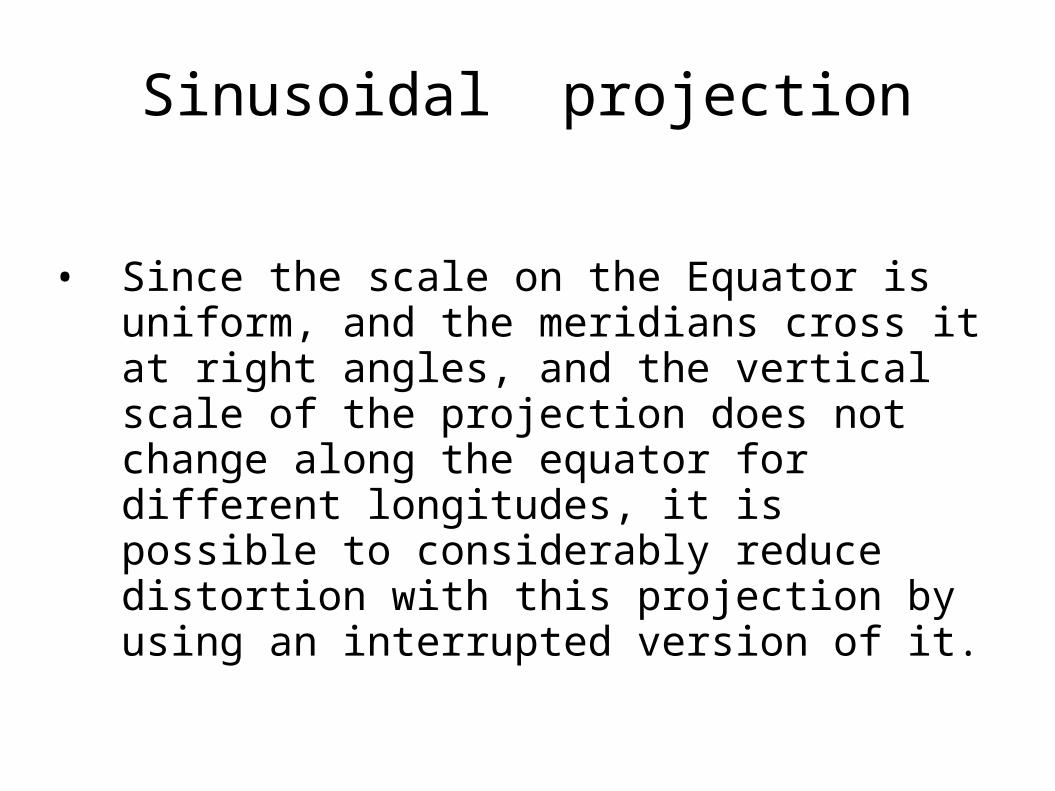
• Since the scale on the Equator is uniform, and the meridians cross it at right angles, and the vertical scale of the projection does not change along the equator for different longitudes, it is possible to considerably reduce distortion with this projection by using an interrupted version of it.
Airy's Minimum-Error Azimuthal Projection
• This azimuthal projection is an analytic solution to the problem of minimizing shape and area error in a map projection:
• Such a solution is possible when the area to be depicted is a circle on the globe, since then the symmetry involved means that the resulting projection must be azimuthal. For maps of the whole world, only approximate polynomial projections have been found through numerical methods.

Airy's minimum error azimuthal projection
The fundamental theory of error in map projections is based on Tissot's Indicatrix. At each point on the map, an infinitesimal circle on the globe will be mapped to an infinitesimal ellipse. Scale up that ellipse to finite size, by dividing by the size of the infinitesimal circle on the globe, and its semimajor axis is a, and its semiminor axis is b.
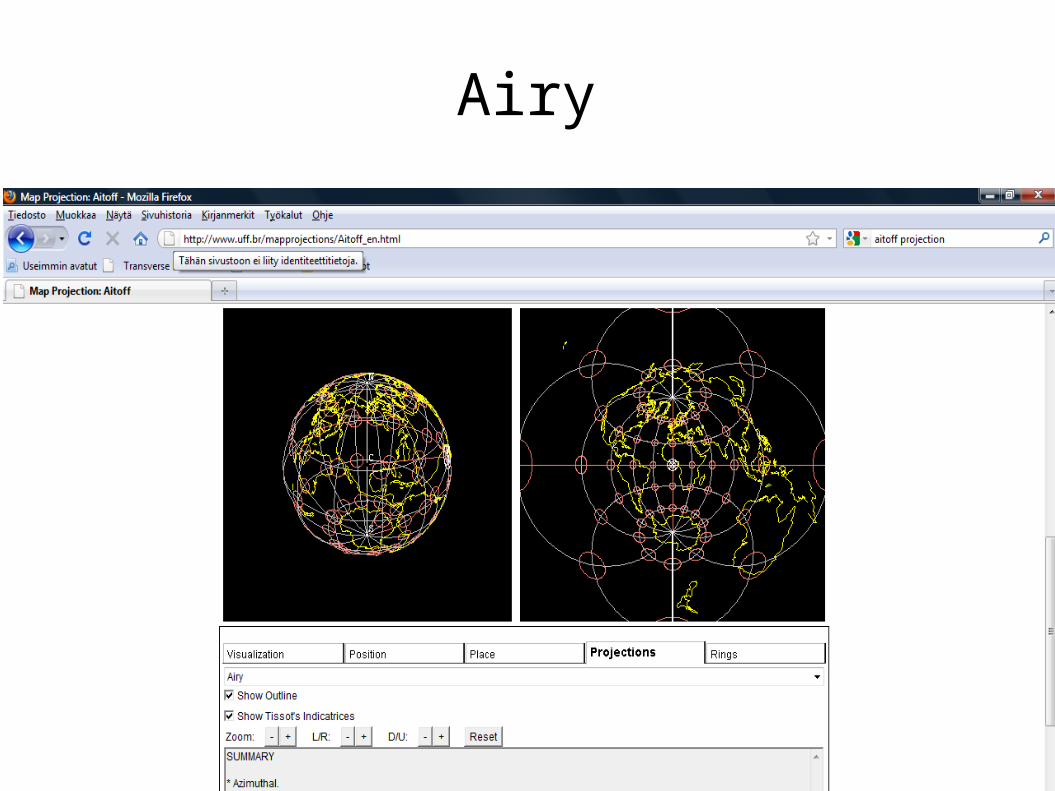
Airy
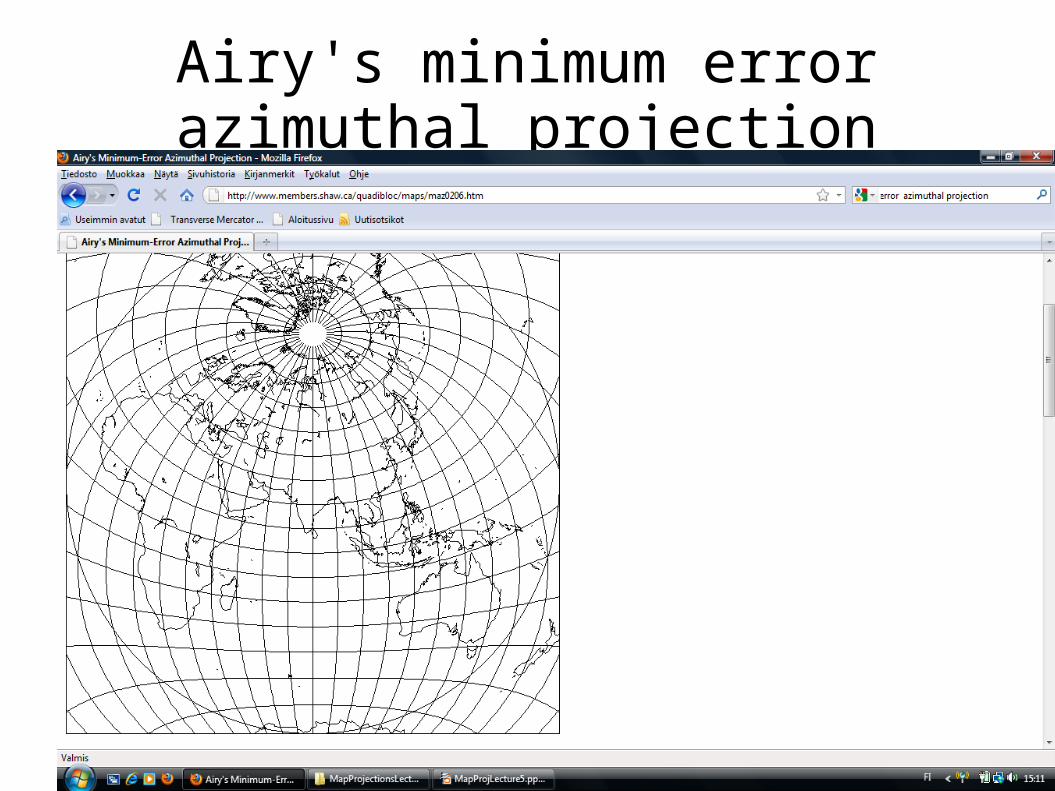
Airy's minimum error azimuthal projection

Summary
http://www.progonos.com/furuti/MapProj/Normal/ProjTbl/projTbl.html