Embed Size (px)
Citation preview
8/3/2019 Ax 021319326
http://slidepdf.com/reader/full/ax-021319326 1/8
Thakur V.M., Pachpor P.D. / International Journal of Engineering Research and
Applications (IJERA) ISSN: 2248-9622 www.ijera.com
Vol. 2, Issue 1, Jan-Feb. 2012, pp. 319-326
319 | P a g e
Seismic Analysis of Multistoried Building with TMD
(Tuned Mass Damper)Thakur V.M.
1, Pachpor P.D.
2
1- Assistant Professor, Civil Engineering Dept., Shri Ramdeobaba College of Engineering and
Management, Nagpur, India.
2- Associate Professor, Civil Engineering Dept., Shri Ramdeobaba College of Engineering and
Management, Nagpur, India.
AbstractTuned Mass Damper (TMD) is a passive control device which absorbs energy & reduces response of
vibration. It is attached to vibratory system. TMD is considered to have same damping ratio as that of main
structure. The effect of TMD with optimum parameters (frequency ratio & mass ration) given by Sadek, F
(1997), is studied. In this paper TMD is used as soft story which is considered to be made up of RCC,
constructed at the top of the building. A six storied building with rectangular shape is considered for
analysis. Analysis is done by FE software SAP 2000 by using direct integration approach. TMDs with
percentage masses 2% & 3% are considered. Three different recorded time histories of past EQ. are used
for the analysis. Comparison is done between the buildings with TMD and without TMD.
Keywords: Dynamic responses, Free vibration characteristics, Optimum parameters, TMD.
1.Introduction
Fast urbanization has led to construction of a large number of multistoried buildings. Seismic safety of
these building is of importance. Efforts have led to development of techniques like base isolation, active
control and passive control devices.
Base isolation technique is shown to be quite effective and it requires insertion of isolation device at the
foundation level, which may require constant maintenance. Active control techniques turn out to be quite
costly for buildings, as they need continuous power supply. In developing countries like India, such control
devices can become popular only if they are easy to construct. Their design method is compatible with
present practices and shall not require costly maintenance.
With the aim of developing such a simple control device, some studies have been undertaken in last couple
of years. In these studies a simple type of Tuned Mass Damper (TMD) has been proposed. A tuned mass
damper (TMD) is a passive energy dissipation device, consists of a mass, spring, and a damper, connected
to the structure in order to reduce the dynamic vibrations induced by wind or earthquake loads. The soft
storey will be made up of concrete and its columns, beams, and slab sizes will be smaller than columns,
beams, and slab sizes other stories of the building1. The height, member sizes of soft storey will be devised
based on the principle of TMD i.e. the natural frequency of TMD (soft storey) should have same natural
frequency as that of main building.
Bakre, S.V. (2002), weak soft storey at building top decreases the seismic response of building. Thawre,
R.Y(2004). Increase in percentage of mass ratio of TMD increases the effectiveness of TMD. Pinkaew T.,
Lukkunaprasit P. And Chatupote P. (2003) investigated the effectiveness of TMD under ground motion.
Although TMD cannot reduce the peak displacement of the controlled structure after yielding, it could
significantly reduce damage of the structure. Sadek, F (1997), found that for a TMD to be optimum, its
natural frequency should be very close to the natural frequency of the structure and its damping ratio should
be more that of the structure.
8/3/2019 Ax 021319326
http://slidepdf.com/reader/full/ax-021319326 2/8
Thakur V.M., Pachpor P.D. / International Journal of Engineering Research and
Applications (IJERA) ISSN: 2248-9622 www.ijera.com
Vol. 2, Issue 1, Jan-Feb. 2012, pp. 319-326
320 | P a g e
1.1Tuned Mass Damper
Sadek, F (1997), proposed optimum parameters of TMD. These optimum parameters include optimum
frequency ratio and mass ratio. TMD with optimum frequency ratio given by Sadek, F (1997), is
considered. This TMD being made up of concrete has same damping ratio as that of the main building.TMD is considered to have rectangular columns with nearly same B/D ratio.
2. Analysis of buildings with TMD
In this building with TMD of same damping as that of the main building are analyzed using direct
integration approach. Response of rectangular plan shape building is obtained under three past-recorded
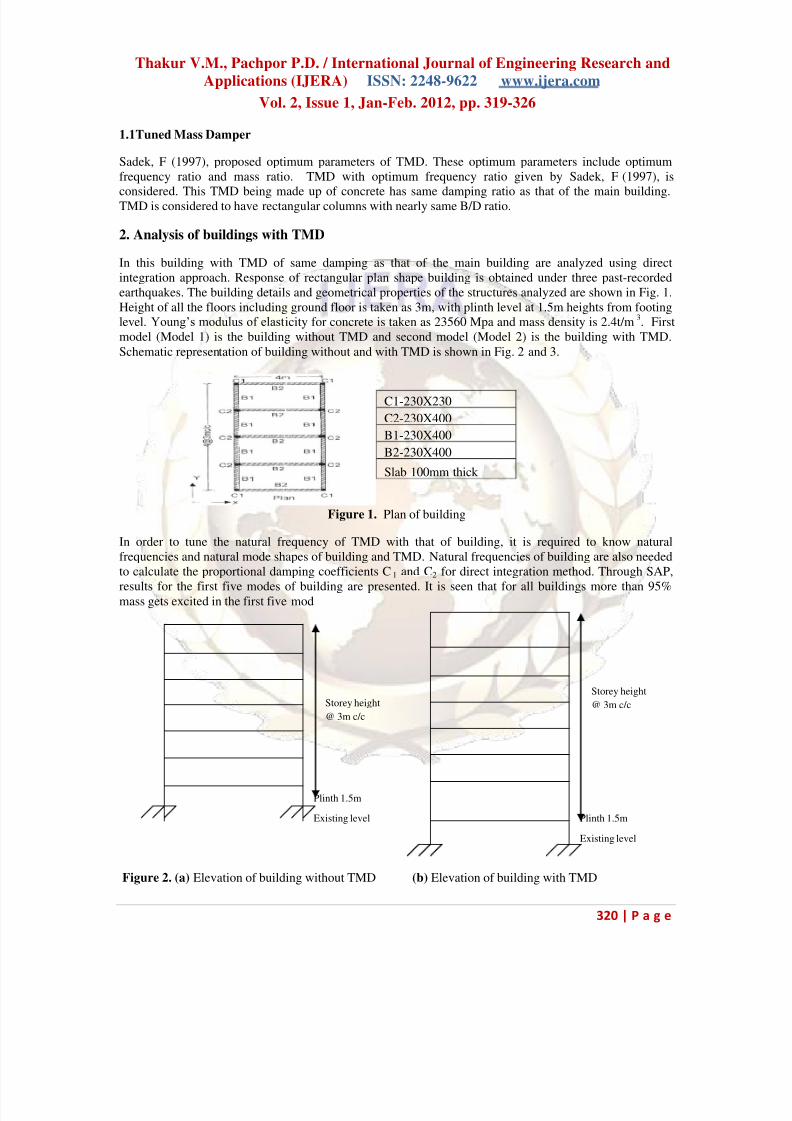
earthquakes. The building details and geometrical properties of the structures analyzed are shown in Fig. 1.
Height of all the floors including ground floor is taken as 3m, with plinth level at 1.5m heights from footing
level. Young’s modulus of elasticity for concrete is taken as 23560 Mpa and mass density is 2.4t/m3. First
model (Model 1) is the building without TMD and second model (Model 2) is the building with TMD.
Schematic representation of building without and with TMD is shown in Fig. 2 and 3.
Figure 1. Plan of building
In order to tune the natural frequency of TMD with that of building, it is required to know natural
frequencies and natural mode shapes of building and TMD. Natural frequencies of building are also needed
to calculate the proportional damping coefficients C1 and C2 for direct integration method. Through SAP,
results for the first five modes of building are presented. It is seen that for all buildings more than 95%mass gets excited in the first five mod
Figure 2. (a) Elevation of building without TMD (b) Elevation of building with TMD
C1-230X230
C2-230X400
B1-230X400
B2-230X400
Slab 100mm thick
Plinth 1.5m
Storey height
@ 3m c/c
Storey height
@ 3m c/c
Plinth 1.5mExisting level
Existing level
8/3/2019 Ax 021319326
http://slidepdf.com/reader/full/ax-021319326 3/8
Thakur V.M., Pachpor P.D. / International Journal of Engineering Research and
Applications (IJERA) ISSN: 2248-9622 www.ijera.com
Vol. 2, Issue 1, Jan-Feb. 2012, pp. 319-326
321 | P a g e
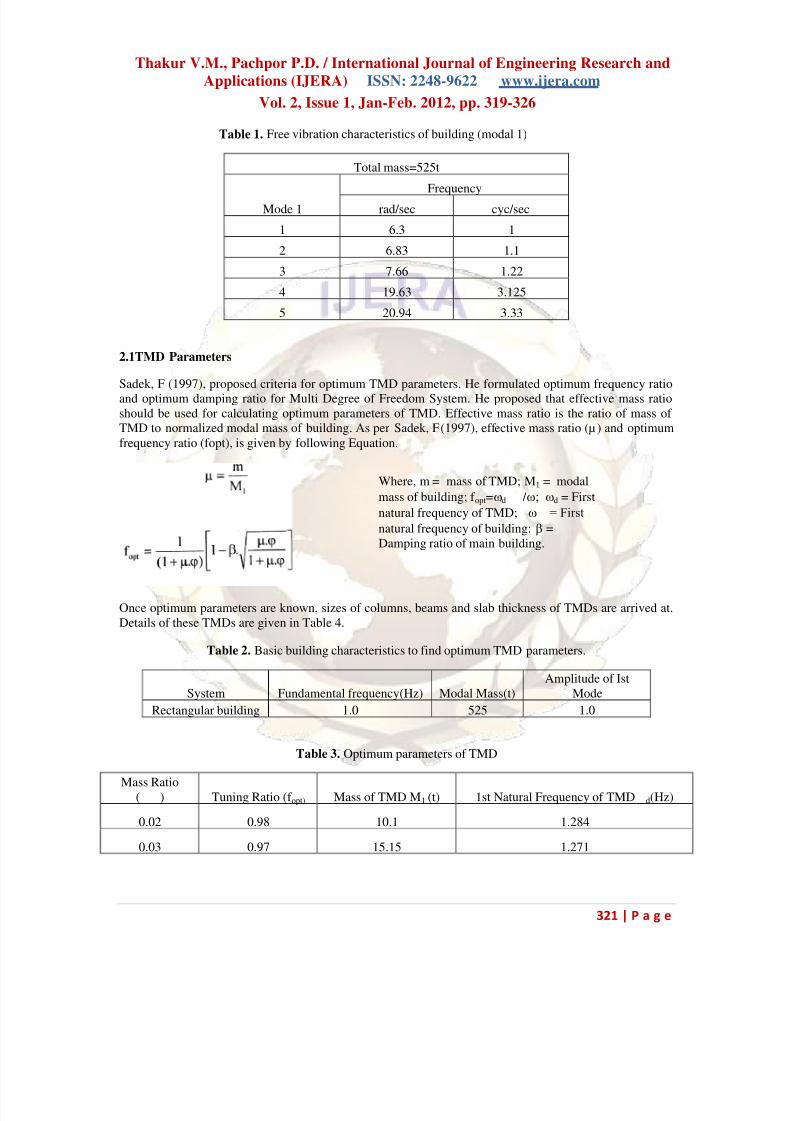
Table 1. Free vibration characteristics of building (modal 1)
Total mass=525t
Mode 1
Frequency
rad/sec cyc/sec
1 6.3 1
2 6.83 1.1
3 7.66 1.22
4 19.63 3.125
5 20.94 3.33
2.1TMD Parameters
Sadek, F (1997), proposed criteria for optimum TMD parameters. He formulated optimum frequency ratio
and optimum damping ratio for Multi Degree of Freedom System. He proposed that effective mass ratio
should be used for calculating optimum parameters of TMD. Effective mass ratio is the ratio of mass of
TMD to normalized modal mass of building. As per Sadek, F (1997), effective mass ratio (µ ) and optimum
frequency ratio (fopt), is given by following Equation.
Once optimum parameters are known, sizes of columns, beams and slab thickness of TMDs are arrived at.
Details of these TMDs are given in Table 4.
Table 2. Basic building characteristics to find optimum TMD parameters.
System Fundamental frequency(Hz) Modal Mass(t)
Amplitude of Ist
Mode
Rectangular building 1.0 525 1.0
Table 3. Optimum parameters of TMD
Mass Ratio( ) Tuning Ratio (f opt) Mass of TMD M1 (t) 1st Natural Frequency of TMD d(Hz)
0.02 0.98 10.1 1.284
0.03 0.97 15.15 1.271
Where, m = mass of TMD; M1 = modal
mass of building; f opt=d / d = First
natural frequency of TMD; = First
natural frequency of building; =
Damping ratio of main building.
8/3/2019 Ax 021319326
http://slidepdf.com/reader/full/ax-021319326 4/8
Thakur V.M., Pachpor P.D. / International Journal of Engineering Research and
Applications (IJERA) ISSN: 2248-9622 www.ijera.com
Vol. 2, Issue 1, Jan-Feb. 2012, pp. 319-326
322 | P a g e
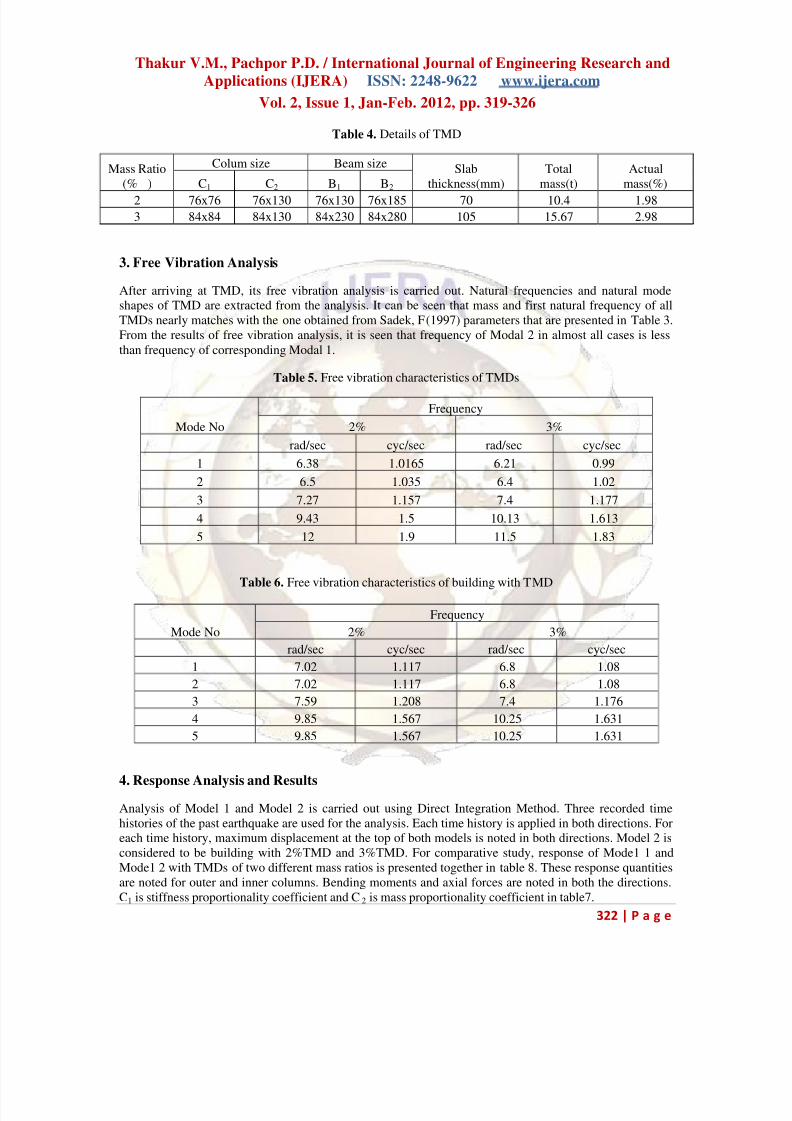
Table 4. Details of TMD
Mass Ratio
(% )
Colum size Beam size Slab
thickness(mm)
Total
mass(t)
Actual
mass(%)C1 C2 B1 B2
2 76x76 76x130 76x130 76x185 70 10.4 1.98
3 84x84 84x130 84x230 84x280 105 15.67 2.98
3. Free Vibration Analysis
After arriving at TMD, its free vibration analysis is carried out. Natural frequencies and natural mode
shapes of TMD are extracted from the analysis. It can be seen that mass and first natural frequency of all
TMDs nearly matches with the one obtained from Sadek, F (1997) parameters that are presented in Table 3.
From the results of free vibration analysis, it is seen that frequency of Modal 2 in almost all cases is less
than frequency of corresponding Modal 1.
Table 5. Free vibration characteristics of TMDs
Mode No
Frequency
2% 3%
rad/sec cyc/sec rad/sec cyc/sec
1 6.38 1.0165 6.21 0.99
2 6.5 1.035 6.4 1.02
3 7.27 1.157 7.4 1.177
4 9.43 1.5 10.13 1.613
5 12 1.9 11.5 1.83
Table 6. Free vibration characteristics of building with TMD
Mode No
Frequency
2% 3%
rad/sec cyc/sec rad/sec cyc/sec
1 7.02 1.117 6.8 1.08
2 7.02 1.117 6.8 1.08
3 7.59 1.208 7.4 1.176
4 9.85 1.567 10.25 1.631
5 9.85 1.567 10.25 1.631
4. Response Analysis and Results
Analysis of Model 1 and Model 2 is carried out using Direct Integration Method. Three recorded time
histories of the past earthquake are used for the analysis. Each time history is applied in both directions. For
each time history, maximum displacement at the top of both models is noted in both directions. Model 2 is
considered to be building with 2%TMD and 3%TMD. For comparative study, response of Mode1 1 and
Mode1 2 with TMDs of two different mass ratios is presented together in table 8. These response quantities
are noted for outer and inner columns. Bending moments and axial forces are noted in both the directions.
C1 is stiffness proportionality coefficient and C2 is mass proportionality coefficient in table7.
8/3/2019 Ax 021319326
http://slidepdf.com/reader/full/ax-021319326 5/8
Thakur V.M., Pachpor P.D. / International Journal of Engineering Research and
Applications (IJERA) ISSN: 2248-9622 www.ijera.com
Vol. 2, Issue 1, Jan-Feb. 2012, pp. 319-326
323 | P a g e
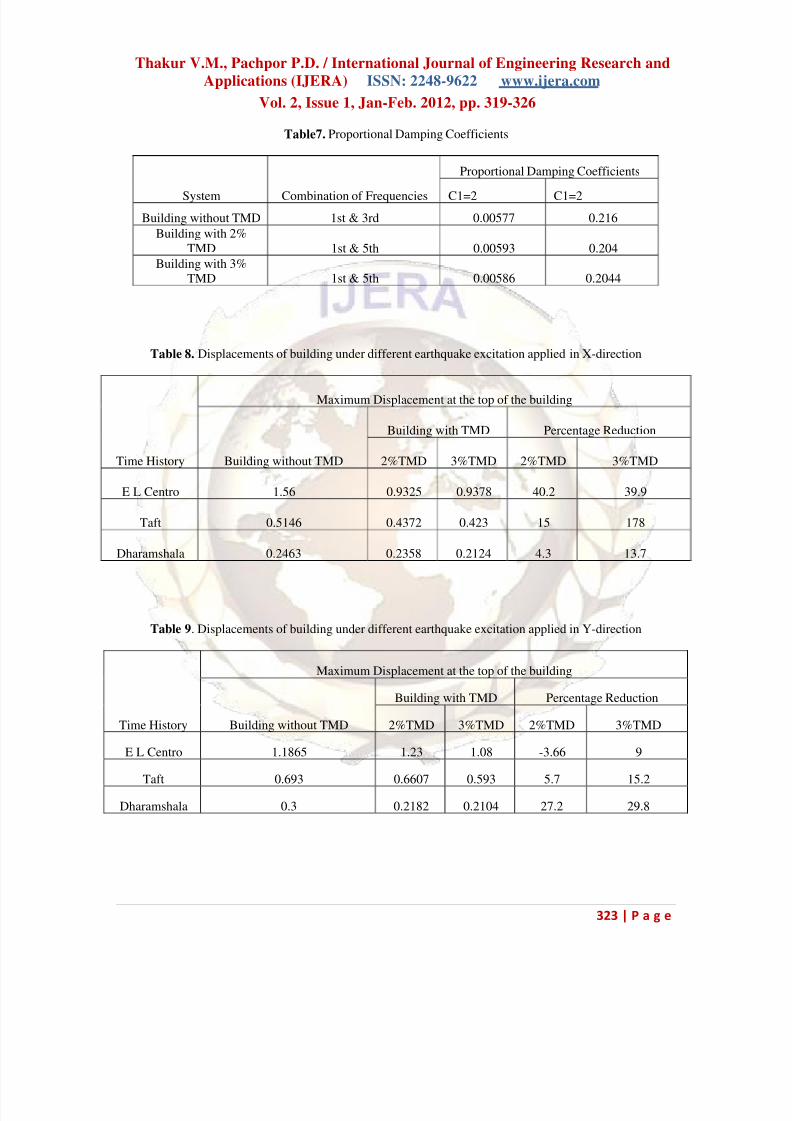
Table7. Proportional Damping Coefficients
System Combination of Frequencies
Proportional Damping Coefficients
C1=2 C1=2
Building without TMD 1st & 3rd 0.00577 0.216
Building with 2%
TMD 1st & 5th 0.00593 0.204
Building with 3%
TMD 1st & 5th 0.00586 0.2044
Table 8. Displacements of building under different earthquake excitation applied in X-direction
Time History
Maximum Displacement at the top of the building
Building without TMD
Building with TMD Percentage Reduction
2%TMD 3%TMD 2%TMD 3%TMD
E L Centro 1.56 0.9325 0.9378 40.2 39.9
Taft 0.5146 0.4372 0.423 15 178
Dharamshala 0.2463 0.2358 0.2124 4.3 13.7
Table 9. Displacements of building under different earthquake excitation applied in Y-direction
Time History
Maximum Displacement at the top of the building
Building without TMD
Building with TMD Percentage Reduction
2%TMD 3%TMD 2%TMD 3%TMD
E L Centro 1.1865 1.23 1.08 -3.66 9
Taft 0.693 0.6607 0.593 5.7 15.2
Dharamshala 0.3 0.2182 0.2104 27.2 29.8
8/3/2019 Ax 021319326
http://slidepdf.com/reader/full/ax-021319326 6/8
Thakur V.M., Pachpor P.D. / International Journal of Engineering Research and
Applications (IJERA) ISSN: 2248-9622 www.ijera.com
Vol. 2, Issue 1, Jan-Feb. 2012, pp. 319-326
324 | P a g e
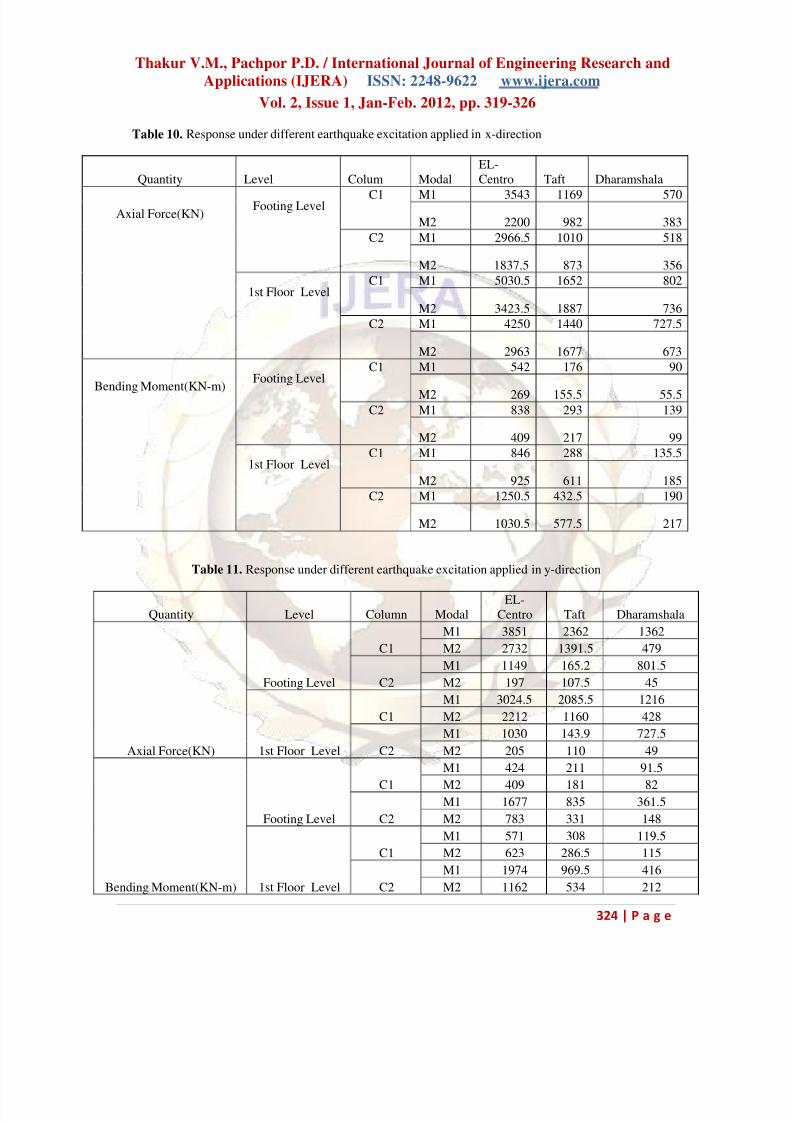
Table 10. Response under different earthquake excitation applied in x-direction
Quantity Level Colum Modal
EL-
Centro Taft Dharamshala
Axial Force(KN)Footing Level C1 M1 3543 1169 570
M2 2200 982 383
C2 M1 2966.5 1010 518
M2 1837.5 873 356
1st Floor LevelC1 M1 5030.5 1652 802
M2 3423.5 1887 736
C2 M1 4250 1440 727.5
M2 2963 1677 673
Bending Moment(KN-m)
Footing LevelC1 M1 542 176 90
M2 269 155.5 55.5C2 M1 838 293 139
M2 409 217 99
1st Floor LevelC1 M1 846 288 135.5
M2 925 611 185
C2 M1 1250.5 432.5 190
M2 1030.5 577.5 217
Table 11. Response under different earthquake excitation applied in y-direction
Quantity Level Column Modal
EL-
Centro Taft Dharamshala
Axial Force(KN)
Footing Level
C1
M1 3851 2362 1362
M2 2732 1391.5 479
C2
M1 1149 165.2 801.5
M2 197 107.5 45
1st Floor Level
C1
M1 3024.5 2085.5 1216
M2 2212 1160 428
C2
M1 1030 143.9 727.5
M2 205 110 49
Bending Moment(KN-m)
Footing Level
C1
M1 424 211 91.5
M2 409 181 82
C2
M1 1677 835 361.5
M2 783 331 148
1st Floor Level
C1
M1 571 308 119.5
M2 623 286.5 115
C2
M1 1974 969.5 416
M2 1162 534 212
8/3/2019 Ax 021319326
http://slidepdf.com/reader/full/ax-021319326 7/8
Thakur V.M., Pachpor P.D. / International Journal of Engineering Research and
Applications (IJERA) ISSN: 2248-9622 www.ijera.com
Vol. 2, Issue 1, Jan-Feb. 2012, pp. 319-326
325 | P a g e
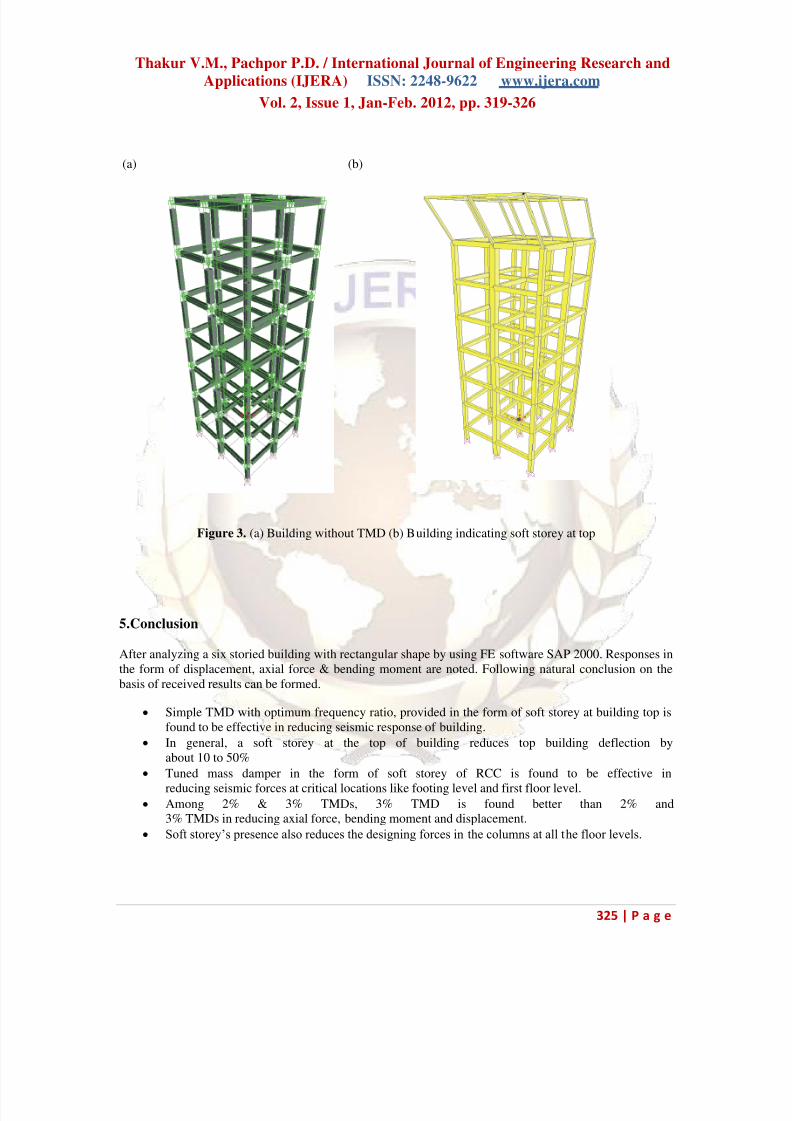
(a) (b)
Figure 3. (a) Building without TMD (b) Building indicating soft storey at top
5.Conclusion
After analyzing a six storied building with rectangular shape by using FE software SAP 2000. Responses in
the form of displacement, axial force & bending moment are noted. Following natural conclusion on the
basis of received results can be formed.
Simple TMD with optimum frequency ratio, provided in the form of soft storey at building top is
found to be effective in reducing seismic response of building.
In general, a soft storey at the top of building reduces top building deflection by
about 10 to 50%
Tuned mass damper in the form of soft storey of RCC is found to be effective in
reducing seismic forces at critical locations like footing level and first floor level. Among 2% & 3% TMDs, 3% TMD is found better than 2% and
3% TMDs in reducing axial force, bending moment and displacement.
Soft storey’s presence also reduces the designing forces in the columns at all the floor levels.

8/3/2019 Ax 021319326
http://slidepdf.com/reader/full/ax-021319326 8/8
Thakur V.M., Pachpor P.D. / International Journal of Engineering Research and
Applications (IJERA) ISSN: 2248-9622 www.ijera.com
Vol. 2, Issue 1, Jan-Feb. 2012, pp. 319-326
326 | P a g e
6.References1. Bakre, S.V. (2002), “Seismic response of multistoried buildings with Weak storey at
the top”, National seminar on structural dynamics in civil engineering (SDCE-2002), 18-19th July 2002,
IISc Bangalore.
2. Thawre, R.Y(2004) “Seismic analysis of multistoried buildings with TMD”,submitted as M.Tech. Thesis, VRCE Nagpur.
3. Pinkaew T., Lukkunaprasit P. And Chatupote P. (2003), “Seismic effectiveness of tuned mass dampers
for damage reduction on structures”, Engineering Structures, 25, 39-46.
4. Sadek, F (1997), “A method of estimating the pa r a m e t e r s TMD for seismic applications”,
Earthquake Engineering and Structural Dynamics, 26, 617-635.