Embed Size (px)
Citation preview
AvivaSA Emeklilik ve Hayat A.Ş.
Market Consistent Embedded Value Report
Half-year 2015
Market Consistent Embedded Value Report – Half-year 2015
AvivaSA Emeklilik ve Hayat A.Ş. – Actuarial Department 2
Market Consistent Embedded Value Report
1. Introduction 3
2. Definition of Embedded Value 3
3. Covered business 3
4. Methodology and components of MCEV 4
4.1. Shareholders’ net worth 4
4.2. Value of in-force covered business 4
5. Value of new business 5
6. Additional matters relating to the MCEV methodology 6
7. Assumptions 6
7.1. Economic assumptions 6
7.2. Non-economic assumptions 8
8. Market Consistent Embedded Value Results 9
9. Reconciliation from IFRS shareholders’ equity to MCEV shareholders’ net worth 10
10. Analysis of MCEV Earnings 11
11. New business results 13
12. Sensitivity analysis 15
13. Differences between reported Aviva plc MCEV disclosures 16
14. Statement of Directors’ responsibilities ın respect of the MCEV basis 16
15. Independent opinion 18
16. Appendix A: New pension legislation 21
Market Consistent Embedded Value Report – Half-year 2015
AvivaSA Emeklilik ve Hayat A.Ş. – Actuarial Department 3
Market Consistent Embedded Value Report
1. Introduction
Embedded value is a reporting metric specifically developed for long-term life insurance and pension business
over the years. It aims to overcome the known shortcomings of accounting metrics by taking into account of
the projected cash flows throughout the lifetime of the products using best estimate assumptions. This is
necessary to give a more realistic picture of the profitability of the long-term life insurance products since
writing new business leads to a loss on day one. The projected expected profits arising out of the cash flows
are adjusted by a risk allowance to reflect the inherent uncertainties of such projection. Additionally, there is
an allowance for cost of capital, to reflect cost of holding capital. This report should not be considered as a
substitute for AvivaSA’s primary financial statements.
This report provides the Market Consistent Embedded Value (MCEV) results of AvivaSA on a 100%
ownership basis as of June 30, 2015 and the value of new business and related metrics for the six months
ended June 30, 2015.
2. Definition of Embedded Value
MCEV represents the present value of shareholders’ interests in the earnings distributable from assets
allocated to the covered business after making sufficient allowance for the aggregate risks in the covered
business, plus the shareholders’ net worth. The allowance for risk is calibrated to match the market price for
risk where reliably observable.
The value of future new business is excluded from the MCEV. New business is defined as business arising
from the sale of new contracts and includes expected renewals on those contracts (noting the exception for
yearly renewable life insurance term business, which is detailed below in section 6) and expected future
contractual alterations to those contracts. Non-contractual increases in premiums, such as additional
contributions to the pensions business, is included within new business. For group pension business, new
business is defined as newly obtained schemes or additions of members to existing schemes.
The results have been prepared under the European Insurance CFO Forum Market Consistent Embedded
Value Principles (‘‘MCEV Principles’’) © (Copyright © Stichting CFO Forum Foundation 2008) published
October 2009.
Calculations are performed after allowing for reinsurance and on an after-tax basis applying current legislation
and practice, together with future known and certain changes.
The methodology, assumptions and results have been reviewed by Deloitte. Their opinion is included in
section 15.
3. Covered business
The MCEV Principles draw a distinction between “covered business” to which the MCEV methodology is
applied, and “non-covered business” which is reported on an unadjusted IFRS net asset value basis. All of
AvivaSA’s business is regarded as covered business for purposes of MCEV reporting as all of the company’s
business is related to insurance business and the assets backing that business. As such, no non-covered
business or a Group MCEV are presented.
Market Consistent Embedded Value Report – Half-year 2015
AvivaSA Emeklilik ve Hayat A.Ş. – Actuarial Department 4
4. Methodology and components of MCEV
MCEV consists of the aggregate of shareholders’ net worth and the value of in-force business relating to the
covered business.
4.1. Shareholders’ net worth
Shareholders’ net worth is defined as the market value of assets allocated to the covered business not required
to back the in-force regulatory liabilities at the valuation date. The shareholders’ net worth is calculated on the
basis of the local regulatory surplus.
The shareholders’ net worth is comprised of required capital and free surplus. The required capital is the
market value of assets allocated to the covered business over and above that required to back liabilities for the
covered business, whose distribution to shareholders is restricted. The required capital is defined as 150% of
the Turkish regulatory capital requirements, as this is approximately the internal capital target level.
The free surplus is the market value of any assets allocated to, but not required to back liabilities or support
required capital, the in-force covered business at the valuation date. The free surplus excludes any DAC asset.
A reconciliation of the shareholders’ net worth and the IFRS shareholders’ equity (referred to as “IFRS net
asset value” in the MCEV Principles) is provided under section 8.
4.2. Value of in-force covered business
The in-force portfolio consists of policies underwritten up to the valuation date and excluding future new
business.
The value of in-force (VIF) of covered business is the value arising from the in-force portfolio, and consists of
the following components:
the present value of future profits (PVFP), where profits are post taxation shareholder cash flows from
the in-force covered business and the assets backing the associated liabilities;
the time value of financial options and guarantees (TVOG);
the frictional costs of required capital (FC); and
the costs of residual non-hedgeable risks (CNHR).
The methodology used to calculate each of these components is set out below.
Present value of future profits (PVFP)
The PVFP is the present value of the profits distributable to shareholders arising from the in-force covered
business projected on a best estimate basis. Distributable profits generally arise when they are released
following valuations carried out in accordance with Turkish regulatory requirements, which are designed to
demonstrate and ensure solvency.
Future distributable profits are projected using best estimate non-economic assumptions and market consistent
economic assumptions. The PVFP is calculated using the certainty equivalent approach, consistent with
MCEV Principles, under which the same reference rate is used for both the projected investment return and
the discount rate.
Market Consistent Embedded Value Report – Half-year 2015
AvivaSA Emeklilik ve Hayat A.Ş. – Actuarial Department 5
Time value of financial options and guarantees (TVOG)
An allowance for TVOG must be required with respect to Principle 7 where policyholders are provided with
financial options and guarantees. The material guarantees are present for only certain unit-linked life savings
contracts which is in run-off. For certain unit-linked life savings contracts, the policyholder has been provided
with financial guarantees around the level of financial return on its investment. The analysis carried out to
determine the TVOG indicates that the financial guarantees is immaterial due to the size of the unit-linked life
savings and the high interest rate environment in Turkey relative to the guaranteed level of financial return on
the contracts. Therefore, the TVOG for all covered business has been set to nil.
Frictional costs of required capital (FC)
The FC reflects the present value of additional costs to shareholders of holding the assets backing required
capital within an insurance company. The frictional costs allowed for are the taxation costs applicable to
investment returns and any additional investment expenses on the assets backing the required capital. These
frictional costs are projected and then discounted at the reference rate to determine the FC.
Cost of residual non-hedgeable risks (CNHR)
The CNHR allows for risks which have not been sufficiently allowed for elsewhere in the valuation. The
allowance for relevant risks within the CNHR, including but not limited to:
potential regulatory action and uncertainty around further capping of the pension business fees;
operational risk, in so far this has generally not been allowed for elsewhere, e.g., in the expense
assumptions, additional costs of not completing the Metamorphosis IT project as planned;
actual experience can vary from best estimate assumptions (including mortality, mass lapse and
expenses) and some allowance for uncertainty has been made; and
counterparty default risk of business partners.
The CNHR is allowed by using a ‘cost of capital’ approach, where the charge assumed has been set to ensure
that the total CNHR is sufficient to meet the impact of the risks considered as outlined above. The CNHR has
been calculated by projecting the relevant risk capital using appropriate risk drivers over the term of the
business. The reference rate has been used as the discount rate for this calculation.
The CNHR calculation allows for diversification between different non-hedgeable risks. No diversification
between hedgeable and non-hedgeable risk has been allowed for.
5. Value of new business
The value of new business (VNB) is calculated consistently with the VIF and represents the value arising from
new business written in the six months ended June 30, 2015.
The VNB consists of the present value of future distributable profits of business written in the relevant
reporting period, with allowance for related CNHR, FC and TVOG. This is calculated using a point of sale
approach where separate calculations are carried out for each quarter’s new business, using economic
assumptions at the end of the previous quarter and throughout using non-economic assumptions as of the
valuation date June 30, 2015.
Market Consistent Embedded Value Report – Half-year 2015
AvivaSA Emeklilik ve Hayat A.Ş. – Actuarial Department 6
6. Additional matters relating to the MCEV methodology
Pension fees
The Treasury has issued a new pension legislation (Bireysel Emeklilik Sistemi Hakkında Yönetmelikte
Değişiklik Yapılmasına Dair Yönetmelik, Number: 29366) on the 25th of May, 2015, which is expected to
come in-force from 1st of January 2016. However, the consultation process with the pension companies and
other stakeholders was still ongoing to clarify certain elements of the new legislation whilst the preparation of
this report. A summary of the new legislation affecting the pension fees is given in appendix A.
Given the uncertainty around the outcome of the consultation process, AvivaSA does not consider it
appropriate (consistent with MCEV Principles G11.15) at this stage to incorporate in its MCEV and VNB
results the proposed fee structure. The impact of the legislation will be brought through at full-year 2015
MCEV results once the legislation is finalised, which is expected to be in late 2015.
Treatment of yearly renewable term assurance
All yearly renewable products are assumed to have a term of one year only as there is currently not yet
sufficient experience of the yearly renewable business to set a renewal assumption with confidence. Any
renewals on the in-force business are classified as new business. Given the current volumes of in-force and
new yearly renewable products, the methodology set out here does not have a material impact on the VIF or
VNB.
Policy data treatment as of the valuation date
For half-year reporting, the in-force business data is extracted from the administration systems as of May 31
rather than June 30. The position as of June 30 is then based on a roll-forward from May 31 to June 30 using a
basis consistent with that used in the MCEV. A check has been carried out that the 5+1 basis does not
materially distort the results. The value of new business and other new business metrics are based on six
months’ of actual policy data.
7. Assumptions
This section describes the key assumptions used by AvivaSA in preparing the MCEV results set out in this
section.
The projection assumptions used to value new business are consistent with those used to value in-force
business.
7.1. Economic assumptions
Reference rate
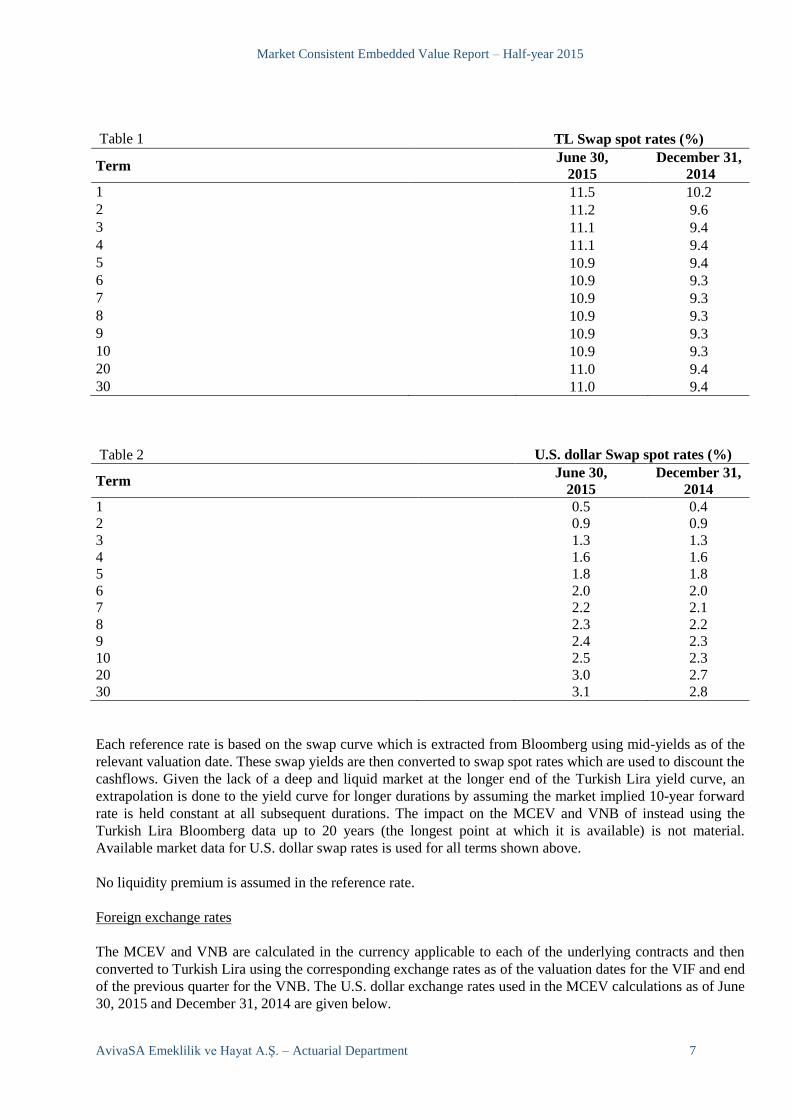
The table below sets out the reference rates used in the MCEV calculations as of June 30, 2015 and December
31, 2014 at sample durations, expressed in swap spot rates (%). For half-year reporting, 5+1 basis is used as
per the policy data treatment, effectively using swap spot rates and exchange rates as of 31 May, 2015. A
check has been carried out using interest rate sensitivities that the 5+1 basis does not materially distort the
results.
Market Consistent Embedded Value Report – Half-year 2015
AvivaSA Emeklilik ve Hayat A.Ş. – Actuarial Department 7
Table 1 TL Swap spot rates (%)
Term June 30,
2015
December 31,
2014
1 11.5 10.2
2 11.2 9.6
3 11.1 9.4
4 11.1 9.4
5 10.9 9.4
6 10.9 9.3
7 10.9 9.3
8 10.9 9.3
9 10.9 9.3
10 10.9 9.3
20 11.0 9.4
30 11.0 9.4
Table 2 U.S. dollar Swap spot rates (%)
Term June 30,
2015
December 31,
2014
1 0.5 0.4
2 0.9 0.9
3 1.3 1.3
4 1.6 1.6
5 1.8 1.8
6 2.0 2.0
7 2.2 2.1
8 2.3 2.2
9 2.4 2.3
10 2.5 2.3
20 3.0 2.7
30 3.1 2.8
Each reference rate is based on the swap curve which is extracted from Bloomberg using mid-yields as of the
relevant valuation date. These swap yields are then converted to swap spot rates which are used to discount the
cashflows. Given the lack of a deep and liquid market at the longer end of the Turkish Lira yield curve, an
extrapolation is done to the yield curve for longer durations by assuming the market implied 10-year forward
rate is held constant at all subsequent durations. The impact on the MCEV and VNB of instead using the
Turkish Lira Bloomberg data up to 20 years (the longest point at which it is available) is not material.
Available market data for U.S. dollar swap rates is used for all terms shown above.
No liquidity premium is assumed in the reference rate.
Foreign exchange rates
The MCEV and VNB are calculated in the currency applicable to each of the underlying contracts and then
converted to Turkish Lira using the corresponding exchange rates as of the valuation dates for the VIF and end
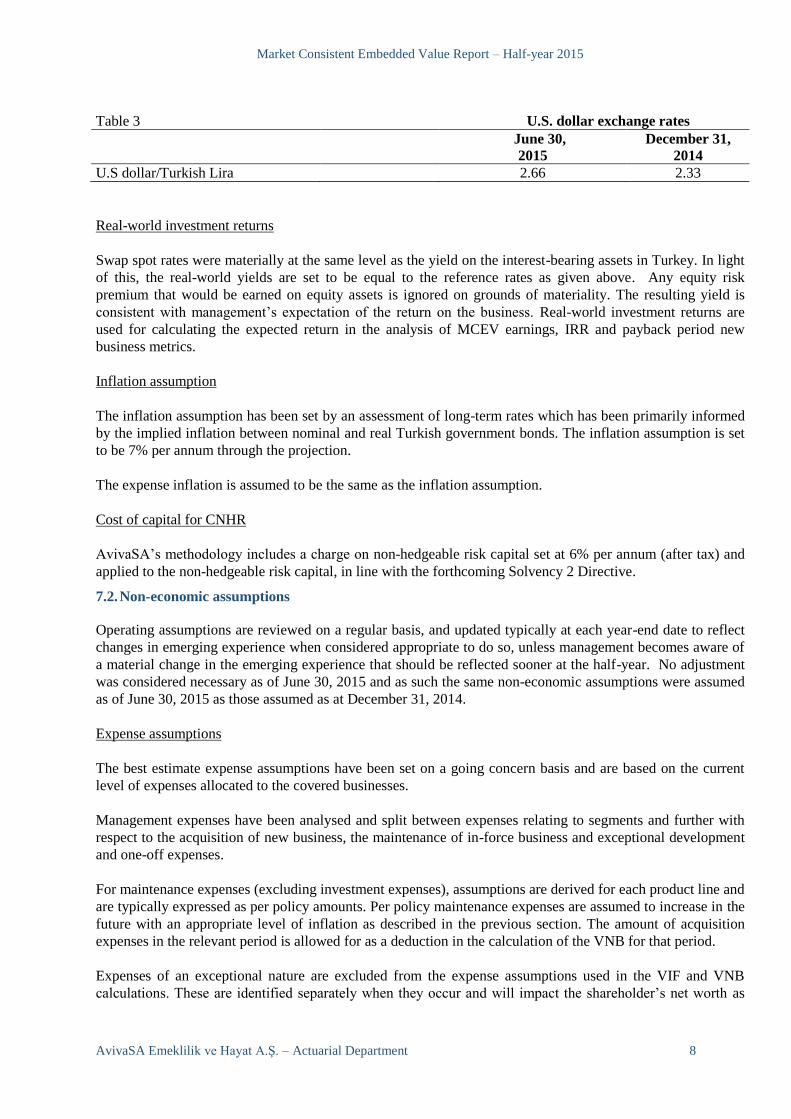
of the previous quarter for the VNB. The U.S. dollar exchange rates used in the MCEV calculations as of June
30, 2015 and December 31, 2014 are given below.
Market Consistent Embedded Value Report – Half-year 2015
AvivaSA Emeklilik ve Hayat A.Ş. – Actuarial Department 8
Table 3 U.S. dollar exchange rates
June 30,
2015
December 31,
2014
U.S dollar/Turkish Lira
2.66 2.33
Real-world investment returns
Swap spot rates were materially at the same level as the yield on the interest-bearing assets in Turkey. In light
of this, the real-world yields are set to be equal to the reference rates as given above. Any equity risk
premium that would be earned on equity assets is ignored on grounds of materiality. The resulting yield is
consistent with management’s expectation of the return on the business. Real-world investment returns are
used for calculating the expected return in the analysis of MCEV earnings, IRR and payback period new
business metrics.
Inflation assumption
The inflation assumption has been set by an assessment of long-term rates which has been primarily informed
by the implied inflation between nominal and real Turkish government bonds. The inflation assumption is set
to be 7% per annum through the projection.
The expense inflation is assumed to be the same as the inflation assumption.
Cost of capital for CNHR
AvivaSA’s methodology includes a charge on non-hedgeable risk capital set at 6% per annum (after tax) and
applied to the non-hedgeable risk capital, in line with the forthcoming Solvency 2 Directive.
7.2. Non-economic assumptions
Operating assumptions are reviewed on a regular basis, and updated typically at each year-end date to reflect
changes in emerging experience when considered appropriate to do so, unless management becomes aware of
a material change in the emerging experience that should be reflected sooner at the half-year. No adjustment
was considered necessary as of June 30, 2015 and as such the same non-economic assumptions were assumed
as of June 30, 2015 as those assumed as at December 31, 2014.
Expense assumptions
The best estimate expense assumptions have been set on a going concern basis and are based on the current
level of expenses allocated to the covered businesses.
Management expenses have been analysed and split between expenses relating to segments and further with
respect to the acquisition of new business, the maintenance of in-force business and exceptional development
and one-off expenses.
For maintenance expenses (excluding investment expenses), assumptions are derived for each product line and
are typically expressed as per policy amounts. Per policy maintenance expenses are assumed to increase in the
future with an appropriate level of inflation as described in the previous section. The amount of acquisition
expenses in the relevant period is allowed for as a deduction in the calculation of the VNB for that period.
Expenses of an exceptional nature are excluded from the expense assumptions used in the VIF and VNB
calculations. These are identified separately when they occur and will impact the shareholder’s net worth as
Market Consistent Embedded Value Report – Half-year 2015
AvivaSA Emeklilik ve Hayat A.Ş. – Actuarial Department 9
and when they are incurred. The bulk of the expenses are allocated to pensions business, which is due to the
higher start-up and maintenance costs compared to life protection business.
No future productivity gains were assumed in the MCEV.
Investment management expenses paid to third parties have been allowed for in the projections of future
cashflows.
AvivaSA is carrying out an activity based costing exercise to better support the cost allocation framework,
which will be taken into account during the expense assumption setting process for year-end 2015 reporting.
Demographic assumptions (including persistency and mortality)
Assumptions have been made in respect of future levels of lapses, morbidity, mortality, premium persistency
and surrenders. The assumptions reflect the best estimates of the likely future experience, and are based on
recent experience and relevant industry data, where available, and management judgment.
The assumptions for future mortality rates for the pensions, individual life and group whole life businesses are
based on the company’s experience to date. No allowance is made for the expected improvements in mortality
of the business.
The long-term value arising from pensions business is highly dependent on the persistency assumptions such
as surrenders and premium collection. These assumptions have been set with reference to AvivaSA’s
historical experience over a sufficiently long period to provide a credible estimate of future experience. No
allowance has been made for improvements in persistency rates.
Tax assumptions
The corporate tax rate assumptions used in the projection of the distributable earnings at each valuation date
has been set to the Turkish corporate tax rate of 20%.
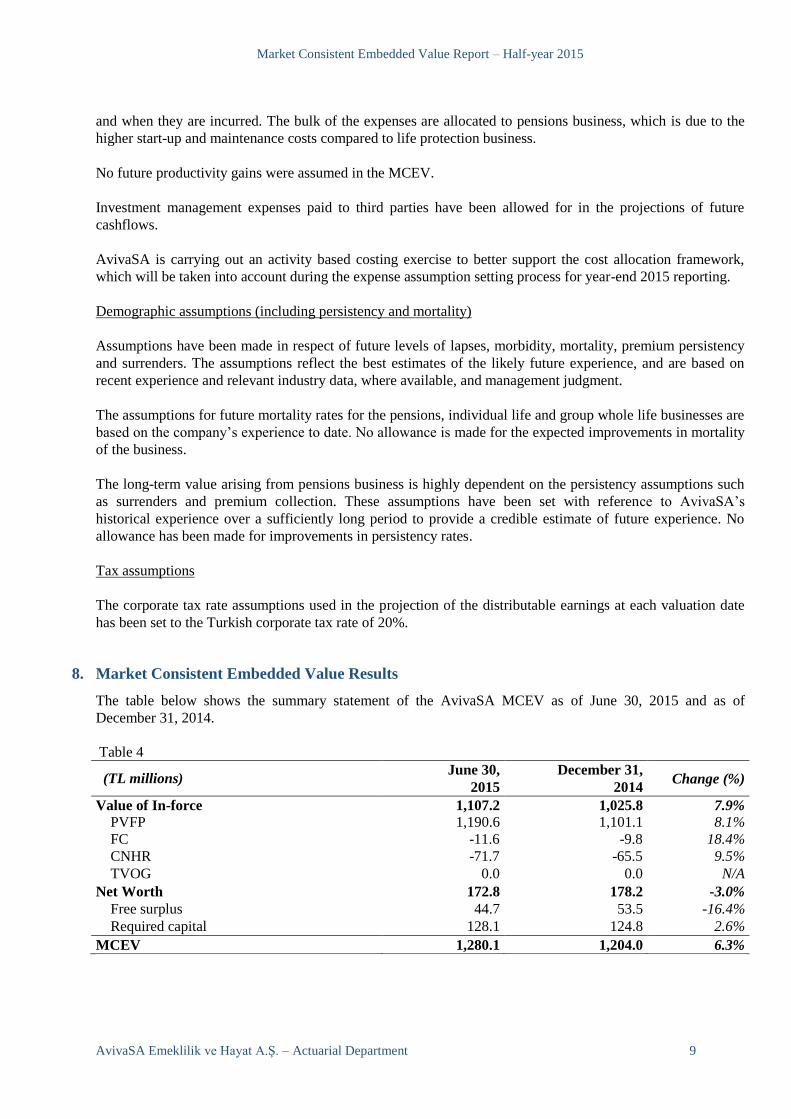
8. Market Consistent Embedded Value Results
The table below shows the summary statement of the AvivaSA MCEV as of June 30, 2015 and as of
December 31, 2014.
Table 4
(TL millions) June 30, December 31,
Change (%) 2015 2014
Value of In-force 1,107.2 1,025.8 7.9%
PVFP 1,190.6 1,101.1 8.1%
FC -11.6 -9.8 18.4%
CNHR -71.7 -65.5 9.5%
TVOG 0.0 0.0 N/A
Net Worth 172.8 178.2 -3.0%
Free surplus 44.7 53.5 -16.4%
Required capital 128.1 124.8 2.6%
MCEV 1,280.1 1,204.0 6.3%
Market Consistent Embedded Value Report – Half-year 2015
AvivaSA Emeklilik ve Hayat A.Ş. – Actuarial Department 10
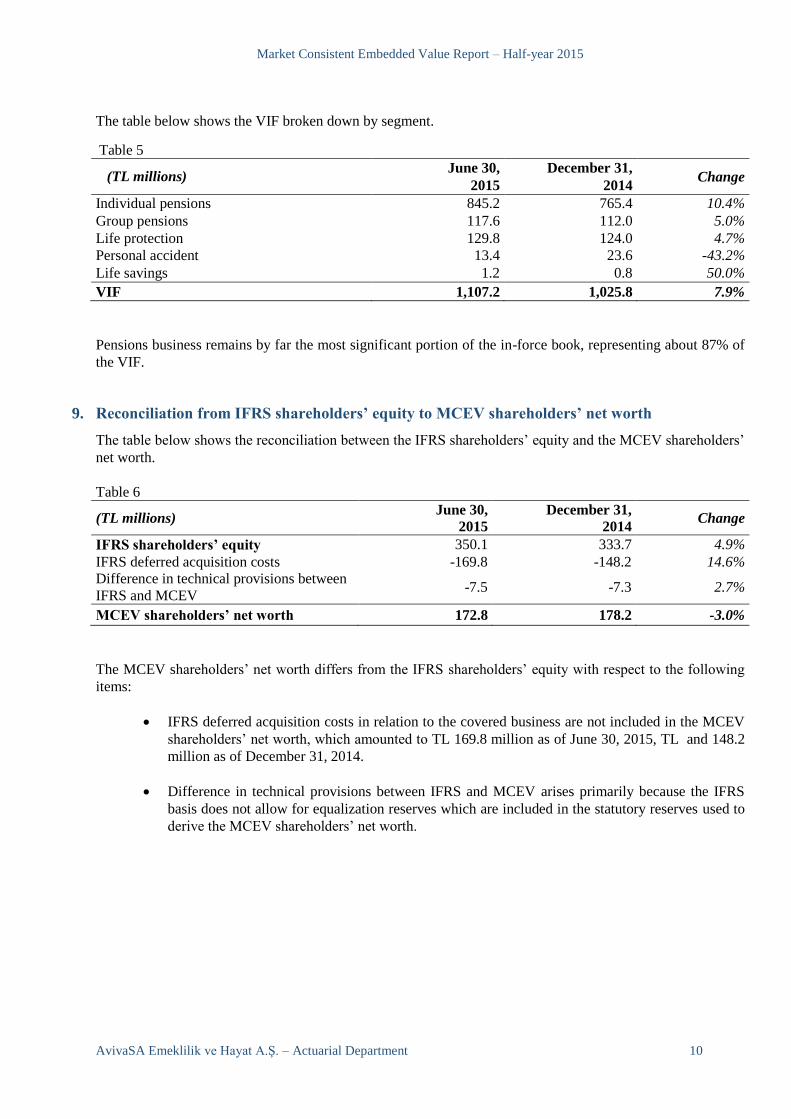
The table below shows the VIF broken down by segment.
Table 5
(TL millions) June 30, December 31,
Change 2015 2014
Individual pensions 845.2 765.4 10.4%
Group pensions 117.6 112.0 5.0%
Life protection 129.8 124.0 4.7%
Personal accident 13.4 23.6 -43.2%
Life savings 1.2 0.8 50.0%
VIF 1,107.2 1,025.8 7.9%
Pensions business remains by far the most significant portion of the in-force book, representing about 87% of
the VIF.
9. Reconciliation from IFRS shareholders’ equity to MCEV shareholders’ net worth
The table below shows the reconciliation between the IFRS shareholders’ equity and the MCEV shareholders’
net worth.
Table 6
(TL millions) June 30,
2015
December 31,
2014 Change
IFRS shareholders’ equity 350.1 333.7 4.9%
IFRS deferred acquisition costs -169.8 -148.2 14.6%
Difference in technical provisions between
IFRS and MCEV -7.5 -7.3 2.7%
MCEV shareholders’ net worth 172.8 178.2 -3.0%
The MCEV shareholders’ net worth differs from the IFRS shareholders’ equity with respect to the following
items:
IFRS deferred acquisition costs in relation to the covered business are not included in the MCEV
shareholders’ net worth, which amounted to TL 169.8 million as of June 30, 2015, TL and 148.2
million as of December 31, 2014.
Difference in technical provisions between IFRS and MCEV arises primarily because the IFRS
basis does not allow for equalization reserves which are included in the statutory reserves used to
derive the MCEV shareholders’ net worth.
Market Consistent Embedded Value Report – Half-year 2015
AvivaSA Emeklilik ve Hayat A.Ş. – Actuarial Department 11
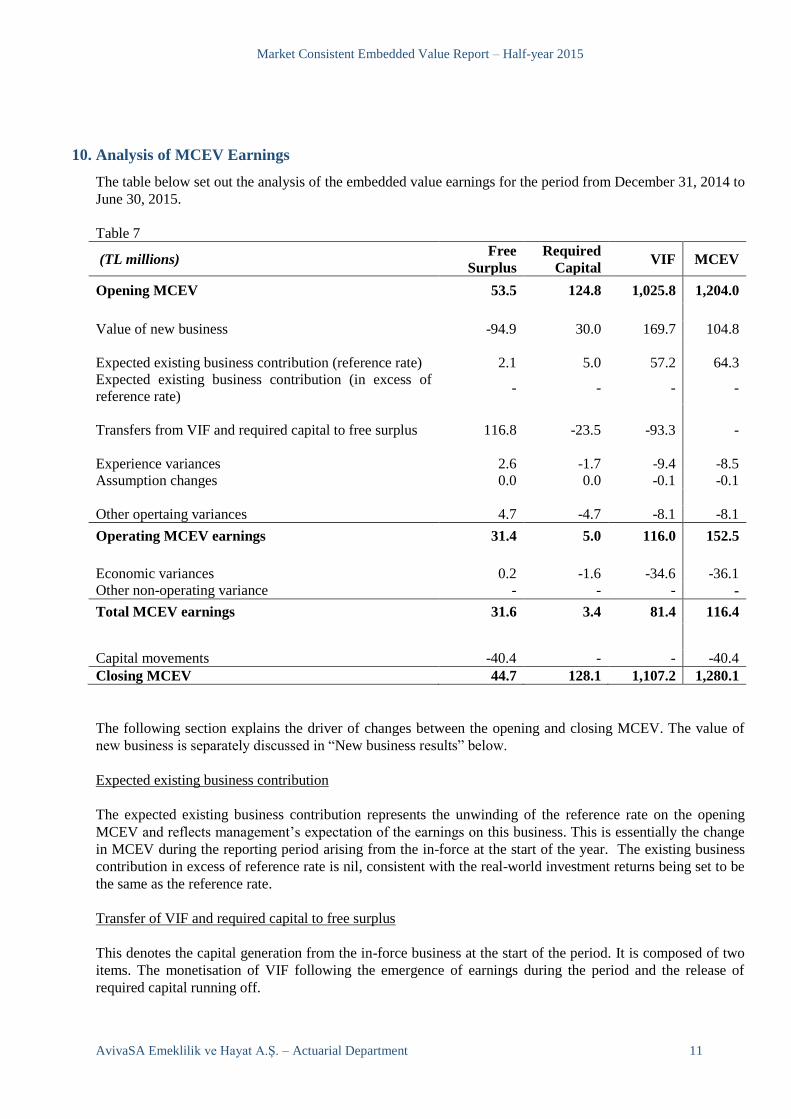
10. Analysis of MCEV Earnings
The table below set out the analysis of the embedded value earnings for the period from December 31, 2014 to
June 30, 2015.
Table 7
(TL millions) Free
Surplus
Required
Capital VIF MCEV
Opening MCEV 53.5 124.8 1,025.8 1,204.0
Value of new business -94.9 30.0 169.7 104.8
Expected existing business contribution (reference rate)
2.1
5.0
57.2
64.3
Expected existing business contribution (in excess of
reference rate) - - - -
Transfers from VIF and required capital to free surplus
116.8
-23.5
-93.3
-
Experience variances 2.6 -1.7 -9.4 -8.5
Assumption changes 0.0 0.0 -0.1 -0.1
Other opertaing variances 4.7 -4.7 -8.1 -8.1
Operating MCEV earnings 31.4 5.0 116.0 152.5
Economic variances 0.2 -1.6 -34.6 -36.1
Other non-operating variance - - - -
Total MCEV earnings 31.6 3.4 81.4 116.4
Capital movements -40.4 - - -40.4
Closing MCEV 44.7 128.1 1,107.2 1,280.1
The following section explains the driver of changes between the opening and closing MCEV. The value of
new business is separately discussed in “New business results” below.
Expected existing business contribution
The expected existing business contribution represents the unwinding of the reference rate on the opening
MCEV and reflects management’s expectation of the earnings on this business. This is essentially the change
in MCEV during the reporting period arising from the in-force at the start of the year. The existing business
contribution in excess of reference rate is nil, consistent with the real-world investment returns being set to be
the same as the reference rate.
Transfer of VIF and required capital to free surplus
This denotes the capital generation from the in-force business at the start of the period. It is composed of two
items. The monetisation of VIF following the emergence of earnings during the period and the release of
required capital running off.
Market Consistent Embedded Value Report – Half-year 2015
AvivaSA Emeklilik ve Hayat A.Ş. – Actuarial Department 12
Operating variances
Operating variances represent the impact on the MCEV as a result of the difference between assumed and
actual operating experience in the reporting period, including expense, mortality and persistency experience.
Pension persistency variance for the first six months is composed of offsetting movements between lapses and
premium collection, leading to a negligible overall variance. Life protection lapse variance is adversely
affected due to higher lapses than anticipated, primarily arising from long-term credit-linked business.
Expenses during the period were slightly higher than expected.
No major assumption changes were done with the exception of improved modelling of required capital for the
personal accident segment.
The other operating variance is in respect of data cleansing for the personal accident in respect of the opening
position.
Overall, non-economic experience variances are about -1% with respect to the opening MCEV.
Economic variances
This item includes the impact of both economic assumption changes and economic variances. Economic
variance reflects the impact of actual investment return experience in the period differing from assumed
investment returns.
The Turkish Lira swap spot rates have increased across the curve for all durations between as of December 31,
2014 and as of June 30, 2015, leading to a negative impact on pensions PVFP. The aggregate investment
performance of the pension funds were at low single digits compared to the year 1 swap spot rate. This meant
that lower than expected funds under management accumulated as of June 2015. The negative economic
variance is as a result of the lower projected fund management fee income.
The other non-operating variances were nil.
Capital movements
Capital movements are mainly composed of dividends, the cash upstreamed to AvivaSA’s holding companies,
which was TL 39.7m within the first six months of 2015 and unrealised loses of TL 0.7m TL.
Market Consistent Embedded Value Report – Half-year 2015
AvivaSA Emeklilik ve Hayat A.Ş. – Actuarial Department 13
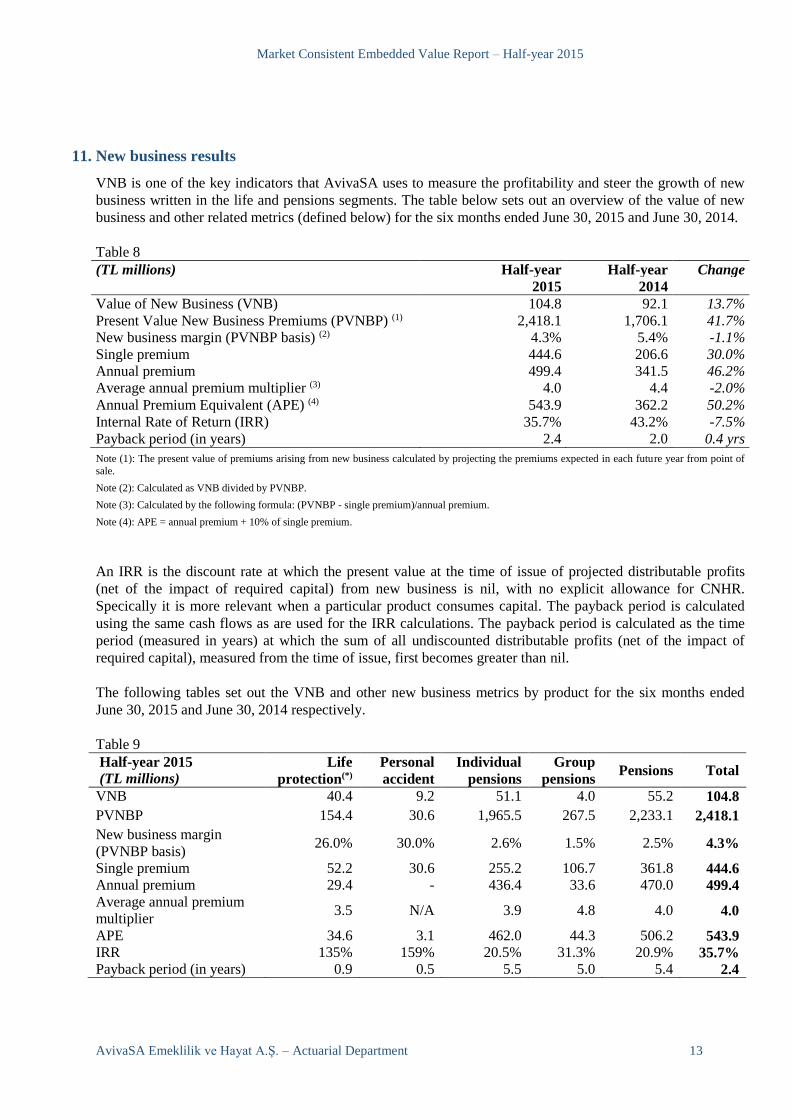
11. New business results
VNB is one of the key indicators that AvivaSA uses to measure the profitability and steer the growth of new
business written in the life and pensions segments. The table below sets out an overview of the value of new
business and other related metrics (defined below) for the six months ended June 30, 2015 and June 30, 2014.
Table 8
(TL millions) Half-year Half-year Change
2015 2014
Value of New Business (VNB) 104.8 92.1 13.7%
Present Value New Business Premiums (PVNBP) (1) 2,418.1 1,706.1 41.7%
New business margin (PVNBP basis) (2) 4.3% 5.4% -1.1%
Single premium 444.6 206.6 30.0%
Annual premium 499.4 341.5 46.2%
Average annual premium multiplier (3) 4.0 4.4 -2.0%
Annual Premium Equivalent (APE) (4) 543.9 362.2 50.2%
Internal Rate of Return (IRR) 35.7% 43.2% -7.5%
Payback period (in years) 2.4 2.0 0.4 yrs
Note (1): The present value of premiums arising from new business calculated by projecting the premiums expected in each future year from point of
sale.
Note (2): Calculated as VNB divided by PVNBP.
Note (3): Calculated by the following formula: (PVNBP - single premium)/annual premium.
Note (4): APE = annual premium + 10% of single premium.
An IRR is the discount rate at which the present value at the time of issue of projected distributable profits
(net of the impact of required capital) from new business is nil, with no explicit allowance for CNHR.
Specically it is more relevant when a particular product consumes capital. The payback period is calculated
using the same cash flows as are used for the IRR calculations. The payback period is calculated as the time
period (measured in years) at which the sum of all undiscounted distributable profits (net of the impact of
required capital), measured from the time of issue, first becomes greater than nil.
The following tables set out the VNB and other new business metrics by product for the six months ended
June 30, 2015 and June 30, 2014 respectively.
Table 9
Half-year 2015
(TL millions)
Life
protection(*)
Personal
accident
Individual
pensions
Group
pensions Pensions Total
VNB 40.4 9.2 51.1 4.0 55.2 104.8
PVNBP 154.4 30.6 1,965.5 267.5 2,233.1 2,418.1
New business margin
(PVNBP basis) 26.0% 30.0% 2.6% 1.5% 2.5% 4.3%
Single premium 52.2 30.6 255.2 106.7 361.8 444.6
Annual premium 29.4 - 436.4 33.6 470.0 499.4
Average annual premium
multiplier 3.5 N/A 3.9 4.8 4.0 4.0
APE 34.6 3.1 462.0 44.3 506.2 543.9
IRR 135% 159% 20.5% 31.3% 20.9% 35.7%
Payback period (in years) 0.9 0.5 5.5 5.0 5.4 2.4
Market Consistent Embedded Value Report – Half-year 2015
AvivaSA Emeklilik ve Hayat A.Ş. – Actuarial Department 14
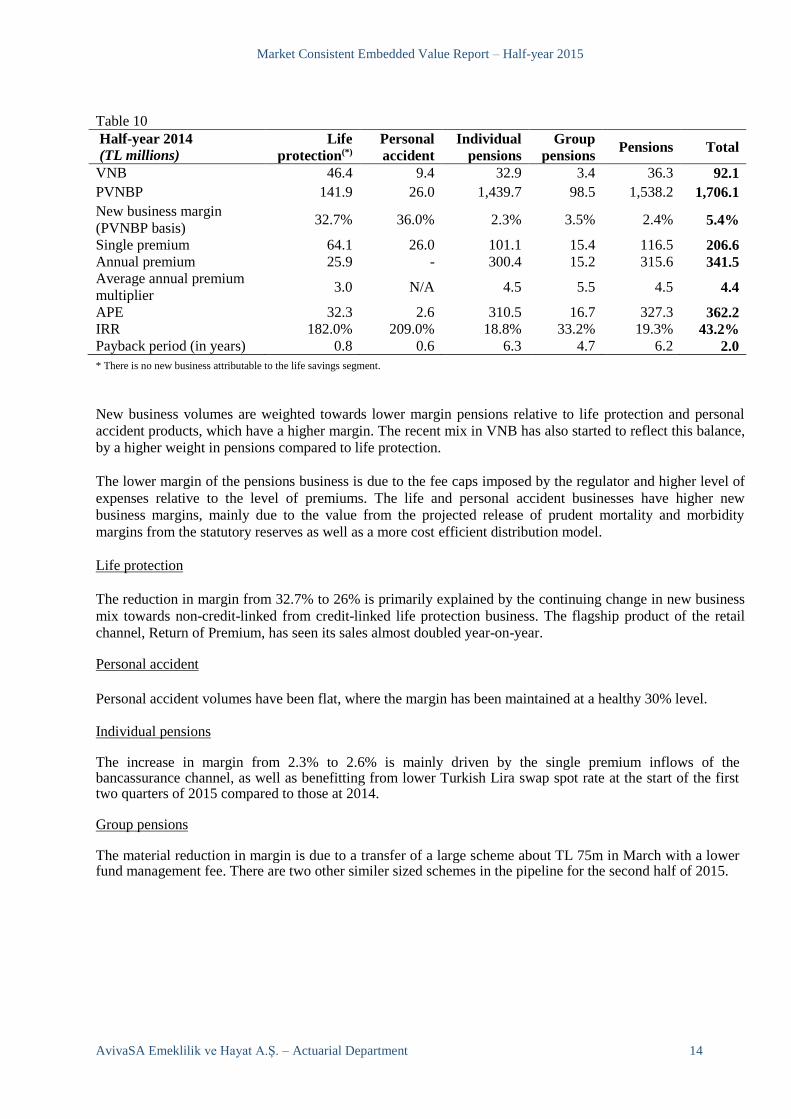
Table 10
Half-year 2014
(TL millions)
Life
protection(*)
Personal
accident
Individual
pensions
Group
pensions Pensions Total
VNB 46.4 9.4 32.9 3.4 36.3 92.1
PVNBP 141.9 26.0 1,439.7 98.5 1,538.2 1,706.1
New business margin
(PVNBP basis) 32.7% 36.0% 2.3% 3.5% 2.4% 5.4%
Single premium 64.1 26.0 101.1 15.4 116.5 206.6
Annual premium 25.9 - 300.4 15.2 315.6 341.5
Average annual premium
multiplier 3.0 N/A 4.5 5.5 4.5 4.4
APE 32.3 2.6 310.5 16.7 327.3 362.2
IRR 182.0% 209.0% 18.8% 33.2% 19.3% 43.2%
Payback period (in years) 0.8 0.6 6.3 4.7 6.2 2.0
* There is no new business attributable to the life savings segment.
New business volumes are weighted towards lower margin pensions relative to life protection and personal
accident products, which have a higher margin. The recent mix in VNB has also started to reflect this balance,
by a higher weight in pensions compared to life protection.
The lower margin of the pensions business is due to the fee caps imposed by the regulator and higher level of
expenses relative to the level of premiums. The life and personal accident businesses have higher new
business margins, mainly due to the value from the projected release of prudent mortality and morbidity
margins from the statutory reserves as well as a more cost efficient distribution model.
Life protection
The reduction in margin from 32.7% to 26% is primarily explained by the continuing change in new business
mix towards non-credit-linked from credit-linked life protection business. The flagship product of the retail
channel, Return of Premium, has seen its sales almost doubled year-on-year.
Personal accident
Personal accident volumes have been flat, where the margin has been maintained at a healthy 30% level.
Individual pensions
The increase in margin from 2.3% to 2.6% is mainly driven by the single premium inflows of the bancassurance channel, as well as benefitting from lower Turkish Lira swap spot rate at the start of the first two quarters of 2015 compared to those at 2014.
Group pensions
The material reduction in margin is due to a transfer of a large scheme about TL 75m in March with a lower fund management fee. There are two other similer sized schemes in the pipeline for the second half of 2015.
Market Consistent Embedded Value Report – Half-year 2015
AvivaSA Emeklilik ve Hayat A.Ş. – Actuarial Department 15
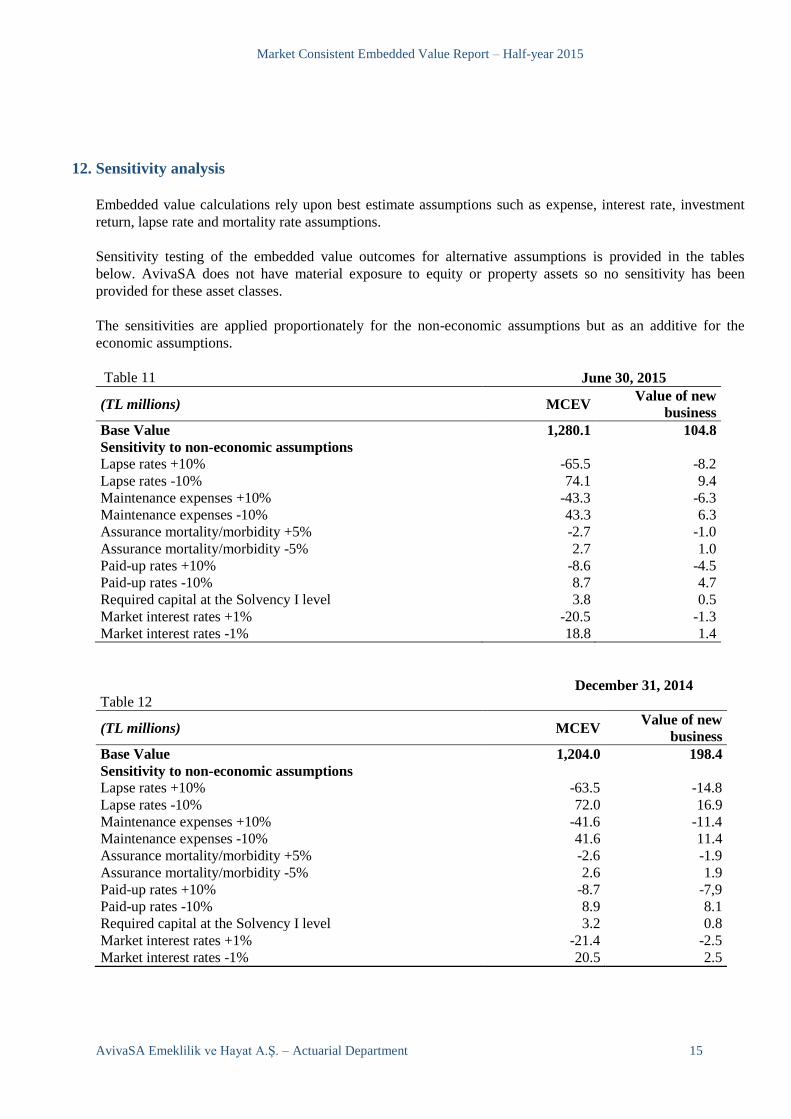
12. Sensitivity analysis
Embedded value calculations rely upon best estimate assumptions such as expense, interest rate, investment
return, lapse rate and mortality rate assumptions.
Sensitivity testing of the embedded value outcomes for alternative assumptions is provided in the tables
below. AvivaSA does not have material exposure to equity or property assets so no sensitivity has been
provided for these asset classes.
The sensitivities are applied proportionately for the non-economic assumptions but as an additive for the
economic assumptions.
Table 11 June 30, 2015
(TL millions) MCEV Value of new
business
Base Value 1,280.1 104.8
Sensitivity to non-economic assumptions
Lapse rates +10% -65.5 -8.2
Lapse rates -10% 74.1 9.4
Maintenance expenses +10% -43.3 -6.3
Maintenance expenses -10% 43.3 6.3
Assurance mortality/morbidity +5% -2.7 -1.0
Assurance mortality/morbidity -5% 2.7 1.0
Paid-up rates +10% -8.6 -4.5
Paid-up rates -10% 8.7 4.7
Required capital at the Solvency I level 3.8 0.5
Market interest rates +1% -20.5 -1.3
Market interest rates -1% 18.8 1.4
Table 12 December 31, 2014
(TL millions) MCEV Value of new
business
Base Value 1,204.0 198.4
Sensitivity to non-economic assumptions
Lapse rates +10% -63.5 -14.8
Lapse rates -10% 72.0 16.9
Maintenance expenses +10% -41.6 -11.4
Maintenance expenses -10% 41.6 11.4
Assurance mortality/morbidity +5% -2.6 -1.9
Assurance mortality/morbidity -5% 2.6 1.9
Paid-up rates +10% -8.7 -7,9
Paid-up rates -10% 8.9 8.1
Required capital at the Solvency I level 3.2 0.8
Market interest rates +1% -21.4 -2.5
Market interest rates -1% 20.5 2.5
Market Consistent Embedded Value Report – Half-year 2015
AvivaSA Emeklilik ve Hayat A.Ş. – Actuarial Department 16
A brief explanation of each of the sensitivities is provided below.
Lapse rates +10%/-10%: To illustrate the impact of a different scenario in the assumed level of lapses, lapse
rates were increased and decreased by 10% of the base assumption. Premium collection rates are excluded
from the lapse sensitivity. The relatively large impact of the lapse sensitivity is due to loss of future charges
for the pensions business partially offset by higher deferred entry fee income, which is charged to participants
at the time of exit.
Maintenance expenses -10%: The MCEV increases when maintenance expenses are lower by 10% due to an
increase in future earnings.
Assurance mortality/morbidity -5%: To illustrate the impact of lower mortality/morbidity, it was assumed that
mortality and morbidity rates decrease by 5% of the base assumptions. This sensitivity shows that the
insurance portfolio of AvivaSA is dominated by the risk business.
Premium collection rates +10%/-10%: To illustrate the impact of a different scenario in the assumed level of
premium collection, premium collection rates were increased and decreased by 10% of the base assumption
for the pensions business only. An increase in premium collection rates implies that there are more contracts
paying contributions leading to a higher value and vice versa.
Required capital at the Solvency I level: This is to show the impact of targeting a higher internal required
capital in the base MCEV, which is an addition of 50% on top of the Solvency I capital requirement.
Market interest rates +1%/-1%: When the market interest rate sensitivities are performed, consequential
changes in yield and values are allowed for on all interest-bearing assets and liabilities, including updating the
assumptions for indexation of regular premiums and expense inflation. AvivaSA’s MCEV increases when
interest rates decrease and decreases when interest rates increase due to its exposure to the fee-based pensions
business which is of a longer duration than the life insurance business. Underlying assets backing life savings
liabilities are assumed to be invested in cash when carrying out the interest rate sensitivities.
13. Differences between reported Aviva plc MCEV disclosures
The differences between the MCEV of AvivaSA in this report and that reported in the supplementary
information to the accounts of Aviva plc are primarily the result of the following factors:
• CNHR capital charge of 2% per annum is increased to 6% per annum where the former allowed for
the diversification benefit of non-hedgeable risks at Aviva Group level; and
• allowance is no longer made for the withholding tax that would be incurred by Aviva plc on the
distributable earnings.
14. Statement of Directors’ responsibilities in respect of the MCEV basis
When compliance with the MCEV Principles is stated, those Principles require the directors to prepare
supplementary information in accordance with the methodology contained in the MCEV Principles and to
disclose and explain any non-compliance with the Guidance included in the MCEV Principles. In preparing
this supplementary information, the directors have done so in accordance with these MCEV Principles and
have also fully complied with all the Guidance. Specifically the directors have:
Market Consistent Embedded Value Report – Half-year 2015
AvivaSA Emeklilik ve Hayat A.Ş. – Actuarial Department 17
determined assumptions on a realistic basis, having regard to past, current and expected future
experience and to relevant external data, and then applied them consistently;
made estimates that are reasonable and consistent; and
provided additional disclosures when compliance with the specific requirements of the MCEV
Principles is insufficient to enable users to understand the impact of particular transactions, other
events and conditions, and AvivaSA’s financial position and financial performance.
Market Consistent Embedded Value Report – Half-year 2015
AvivaSA Emeklilik ve Hayat A.Ş. – Actuarial Department 18
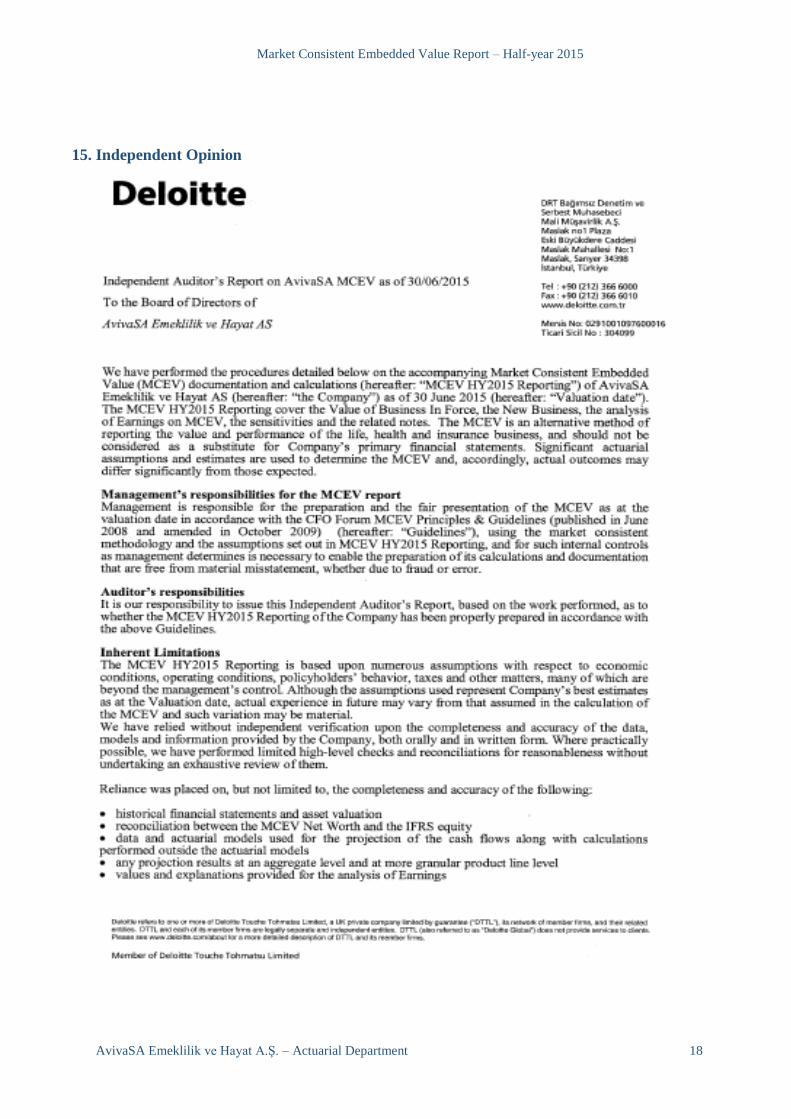
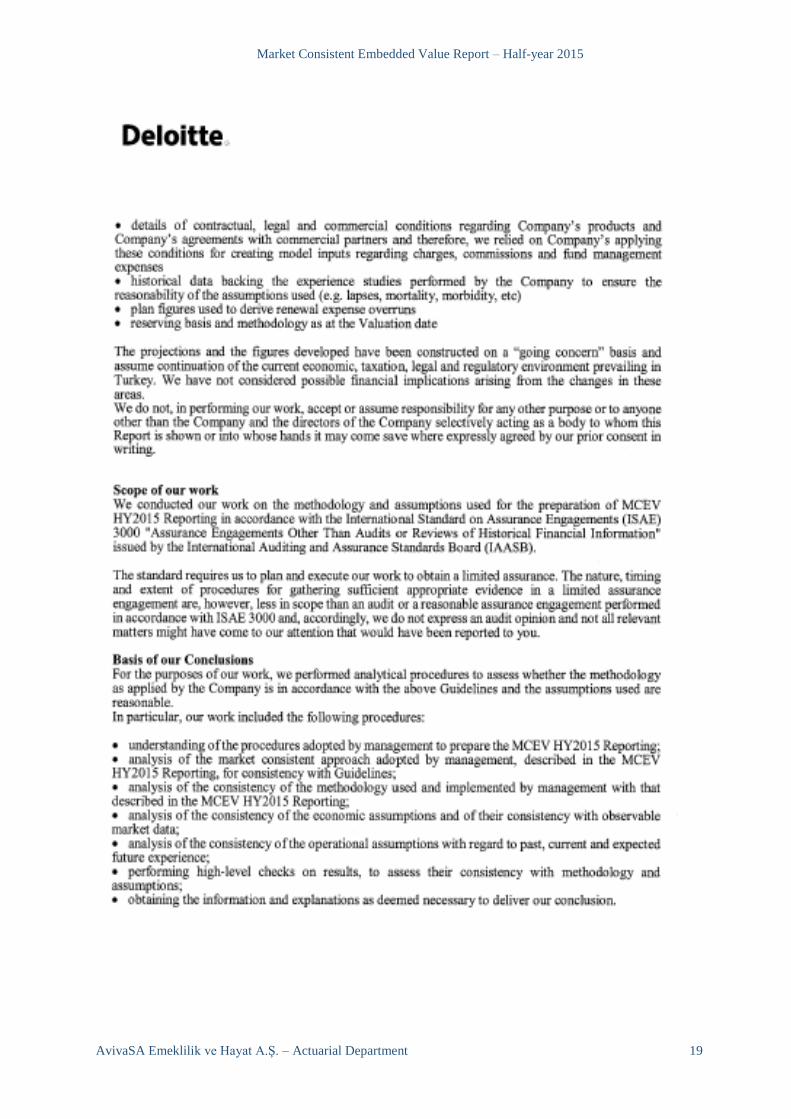
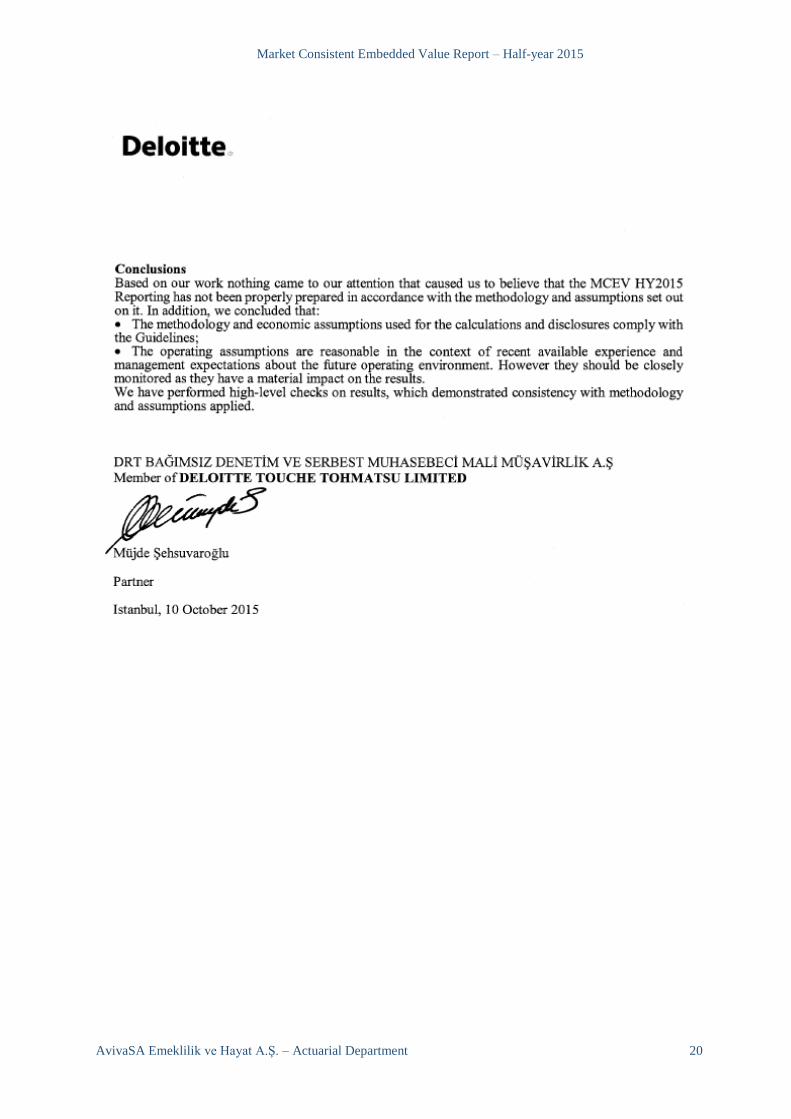
15. Independent Opinion
Market Consistent Embedded Value Report – Half-year 2015
AvivaSA Emeklilik ve Hayat A.Ş. – Actuarial Department 19
Market Consistent Embedded Value Report – Half-year 2015
AvivaSA Emeklilik ve Hayat A.Ş. – Actuarial Department 20
Market Consistent Embedded Value Report – Half-year 2015
AvivaSA Emeklilik ve Hayat A.Ş. – Actuarial Department 21
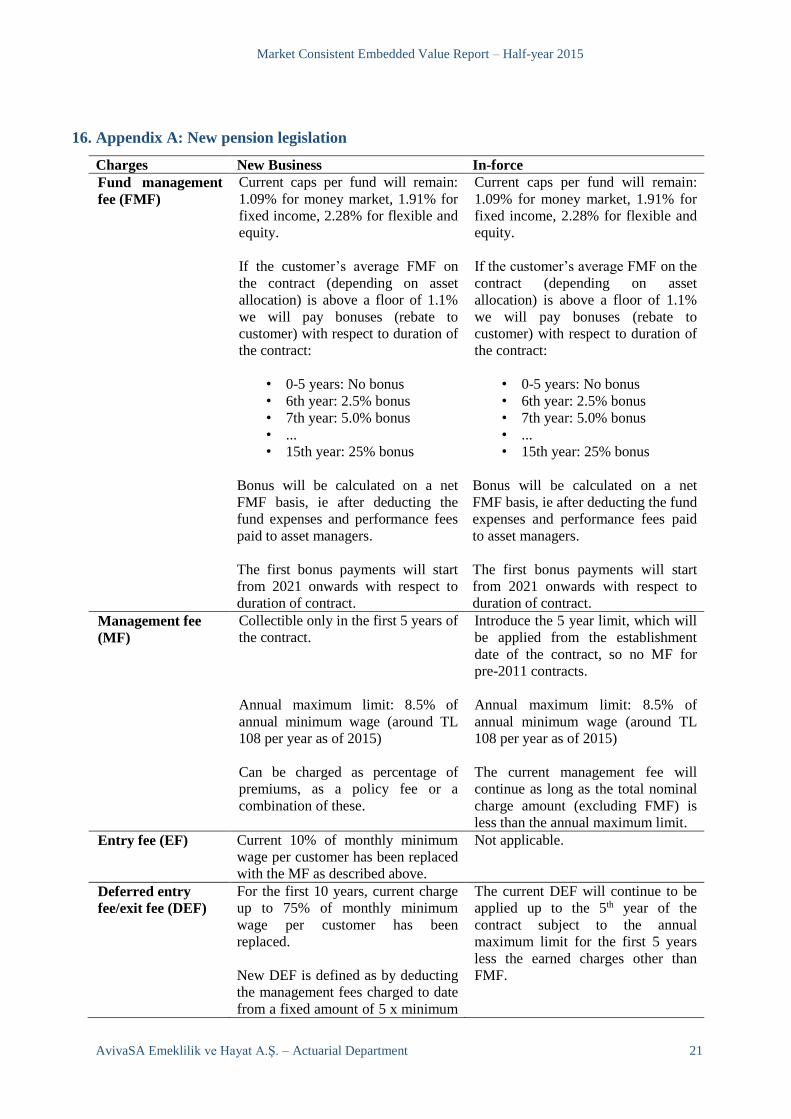
16. Appendix A: New pension legislation
Charges New Business In-force
Fund management
fee (FMF)
Current caps per fund will remain:
1.09% for money market, 1.91% for
fixed income, 2.28% for flexible and
equity.
If the customer’s average FMF on
the contract (depending on asset
allocation) is above a floor of 1.1%
we will pay bonuses (rebate to
customer) with respect to duration of
the contract:
• 0-5 years: No bonus
• 6th year: 2.5% bonus
• 7th year: 5.0% bonus
• ...
• 15th year: 25% bonus
Bonus will be calculated on a net
FMF basis, ie after deducting the
fund expenses and performance fees
paid to asset managers.
The first bonus payments will start
from 2021 onwards with respect to
duration of contract.
Current caps per fund will remain:
1.09% for money market, 1.91% for
fixed income, 2.28% for flexible and
equity.
If the customer’s average FMF on the
contract (depending on asset
allocation) is above a floor of 1.1%
we will pay bonuses (rebate to
customer) with respect to duration of
the contract:
• 0-5 years: No bonus
• 6th year: 2.5% bonus
• 7th year: 5.0% bonus
• ...
• 15th year: 25% bonus
Bonus will be calculated on a net
FMF basis, ie after deducting the fund
expenses and performance fees paid
to asset managers.
The first bonus payments will start
from 2021 onwards with respect to
duration of contract.
Management fee
(MF)
Collectible only in the first 5 years of
the contract.
Annual maximum limit: 8.5% of
annual minimum wage (around TL
108 per year as of 2015)
Can be charged as percentage of
premiums, as a policy fee or a
combination of these.
Introduce the 5 year limit, which will
be applied from the establishment
date of the contract, so no MF for
pre-2011 contracts.
Annual maximum limit: 8.5% of
annual minimum wage (around TL
108 per year as of 2015)
The current management fee will
continue as long as the total nominal
charge amount (excluding FMF) is
less than the annual maximum limit.
Entry fee (EF) Current 10% of monthly minimum
wage per customer has been replaced
with the MF as described above.
Not applicable.
Deferred entry
fee/exit fee (DEF)
For the first 10 years, current charge
up to 75% of monthly minimum
wage per customer has been
replaced.
New DEF is defined as by deducting
the management fees charged to date
from a fixed amount of 5 x minimum
The current DEF will continue to be
applied up to the 5th year of the
contract subject to the annual
maximum limit for the first 5 years
less the earned charges other than
FMF.

Market Consistent Embedded Value Report – Half-year 2015
AvivaSA Emeklilik ve Hayat A.Ş. – Actuarial Department 22
wage.
Premium holiday
fee (PHF)
Current 2 TL per month has been
replaced with the MF as described
above.
Applicable only for the first 5 years
subject to the annual maximum limit.
Current premium holiday fee can
continue as long as the annual
maximum limit is not breached.