Embed Size (px)
Citation preview

Investor PresentationIstanbul, Turkey – March 2018

2
Agenda
1. Turkey at a Glance
2. Our Markets
• Private Pension System
• Life Insurance
3. Corporate Profile
4. Financial Results

Turkey at a Glance

4
Turkey at a GlanceA Fast Growing Economy
0%
1%
2%
3%
4%
5%
6%
1990-1999 2000-2009 2010-2016
GDP Average Annual Growth*
Turkey OECD Euro-15
Source: *OECD National Accounts Data, **IMF, ***Turkish Statistics Institute, ****World Bank National Accounts Data
Over the last decade and half, Turkey
successfully stabilized its macro economy.
After the 1999–2001 economic crisis, Turkey
maintained a highly successful policy of
macroeconomic stabilization.
-6%
-5%
-4%
-3%
-2%
-1%
0%
2011 2012 2013 2014 2015 2016 2017
Budget Balance (% of GDP)**
Euro Area EM Turkey
0%
5%
10%
15%
20%
25%
CPI*** and Interest Rates****
CPI Interest Rates

5
-10%
-8%
-6%
-4%
-2%
0%
2%
4%
6%
2011 2012 2013 2014 2015 2016 2017
Current Account Balance (% of GDP)*
Euro Area EM Turkey
Turkey at a GlanceUrgent Need to Increase Domestic Savings
Source: *IMF, except for Turkey’s domestic saving rate which is from Ministry of Development
**CBT Financial Stability Report: All data represents 3rd quarter figures, except for 2012 which
shows the year-end figures
0%
1%
2%
3%
4%
5%
6%
7%
0
250
500
750
1.000
1.250
2011 2012 2013 2014 2015 2016 2017
Weight of Pension Funds in Household Savings (TRY billion)**
Pension Funds Total Household Savings Weight of Pension Funds
Republic of Turkey – Medium Term Programme
Article 81: “Charging ratio will be converged
to international levels in the private pension
system and “auto enrolment system” will be
implemented. Life insurance and long-term
(over one year) private health insurance will
be developed.”
Medium Term Programme (2016-2018), prepared by Ministry
of Development was adopted by Cabinet Decree No.
2015/8355, 29.12.2015 and published in Official Gazette No.
29590, 11.01.2016.
10%
15%
20%
25%
30%
35%
2011 2012 2013 2014 2015 2016 2017
Domestic Saving Rate (% of GDP)*
Euro Area EM Turkey

6
Turkey at a GlanceDemographic Opportunity Window
2017 2050
Population (millions) : 80.8 93.5
Median Age : 31.7 43
Fertility : 2.10 1.65
Proportion of Elderly Population : 8.5% 20.8%
2018
January
Population 15 Years And Over (thousands) : 60,360
Labor Force (thousands) : 31,438
Employed (thousands) : 28,029
Labor Force Participation Rate : 52.1%
Unemployment Rate : 10.8%
Non-Agricultural Unemployment Rate : 12.7%
Source: Turkish Statistics Institute – The World Bank - IMF
Decreasing fertility and increasing longevity means a demographic transition.
• 47 percent of the population is under 30 years old.
• Only 9 percent of the population is over 64 years old.
• The youth dependency ratio is relatively high.
• More people are living off retirement savings, thus a decrease in the saving rate
is a common issue.
• In the interim period when the youth dependency ratio is falling fast and the old-
age dependency ratio is only increasing modestly; larger potential labor force and
higher private saving to fund investment is a major demoghraphic advantage.
0%
1%
2%
3%
4%
5%
6%
7%
8%
9%
Population By Age
2017 2050

Our Markets
Private Pension System
Life Insurance

8
Our MarketsPrivate Pension System: Positioned in Pillar III
Three-Pillar System
Pillar I
State Pension
Mandatory
Securing a minimum
standard of living
Retirement, health,
disability and
unemployment
Pillar II
Occupational
Pension
Workplace Pensions
with Auto Enrolment
starting by 2017
Maintenance of
current living
standards in terms of
replacement rate
Pillar III
Private Pension
Voluntary
Opportunity to
increase retirement
income
Available since 2003

9
Our MarketsPillar III Private Pension System: Important Features
Defined contribution and
voluntary participation.
Funds are managed by
asset management
companies.
Minimum retirement age: 56
Completion of 10 years.
Started in 2003.
17 companies in 2018.
Participants can switch funds,
pension plans and transfer
between companies.
Incentives for both
participant and employer.

10
Pillar III Private Pension System: Well Designed Structure
Pension
Monitoring Center
(EGM)
ISE Settlement
and Custody
Bank
(Takasbank)
Capital Markets
Board (SPK)
Undersecretariat
of Treasury
Ministry of Labor
and Social
Security
Ministry of
Finance
Pension
Accounts
Administered by
Pension
Companies
Pension Funds
Managed by
Asset
Management
Companies
Our Markets
Regulation Administration Monitoring

11
Our MarketsPillar III Private Pension System: Incentives
For Participants For Employers
• Contributions with a cap of
annual legal minimum wage is
subject to 25% state
contribution.
• Vesting Period:
% 15 at the end of 3 years
% 35 at the end of 6 years
% 60 at the end of 10 years
% 100 at retirement date or
death/disability cases
• Investment income of
pension funds are tax
exempt.
• Transaction of pension
funds are exempt of fees
and taxes.
• Withholding tax applies only
on the investment income:
5% (completion of 10 years in
the system & 56 years of age)
10% (completion of 10 years in
the system)
15% (early leave, before
completion of 10 years in the
system)
Contribution Stage Investment Stage Benefit Payments Employer contributions are
tax deductible up to 15% of
gross salary with a cap of
annual legal minimum wage.

12
Our MarketsPillar III Private Pension System: Charging Structure
Management Fee / Entrance Fee Fund Management Fee
First 5 years of the contracts No change in fund management
fee levels. A new rebate structure
will be implemented by 2021.
Maximum limit: 8.5% of the
monthly legal minimum wage
• Applicable for the first 5 years of
the contract.
• One common cap for entrance fee
and management fee.
Fund Management Fees
• Money market funds: 1.09%
• Fixed income & index funds: 1.91%
• Equity and managed funds: 2.28%
• State contribution funds: 0.36%
Rebate Structure
• Beginning with 2.5% by the 6th
year of the contract.
• 2.5% gradual increase each year.
• Maximum 25% after the 15th year.
• Rebate is not applicable below
1.1% of pension assets.

13
Our MarketsPillar III Private Pension System: Growth Accelerated with Increased Government Support
Und
er
Dis
cu
ssio
n
Imp
lem
ente
d
• 25% State Contribution since 2013
• Withholding tax limited to capital gains
• Pension fund transfers from provident
funds* by the end of 2017
• Fee Structure Efficiency
• Auto-Enrolment started in 2017
• Deconcentration of asset managers
(effective by 2018)
• Severance Payments
* Funds from associations, foundations, provident funds and other organizations with retirement provisions.
Source: Pension Monitoring Center as of 31.03.2018
0
10
20
30
40
50
60
70
80
90
AUM State Contribution
Pension AUM Growth(TRY billion)
0
1.000
2.000
3.000
4.000
5.000
6.000
7.000
8.000
Number of Participants(Thousands)

14
Our MarketsPillar III Private Pension System: Big Growth Potential
125,7%
49,5%
4,8%
0% 25% 50% 75% 100% 125% 150% 175% 200%
Netherlands
United States
Weighted average
United Kingdom
Finland
Israel
Simple Average
Japan
Spain
Slovak Republic
Portugal
Poland
Slovenia
Belgium
Germany
Austria
Turkey
Hungary
Pension Funds as a Percentage of GDP
Turkey
OECD Simple Average
OECD Weighted Average
Big Growth Potential
The Turkish pension market has a very low level of GDP
penetration compared to other countries with similar GDP
per capita.
This illustrates a huge growth potential when combined
with the demographic opportunity window.
Pension Participants
6.9 MillionSocial Security Participants
22 Million
Work Force
31.4 Million
Working-Age Population
60.4 MillionTotal Population
80.8 Million
Source: OECD Pension Markets in Focus 2017; Turkish Statistics Institute as of 31.01.2018; Social Security Institution as of 28.02.2018;
Pension Monitoring Center as of 31.03.2018

15
Our MarketsAttractive Market
109
6 65
4 4 4
1314
1718
19 1918 18
2010 2011 2012 2013 2014 2015 2016 2017
Life Private Pension
The Number of Companies*
61%
73% 74%69%
65% 65% 63%
36% 37% 39%
45%
52%54% 53%
2010 2011 2012 2013 2014 2015 2016
Paid-In Capital GWP
Foreign Investment Share
The pension system started with 11 companies in 2003.
Due to strong growth expectations and government support,
the system attracted more local and international groups.
Source: Undersecretariat of Treasury, Insurance and Private Pensions Annual Reports
* Active companies

16
Our MarketsPillar III Private Pension System: Key Highlights
Key Figures
Participants : 6.9 Million
Participant Funds : TRY 70.3 Billion
State Contribution Funds : TRY 10.3 Billion
Assets Under Management : TRY 80.7 Billion
Intermediaries : 45,104
Pension Companies : 17
5,6%
27,4%
33,8%
23,8%
9,4%
0-25 25-34 35-44 45-55 56+
Participant Age Distribution
Individual75,5%
Non-Sponsored
Groups20,1%
Employer Sponsored Groups 4,4%
Contributions Total Amount by
Contract Type
Bank72%
Other; 2%
Direct Sales11%
Corporate Sales4%
Agent11%
Distribution of Contributions
by Marketing Channel(2016 total)
1.000
1.500
2.000
2.500
3.000
2008 2009 2010 2011 2012 2013 2014 2015 2016
Average of Total Amount of Regular Contributions per Year (TRY)
Source: Pension Monitoring Center
As of 31.03.2018

17
Our MarketsPrivate Pension System: Pension Funds*
Equity11,5%
Repo and Money Market Instruments
6,1%
International Securities
2,0%
Government Bonds46,5%
Corporate Bonds12,9%
Time Deposits21,0%
Asset Allocation of Pension Funds
Number of Funds : 402
Total AUM : TRY 83.0 Billion
Return on Pension Funds (2004-2018Q1)
Nominal : 423.0%
Real : 61.9%
23,9%
19,6%
11,1%
18,4%
9,5%
23,3%
9,6%
0,1%
17,9%
-0,2%
14,5%
3,0%
10,9%
15,4%
2,0%
13,3%11,0%
1,3%
9,2%
-0,5%
15,8%
3,0%
-9,4%
11,0%
-7,1%
5,9%
-5,4%
2,2% 3,1%
-0,7%
Nominal & Real Investment Return of Pension Funds
Nominal Return Real Return
As of 31.03.2018 * Includes Auto Enrolment funds

18
Our MarketsPrivate Pension System: New Frontiers
Auto
Enrolment
Severance
Payments
Simplification
of Fund
Choices
Deconcentration
of Asset
Managers

19
Our MarketsAuto Enrolment: Basic Features*
Automatic
enrolment of
current and new
employees under
age 45
Gradual
implementation
based on
company
scale
Minimum
contribution
amount
set as
%3 of
monthly
wage
State contribution:• 25% on contributions
• 1,000 TRY initial bonus
• 5% of assets at
annuity phase
Simplified
fund menu
Simplified and
automated
enrolment and
collection
process
2 months of call
back period.
Voluntary opt-out
at any time
Law enacted in 2016,
in force by 2017.
First three phases
are completed.
Structural changes
in marketing, sales
and service model
SME & Corporate
* Based on the Law enacted in August 2016 and the complementary legislation.
No
employer
contribution

20
Our MarketsAuto Enrolment System: Incentives
For Participants
• Contributions with a cap of annual legal
minimum wage is subject to 25% state
contribution. This limit is set independently
of Pillar III contracts.
• Initial 1,000 TRY bonus if the employee
stays in the system.
• Vesting Period For State Contribution
% 15 at the end of 3 years
% 35 at the end of 6 years
% 60 at the end of 10 years
% 100 at retirement date or death/disability
cases
• State contributions are booked in a separate
account as a commitment and will be
subject to revaluation indexed to CPI. The
accrued amounts will be funded gradually
according to the vesting schedule.
• Investment income of auto enrolment funds
are tax exempt.
• Additional state contribution equal to 5% of
savings at retirement date is provided in
case of transfer into an annuity contract with
a minimum term of ten years.
Contribution Stage Investment Stage Retirement Stage

21
Our MarketsAuto Enrolment System: Charging Structure
Management Fee / Entrance Fee Fund Management Fee
No management or entrance fee. Fund management fee level is
capped.
According to the Law enacted in
August 2016, no management or
entrance fee is allowed in Auto
Enrolment System.
Fund Management Fee is capped at
a maximum of 0.85%.

22
Our MarketsAuto Enrolment - New Target Market
DatePrivate
Sector
Public
Sector
Number of
Employees***%
2017 January 1,000+ - 2.2 Million 15.4
2017 April 250 – 999 Public administrations 4.0 Million 28.3
2017 July 100 – 249 - 1.5 Million 10.7
2018 January 50 – 99Public enterprises +
local administrations1.3 Million 9.1
2018 July 10 – 49 - 2.7 Million 19.1
2019 January 5 - 9 - 2.5 Million 17.4
Total 14.2 Million 100
WORKFORCE*
* Social Security Institution February 2018, Turkish Statistics Institute, January 2018
** Estimated as 75% of the 4a and 4c participants *** Target market estimated by Undersecretariat of Treasury
Eligible Employees
(age less than 45)**
12.8 Million
Social Security Participants
(4a&4c)
17.1 Million
Social Security Participants
22 MillionEmployed
28.03 MillionWork Force
31.4 Million
3,0 Million (4c public sector)
13,3 Million(4a private sector)
0,9 Million (4a public sector)
SOCIAL SECURITY PARTICIPANTS (4A&4C)
Staging Process
Staging process defined in the complementary legislation
Public sector in 2017
Gradual staging for private sector beginning with large scale
companies (+1,000 employees)

23
Our MarketsAuto Enrolment – Market Preview
Market Size*
Number of Employees 3,836,070
Number of Certificates 3,955,076
Total Funds (TRY) 2,427,149,445
*Source: Pension Monitoring Center as of 31.03.2018
Staging Process
Fourth phase of Auto Enrolment have been
started.
The employees of private companies over 50
employees and public administrations has been
enrolled in one of auto enrolment plans.
Date Target
2017 January Private companies with 1,000+ employees
2017 AprilPrivate companies with 250-999 employees
Public administrations
2017 July Private companies with 100-249 employees
2018 JanuaryPrivate companies with 50-99 employees
Public enterprises and local administrations
2018 July Private companies with 10-49 employees
2019 January Private companies with 5-9 employees

24
Our MarketsLife Insurance: Underpenetrated Market
21
144 164
962
658
1.620
353285
638
Life Insurance Non Life Insurance Total Insurance
Turkey Europe World
Insurance Premium per Capita (USD)
Global Comparison (2016)
Source: Sigma, SwissRe
Country /
Region
Life GWP
(in % of GDP)
Share of World Market
(in %)
Turkey 0.2 0.06
Europe 4.0 32.8
OECD 4.0 75.7
World 3.5 100
Life insurance market has great potentials in Turkey.
Turkey’s life insurance market is extremely
underpenetrated as life premiums’ weight in GDP is only
1/20 of OECD average.
Low penetration level - when combined with favorable
demographics and strong government support for saving
and annuity products - demonstrates high growth
potential.
25
Our Markets
Life Insurance Total GWP(TRY million)
3.350 3.2293.701
4.963
6.766
1.018 1.225
-4%
15%
34% 36%
-50%
-40%
-30%
-20%
-10%
0%
10%
20%
30%
40%
50%
-100,00
900,00
1.900,00
2.900,00
3.900,00
4.900,00
5.900,00
6.900,00
Life Total GWP (million TRY) Growth Rate
2013 2014 2015 2016 2017 2017/02 2018/02
Term Life Endowment / Saving Annuity
CAGR 19%
Life Insurance GWP(by Product Category)
Life Insurance Market in Turkey is dominated by credit linked products.
Term life market is dependant on consumer loan cycles. To offset this dependancy there is an increasing emphasis on stand alone products.
The saving product market is under pressure of expanding private pension products.
Annuity market is in a regulatory transition phase. New generation products will be launched after legal framework is finalized.
Source: Life Insurance Information and Monitoring Center
Life Insurance
YoY (TOTAL) : 20%
Term Life : 19%
Endowment / Saving
: 38%
Annuity : -76%

Anadolu Hayat Emeklilik
Corporate Profile

27
Anadolu Hayat EmeklilikAt a Glance
Free Float15%
İşbank64% Anadolu
Sigorta20%
Milli Reasürans
1%
Ownership Structure*
Established in 1990 as a subsidiary of İşbank
First life insurance company in Turkey
The first publicly traded Life & Pension Company since 2000
Operating in pension business since 2003
Strong market position in life insurance and private pension
businesses
Strong shareholder structure
Sector’s leader in total assets with TRY 18.4 billion
SECTOR’S
LEADERLife and Private
Pension Funds
TRY 17 Billion
SECTOR’S
LEADERPrivate Pension
Contracts
1.3 Million
* The rate of publicly traded shares is 17%. As at 23 February 2017, İşbank owns the 1.89% of the publicly traded shares.

28
Anadolu Hayat EmeklilikAt a Glance
I OrganizationHeadquartered in Istanbul
11 District Sales Offices
Branch Office in TRNC
IIHuman
Resources
HQ and Regions :
Direct Sales Team :
Total :
534
506
1,040
IIIFinancial
Metrics
Total Assets :
Shareholders’ Equity :
Gross Profit :
Market Value :
TRY 18,446 million
TRY 819 million
TRY 93 million
TRY 3,204 million
IV Brand Value First remembered private pension company 35% *
VMarket
Position
Private Pension
Contracts :
Participants :
Assets Under Management :
#1 – 16%
#2 – 16%
#2 – 19%
Life Insurance
AUM (Mathematical Reserves) :
Gross Written Premium :
#1 – 26% **
#4 – 8%
* Source: TNS, as of February 2018
** As of February 2018

29
Anadolu Hayat EmeklilikFinancial Highlights(Million TRY) 2016 2017 Change 2017Q1 2018Q1 Change
Total GWP and Net Contributions 1,859.3 2,203.7 19% 458.5 619.9 35%
Life Mathematical Provisions 1,682.4 1,725.7 3% 1,703.1 1,709.7 0.4%
Pension AUM 11,359.4 14,712.8 30% 12,173.8 15,314.5 26%
Total Assets 14,391.7 17,877.2 24% 15,170.2 18,445.6 22%
Shareholders Equity 860.9 926.6 8% 766.3 819.1 7%
Total Technical Profit 133.0 199.2 50% 43.0 65.2 52%
Non Life -0.57 -0.55 -4% 0.0 -0,3 -
Life 112.5 132.6 18% 31.2 40.8 31%
Private Pension 21.1 67.1 218% 11.8 24.7 108%
Financial Income 123.4 124.3 1% 32.6 39.7 22%
Profit for the Period 229.8 279.8 22% 63.4 92.7 46%
Net Profit 190.3 224.7 18% 51.7 74.0 43%
Key Financial Metrics 2016 2017
ROAE 23% 25%
Expense Ratio 17.2% 16.0%
P/E Ratio 11.2 15.8
P/B Ratio 2.5 3.8
Earnings per Share 0.44 0.52
2017Q1 2018Q1
25% 28%
17.5% 16.1%
10.8 13.0
2.8 3.9
0.47 0.57

30
Anadolu Hayat EmeklilikLines of Business
Private
Pension
Individual
Plans
Non-
Sponsored
Group Plans
Employer
Sponsored
Group Plans
Income
Drawdown
Plans
Life
InsuranceAnnuities Term Life
Savings &
Endowment
Personal
Accident
Insurance
Group
Accident
Insurance
Personal
Accident
Insurance
Low RiskMedium
RiskHigh Risk
Money Market
Conservative Flexible
Private Sector DebtInstruments
Group Conservative
Initial
Initial Participation
Auto EnrolmentConservative
Bond Fund
First Debt Instruments
Second Debt
Instruments
Developed Countries
Flexible
Balanced Flexible
Participation Standard
Contribution
Participation
Contribution
Group Bond
Group Debt
Instruments
HSBC Asset Mngt.
Debt Instruments
Standard
Auto Enrolment
Balanced
Auto Enrolment
Standard
Auto Enrolment
Participation Standard
Equity Fund
Dynamic Flexible
BRIC Plus
Aggressive Flexible
Gold
Group Equity
Second Equity
Isbank Subsidiaries
Index
Auto Enrolment
Aggressive
Auto Enrolment
Dynamic
Auto Enrolment
Aggressive
Participation
Auto Enrolment
Dynamic Participation
Lines of Business Pension Funds
Auto
Enrolment
Auto
Enrolment
Plans
31
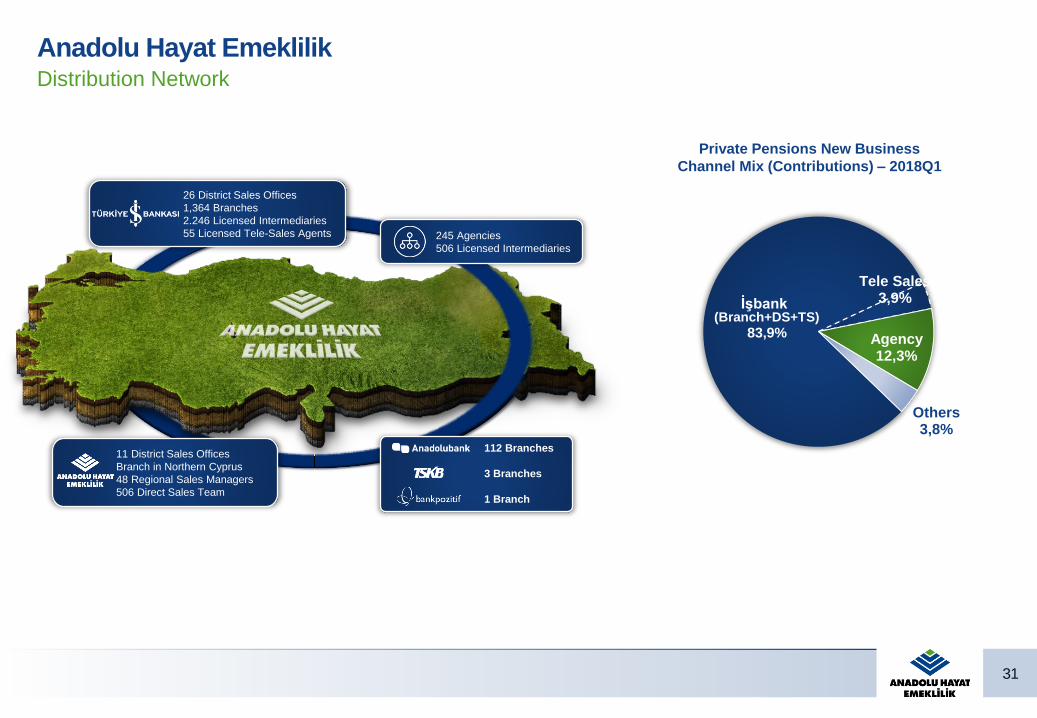
Anadolu Hayat EmeklilikDistribution Network
26 District Sales Offices
1,364 Branches
2.246 Licensed Intermediaries
55 Licensed Tele-Sales Agents
11 District Sales Offices
Branch in Northern Cyprus
48 Regional Sales Managers
506 Direct Sales Team
245 Agencies
506 Licensed Intermediaries
112 Branches
3 Branches
1 Branch
Private Pensions New Business
Channel Mix (Contributions) – 2018Q1
(Branch+DS+TS)
83,9%
Tele Sales3,9%
Agency12,3%
Others3,8%
İşbank

32
Anadolu Hayat EmeklilikDeep Bench with Lots of Talent
Total Number
of Employees: 1,040
4%
24%
35%
21%
9%
4%
2%
18-24
25-29
30-34
35-39
40-44
45-49
50+
Young & Energetic
0,4%
3%
89%
8%
Primary Level
High School
University
Graduate
Educated
62%
38%
Female
Male
Diverse

33
Anadolu Hayat EmeklilikCorporate Strategy
Finance
Become the market leader among private
pension and life insurance companies
Customer
Optimize customer and product portfolio to
make the best use of sales potential
Process
Design cost oriented simple processes for
top-notch customer experience
Improvement
and Learning
Continuously develop business model and human
resources to become the leader in all arenas
Become both the private
pension and life insurance
market leader
Optimize operational
profitability and efficiency
Optimize ROE and risk
portfolio
Utilize the Bancassurance
channel in the most
effective way
Make the best use of up
and cross selling
opportunities
Extend quality customer
base
Develop integrated, agile
and solution focused
systems
Optimize acquisition and
service related costs by
digitalization
Become a superb service
provider
Differentiate through new
infrastructure and
business model
Enhance collaboration and
interaction within teams
Become the first choice for
employees through high
performance teams

34
Anadolu Hayat EmeklilikStrong Infrastructure
Core System Transformation
Project
The first phase of the
transformation project to serve
private pension operations
established in February 2017
including a huge migration from
the old legacy system. Second
phase of the project covering life
insurance operations has started
in 2017.
New IT infrastructure is flexible,
modular and state of the art which
will reduce reliance on IT
resources, reduce the time to
market for new products, gain
process efficiencies with
automation for a unique
customer experience, reduce
operational risk, increase the
ability to deal with regulatory
change.
CRM
Hardware Architecture
Transformation(Exadata)
Payment and Collection
Processes Module(Payment HUB)
Commission and
Intermediary Campaigns
Rule Engine
Mechanization of
Operational Processes
Digital Corporate Identity(AHEŞUBE, AHEMOBİL, AHEPAD)
Financial Systems
Transformation(GL / FAH)
Insurance Applications
Transformation
Integrated BI and
Reporting Platform(Atlas)

35
Anadolu Hayat EmeklilikFocus on Customer Retention
97
98
99
100O
ct-
03
Jan
-04
Ap
r-04
Jul-0
4
Oct-
04
Jan
-05
Ap
r-05
Jul-0
5
Oct-
05
Jan
-06
Ap
r-06
Jul-0
6
Oct-
06
Jan
-07
Ap
r-07
Jul-0
7
Oct-
07
Jan
-08
Ap
r-08
Jul-0
8
Oct-
08
Jan
-09
Ap
r-09
Jul-0
9
Oct-
09
Jan
-10
Ap
r-10
Jul-1
0
Oct-
10
Jan
-11
Ap
r-11
Jul-1
1
Oct-
11
Jan
-12
Ap
r-12
Jul-1
2
Oct-
12
Jan
-13
Ap
r-13
Jul-1
3
Oct-
13
Jan
-14
Ap
r-14
Jul-1
4
Oct-
14
Jan
-15
Ap
r-15
Jul-1
5
Oct-
15
Jan
-16
Ap
r-16
Jul-1
6
Oct-
16
Jan
-17
Ap
r-17
Jul-1
7
Oct-
17
Jan
-18
Continuity Index (%)
AHE System Sector Average
* Pension Monitoring Center data as of February 2018 (last 12 months’ average)
• Key account management
• Consultancy through investment managers
• Exclusive customer service on call center
• Special customer loyalty programs
• Premium gifts for special days
Lowest churn rate in
peer group• 1% monthly churn rate* (1.2% sector
average)
Extensive use of CRM• Campaign, lead and customer
complaints management, key account
management
Predictive Modeling
• Churn risk ratios based warning & action
processes
• Customer profiling
• Offers based on customer behaviors
VIP segment
focus
• Campaigns to raise regular and additional
contributions
• Automated collection warning mechanisms.
Collections
Performance
• Customer experience program
• Customer satisfaction surveys & researches
• Actions based on the results of customer
focus group feedback
• Customer journeys based on different
personas
Customer
Experience
ManagementOutbound retention
calls
• Reduce churns, increase cross-selling,
improve customer interaction and keep it
alive, inform, raise regular contributions,
avoid non payment
• Emphasis of benefits in outbound calls

36
Anadolu Hayat EmeklilikA Strong Brand Name
*Celent is a global research and advisory firm for the financial services industry.
**SocialBrands Data Analytics Awards evaluate brands’ performance according to the SocialBrands social media brand index which is
consolidated from independent data
First and only
UNEP-FI member of
Turkish insurance
sector
Received golden prize in
2017 SocialBrands Data
Analytics Awards among
private pension and life
insurance firms **
financial services industry.
«Best corporate
transformation» award
by International Data
Corporation (IDC) Turkey
Turkey’s first company to
receive the prestigious
«Customers’ Friend»
award by ICERTIAS in
customer relationship
management
Anadolu Hayat Emeklilik has
been recognized by Celent as
a winner of a Model Insurer
2018 award for «Legacy and
Ecosystem Transformation».*

37
Anadolu Hayat EmeklilikStrong Market Positioning in Private Pensions
733.137
863.365
1.026.5931.120.505 1.148.227 1.126.904 1.146.723
0,00
200.000,00
400.000,00
600.000,00
800.000,00
1.000.000,00
1.200.000,00
1.400.000,00
2013 2014 2015 2016 2017 2017Q1 2018Q1
18% 17% 17%
Market Share
Participants
Technical Profit (TRY million)
5.243
7.394
8.945
11.366
14.581
12.185
15.126
0,00
2.000,00
4.000,00
6.000,00
8.000,00
10.000,00
12.000,00
14.000,00
16.000,00
2013 2014 2015 2016 2017 2017Q1 2018Q1
20% 20% 19% 19%
Market Share
Assets Under Management (TRY million)
4.3335.497
6.831
8.189
9.6488.507
10.053
0,00
2.000,00
4.000,00
6.000,00
8.000,00
10.000,00
12.000,00
2013 2014 2015 2016 2017 2017Q1 2018Q1
Contributions (TRY million)
Source: Pension Monitoring Center
20% 19% 18% 18%
Market Share
17% 17% 19%
18%
-11,1
3,7
22,0 21,1
67,1
11,8
24,7
-20,00
-10,00
0,00
10,00
20,00
30,00
40,00
50,00
60,00
70,00
80,00
2013 2014 2015 2016 2017 2017Q1 2018Q1
CAGR 106%
17% 16% 19% 19%
18% 18%

38
394,2365
402,1
500,6
574,7
140,8 151,0
0,00
100,00
200,00
300,00
400,00
500,00
600,00
700,00
2013 2014 2015 2016 2017 2017Q1 2018Q1
Anadolu Hayat EmeklilikStrong Market Positioning in Life Insurance
12% 11% 11% 10%
Market Share
Life Insurance GWP (TRY million)
Technical Profit (TRY million)
186,2 198,2
259,0
395,0
459,4
114,0 114,7
0,00
50,00
100,00
150,00
200,00
250,00
300,00
350,00
400,00
450,00
500,00
2013 2014 2015 2016 2017 2017Q1 2018Q1
6% 7% 8% 9%
Market Share
Term Life GWP (TRY million)
Mathematical
Reserves –
Life Insurance
Fund Size
Market Share*
AHE26%
Others; 74%
Market
Leader with
1.7 billion
TRY AUM
*As of 28.02.2018
9% 7.4%
Term Life76%
Saving21%
Annuity3%
2018Q1
63,4 63,8
86,5
112,5
132,6
31,240,8
0,00
20,00
40,00
60,00
80,00
100,00
120,00
140,00
2013 2014 2015 2016 2017 2017Q1 2018Q1
8% 8% 6%*
Source: Insurance Association of Turkey , Life Insurance Information and Monitoring Center

39
Anadolu Hayat EmeklilikStatutory Financials
99,0
134,8
175,9
229,8
279,8
63,4
92,7
0,00
50,00
100,00
150,00
200,00
250,00
300,00
2013 2014 2015 2016 2017 2017Q1 2018Q1
52,367,5
108,3
133,0
199,2
43,0
65,2
0,00
50,00
100,00
150,00
200,00
250,00
2013 2014 2015 2016 2017 2017Q1 2018Q1
Gross Profit for the Period (mio TRY)
Technical Profit (mio TRY)
124 128 184 215 249
620710
789877
949
0
200
400
600
800
1000
1200
1400
2013 2014 2015 2016 2017
Required Capital Total Capital
500% 553% 430% 408%
Capital Adequacy Ratio
Shareholders’ Equity and Capital Adequacy Ratio (mio TRY)
2013 2014 2015 2016 2017
ROAE 15% 16% 20% 23% 25%
381%

40
Anadolu Hayat EmeklilikStatutory Financials
Net Distributable Profit / Dividend to Shareholders (mio TRY) Dividend Payout Ratio (%)
8290
142
186
221
5060
100
140
170
0
50
100
150
200
250
2013 2014 2015 2016 2017
Net Distributable Profit Dividend to Shareholders
61
6770
7577
2013 2014 2015 2016 2017
Cash Dividend / Net Distributable Profit (%)
0.14 0.16 0.24 0.33 0.40
Dividend per Share Gross (TRY)
41
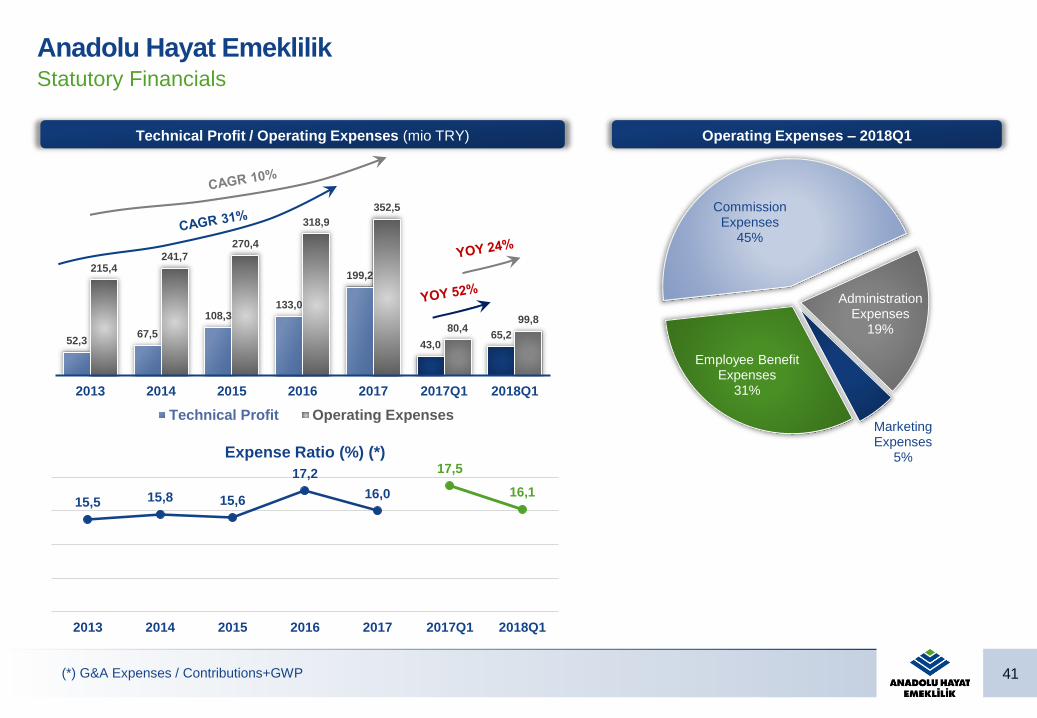
Anadolu Hayat EmeklilikStatutory Financials
52,367,5
108,3133,0
199,2
43,065,2
215,4241,7
270,4
318,9
352,5
80,499,8
0,00
50,00
100,00
150,00
200,00
250,00
300,00
350,00
400,00
2013 2014 2015 2016 2017 2017Q1 2018Q1
Technical Profit Operating Expenses
Technical Profit / Operating Expenses (mio TRY)
MarketingExpenses
5%
Employee BenefitExpenses
31%
Commission Expenses
45%
Administration Expenses
19%
Operating Expenses – 2018Q1
15,5 15,8 15,6
17,2
16,0
17,5
16,1
2013 2014 2015 2016 2017 2017Q1 2018Q1
Expense Ratio (%) (*)
(*) G&A Expenses / Contributions+GWP

42
Anadolu Hayat EmeklilikStatutory Financials
Summary of Income Statement
*Four period (2014-2017) of Pension Technical Profit is used in the calculation of CAGR because of the technical loss in 2013.
(mio TRY) 2013 2014 2015 2016 2017 CAGR 2017Q1 20178Q1 YOY
Non-Life Technical Profit / Loss 0.02 -0.03 -0.24 -0.57 -0.54 - 0.01 -0.24 -
Life Technical Profit / Loss 63.41 63.80 86.48 112.49 132.61 20% 31.16 40.79 31%
Pension Technical Profit / Loss -11.14 3.69 22.02 21.09 67.12 163%* 11.83 24.66 108%
General Technical Profit / Loss 52.29 67.46 108.26 133.01 199.19 40% 43.00 65.21 52%
Net Investment Income 48.39 69.61 72.07 101.88 98.20 19% 25.79 32.70 27%
Other Income/Expenses -2.20 -2.30 -4.48 -5.09 -17.58 68% -5.43 -5.23 -4%
Profit Before Taxes 98.48 134.77 175.85 229.80 279.81 30% 63.36 92.67 46%

43
Anadolu Hayat EmeklilikStatutory Financials
Pension Technical Profit
*Four period (2014-2017) of Pension Technical Profit is used in the calculation of CAGR because of the technical loss in 2013.
(mio TRY) 2013 2014 2015 2016 2017 CAGR 2017Q1 2018Q1 YOY
Pension Technical Income 132.00 166.57 209.06 236.76 300.55 23% 65.55 87.34 33%
1- Fund Management Income 90.76 113.57 144.26 173.82 216.74 24% 49.20 61.60 25%
2- Management Fee 17.77 21.58 26.38 21.20 32.96 17% 6.03 11.17 85%
3- Entrance Fee Income 20.24 26.13 32.05 37.08 42.60 20% 9.16 11.81 29%
4- Other Technical Income 3.23 5.29 6.37 4.66 8.25 26% 1.16 2.76 138%
Pension Technical Expense -143.14 -162.88 -187.04 -215.67 -233.43 13% -53.72 -62.68 17%
1- Total Fund Expenses -16.30 -16.99 -22.34 -24.57 -31.08 18% -7.32 -7.26 -1%
2- Operating Expenses -125.96 -144.11 -157.26 -181.71 -187.91 11% -43.24 -51.03 18%
3- Other Technical Expenses -0.88 -1.78 -7.44 -9.39 -14.44 101% -3.16 -4.39 39%
Pension Technical Profit -11.14 3.69 22.02 21.09 67.12 163%* 11.83 24.66 108%

44
Anadolu Hayat EmeklilikStatutory Financials
Life Technical Profit
Technical Margin
(Technical Profit / Earned Premiums)16.6% 18.1% 22.1% 23.7% 24.4%
*Technical results of four year (2013-2016) are taken into consideration in this calculation, since the result of 2017 is negative.
(mio TRY) 2013 2014 2015 2016 2017 CAGR 2017Q1 2018Q1 YOY
Life Technical Income 598.51 550.43 602.51 700.85 741.97 6% 190.27 218.17 15%
1- Earned Premiums (Net of Reinsurer Share) 382.88 353.32 391.78 475.43 544.07 9% 132.13 152.47 15%
2- Investment Income 206.89 188.62 202.87 214.83 190.80 -2% 55.90 62.80 12%
3- Other Technical Income 8.74 8.49 7.86 10.59 7.10 -5% 2.24 2.90 29%
Life Technical Expense -535.10 -486.63 -516.03 -588.36 -609.36 3% -159.11 -177.38 11%
1- Incurred Losses (Net of Reinsurer Share) -527.63 -542.81 -426.60 -448.86 -403.40 -6% -114.97 -103.20 -10%
2- Change in Provision for Bonus and Discounts 0.13 -0.03 -0.15 -0.14 0,16 - 0.00 -0.02 -
3- Change in Life Mathematical Provisions 83.43 155.52 26.54 2.27 -36.53 -59%* -5.70 -24.17 -
4- Change in Other Technical Provisions -2.00 -2.19 -3.11 -4.96 -5,81 31% -1.44 -1.43 -
5- Operating Expenses -89.03 -97.12 -112.71 -136.67 -163.78 16% -37.00 -48.56 31%
Life Technical Profit 63.41 63.80 86.48 112.49 132.61 20% 31.16 40.79 31%
23.6% 26.8%

45
DISCLAIMER
The information in this document has been obtained by Anadolu Hayat Emeklilik A.Ş. from sources believed to
be reliable, however, Anadolu Hayat Emeklilik A.Ş. cannot guarantee the accuracy, completeness or
correctness of such information. This document has been issued for information purposes only. The financial
reports and statements announced by Anadolu Hayat Emeklilik A.Ş. to the public and relevant corporations are
accepted to be the sole material. Anadolu Hayat Emeklilik A.Ş. does not accept any liability whatsoever for any
direct or consequential loss arising from any use of this document or its contents due to the misleading
information in this document. All estimations contained in this document are opinions of Anadolu Hayat
Emeklilik A.Ş. and can be subject to change without notice. This document cannot be interpreted as an advice
to the investors and Anadolu Hayat Emeklilik A.Ş. cannot be held responsible for the results of investment
decisions made on account of this document. This document has been issued specially to the person, whom
the document is concerned and may not be reproduced, distributed or shared with third parties for any purpose.
www.anadoluhayat.com.tr