Embed Size (px)
Citation preview
Availability of Free Space Optics (FSO) and hybrid FSO/RF systems
Isaac I. Kim and Eric Korevaar
Optical Access Incorporated
10343 Roselle Street San Diego, CA 92121
ABSTRACT Free Space Optics (FSO) has become a viable, high-bandwidth wireless alternative to fiber optic cabling. The primary advantages of FSO over fiber are its rapid deployment time and significant cost savings. The disadvantage of FSO over fiber is that laser power attenuation through the atmosphere is variable and difficult to predict, since it is weather dependent. This factor limits the distance at which FSO should be deployed. Using historical weather data collected at airports, the link availability as a function of distance can be predicted for any FSO system. These availability curves provide a good indication of the reasonable link distances for FSO systems in a particular geographical area. FSO link distances can vary greatly from desert areas like Las Vegas to heavy-fog cities like St. Johns NF. Another factor in determining FSO distance limitations is the link availability expectation of the application. For enterprise applications, link availability requirements are generally greater than 99%. This allows for longer FSO link ranges, based on the availability curves. The enterprise market is where the majority of FSO systems have been deployed. The carriers and ISPs are another potential large user of FSO systems, especially for “last-mile” metro access applications. If FSO systems are to be used in telecommunication applications, they will need to meet much higher availability requirements. Carrier-class availability is generally considered to be 99.999% (“5 nines”). An analysis of link budgets and visibility-limiting weather conditions indicates that to meet carrier-class availability, FSO links should normally be less than 140 m (there are cities like Phoenix and Las Vegas where this 99.999% distance limitation increases significantly). This calculation is based on a 53 dB link budget. This concept is extended to the “best possible” FSO system, which would have a 10 W transmitter and a photo-counting detector with a sensitivity of 1 nW. This FSO system would have a 100 dB link margin, which would only increase the 99.999% link distance to 286 m. A more practical solution to extending the high availability range would be to back-up the FSO link with a lower data rate radio frequency (RF) link. This hybrid FSO/RF system would extend the 99.999% link range to longer distances and open up a much larger metro/access market to the carriers. It is important to realize that as the link range increases, there will be a slight decrease in overall bandwidth. To show the geographical dependence of FSO performance, the first map of FSO availabilities contoured over North America is presented. This map is the first step to developing an attenuation map for predicting FSO performance, which could be used in a similar fashion to the International Telecommunication Union (ITU)/Crane maps for predicting microwave performance. Keywords: free space optics, FSO, laser communication, lasercom, optical wireless, infrared, atmospheric attenuation, visibility, availability, link distance, link range, enterprise, carrier, internet service provider, ISP, telecommunications, last mile, radio frequency, RF, microwave, International Telecommunication Union, ITU, Crane, bandwidth
1. INTRODUCTION
Free Space Optics (FSO) is gaining market acceptance as a functional, wireless, high-bandwidth access tool. Fiber-optic cabling is still the preferred media for long haul, high-bandwidth transport. However, because of FSO’s lower cost and significantly shorter installation time, FSO is now considered a viable option to fiber for short-haul access distances of 4 km or less. As the awareness of FSO technology increases, and as the installation base of FSO links increases, FSO is overcoming the early market barriers that faced this new access technology. _____________________________________ Further author information I.I.K. (correspondence): Email: [email protected]; Web: http://www.opticalaccess.com;
Telephone: 858-792-8501; Fax: 858-792-8503
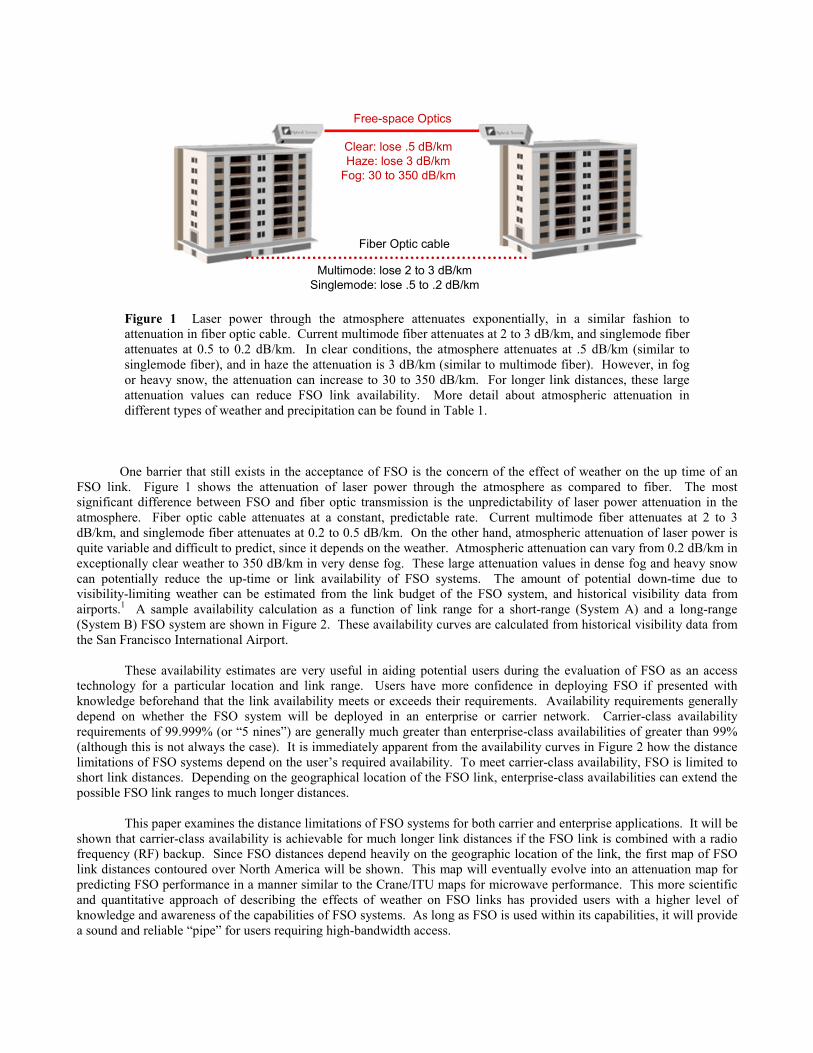
Fiber Optic cable
Multimode: lose 2 to 3 dB/kmSinglemode: lose .5 to .2 dB/km
Free-space Optics
Clear: lose .5 dB/kmHaze: lose 3 dB/km
Fog: 30 to 350 dB/km
Figure 1 Laser power through the atmosphere attenuates exponentially, in a similar fashion to attenuation in fiber optic cable. Current multimode fiber attenuates at 2 to 3 dB/km, and singlemode fiber attenuates at 0.5 to 0.2 dB/km. In clear conditions, the atmosphere attenuates at .5 dB/km (similar to singlemode fiber), and in haze the attenuation is 3 dB/km (similar to multimode fiber). However, in fog or heavy snow, the attenuation can increase to 30 to 350 dB/km. For longer link distances, these large attenuation values can reduce FSO link availability. More detail about atmospheric attenuation in different types of weather and precipitation can be found in Table 1.
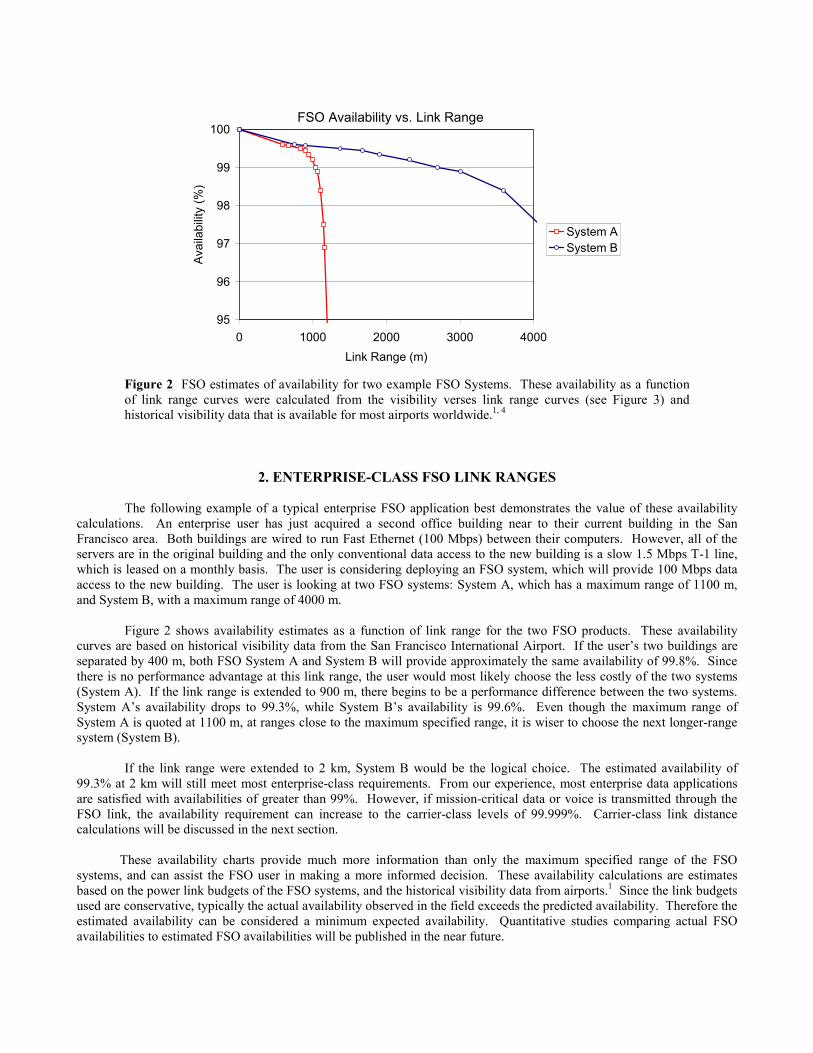
One barrier that still exists in the acceptance of FSO is the concern of the effect of weather on the up time of an FSO link. Figure 1 shows the attenuation of laser power through the atmosphere as compared to fiber. The most significant difference between FSO and fiber optic transmission is the unpredictability of laser power attenuation in the atmosphere. Fiber optic cable attenuates at a constant, predictable rate. Current multimode fiber attenuates at 2 to 3 dB/km, and singlemode fiber attenuates at 0.2 to 0.5 dB/km. On the other hand, atmospheric attenuation of laser power is quite variable and difficult to predict, since it depends on the weather. Atmospheric attenuation can vary from 0.2 dB/km in exceptionally clear weather to 350 dB/km in very dense fog. These large attenuation values in dense fog and heavy snow can potentially reduce the up-time or link availability of FSO systems. The amount of potential down-time due to visibility-limiting weather can be estimated from the link budget of the FSO system, and historical visibility data from airports.1 A sample availability calculation as a function of link range for a short-range (System A) and a long-range (System B) FSO system are shown in Figure 2. These availability curves are calculated from historical visibility data from the San Francisco International Airport.
These availability estimates are very useful in aiding potential users during the evaluation of FSO as an access technology for a particular location and link range. Users have more confidence in deploying FSO if presented with knowledge beforehand that the link availability meets or exceeds their requirements. Availability requirements generally depend on whether the FSO system will be deployed in an enterprise or carrier network. Carrier-class availability requirements of 99.999% (or “5 nines”) are generally much greater than enterprise-class availabilities of greater than 99% (although this is not always the case). It is immediately apparent from the availability curves in Figure 2 how the distance limitations of FSO systems depend on the user’s required availability. To meet carrier-class availability, FSO is limited to short link distances. Depending on the geographical location of the FSO link, enterprise-class availabilities can extend the possible FSO link ranges to much longer distances.
This paper examines the distance limitations of FSO systems for both carrier and enterprise applications. It will be
shown that carrier-class availability is achievable for much longer link distances if the FSO link is combined with a radio frequency (RF) backup. Since FSO distances depend heavily on the geographic location of the link, the first map of FSO link distances contoured over North America will be shown. This map will eventually evolve into an attenuation map for predicting FSO performance in a manner similar to the Crane/ITU maps for microwave performance. This more scientific and quantitative approach of describing the effects of weather on FSO links has provided users with a higher level of knowledge and awareness of the capabilities of FSO systems. As long as FSO is used within its capabilities, it will provide a sound and reliable “pipe” for users requiring high-bandwidth access.
FSO Availability vs. Link Range
95
96
97
98
99
100
0 1000 2000 3000 4000Link Range (m)
Avai
labi
lity
(%)
System ASystem B
Figure 2 FSO estimates of availability for two example FSO Systems. These availability as a function of link range curves were calculated from the visibility verses link range curves (see Figure 3) and historical visibility data that is available for most airports worldwide.1, 4
2. ENTERPRISE-CLASS FSO LINK RANGES
The following example of a typical enterprise FSO application best demonstrates the value of these availability calculations. An enterprise user has just acquired a second office building near to their current building in the San Francisco area. Both buildings are wired to run Fast Ethernet (100 Mbps) between their computers. However, all of the servers are in the original building and the only conventional data access to the new building is a slow 1.5 Mbps T-1 line, which is leased on a monthly basis. The user is considering deploying an FSO system, which will provide 100 Mbps data access to the new building. The user is looking at two FSO systems: System A, which has a maximum range of 1100 m, and System B, with a maximum range of 4000 m.
Figure 2 shows availability estimates as a function of link range for the two FSO products. These availability curves are based on historical visibility data from the San Francisco International Airport. If the user’s two buildings are separated by 400 m, both FSO System A and System B will provide approximately the same availability of 99.8%. Since there is no performance advantage at this link range, the user would most likely choose the less costly of the two systems (System A). If the link range is extended to 900 m, there begins to be a performance difference between the two systems. System A’s availability drops to 99.3%, while System B’s availability is 99.6%. Even though the maximum range of System A is quoted at 1100 m, at ranges close to the maximum specified range, it is wiser to choose the next longer-range system (System B).
If the link range were extended to 2 km, System B would be the logical choice. The estimated availability of
99.3% at 2 km will still meet most enterprise-class requirements. From our experience, most enterprise data applications are satisfied with availabilities of greater than 99%. However, if mission-critical data or voice is transmitted through the FSO link, the availability requirement can increase to the carrier-class levels of 99.999%. Carrier-class link distance calculations will be discussed in the next section.
These availability charts provide much more information than only the maximum specified range of the FSO systems, and can assist the FSO user in making a more informed decision. These availability calculations are estimates based on the power link budgets of the FSO systems, and the historical visibility data from airports.1 Since the link budgets used are conservative, typically the actual availability observed in the field exceeds the predicted availability. Therefore the estimated availability can be considered a minimum expected availability. Quantitative studies comparing actual FSO availabilities to estimated FSO availabilities will be published in the near future.
Visibility
50 m
200 m
500 m
1 km
1.9 km
2 km
2.8 km
10 km
4 km
20 km
23 km
50 km
Weathercondition
Dense fog
Thick fog
Moderate fog
Light fog
0 m
Thin fog
Haze
Light Haze
Clear
Very Clear
Precipitation
Heavy rain
Medium rain
mm/hr
770 mCloudburst 100
25
12.5
18.1 kmDrizzle 0.25
5.9 kmLight rain 2.5Sn
ow
FSOSystem A
Range
330 m
610 m
880 m
1.02 km
1.08 km
1.13 km
1.26 km
1.26 km
1.03 km
1.28 km
1.22 km
780 m
1.25 km
1.18 km
110 m
FSOSystem B
Range
7.42 km
7.23 km
8.22 km
440 m
890 m
1.67 km
2.59km
3.30 km
4.07 km
2.68 km
6.08 km
1.32 km
7.08 km
5.04 km
140m
0 m 0 m
dB/kmLoss
(785 nm)
-84.9
-34.0
-14.2
-7.1
-4.6
-3.0
-0.53
-0.46
-6.7
-0.21
-1.1
-20.0
-0.6
-1.8
-339.6
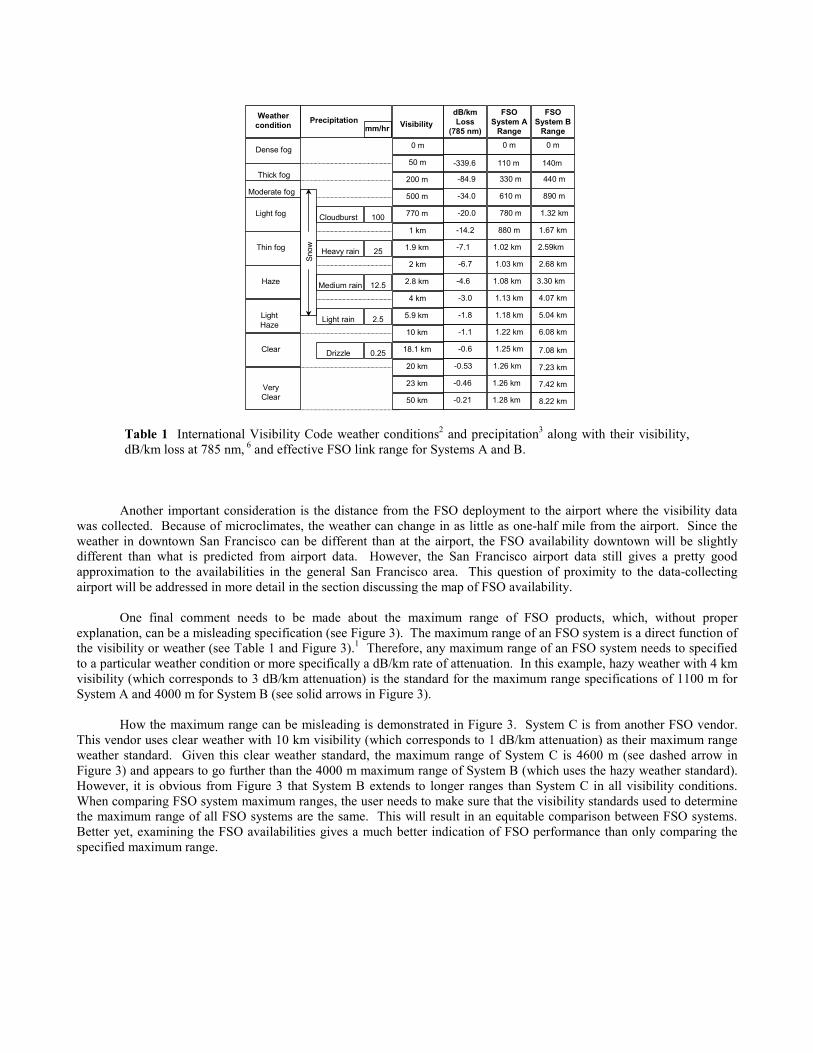
Table 1 International Visibility Code weather conditions2 and precipitation3 along with their visibility, dB/km loss at 785 nm, 6 and effective FSO link range for Systems A and B.
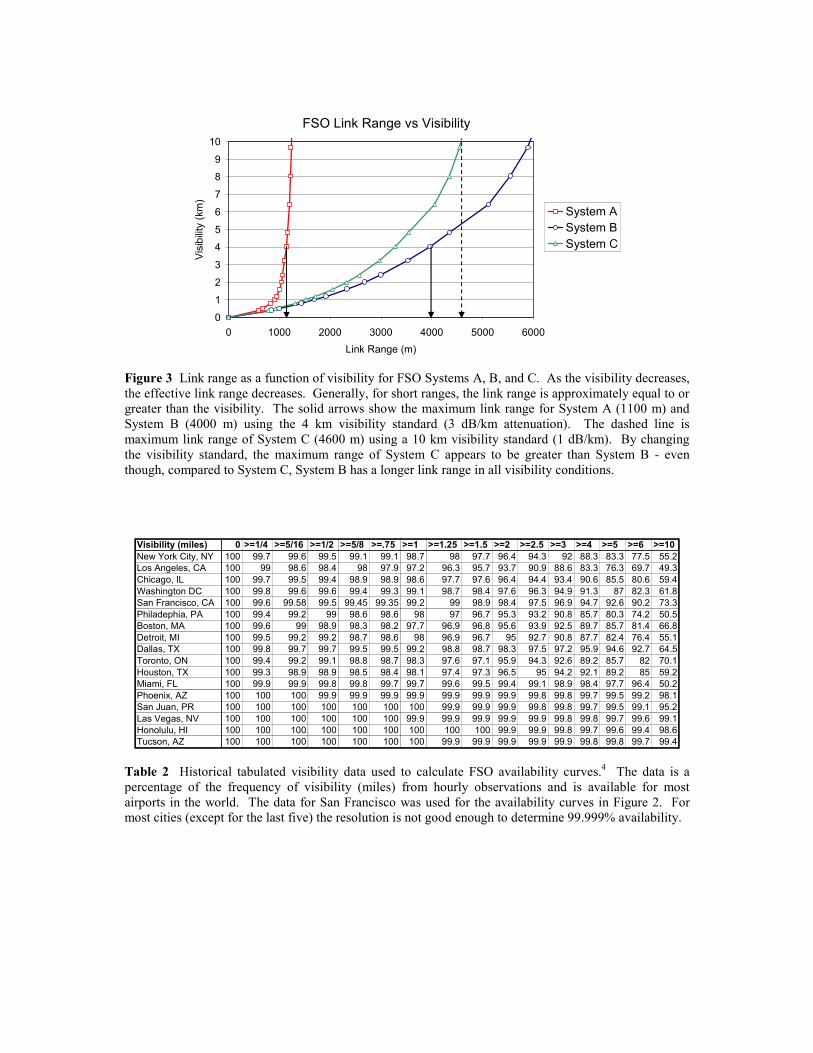
Another important consideration is the distance from the FSO deployment to the airport where the visibility data was collected. Because of microclimates, the weather can change in as little as one-half mile from the airport. Since the weather in downtown San Francisco can be different than at the airport, the FSO availability downtown will be slightly different than what is predicted from airport data. However, the San Francisco airport data still gives a pretty good approximation to the availabilities in the general San Francisco area. This question of proximity to the data-collecting airport will be addressed in more detail in the section discussing the map of FSO availability. One final comment needs to be made about the maximum range of FSO products, which, without proper explanation, can be a misleading specification (see Figure 3). The maximum range of an FSO system is a direct function of the visibility or weather (see Table 1 and Figure 3).1 Therefore, any maximum range of an FSO system needs to specified to a particular weather condition or more specifically a dB/km rate of attenuation. In this example, hazy weather with 4 km visibility (which corresponds to 3 dB/km attenuation) is the standard for the maximum range specifications of 1100 m for System A and 4000 m for System B (see solid arrows in Figure 3). How the maximum range can be misleading is demonstrated in Figure 3. System C is from another FSO vendor. This vendor uses clear weather with 10 km visibility (which corresponds to 1 dB/km attenuation) as their maximum range weather standard. Given this clear weather standard, the maximum range of System C is 4600 m (see dashed arrow in Figure 3) and appears to go further than the 4000 m maximum range of System B (which uses the hazy weather standard). However, it is obvious from Figure 3 that System B extends to longer ranges than System C in all visibility conditions. When comparing FSO system maximum ranges, the user needs to make sure that the visibility standards used to determine the maximum range of all FSO systems are the same. This will result in an equitable comparison between FSO systems. Better yet, examining the FSO availabilities gives a much better indication of FSO performance than only comparing the specified maximum range.
FSO Link Range vs Visibility
0123
45
6789
10
0 1000 2000 3000 4000 5000 6000Link Range (m)
Visi
bilit
y (k
m)
System ASystem BSystem C
Figure 3 Link range as a function of visibility for FSO Systems A, B, and C. As the visibility decreases, the effective link range decreases. Generally, for short ranges, the link range is approximately equal to or greater than the visibility. The solid arrows show the maximum link range for System A (1100 m) and System B (4000 m) using the 4 km visibility standard (3 dB/km attenuation). The dashed line is maximum link range of System C (4600 m) using a 10 km visibility standard (1 dB/km). By changing the visibility standard, the maximum range of System C appears to be greater than System B - even though, compared to System C, System B has a longer link range in all visibility conditions.
Visibility (miles) 0 >=1/4 >=5/16 >=1/2 >=5/8 >=.75 >=1 >=1.25 >=1.5 >=2 >=2.5 >=3 >=4 >=5 >=6 >=10New York City, NY 100 99.7 99.6 99.5 99.1 99.1 98.7 98 97.7 96.4 94.3 92 88.3 83.3 77.5 55.2Los Angeles, CA 100 99 98.6 98.4 98 97.9 97.2 96.3 95.7 93.7 90.9 88.6 83.3 76.3 69.7 49.3Chicago, IL 100 99.7 99.5 99.4 98.9 98.9 98.6 97.7 97.6 96.4 94.4 93.4 90.6 85.5 80.6 59.4Washington DC 100 99.8 99.6 99.6 99.4 99.3 99.1 98.7 98.4 97.6 96.3 94.9 91.3 87 82.3 61.8San Francisco, CA 100 99.6 99.58 99.5 99.45 99.35 99.2 99 98.9 98.4 97.5 96.9 94.7 92.6 90.2 73.3Philadephia, PA 100 99.4 99.2 99 98.6 98.6 98 97 96.7 95.3 93.2 90.8 85.7 80.3 74.2 50.5Boston, MA 100 99.6 99 98.9 98.3 98.2 97.7 96.9 96.8 95.6 93.9 92.5 89.7 85.7 81.4 66.8Detroit, MI 100 99.5 99.2 99.2 98.7 98.6 98 96.9 96.7 95 92.7 90.8 87.7 82.4 76.4 55.1Dallas, TX 100 99.8 99.7 99.7 99.5 99.5 99.2 98.8 98.7 98.3 97.5 97.2 95.9 94.6 92.7 64.5Toronto, ON 100 99.4 99.2 99.1 98.8 98.7 98.3 97.6 97.1 95.9 94.3 92.6 89.2 85.7 82 70.1Houston, TX 100 99.3 98.9 98.9 98.5 98.4 98.1 97.4 97.3 96.5 95 94.2 92.1 89.2 85 59.2Miami, FL 100 99.9 99.9 99.8 99.8 99.7 99.7 99.6 99.5 99.4 99.1 98.9 98.4 97.7 96.4 50.2Phoenix, AZ 100 100 100 99.9 99.9 99.9 99.9 99.9 99.9 99.9 99.8 99.8 99.7 99.5 99.2 98.1San Juan, PR 100 100 100 100 100 100 100 99.9 99.9 99.9 99.8 99.8 99.7 99.5 99.1 95.2Las Vegas, NV 100 100 100 100 100 100 99.9 99.9 99.9 99.9 99.9 99.8 99.8 99.7 99.6 99.1Honolulu, HI 100 100 100 100 100 100 100 100 100 99.9 99.9 99.8 99.7 99.6 99.4 98.6Tucson, AZ 100 100 100 100 100 100 100 99.9 99.9 99.9 99.9 99.9 99.8 99.8 99.7 99.4
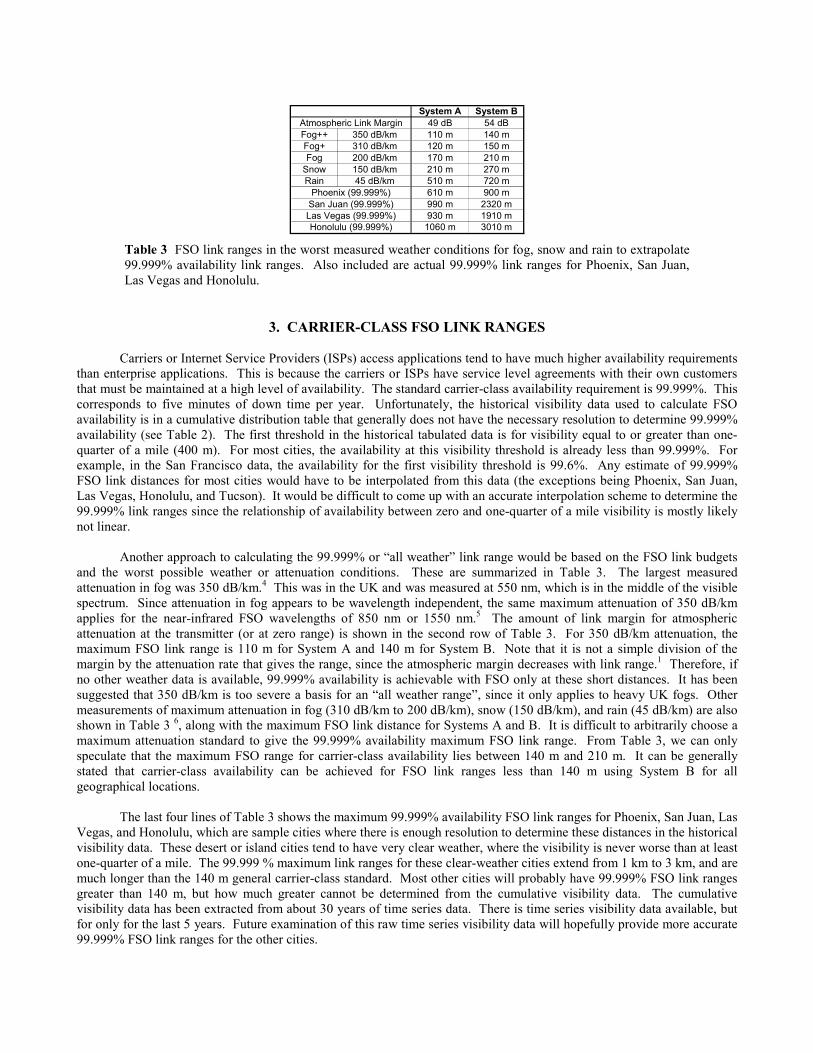
Table 2 Historical tabulated visibility data used to calculate FSO availability curves.4 The data is a percentage of the frequency of visibility (miles) from hourly observations and is available for most airports in the world. The data for San Francisco was used for the availability curves in Figure 2. For most cities (except for the last five) the resolution is not good enough to determine 99.999% availability.
System A System B49 dB 54 dB
Fog++ 350 dB/km 110 m 140 mFog+ 310 dB/km 120 m 150 mFog 200 dB/km 170 m 210 m
Snow 150 dB/km 210 m 270 mRain 45 dB/km 510 m 720 m
610 m 900 m990 m 2320 m930 m 1910 m1060 m 3010 mHonolulu (99.999%)
Atmospheric Link Margin
Phoenix (99.999%)San Juan (99.999%)Las Vegas (99.999%)
Table 3 FSO link ranges in the worst measured weather conditions for fog, snow and rain to extrapolate 99.999% availability link ranges. Also included are actual 99.999% link ranges for Phoenix, San Juan, Las Vegas and Honolulu.
3. CARRIER-CLASS FSO LINK RANGES Carriers or Internet Service Providers (ISPs) access applications tend to have much higher availability requirements than enterprise applications. This is because the carriers or ISPs have service level agreements with their own customers that must be maintained at a high level of availability. The standard carrier-class availability requirement is 99.999%. This corresponds to five minutes of down time per year. Unfortunately, the historical visibility data used to calculate FSO availability is in a cumulative distribution table that generally does not have the necessary resolution to determine 99.999% availability (see Table 2). The first threshold in the historical tabulated data is for visibility equal to or greater than one-quarter of a mile (400 m). For most cities, the availability at this visibility threshold is already less than 99.999%. For example, in the San Francisco data, the availability for the first visibility threshold is 99.6%. Any estimate of 99.999% FSO link distances for most cities would have to be interpolated from this data (the exceptions being Phoenix, San Juan, Las Vegas, Honolulu, and Tucson). It would be difficult to come up with an accurate interpolation scheme to determine the 99.999% link ranges since the relationship of availability between zero and one-quarter of a mile visibility is mostly likely not linear. Another approach to calculating the 99.999% or “all weather” link range would be based on the FSO link budgets and the worst possible weather or attenuation conditions. These are summarized in Table 3. The largest measured attenuation in fog was 350 dB/km.4 This was in the UK and was measured at 550 nm, which is in the middle of the visible spectrum. Since attenuation in fog appears to be wavelength independent, the same maximum attenuation of 350 dB/km applies for the near-infrared FSO wavelengths of 850 nm or 1550 nm.5 The amount of link margin for atmospheric attenuation at the transmitter (or at zero range) is shown in the second row of Table 3. For 350 dB/km attenuation, the maximum FSO link range is 110 m for System A and 140 m for System B. Note that it is not a simple division of the margin by the attenuation rate that gives the range, since the atmospheric margin decreases with link range.1 Therefore, if no other weather data is available, 99.999% availability is achievable with FSO only at these short distances. It has been suggested that 350 dB/km is too severe a basis for an “all weather range”, since it only applies to heavy UK fogs. Other measurements of maximum attenuation in fog (310 dB/km to 200 dB/km), snow (150 dB/km), and rain (45 dB/km) are also shown in Table 3 6, along with the maximum FSO link distance for Systems A and B. It is difficult to arbitrarily choose a maximum attenuation standard to give the 99.999% availability maximum FSO link range. From Table 3, we can only speculate that the maximum FSO range for carrier-class availability lies between 140 m and 210 m. It can be generally stated that carrier-class availability can be achieved for FSO link ranges less than 140 m using System B for all geographical locations. The last four lines of Table 3 shows the maximum 99.999% availability FSO link ranges for Phoenix, San Juan, Las Vegas, and Honolulu, which are sample cities where there is enough resolution to determine these distances in the historical visibility data. These desert or island cities tend to have very clear weather, where the visibility is never worse than at least one-quarter of a mile. The 99.999 % maximum link ranges for these clear-weather cities extend from 1 km to 3 km, and are much longer than the 140 m general carrier-class standard. Most other cities will probably have 99.999% FSO link ranges greater than 140 m, but how much greater cannot be determined from the cumulative visibility data. The cumulative visibility data has been extracted from about 30 years of time series data. There is time series visibility data available, but for only for the last 5 years. Future examination of this raw time series visibility data will hopefully provide more accurate 99.999% FSO link ranges for the other cities.
Transmit power 30 mW 15 dBm 10 W 40 dBmDetector sensitivity 25 nW -46 dBm 1 nW -60 dBmMispointing loss 3 dB 0Optical loss 4 dB 0Link Margin 54 dB 100 dBRange in 350 dB/km fog 140 m 286 m
System B System Z
Table 4 Link budgets and corresponding range in 350 dB/km fog for System B and the fictitious “best possible” System Z. Even with 10 W of transmit power and a 1 nW detector (along with perfect optics), the link range in the heaviest 350 dB/km fog (which corresponds to the 99.999% link range) only increases from 140 m to 286 m.
4. THE BEST POSSIBLE FSO SYSTEM What if the “best-possible” FSO system could be built without regard to cost? How much further could the 99.999% availability link distance be extended beyond the 140 m available using the reasonably priced System B? The results comparing FSO System B to the “best-possible” System Z are summarized in Table 4. The highest conceivable transmit power that System Z could use at this time is 10 Watts (40 dBm) (compared to 30 mW or 15 dBm for System B). The minimum conceivable receive power for a data rate above 100 Mbps is 1 nW (-60 dBm) (compared to 25 nW or –46 dBm for System B). This assumes photon-counting statistics, and is better than any available detector. Now assume System Z uses an unrealistically perfect telescope system that couples all of the transmitted light into the detector at the far end of the link. This would result in no mispointing loss, optical loss, or geometrical spreading loss in the link budget for System Z (as opposed to the more realistic link budget for System B, which loses 3 dB for mispointing, 4 dB in optical losses, and an increasing large number of dBs as the range increases for geometrical spreading1). System Z would have an incredible 100 dB of margin for atmospheric attenuation (compared to 54 dB for System B). Even with this 100 dB of margin (which is 10 factors of 10), in the heaviest 350 dB/km fog, the maximum link range only increases to 286 m. In reality, the available margin will be considerably less because of scintillation loss and geometrical spreading loss, which results because typical FSO systems expand the transmitted laser beam to be larger than the receive telescope.1 This example shows that efforts to produce large amounts of transmit power in FSO systems do not result in a significant increase in the link distance in fog, due to the exponential nature of atmospheric attenuation. One argument for the use of 1550 nm over 785 or 850 nm is that because the eye safety limit is higher at 1550 nm, more laser power can be transmitted. The eye safety limit of 1550 nm is 100 mW/cm2, which is 50 times greater than the allowable 2.0 mW/cm2 for 850 nm transmission.9 If the transmit aperture is 4 inches in diameter, to maintain eye safety at the aperture, the maximum transmit power allowable at 850 nm is 160 mW. At 1550 nm, the eye safety power limit out of the same 4 inch diameter aperture increases to 8 W. To achieve this large output power, expensive Erbium Doped Fiber Amplifiers (EDFAs) would have to be used. This additional cost to increase the transmit power 50 times, which corresponds to a 17 dB gain in link margin, does not considerably improve FSO performance in heavy visibility-limiting weather (100-350 dB/km). Another argument for the use of 1550 nm over 785 or 850 nm is that there is less atmospheric attenuation at this longer wavelength. While this is most-likely true for clear (0.2 to 1 dB/km) or hazy (3 to 10 dB/km) weather, there appears to be no wavelength dependence for attenuation in fog (30 to 350 dB/km).6 This is demonstrated in Figure 4, which shows a MODTRAN calculation for attenuation in a typical spring west coast fog.7 The atmospheric attenuation rate in this fog is approximately constant for 785 nm and 1550 nm (between 110 and 120 dB/km). In fact, the attenuation rate in this fog remains approximately constant for wavelengths out to 12 µm. This rules out another falsity about FSO that there is some “magical” long IR wavelength that is not affected by fog. What can be done if increasing the transmit power, or using large receive optics with tracking systems do not appreciably increase FSO performance in heavy visibility-limiting weather? The most cost-effective solution would be to incorporate a RF or microwave back-up, which would not be affected by the same heavy, visibility-limiting weather. To maintain the FCC license-free advantage of FSO, the RF back-up should be a license free system. These RF systems have lower bandwidth than the FSO systems. But the percentage of time the RF system will be the primary link is very small compared to the time the large-bandwidth FSO system will be operational. Carrier-class 99.999% availability can be achieved with this hybrid FSO/RF system at much longer ranges than an FSO-only system.
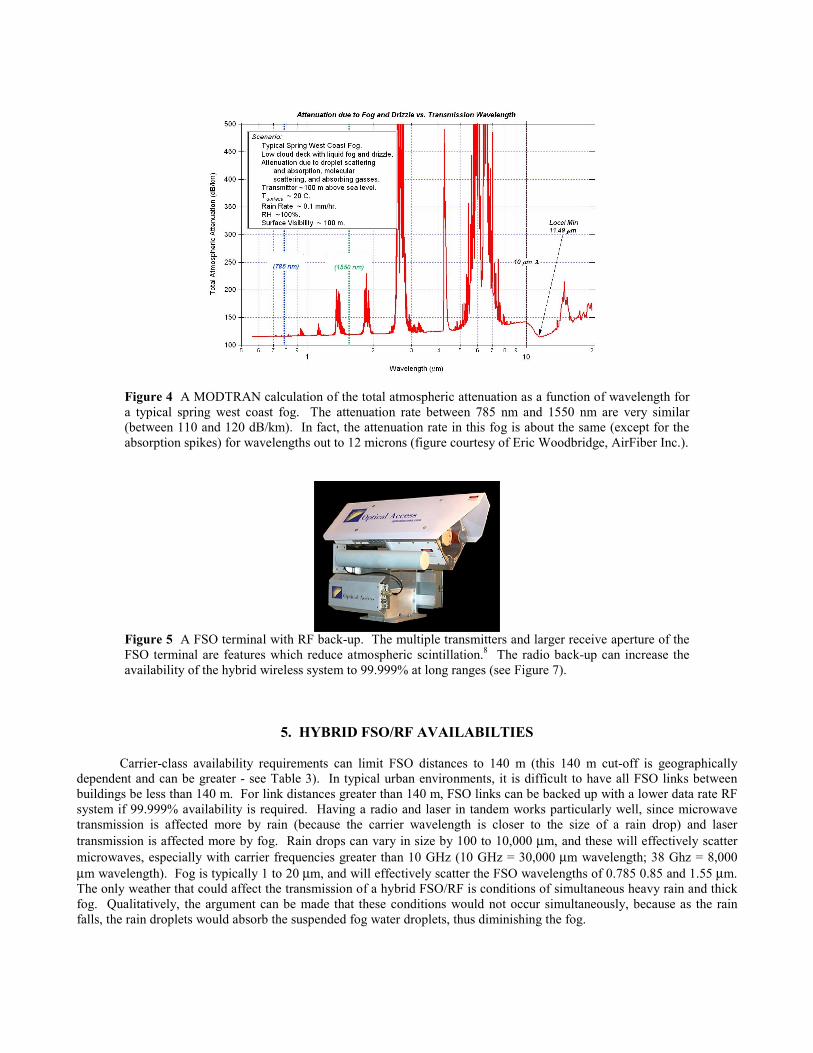
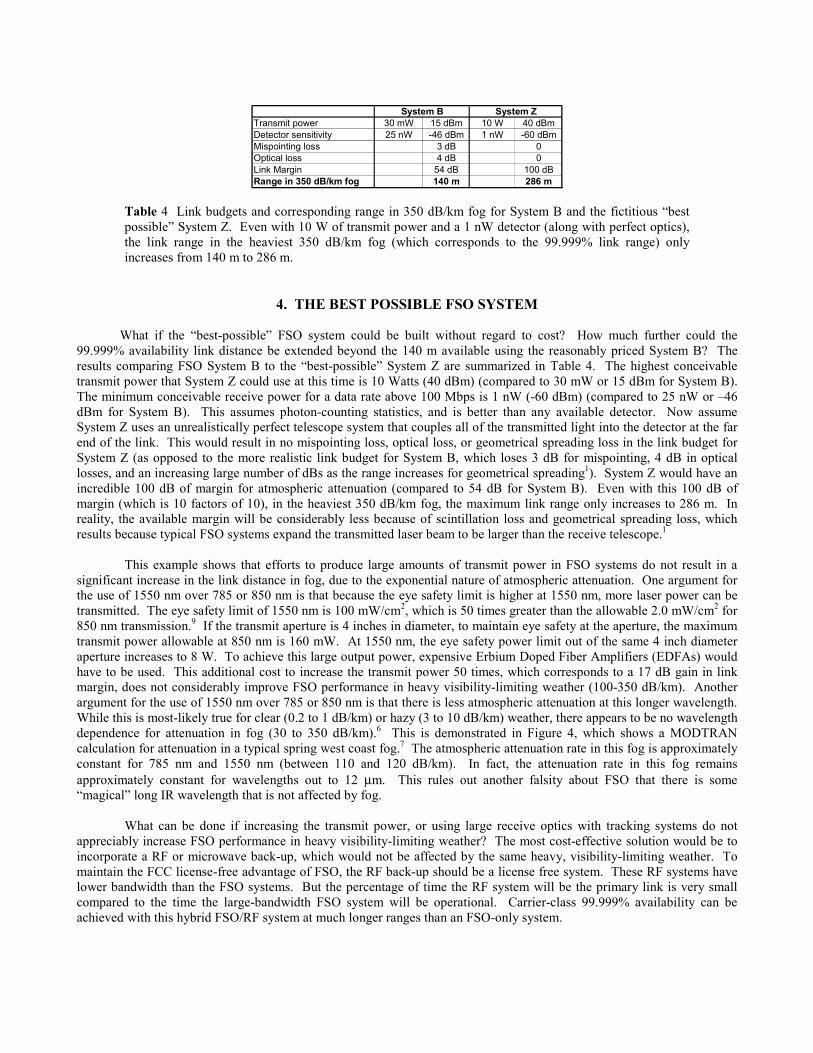
Figure 4 A MODTRAN calculation of the total atmospheric attenuation as a function of wavelength for a typical spring west coast fog. The attenuation rate between 785 nm and 1550 nm are very similar (between 110 and 120 dB/km). In fact, the attenuation rate in this fog is about the same (except for the absorption spikes) for wavelengths out to 12 microns (figure courtesy of Eric Woodbridge, AirFiber Inc.).
Figure 5 A FSO terminal with RF back-up. The multiple transmitters and larger receive aperture of the FSO terminal are features which reduce atmospheric scintillation.8 The radio back-up can increase the availability of the hybrid wireless system to 99.999% at long ranges (see Figure 7).
5. HYBRID FSO/RF AVAILABILTIES Carrier-class availability requirements can limit FSO distances to 140 m (this 140 m cut-off is geographically dependent and can be greater - see Table 3). In typical urban environments, it is difficult to have all FSO links between buildings be less than 140 m. For link distances greater than 140 m, FSO links can be backed up with a lower data rate RF system if 99.999% availability is required. Having a radio and laser in tandem works particularly well, since microwave transmission is affected more by rain (because the carrier wavelength is closer to the size of a rain drop) and laser transmission is affected more by fog. Rain drops can vary in size by 100 to 10,000 µm, and these will effectively scatter microwaves, especially with carrier frequencies greater than 10 GHz (10 GHz = 30,000 µm wavelength; 38 Ghz = 8,000 µm wavelength). Fog is typically 1 to 20 µm, and will effectively scatter the FSO wavelengths of 0.785 0.85 and 1.55 µm. The only weather that could affect the transmission of a hybrid FSO/RF is conditions of simultaneous heavy rain and thick fog. Qualitatively, the argument can be made that these conditions would not occur simultaneously, because as the rain falls, the rain droplets would absorb the suspended fog water droplets, thus diminishing the fog.
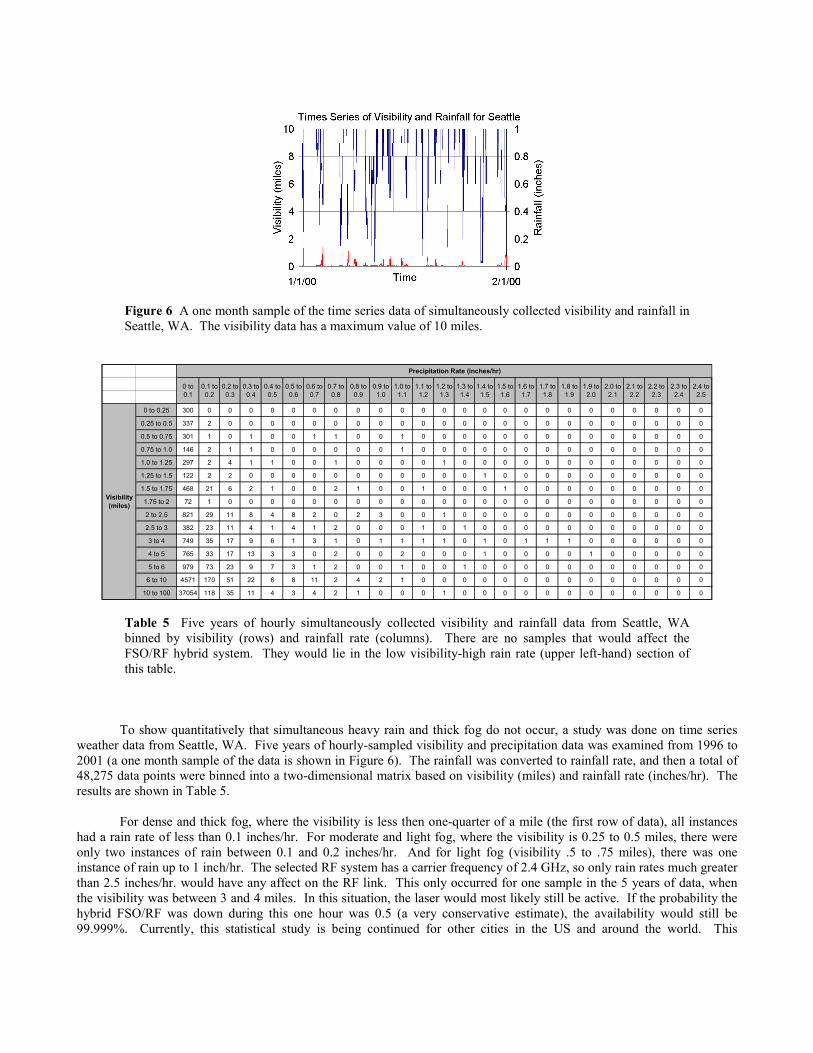
Figure 6 A one month sample of the time series data of simultaneously collected visibility and rainfall in Seattle, WA. The visibility data has a maximum value of 10 miles.
0 to 0.25 300 0 0 0 0 0 0 0 0 0 0 0 0 0 0 0 0 0 0 0 0 0 0 0 0
0.25 to 0.5 337 2 0 0 0 0 0 0 0 0 0 0 0 0 0 0 0 0 0 0 0 0 0 0 0
0.5 to 0.75 301 1 0 1 0 0 1 1 0 0 1 0 0 0 0 0 0 0 0 0 0 0 0 0 0
0.75 to 1.0 146 2 1 1 0 0 0 0 0 0 1 0 0 0 0 0 0 0 0 0 0 0 0 0 0
1.0 to 1.25 297 2 4 1 1 0 0 1 0 0 0 0 1 0 0 0 0 0 0 0 0 0 0 0 0
1.25 to 1.5 122 2 2 0 0 0 0 0 0 0 0 0 0 0 1 0 0 0 0 0 0 0 0 0 0
1.5 to 1.75 468 21 6 2 1 0 0 2 1 0 0 1 0 0 0 1 0 0 0 0 0 0 0 0 0
1.75 to 2 72 1 0 0 0 0 0 0 0 0 0 0 0 0 0 0 0 0 0 0 0 0 0 0 0
2 to 2.5 821 29 11 8 4 8 2 0 2 3 0 0 1 0 0 0 0 0 0 0 0 0 0 0 0
2.5 to 3 382 23 11 4 1 4 1 2 0 0 0 1 0 1 0 0 0 0 0 0 0 0 0 0 0
3 to 4 749 35 17 9 6 1 3 1 0 1 1 1 1 0 1 0 1 1 1 0 0 0 0 0 0
4 to 5 765 33 17 13 3 3 0 2 0 0 2 0 0 0 1 0 0 0 0 1 0 0 0 0 0
5 to 6 979 73 23 9 7 3 1 2 0 0 1 0 0 1 0 0 0 0 0 0 0 0 0 0 0
6 to 10 4571 170 51 22 6 8 11 2 4 2 1 0 0 0 0 0 0 0 0 0 0 0 0 0 0
10 to 100 37054 118 35 11 4 3 4 2 1 0 0 0 1 0 0 0 0 0 0 0 0 0 0 0 0
Visibility (miles)
2.2 to 2.3
2.3 to 2.4
2.4 to 2.5
1.4 to 1.5
1.5 to 1.6
1.6 to 1.7
1.7 to 1.8
1.0 to 1.1
1.1 to 1.2
0.6 to 0.7
0.7 to 0.8
0.8 to 0.9
1.8 to 1.9
1.9 to 2.0
2.0 to 2.1
2.1 to 2.2
Precipitation Rate (inches/hr)
0 to 0.1
0.1 to 0.2
0.2 to 0.3
0.3 to 0.4
1.2 to 1.3
1.3 to 1.4
0.9 to 1.0
0.4 to 0.5
0.5 to 0.6
Table 5 Five years of hourly simultaneously collected visibility and rainfall data from Seattle, WA binned by visibility (rows) and rainfall rate (columns). There are no samples that would affect the FSO/RF hybrid system. They would lie in the low visibility-high rain rate (upper left-hand) section of this table.
To show quantitatively that simultaneous heavy rain and thick fog do not occur, a study was done on time series weather data from Seattle, WA. Five years of hourly-sampled visibility and precipitation data was examined from 1996 to 2001 (a one month sample of the data is shown in Figure 6). The rainfall was converted to rainfall rate, and then a total of 48,275 data points were binned into a two-dimensional matrix based on visibility (miles) and rainfall rate (inches/hr). The results are shown in Table 5. For dense and thick fog, where the visibility is less then one-quarter of a mile (the first row of data), all instances had a rain rate of less than 0.1 inches/hr. For moderate and light fog, where the visibility is 0.25 to 0.5 miles, there were only two instances of rain between 0.1 and 0.2 inches/hr. And for light fog (visibility .5 to .75 miles), there was one instance of rain up to 1 inch/hr. The selected RF system has a carrier frequency of 2.4 GHz, so only rain rates much greater than 2.5 inches/hr. would have any affect on the RF link. This only occurred for one sample in the 5 years of data, when the visibility was between 3 and 4 miles. In this situation, the laser would most likely still be active. If the probability the hybrid FSO/RF was down during this one hour was 0.5 (a very conservative estimate), the availability would still be 99.999%. Currently, this statistical study is being continued for other cities in the US and around the world. This
Hybrid FSO/RF Availability
95
96
97
98
99
100
0 1000 2000 3000 4000Link Range (m)
Ava
ilabi
lity
(%)
FSO Active(100 Mbps)
2.4 GHzRF
Active (10 Mbps)
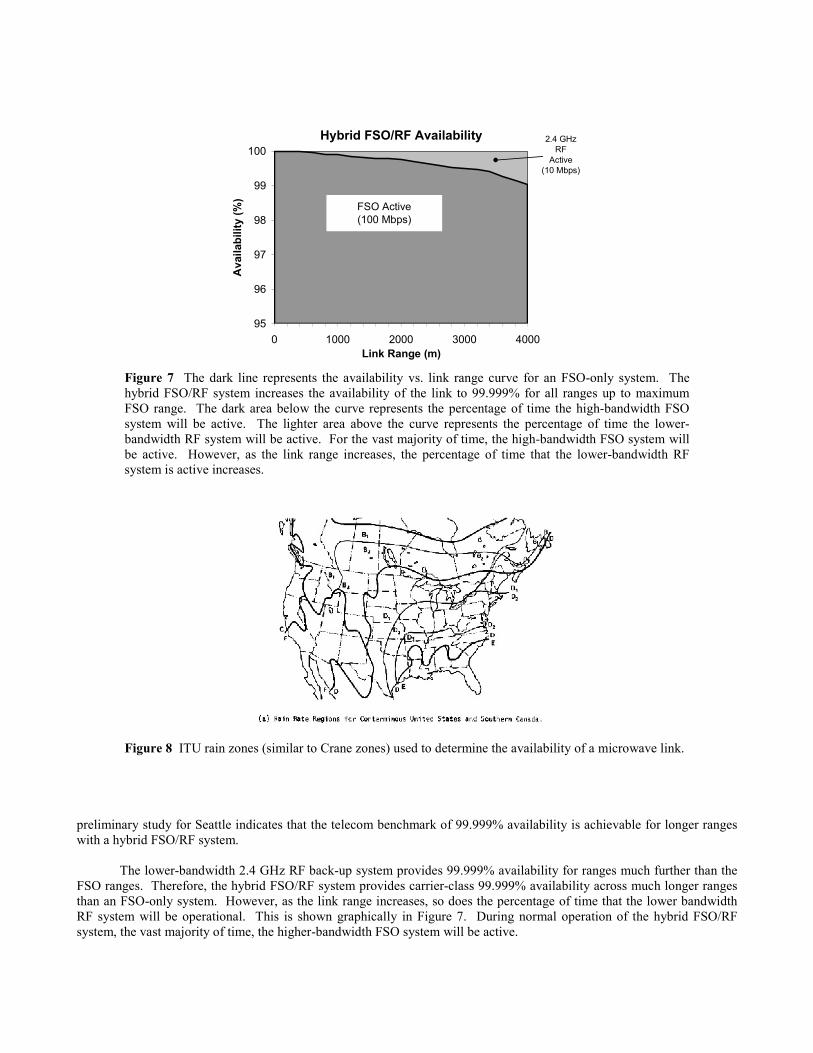
Figure 7 The dark line represents the availability vs. link range curve for an FSO-only system. The hybrid FSO/RF system increases the availability of the link to 99.999% for all ranges up to maximum FSO range. The dark area below the curve represents the percentage of time the high-bandwidth FSO system will be active. The lighter area above the curve represents the percentage of time the lower-bandwidth RF system will be active. For the vast majority of time, the high-bandwidth FSO system will be active. However, as the link range increases, the percentage of time that the lower-bandwidth RF system is active increases.
Figure 8 ITU rain zones (similar to Crane zones) used to determine the availability of a microwave link.
preliminary study for Seattle indicates that the telecom benchmark of 99.999% availability is achievable for longer ranges with a hybrid FSO/RF system. The lower-bandwidth 2.4 GHz RF back-up system provides 99.999% availability for ranges much further than the FSO ranges. Therefore, the hybrid FSO/RF system provides carrier-class 99.999% availability across much longer ranges than an FSO-only system. However, as the link range increases, so does the percentage of time that the lower bandwidth RF system will be operational. This is shown graphically in Figure 7. During normal operation of the hybrid FSO/RF system, the vast majority of time, the higher-bandwidth FSO system will be active.
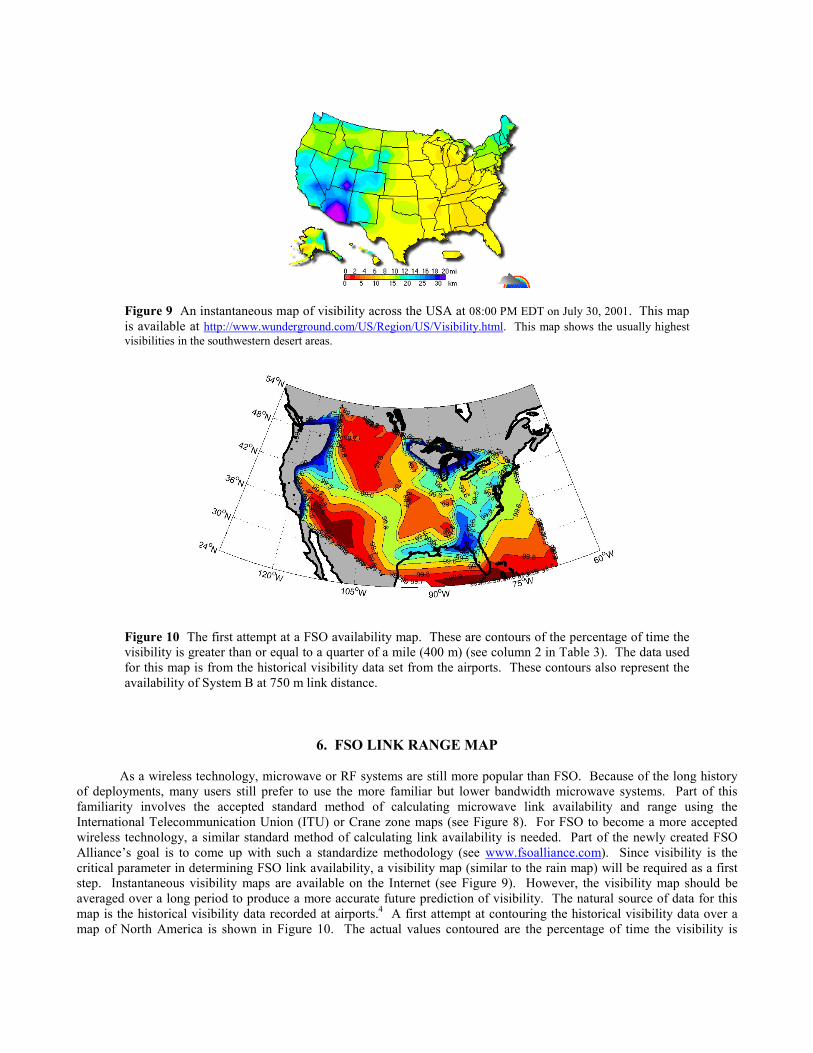
Figure 9 An instantaneous map of visibility across the USA at 08:00 PM EDT on July 30, 2001. This map is available at http://www.wunderground.com/US/Region/US/Visibility.html. This map shows the usually highest visibilities in the southwestern desert areas.
Figure 10 The first attempt at a FSO availability map. These are contours of the percentage of time the visibility is greater than or equal to a quarter of a mile (400 m) (see column 2 in Table 3). The data used for this map is from the historical visibility data set from the airports. These contours also represent the availability of System B at 750 m link distance.
6. FSO LINK RANGE MAP As a wireless technology, microwave or RF systems are still more popular than FSO. Because of the long history of deployments, many users still prefer to use the more familiar but lower bandwidth microwave systems. Part of this familiarity involves the accepted standard method of calculating microwave link availability and range using the International Telecommunication Union (ITU) or Crane zone maps (see Figure 8). For FSO to become a more accepted wireless technology, a similar standard method of calculating link availability is needed. Part of the newly created FSO Alliance’s goal is to come up with such a standardize methodology (see www.fsoalliance.com). Since visibility is the critical parameter in determining FSO link availability, a visibility map (similar to the rain map) will be required as a first step. Instantaneous visibility maps are available on the Internet (see Figure 9). However, the visibility map should be averaged over a long period to produce a more accurate future prediction of visibility. The natural source of data for this map is the historical visibility data recorded at airports.4 A first attempt at contouring the historical visibility data over a map of North America is shown in Figure 10. The actual values contoured are the percentage of time the visibility is
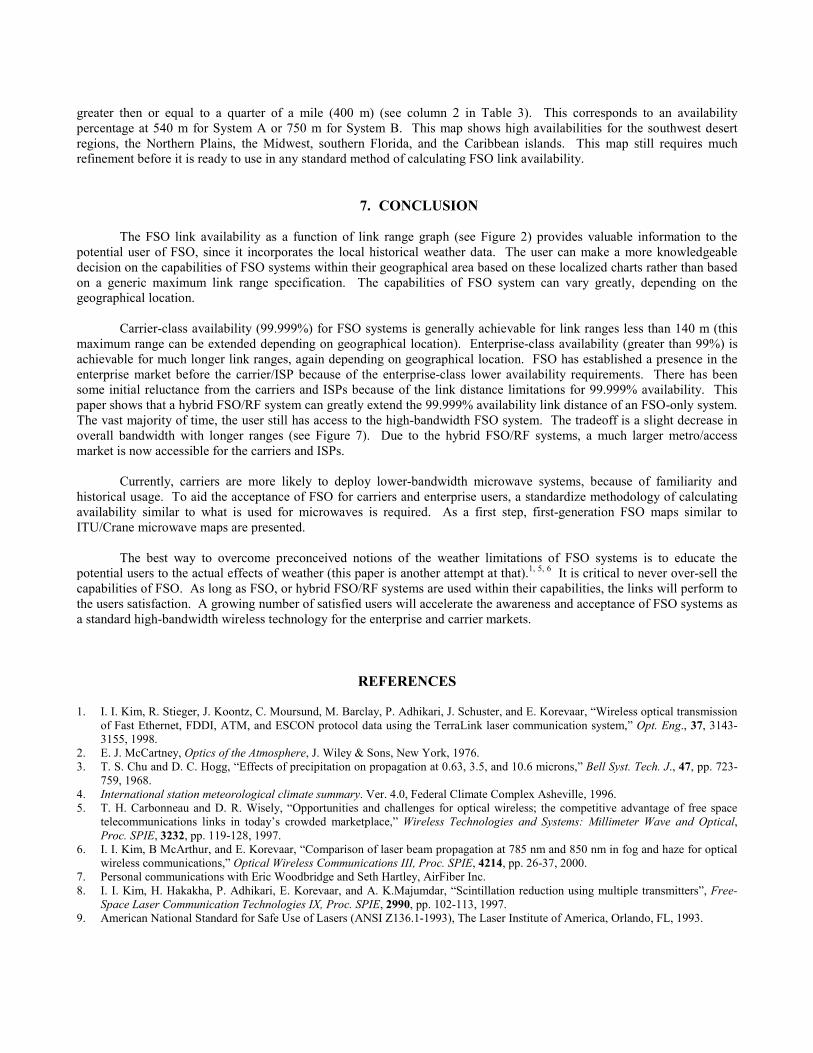
greater then or equal to a quarter of a mile (400 m) (see column 2 in Table 3). This corresponds to an availability percentage at 540 m for System A or 750 m for System B. This map shows high availabilities for the southwest desert regions, the Northern Plains, the Midwest, southern Florida, and the Caribbean islands. This map still requires much refinement before it is ready to use in any standard method of calculating FSO link availability.
7. CONCLUSION The FSO link availability as a function of link range graph (see Figure 2) provides valuable information to the potential user of FSO, since it incorporates the local historical weather data. The user can make a more knowledgeable decision on the capabilities of FSO systems within their geographical area based on these localized charts rather than based on a generic maximum link range specification. The capabilities of FSO system can vary greatly, depending on the geographical location. Carrier-class availability (99.999%) for FSO systems is generally achievable for link ranges less than 140 m (this maximum range can be extended depending on geographical location). Enterprise-class availability (greater than 99%) is achievable for much longer link ranges, again depending on geographical location. FSO has established a presence in the enterprise market before the carrier/ISP because of the enterprise-class lower availability requirements. There has been some initial reluctance from the carriers and ISPs because of the link distance limitations for 99.999% availability. This paper shows that a hybrid FSO/RF system can greatly extend the 99.999% availability link distance of an FSO-only system. The vast majority of time, the user still has access to the high-bandwidth FSO system. The tradeoff is a slight decrease in overall bandwidth with longer ranges (see Figure 7). Due to the hybrid FSO/RF systems, a much larger metro/access market is now accessible for the carriers and ISPs. Currently, carriers are more likely to deploy lower-bandwidth microwave systems, because of familiarity and historical usage. To aid the acceptance of FSO for carriers and enterprise users, a standardize methodology of calculating availability similar to what is used for microwaves is required. As a first step, first-generation FSO maps similar to ITU/Crane microwave maps are presented. The best way to overcome preconceived notions of the weather limitations of FSO systems is to educate the potential users to the actual effects of weather (this paper is another attempt at that).1, 5, 6 It is critical to never over-sell the capabilities of FSO. As long as FSO, or hybrid FSO/RF systems are used within their capabilities, the links will perform to the users satisfaction. A growing number of satisfied users will accelerate the awareness and acceptance of FSO systems as a standard high-bandwidth wireless technology for the enterprise and carrier markets.
REFERENCES 1. I. I. Kim, R. Stieger, J. Koontz, C. Moursund, M. Barclay, P. Adhikari, J. Schuster, and E. Korevaar, “Wireless optical transmission
of Fast Ethernet, FDDI, ATM, and ESCON protocol data using the TerraLink laser communication system,” Opt. Eng., 37, 3143-3155, 1998.
2. E. J. McCartney, Optics of the Atmosphere, J. Wiley & Sons, New York, 1976. 3. T. S. Chu and D. C. Hogg, “Effects of precipitation on propagation at 0.63, 3.5, and 10.6 microns,” Bell Syst. Tech. J., 47, pp. 723-
759, 1968. 4. International station meteorological climate summary. Ver. 4.0, Federal Climate Complex Asheville, 1996. 5. T. H. Carbonneau and D. R. Wisely, “Opportunities and challenges for optical wireless; the competitive advantage of free space
telecommunications links in today’s crowded marketplace,” Wireless Technologies and Systems: Millimeter Wave and Optical, Proc. SPIE, 3232, pp. 119-128, 1997.
6. I. I. Kim, B McArthur, and E. Korevaar, “Comparison of laser beam propagation at 785 nm and 850 nm in fog and haze for optical wireless communications,” Optical Wireless Communications III, Proc. SPIE, 4214, pp. 26-37, 2000.
7. Personal communications with Eric Woodbridge and Seth Hartley, AirFiber Inc. 8. I. I. Kim, H. Hakakha, P. Adhikari, E. Korevaar, and A. K.Majumdar, “Scintillation reduction using multiple transmitters”, Free-
Space Laser Communication Technologies IX, Proc. SPIE, 2990, pp. 102-113, 1997. 9. American National Standard for Safe Use of Lasers (ANSI Z136.1-1993), The Laser Institute of America, Orlando, FL, 1993.