Embed Size (px)
Citation preview
Availability Heuristic and Gambler’s Fallacy over Time in a Natural Disaster Insurance Choice Setting
Haitao Yin
Antai College of Economics and Management Shanghai Jiao Tong University, Hua Shan Road No. 1954, Shanghai, China 200030
Jingqiu Chen
Antai College of Economics and Management Shanghai Jiao Tong University, Hua Shan Road No. 1954, Shanghai, China 200030
Howard Kunreuther
Center for Risk Management and Decision Processes, Operations, Information and Decision Department, The Wharton School, University of Pennsylvania, 3730 Walnut Street – Huntsman Hall Suite 500 – Philadelphia, PA 19104
Erwann Michel-Kerjan
Center for Risk Management and Decision Processes, Operations, Information and Decision Department, The Wharton School, University of Pennsylvania, 3730 Walnut Street – Huntsman Hall Suite 500 – Philadelphia, PA 19104
June 2016 Working Paper # 2016-08
_____________________________________________________________________ Risk Management and Decision Processes Center The Wharton School, University of Pennsylvania 3730 Walnut Street, Jon Huntsman Hall, Suite 500
Philadelphia, PA, 19104 USA
Phone: 215‐898‐5688 Fax: 215‐573‐2130
https://riskcenter.wharton.upenn.edu/ ___________________________________________________________________________
THE WHARTON RISK MANAGEMENT AND DECISION PROCESSES CENTER
Established in 1985, the Wharton Risk Management and Decision Processes Center develops and promotes effective corporate and public policies for low‐probability events with potentially catastrophic consequences through the integration of risk assessment, and risk perception with risk management strategies. Natural disasters, technological hazards, and national and international security issues (e.g., terrorism risk insurance markets, protection of critical infrastructure, global security) are among the extreme events that are the focus of the Center’s research.
The Risk Center’s neutrality allows it to undertake large‐scale projects in conjunction with other researchers and organizations in the public and private sectors. Building on the disciplines of economics, decision sciences, finance, insurance, marketing and psychology, the Center supports and undertakes field and experimental studies of risk and uncertainty to better understand how individuals and organizations make choices under conditions of risk and uncertainty. Risk Center research also investigates the effectiveness of strategies such as risk communication, information sharing, incentive systems, insurance, regulation and public‐private collaborations at a national and international scale. From these findings, the Wharton Risk Center’s research team – over 50 faculty, fellows and doctoral students – is able to design new approaches to enable individuals and organizations to make better decisions regarding risk under various regulatory and market conditions.
The Center is also concerned with training leading decision makers. It actively engages multiple viewpoints, including top‐level representatives from industry, government, international organizations, interest groups and academics through its research and policy publications, and through sponsored seminars, roundtables and forums.
More information is available at http://riskcenter.wharton.upenn.edu/
.
1
Availability Heuristic and Gambler’s Fallacy over Time
in a Natural Disaster Insurance Choice Setting
Revised version: May 19, 2016
Haitao Yin
Antai College of Economics and Management
Shanghai Jiao Tong University, Hua Shan Road No. 1954, Shanghai, China 200030
Jingqiu Chen1 Antai College of Economics and Management
Shanghai Jiao Tong University, Hua Shan Road No. 1954, Shanghai, China 200030
Howard Kunreuther
Center for Risk Management and Decision Processes, Operations, Information and Decision
Department, The Wharton School, University of Pennsylvania,
3730 Walnut Street – Huntsman Hall Suite 500 – Philadelphia, PA 19104
Erwann Michel-Kerjan
Center for Risk Management and Decision Processes, Operations, Information and Decision
Department, The Wharton School, University of Pennsylvania,
3730 Walnut Street – Huntsman Hall Suite 500 – Philadelphia, PA 19104
1Corresponding author. Email: [email protected]
Address: Room. 1208, Antai Building, 1954 Huashan Road, Shanghai, 200030, China PRC
Tel (Fax): 86-21-52301042
2
Abstract:
We carry out a repeated game of demand for typhoon insurance in China to study how the availability heuristic and gambler’s fallacy affect that demand in both short term and long terms. We find that after people experience the first typhoon in the experiment, the availability heuristic dominates their demand for insurance in the short term. Those who experience additional typhoons are more strongly influenced by the gambler’s fallacy though. Females are more likely to be susceptible to the availability heuristic and males to the gambler’s fallacy. We also compared our findings to those of Kunreuther and Michel-Kerjan (2015) in the U.S. and found that respondents from both nations exhibit similar behavioral pattern, except that Chinese seem more susceptible to the influence of availability heuristic. Our analysis reveals that the market fluctuation caused by availability heuristic and gambler’s fallacy is a short term phenomenon. Measures to mediate short-term fluctuations are discussed. Key Words: Experiment in China; Availability Heuristic; Gambler’s Fallacy; Natural Disaster; Insurance Demand; JEL: D03, D22, D54
3
Section 1: Introduction
The impact of a natural disaster on the supply of disaster insurance has been discussed theoretically and empirically well documented (Cummins and Danzon, 1997; Cummins and Lewis, 2003; Kunreuther and Michel-Kerjan, 2009); insurance availability is reduced and prices increase. How a natural disaster affects victims’ insurance demand is less clear. Indeed, while some people might think they need coverage now because that risk is more salient, others might believe they don’t need it anymore since the disaster has already occurred, as these tend to have a relatively low probability of occurrence.
The availability heuristic and the gambler’s fallacy each predict the opposite
reaction to a disaster. The availability heuristic causes people to predict the frequency of an event based on how easily an example can be brought to mind (Tversky and Kahneman, 1974). Therefore, the occurrence of a disaster may create an image that this could happen again, increasing the demand for insurance. On the other hand, the gambler’s fallacy causes people to feel that the likelihood of a low probability event occurring again is a decreasing function of its previous occurrence (Croson and Sundali, 2005). Therefore, the occurrence of a catastrophe may create a mentality of this already happened and will not happen again, and thus reduce the demand for insurance.
A further element is that the impact of the availability heuristic and gambler’s
fallacy may change over time. This is important considering the rarity of disasters, that is, there often is a relatively long period between two events of the same type. For instance, Meyer (2012) found that protective investments against natural disasters display a short-term forgetting effect consistent with the use of reinforcement learning rules. The investments in a given period are largely determined by whether losses were incurred in the previous period. Since such losses happened rarely, “this reinforcement process produces a mean investment level below that which would be optimal for most storm threats” (p.25).
This forgetting effect reported in Meyer (2012) is consistent with the availability
heuristic, in as much as caution diminishes as the event recedes. Similarly, the recentness of an event can magnify the gambler’s fallacy: right after a disaster occurs, people may bet that the same event might not occur again very soon and therefore do not buy insurance, but we do not know the length of time following a disaster that individuals may reason that there will not be another disaster.2 The central task of our
2 Field observations often document an increase in insurance purchase right after a natural disaster occurs and then a quick fallback afterwards (for instance, Michel-Kerjan et al., 2012). This seems to be consistent with what would be predicted taking into account the availability heuristic. But such field observations may also be a result of other social, political and behavioral factors. For instance, government may promote or encourage insurance purchase or strengthen enforcement of mandatory insurance. Due to the difficulties of teasing out these confounding factors, simple field observations do
4
present study is to understand how the availability heuristic and gambler’s fallacy affect victims’ insurance decisions after a typhoon occurs, both in the short term and long term. We also explore some of the characteristics of the individuals in our experiment who are more susceptible to the availability heuristic and gambler’s fallacy, recognizing that there may be differences in subjects’ behavior.
We study these questions using an experimental approach proposed by
Kunreuther and Michel-Kerjan (2015) in the United States with 30 games being played. The setting, which we describe in more detail below, allows us to observe how individual insurance choices change over time. The article is organized as follows. Section 1 reviews previous studies on the availability heuristic and gambler’s fallacy in relation to the post natural disaster insurance choice. Section 2 provides a brief overview of the insurance market for natural disasters in China. Section 3 discusses our experimental design and strategy. Results are presented in Section 4. Section 5 discusses some policy implications of our findings.
Section 2. Gambler’s Fallacy and Availability Heuristic
The central task of this study is to investigate how consumers’ insurance choices change following a natural disaster both in the short term and in the long term. As discussed in the introduction, the availability heuristic and gambler’s fallacy predict opposite behavioral change immediately after a disaster, and the effects are also likely to change over time. We seek to learn their impact on insurance demand in the short-run as well as over a relatively long period of time.
Gambler’s fallacy. Tversky and Kahneman (1974) proposed that the gambler’s fallacy is a cognitive bias: individuals evaluate the probability of a certain event by assessing how similar it is to events they have experienced before. In this way gamblers might believe that the occurrence of a small probability event in two periods over time is somehow connected when they are in fact independent. This connection is stronger when the two periods are closer. According to Tversky and Kahneman (1974), gamblers believe that the current period is more influenced by what happened in the last few periods. Therefore, the occurrence of a disaster should have a strong impact only on a limited number of periods following the catastrophe.
Croson and Sundali (2005) observed from the security videotapes of a large
casino that real-life roulette players tend to bet on another outcome when making binary choices (e.g., red or black; odd or even numbers) when one outcome has occurred. They reported about half of the players switch to a choice that is opposite the previous outcome after streak of one. After streaks of six or more, 85 percent of bets are consistent with the gambler’s fallacy, that is, players switch to another choice. Barron and Leider (2010) reported a similar switch for run lengths of three or more
not give us a clear picture on the role of the availability heuristic and by no means represent evidence against the existence of gambler’s fallacy.
5
using a virtual roulette wheel in a laboratory study. In a sequence of disaster occurrences, we argue that the switch may be sooner
than what is observed in roulette play because the occurrence of a disaster is a very small probability event. In the periods immediately following a disaster, people may bet that another such disaster will not happen again soon, and choose to not buy insurance protection.
The short-term impact of the gambler’s fallacy on natural disaster insurance
purchase has been confirmed in Ganderton et al. (2000). In their lab experiment they found that the likelihood of insurance purchase decreases after experiencing larger uninsured losses and reasoned that people may believe that the small probability event is now even less likely to occur because it already took place.
It is important to note that their study focused on the periods that immediately
follow a natural disaster. Over time, the effect of the gambler’s fallacy may increase insurance demand because people may feel the occurrence of a natural disaster is increasingly likely after experiencing a few periods with no losses from a disaster. Our study analyzes both the short term and long term impact of natural disasters occurrence on insurance demand.
Availability heuristic. Tversky and Kahneman’s (1973) seminal article on the subject illustrates that when participants initiate the decision process, they retrieve information from their memory as input into a decision. Empirical studies have provided support for the memory effect of the availability heuristic (Bravata, 2000; Bargh, 1996; Higgins, 1996; Kahneman & Tversky, 1982). When consumers make decisions on purchasing of disaster insurance, they search their memory for their own personal experience with natural disasters (Ross and Sicoly, 1979). An empirical analysis conducted by Browne and Hoyt (2000) indicates that the overall flood insurance purchases at the state level are highly positively correlated with the level of flood losses in the state in recent years. Flood experience has been shown to impact the demand for insurance in several other studies (see Botzen et al, 2015 for a review).
Field data has revealed that the impact of the availability heuristic may differ,
however, in the short term and the long term simply because it is easier for people to recall something that happened recently than in the distant past. Surveys of owner-occupied homes in California counties affected by the 1989 Loma Prieta earthquake showed a significant increase in the purchase of insurance coverage in the years that followed. Four years later, 36.6 percent had purchased earthquake insurance—a 72 percent increase from pre-disaster level (Palm, 1995). Similarly, the Northridge earthquake of 1994 led to a significant increase of the residential demand for earthquake insurance. For example, more than two-thirds of the homeowners surveyed in Cupertino County had purchased earthquake insurance the year after
6
(Palm and Carroll, 1998). Some of this increase is certainly explained by the combination of two earthquakes occurring in California over just five years (1989 and 1994). But absent any new significant earthquake, this attention faded over time. There have been no severe earthquakes in California since Northridge in 1994. And as of December 2015, only about 10 percent of homeowners in seismic areas of the state had earthquake insurance. If a severe quake hits San Francisco in the near future, the damage could be as high as $200 billion, and it is likely that most homeowners suffering damage will be financially unprotected (Risk Management Solutions, 2014).
An analysis of residential flood insurance purchasing behavior in the state of
Georgia in the United States over more than three decades, Atreya, Ferreira and Michel-Kerjan (2015) found that recent flood events temporarily increase insurance purchases, but this effect fades after three years. Meyers (2012) reported a forgetting effect and argued that this forgetting has resulted with a phenomenon of “two steps forward, one step backward” in taking protective measures against natural disaster, after a natural disaster occurs in a lab experiment.
While the availability heuristic predicts that natural disaster occurrence will have
the strongest positive impact on insurance purchase in the short term, this impact becomes smaller as memory fades if no new disaster occurs. Ultimately, it fades altogether (Michel-Kerjan et al., 2012; Wilkinson, 2008).
We test the following two hypotheses:
H1. The availability heuristic increases insurance demand following a natural disaster but this impact will decrease over time as the event becomes less salient. H2. The gambler’s fallacy decreases insurance demand following a natural disaster, but this impact may reverse after a number of periods when no natural disasters occur.
Section 3. Natural Disaster Insurance Market in China
We implement this study in China, a country that has suffered various severe natural disasters in recent years. A brief description of the natural disaster insurance market in China highlights the relevance of this study and provides important contextual information for readers. According to Yin (2013), various natural disasters in China have caused about 30-40 billion USD economic losses every year starting from early 1990s. Typhoons are of particular concern not only because of their increasing frequency and severity (Liu, Liang & Xie, 2009) but also because the landfall of typhoon usually occurs in typhoon-prone areas where population and economic activities are clustered (Lei et al., 2015)3.
3 As China has a long coastline, 10 coastal and 6 inland provinces, out of the total 28 provinces, are
affected by typhoon induced disasters. More than 250 million people, or lives are affected by typhoons,
with an associated cost of approximately 60 trillion (RMB) GDP (Liu, Liang, & Xie, 2009).
7
Historically, China’s disaster management strategies regarding typhoons and
floods have focused mainly on engineering controls and government post-disaster relief. Over the past half century, China has built a massive engineering control system to tame recurrent hydro-meteorological disasters (Han and Kasperson, 2011). According to Lei et al. (2015), China has constructed more than 85,000 reservoirs of various sizes and a total of (286,900 km) of coastal dikes/levees. This defense infrastructure has played a crucial role in flood control in China (Cheng, 2005). However, while engineering protection has reduced the total area and frequency of inundation, it also has lulled people into feeling safer so there has been significant economic development and population increase in hazard-prone areas, which in turn has led to increased losses overall (Han and Kasperson, 2011; Lei et al., 2015).
As for financing the economic losses from natural disaster, China currently relies
primarily on post-disaster government relief with pre-disaster contractual insurance arrangements playing only a marginal role. This places a heavy burden on the national government (Lei et al., 2015). For example, the 2008 Sichuan earthquake in China caused more than $118 billion in direct economic losses, but insured losses were less than $6 billion or about 5% (Xie et al., 2014). As a point of comparison, about half of the damage from Hurricane Katrina in the United States in 2005 was covered by insurance. According to the World Bank Good Practice Notes in 2008, “only 5% of property in China is insured, with most of insurance coverage falling on commercial and industrial users”. As for private dwellings, it is estimated that only 1% is covered with natural hazard insurance. Subject to the availability of public money, government relief funding is far from adequate for disaster recovery.
A key challenge for developing a natural disaster insurance market further in
China is the current low demand for insurance, even in risk prone areas. A survey undertaken by Yin (2013) in China reported that half of the respondents did not consider insurance because they underestimated the risk, had low trust in insurers (solvency issue) and faced budgetary constraints. As such, the present study contributes to this growing policy and market discussion in China on how to better understand the demand for disaster insurance, and how behavioral drivers affect it.
Section 4. Experimental Design Methodology
The research design follows Kunreuther and Michel-Kerjan’s (2015) experimental stimulus and procedure.4 The experiment consists of 30 consecutive games, with each game comprised of two periods. The occurrence of a typhoon in period 1 of a given game increases the estimated probability of a typhoon in period 2 as experts revised their judgment about the likelihood of a disaster based on new
4 The translation/back-translation procedure (Brislin, 1980) was followed to ensure accuracy.
8
scientific information. At the end of period 1 insurers also use this information to update their probability estimates and recalculate the premiums they will charge in period 2.
Participants in the experiment were asked to imagine that they owned a house for two periods and wanted to sell it at the end of period 2. At the beginning of period 1 the house is worth 100,000 talers (a fictitious currency where 1,000 talers=15RMB). A participant’s total initial assets are the value of the house plus 5,000 talers in cash that s/he receives at the beginning of period 1 so s/he can purchase insurance.
There is a chance that a major typhoon will occur in one or both periods. If a typhoon occurs, the house will suffer a loss in value of 50,000 talers unless the subject has purchased insurance for that period, in which case s/he will be fully reimbursed by the insurer for the loss (for simplicity we assume full insurance with no deductible). The participant’s house will then be immediately rebuilt so it has a value of 100,000 talers. If s/he had not purchased insurance and a typhoon occurred during the period, the value of the house will decrease by 50,000 talers. The amount of the participant’s virtual bank account at the end of period 2 will be the value of the house at the end of period 2 plus 5,000 talers received at the beginning of the game, minus any insurance premiums paid in any of the two periods.
Participants are told that experts estimate the likelihood of a typhoon occurring in period 1 to be 1 in 25 (i.e. p1=4%). If no typhoon occurs in period 1, participants know that experts still estimate the chances of a typhoon striking in period 2 at 1-in-25 (i.e. p2 =p1=4%). Participants also know that if a typhoon occurs in period 1, experts will revise their estimate of the likelihood of a typhoon in period 2 to be 1-in-20 (that is, p2 =5%) and the insurance cost will increase adequately. A premium of 2,000 talers (1/25* 50,000) was charged for insurance in period 1, and 2,500 talers (1/20 * 50,000) or 2,000 talers (1/25 *50,000) in period 2 depending on whether a typhoon did or did not occur in period 1.5
At the beginning of period 1, participants make a decision as to whether s/he
wants to buy an insurance policy or no insurance. After making their decision for period 1, participants are shown on their computer screen whether or not a typhoon occurred in period 1 and the amount in their virtual bank account. They then make a similar decision on insurance purchase for period 2 and receive information on typhoon occurrence and the virtual bank account at the end of period 2. Random numbers are used from a computer program to determine whether a typhoon hurricane occurred with a 4% chance for the first period and a 4% chance in the second period if no disaster occurred in period 1. If a typhoon occurred in period 1 the likelihood of another typhoon in period 2 is updated to 5%. In the instructions to the participants in 5 In the full design, we have another three series by adding two period insurance with premiums that are actuarially fair, with 5% price loading and with 10% price loading respectively. We did not address the case of two period insurance in this paper since our focus is on how consumers’ insurance choice is affected by the occurrence of a natural disaster.
9
the experiment we indicated “the computer will determine the occurrence of a typhoon using a random number generator” so they knew this was done in a neutral fashion independent of the research team.
After the initial 2-period game is played, a new 2-period game begins with
exactly the same rules. Participants play 30 independent 2-period games in a row. There is thus no accumulation of wealth across games, which avoids income effects. Repeating the same game also allows us to determine how insurance demand evolves over time and whether it changes, if at all, following the occurrence of a typhoon. Repetitive 2-period game makes it possible to observe participants’ preference for consecutive insurance purchase.
The experiment features two conditions with different typhoon sequences. In one
sequence, two typhoons occur early (game 5, period 1; game 10, period 2) and a third typhoon occurs in game 21, period 1 (“early typhoon scenario” hereafter). In another typhoon sequence, the first typhoon occurs late in the sequence (game 19, period 1) and a second typhoon occurs in game 28, period 1 (“late typhoon scenario” hereafter).
Before a participant started, s/he was asked a series of four questions to make sure that s/he understood the nature of the experiment and the impact of a specific insurance decision on the asset level at the end of periods 1 and 2. Participants who did not answer a question correctly were directed to read the instructions again. Several participants gave a wrong answer to three or four of these test questions and were not considered for further rounds.
In addition to a series of demographic questions (e.g., age, gender, education, income), the questionnaire measures the participants’ risk attitudes following the methodology developed by Holt-Laury (2002) paired lotteries (Appendix 1).
Participants
The participants are from a standard online participant pool in China. The
participant pool covers China’s 24 provinces, 4 municipalities and 5 autonomous regions. The total population of the pool is 2,000,000. The recruitment, management and use of the pool comply with criteria and rules used by ESOMAR (World Association for Market, Social and Opinion Research) and CMRA (China Market Research Association). We emailed to participants a link by which they can go to the Qualtrics system (an online survey platform) to complete the experiment online. All data has been collected within one week.
Our sample consists of 127 participants from 24 Chinese provinces, metropolitan
cities, and autonomous regions. They were paid 15RMB as participation fee. Payments provide incentives for participants to play the games seriously. Participants learn at the start of the experiment that 1 out of every 100 participants would be
10
randomly selected for a payoff based on one of the 30 games s/he played. This random problem-selection mechanism provides incentives for respondents to play each game for a large amount of real money as if it were the one selected. To assure the participants that the winners would be selected truly randomly, we utilized an external source—the Shanghai Welfare lottery.
An internet link to these lottery results was made available to all participants so
the selection of the winners and games was transparent. The four winners were paid the value of their virtual bank account at the end of the period 2 for the selected game in addition to their 15RMB participation fee. Given the conversion rate of 1,000 talers =15RMB (2.31 US Dollars), a person who decided not to purchase any insurance in the selected game and had not suffered a loss from a typhoon in that game would receive 1515 RMB (or 232.86 US Dollars). Section 5. Results and Discussion Design and Data Description
Because the first typhoon does not occur until game 19 in the late typhoon
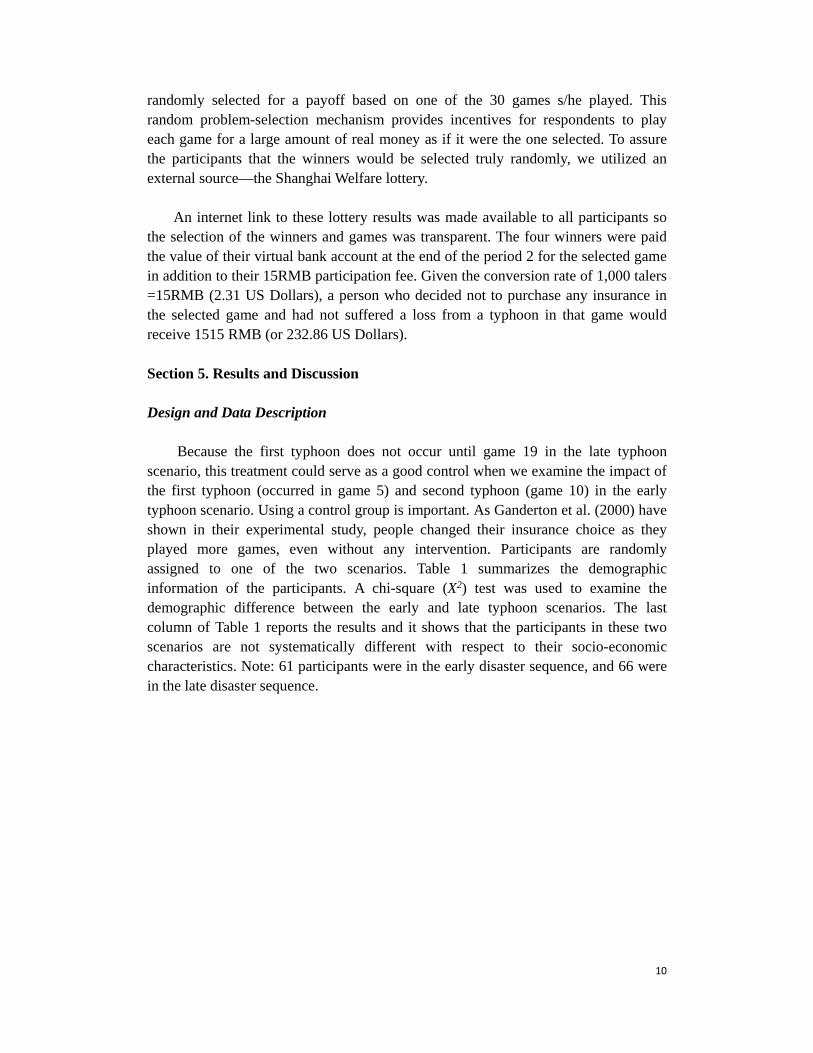
scenario, this treatment could serve as a good control when we examine the impact of the first typhoon (occurred in game 5) and second typhoon (game 10) in the early typhoon scenario. Using a control group is important. As Ganderton et al. (2000) have shown in their experimental study, people changed their insurance choice as they played more games, even without any intervention. Participants are randomly assigned to one of the two scenarios. Table 1 summarizes the demographic information of the participants. A chi-square (X2) test was used to examine the demographic difference between the early and late typhoon scenarios. The last column of Table 1 reports the results and it shows that the participants in these two scenarios are not systematically different with respect to their socio-economic characteristics. Note: 61 participants were in the early disaster sequence, and 66 were in the late disaster sequence.
11
Table 1: Demographic Information of the Participants
Early typhoon
scenario
Late typhoon
scenario X2
N Percentage N Percentage
Gender Female 28 45.90% 23 34.85% 1.61
Male 33 54.10% 43 65.15% (0.21)
Age
18~29 29 47.54% 40 60.61% 2.38
30~39 27 44.26% 23 34.85% (0.30)
40 and above 5 8.20% 3 4.55%
Education
High school 2 3.28% 7 10.61% 4.04
Two-year college 17 27.87% 19 28.79% (0.26)
Undergraduate degree 39 63.93% 34 51.52%
Master or PhD degree 3 4.92% 6 9.09%
Annual
Income*
[0;¥50 K] 13 21.31% 12 18.18% 7.18
[¥50 K; 100 K] 26 42.62% 32 48.48% (0.13)
[¥100 K; 150 K] 15 24.59% 9 13.64%
[¥150 K; ] 6 9.84% 8 12.12%
No answer 0 0 5 7.58%
Employm
ent
Employed 51 83.61% 57 86.36% .20
Student 9 14.76% 8 12.12% (0.91)
Unemployed 1 1.64% 1 1.52%
Note. P value is shown in parentheses.
* In the year 2011, when the survey was conducted, the average per capita disposable income is 21,800
RMB (or 3,460 USD) in urban China and 6,980 RMB (or 1,108 USD) in rural China. The average
income in our sample appears to be higher simply because the survey pool is primarily composed of
young people who are actively in the work force. As a result, we need take caution when generalizing
our findings to the entire population.
The First Typhoon in Sequence and Availability Heuristics
In each round of the games, participants have four choices: no insurance in both periods, noted as (0,0); no insurance in period 1 but insurance in period 2, noted (0,1); insurance in both periods 1 and 2, noted (1,1); insurance in period 1 and no insurance in period 2, noted (1,0). We classified them into three strategies in purchasing insurance against natural disaster risk: No Protection (NP) covering the choice of (0,0); Partial Protection (PP) covering the choice of (0,1) and (1,0); and Full Protection (FP) covering the choice of (1,1).
In Table 2, column 3 shows the percentage of insurance purchase in game 4
(denoted as P4), the game right before the first typhoon, and column 4 for game 6 (denoted as P6), the game right after the first typhoon with column 5 specifying the difference between these two periods (denoted as P6 – P4).
12
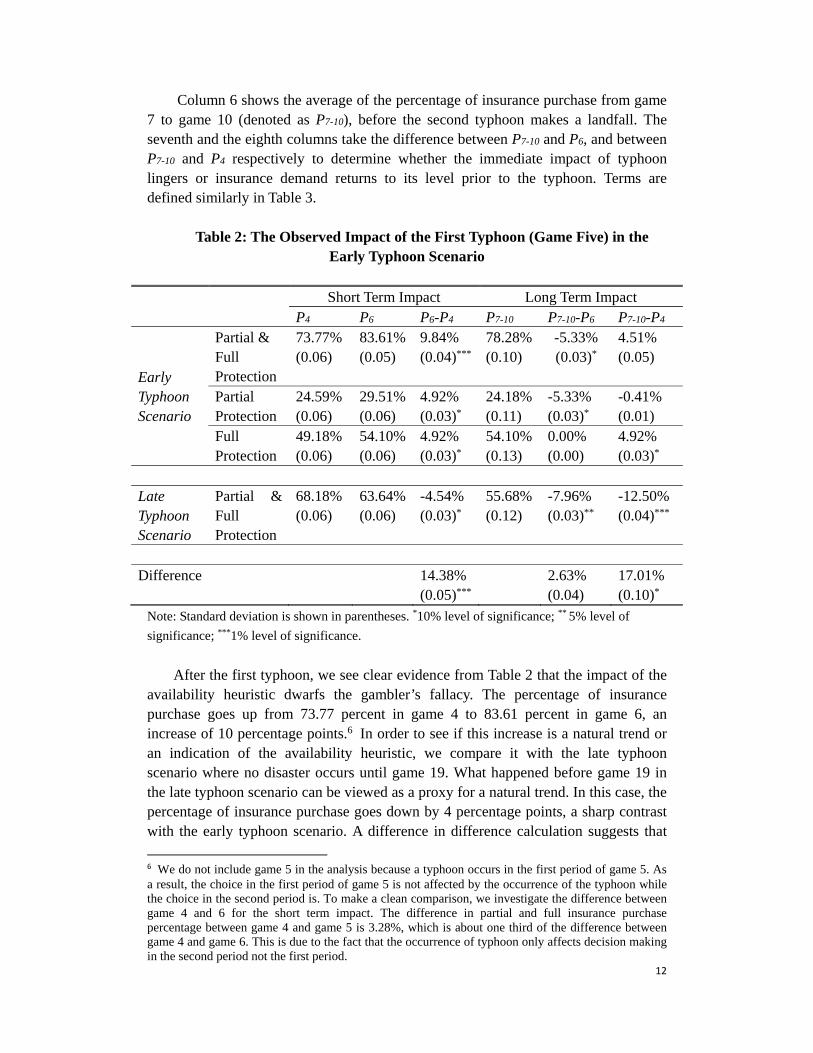
Column 6 shows the average of the percentage of insurance purchase from game 7 to game 10 (denoted as P7-10), before the second typhoon makes a landfall. The seventh and the eighth columns take the difference between P7-10 and P6, and between P7-10 and P4 respectively to determine whether the immediate impact of typhoon lingers or insurance demand returns to its level prior to the typhoon. Terms are defined similarly in Table 3.
Table 2: The Observed Impact of the First Typhoon (Game Five) in the
Early Typhoon Scenario
Short Term Impact Long Term Impact P4 P6 P6-P4 P7-10 P7-10-P6 P7-10-P4
Early Typhoon Scenario
Partial & Full Protection
73.77% (0.06)
83.61% (0.05)
9.84% (0.04)***
78.28% (0.10)
-5.33% (0.03)*
4.51% (0.05)
Partial Protection
24.59% (0.06)
29.51% (0.06)
4.92% (0.03)*
24.18% (0.11)
-5.33% (0.03)*
-0.41% (0.01)
Full Protection
49.18% (0.06)
54.10% (0.06)
4.92% (0.03)*
54.10% (0.13)
0.00% (0.00)
4.92% (0.03)*
Late Typhoon Scenario
Partial & Full Protection
68.18% (0.06)
63.64% (0.06)
-4.54% (0.03)*
55.68% (0.12)
-7.96% (0.03)**
-12.50% (0.04)***
Difference 14.38%
(0.05)*** 2.63%
(0.04) 17.01% (0.10)*
Note: Standard deviation is shown in parentheses. *10% level of significance; ** 5% level of
significance; ***1% level of significance.
After the first typhoon, we see clear evidence from Table 2 that the impact of the
availability heuristic dwarfs the gambler’s fallacy. The percentage of insurance purchase goes up from 73.77 percent in game 4 to 83.61 percent in game 6, an increase of 10 percentage points.6 In order to see if this increase is a natural trend or an indication of the availability heuristic, we compare it with the late typhoon scenario where no disaster occurs until game 19. What happened before game 19 in the late typhoon scenario can be viewed as a proxy for a natural trend. In this case, the percentage of insurance purchase goes down by 4 percentage points, a sharp contrast with the early typhoon scenario. A difference in difference calculation suggests that
6 We do not include game 5 in the analysis because a typhoon occurs in the first period of game 5. As a result, the choice in the first period of game 5 is not affected by the occurrence of the typhoon while the choice in the second period is. To make a clean comparison, we investigate the difference between game 4 and 6 for the short term impact. The difference in partial and full insurance purchase percentage between game 4 and game 5 is 3.28%, which is about one third of the difference between game 4 and game 6. This is due to the fact that the occurrence of typhoon only affects decision making in the second period not the first period.
13
the occurrence of typhoon leads to an increase of about 14.38 percent in choosing insurance protection, which is statistically significant at the level of 1 percent. This finding provides confirming evidence that after the occurrence of a typhoon, a significant portion of people are influenced by the availability heuristic and switch to insurance for financial protection. We further observe from Table 2 that the increase in partial and full protection from game 4 to game 6 are both 4.92 percent, respectively accounting for half of the total growth in insurance purchase (9.84 percent).
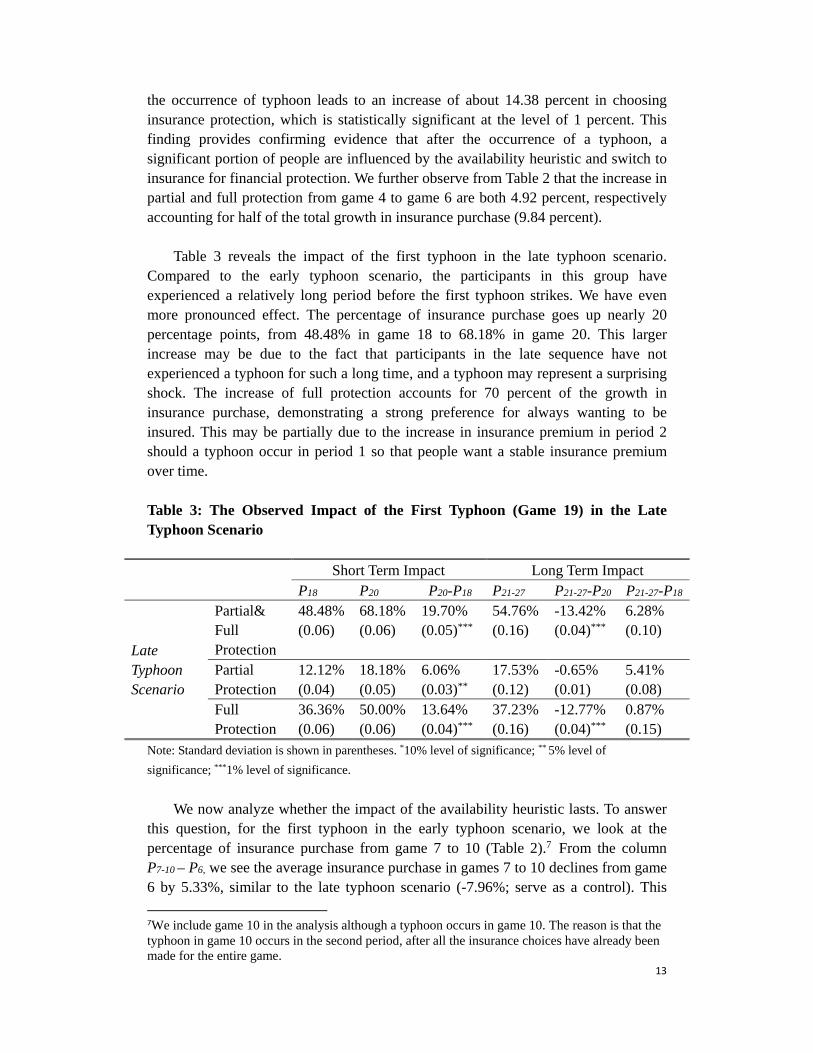
Table 3 reveals the impact of the first typhoon in the late typhoon scenario.
Compared to the early typhoon scenario, the participants in this group have experienced a relatively long period before the first typhoon strikes. We have even more pronounced effect. The percentage of insurance purchase goes up nearly 20 percentage points, from 48.48% in game 18 to 68.18% in game 20. This larger increase may be due to the fact that participants in the late sequence have not experienced a typhoon for such a long time, and a typhoon may represent a surprising shock. The increase of full protection accounts for 70 percent of the growth in insurance purchase, demonstrating a strong preference for always wanting to be insured. This may be partially due to the increase in insurance premium in period 2 should a typhoon occur in period 1 so that people want a stable insurance premium over time.
Table 3: The Observed Impact of the First Typhoon (Game 19) in the Late Typhoon Scenario
Short Term Impact Long Term Impact P18 P20 P20-P18 P21-27 P21-27-P20 P21-27-P18
Late Typhoon Scenario
Partial& Full Protection
48.48% (0.06)
68.18% (0.06)
19.70% (0.05)***
54.76% (0.16)
-13.42% (0.04)***
6.28% (0.10)
Partial Protection
12.12% (0.04)
18.18% (0.05)
6.06% (0.03)**
17.53% (0.12)
-0.65% (0.01)
5.41% (0.08)
Full Protection
36.36% (0.06)
50.00% (0.06)
13.64% (0.04)***
37.23% (0.16)
-12.77% (0.04)***
0.87% (0.15)
Note: Standard deviation is shown in parentheses. *10% level of significance; ** 5% level of
significance; ***1% level of significance. We now analyze whether the impact of the availability heuristic lasts. To answer
this question, for the first typhoon in the early typhoon scenario, we look at the percentage of insurance purchase from game 7 to 10 (Table 2).7 From the column P7-10 – P6, we see the average insurance purchase in games 7 to 10 declines from game 6 by 5.33%, similar to the late typhoon scenario (-7.96%; serve as a control). This
7We include game 10 in the analysis although a typhoon occurs in game 10. The reason is that the typhoon in game 10 occurs in the second period, after all the insurance choices have already been made for the entire game.
14
implies that the impact of availability heuristic erodes over time, consistent with field data (Michel-Kerjan et al., 2012; Wilkinson, 2008).8 Because the insurance purchase goes up sharply right after the typhoon and the erosion afterwards is smaller than the natural trend, we observe that the average percentage of insurance purchase from game 7 to 10 for the group with typhoon experience is significantly larger (17.01%, p=.10) than what it would have been if no typhoon occurred (see table 2).
Table 3 reveals similar findings. That is, the insurance purchase goes up sharply immediately after the typhoon but decreases slightly over time. But the last column suggests that the salience of the disaster due to the availability heuristic does not disappear completely, since the insurance demand is still 6.28% higher than before the typhoon.
In all, we found that the impact of availability heuristic overweighs that of the gamblers’ fallacy, and as a result drives a sharp increase in insurance purchase immediately after a typhoon. The impact of the availability heuristic may weaken as time erodes, but it still results in a significantly higher insurance demand than what would be the case if there were no typhoon at all.
We also want to look at some of the characteristics of individuals who are more
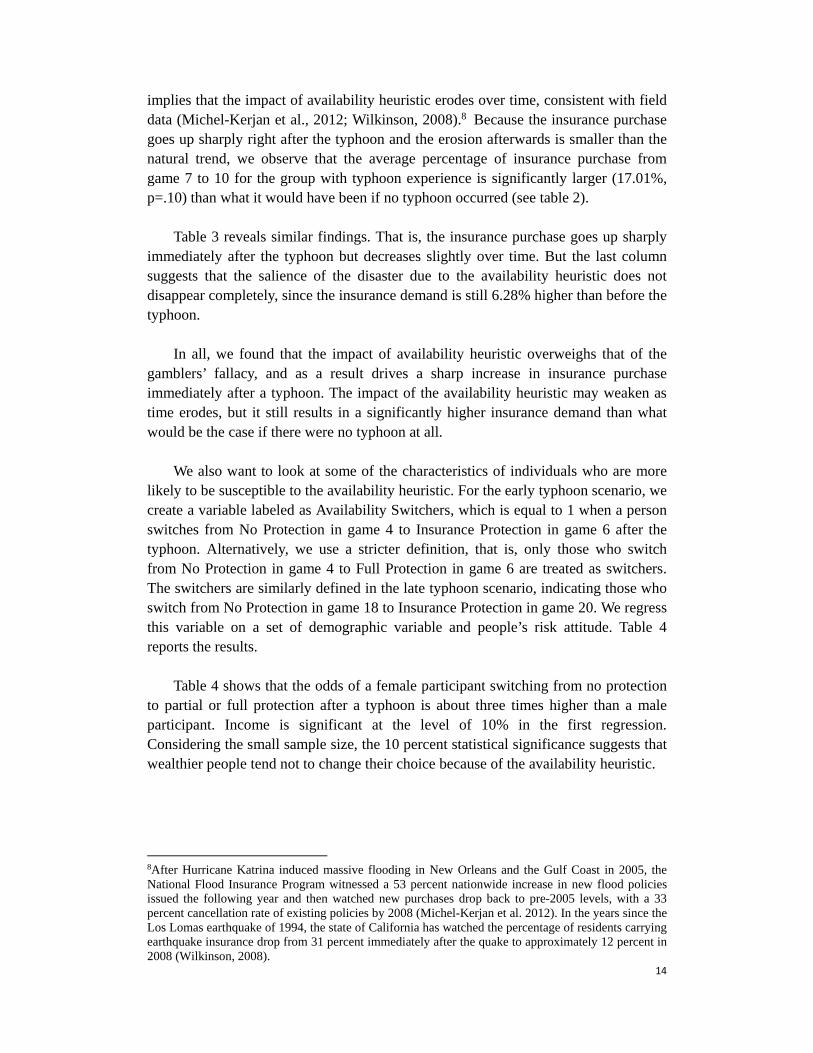
likely to be susceptible to the availability heuristic. For the early typhoon scenario, we create a variable labeled as Availability Switchers, which is equal to 1 when a person switches from No Protection in game 4 to Insurance Protection in game 6 after the typhoon. Alternatively, we use a stricter definition, that is, only those who switch from No Protection in game 4 to Full Protection in game 6 are treated as switchers. The switchers are similarly defined in the late typhoon scenario, indicating those who switch from No Protection in game 18 to Insurance Protection in game 20. We regress this variable on a set of demographic variable and people’s risk attitude. Table 4 reports the results.
Table 4 shows that the odds of a female participant switching from no protection to partial or full protection after a typhoon is about three times higher than a male participant. Income is significant at the level of 10% in the first regression. Considering the small sample size, the 10 percent statistical significance suggests that wealthier people tend not to change their choice because of the availability heuristic.
8After Hurricane Katrina induced massive flooding in New Orleans and the Gulf Coast in 2005, the National Flood Insurance Program witnessed a 53 percent nationwide increase in new flood policies issued the following year and then watched new purchases drop back to pre-2005 levels, with a 33 percent cancellation rate of existing policies by 2008 (Michel-Kerjan et al. 2012). In the years since the Los Lomas earthquake of 1994, the state of California has watched the percentage of residents carrying earthquake insurance drop from 31 percent immediately after the quake to approximately 12 percent in 2008 (Wilkinson, 2008).
15
Table 4: Logistic Regression Analysis of Availability Switchers
Availability Switcher
(1=switch to partial or full
protection, 0=others)
Availability Switcher
(1=switch to full
protection, 0=others
Age -0.02 -0.08
(0.31) (0.93)
Gender (1=male, 0=female) -1.46 -1.75
(1.99)** (1.96)**
Education -0.38 -0.59
(0.73) (0.97)
Income -0.67 -0.52
(1.81)* (1.00)
Risk Aversion (RA) 0.20 -0.10
(1.19) (0.55)
Constant 3.82 5.76
(1.23) (1.34)
N 45§ 31¥
Note: §Fifty participants chose No Insurance Protection in the game before a typhoon. The sample
size reduces to 45 in the regression analysis because of missing values on some of the independent
variables. 27 (60.00%) participants chose either Partial or Full Protection after a typhoon among
the sample. ¥Thirty-five participants chose No Insurance Protection in the game before a typhoon
and chose either No Protection or Full Protection after a typhoon. 12 (38.71%) participants chose
Full Protection after a typhoon among the sample. The sample size reduces to 31 because of
missing values on some of the independent variables. Z value is in parentheses. * 10% level of
significance ** 5% level of significance.
The Second Typhoon in the Sequence and Gambler’s Fallacy
Table 5 and Table 7 show that after the second and third typhoon, the gambler’s fallacy seems to dominate insurance choice in the short run. In Table 5, the third column shows the percentage of insurance purchase in game 9 (denoted as P9), the game right before the second typhoon in early typhoon sequence, and the fourth column for game 11 (denoted as P11), the game right after the second typhoon in early typhoon sequence. The difference between them (denoted as P11 – P9 in column 5) shows the short term impact of the second typhoon.
Column 6 shows the average of the percentage of insurance purchase from game 12 to game 20 (denoted as P12-20), the game right before the third typhoon makes a landfall. The seventh and eighth columns respectively shows the difference between P12-20 and P11, and between P12-20 and P9, aiming to show whether the short term impact of a second typhoon would linger in the long run or people would fall back to their behavioral pattern before the typhoon. Terms are similarly defined in Table 6 and 7.
16
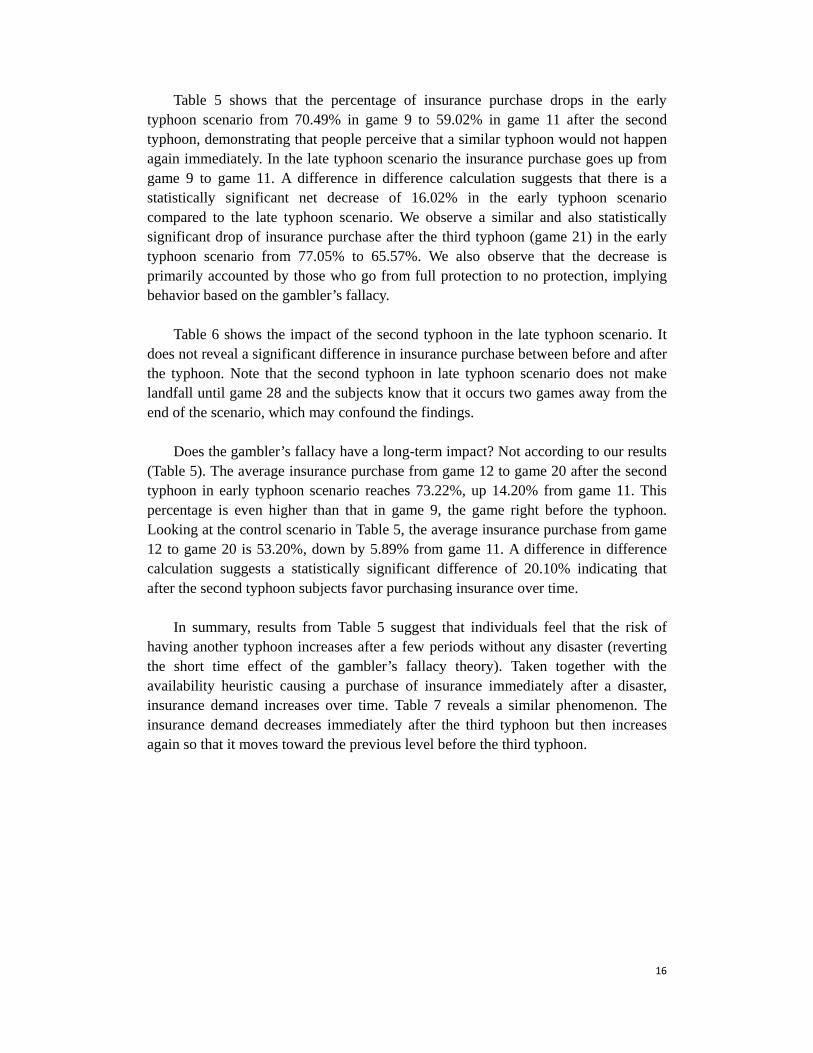
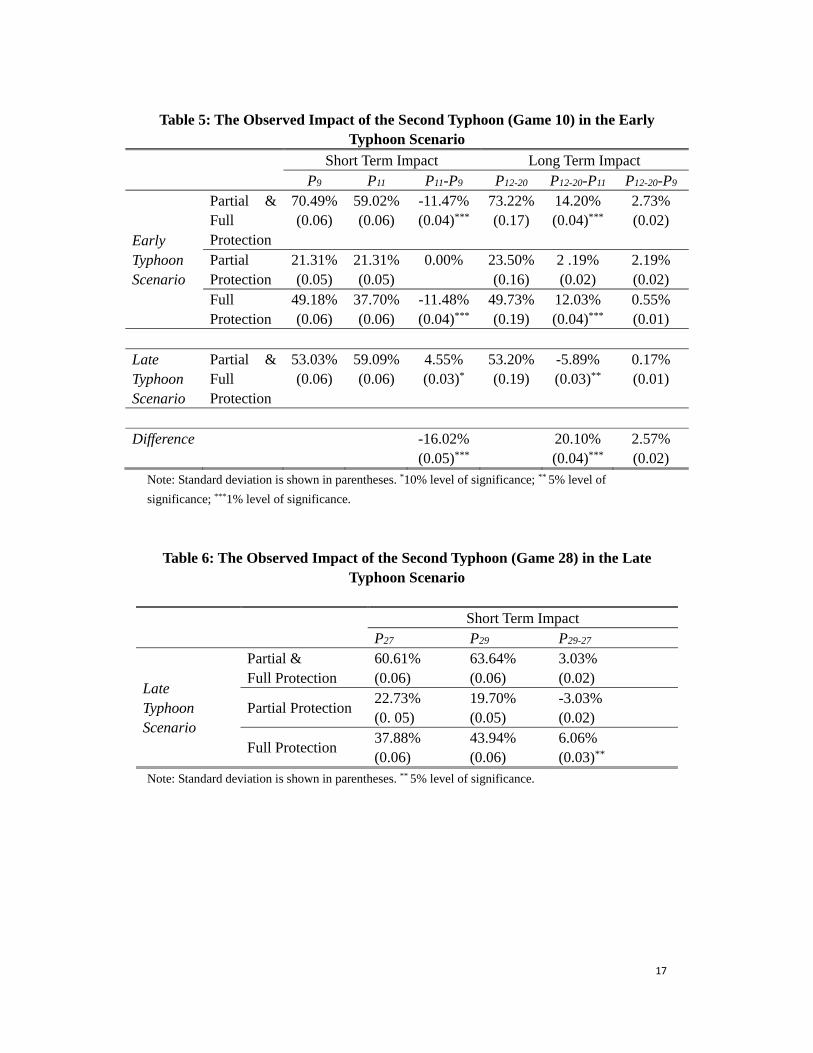
Table 5 shows that the percentage of insurance purchase drops in the early typhoon scenario from 70.49% in game 9 to 59.02% in game 11 after the second typhoon, demonstrating that people perceive that a similar typhoon would not happen again immediately. In the late typhoon scenario the insurance purchase goes up from game 9 to game 11. A difference in difference calculation suggests that there is a statistically significant net decrease of 16.02% in the early typhoon scenario compared to the late typhoon scenario. We observe a similar and also statistically significant drop of insurance purchase after the third typhoon (game 21) in the early typhoon scenario from 77.05% to 65.57%. We also observe that the decrease is primarily accounted by those who go from full protection to no protection, implying behavior based on the gambler’s fallacy.
Table 6 shows the impact of the second typhoon in the late typhoon scenario. It does not reveal a significant difference in insurance purchase between before and after the typhoon. Note that the second typhoon in late typhoon scenario does not make landfall until game 28 and the subjects know that it occurs two games away from the end of the scenario, which may confound the findings.
Does the gambler’s fallacy have a long-term impact? Not according to our results
(Table 5). The average insurance purchase from game 12 to game 20 after the second typhoon in early typhoon scenario reaches 73.22%, up 14.20% from game 11. This percentage is even higher than that in game 9, the game right before the typhoon. Looking at the control scenario in Table 5, the average insurance purchase from game 12 to game 20 is 53.20%, down by 5.89% from game 11. A difference in difference calculation suggests a statistically significant difference of 20.10% indicating that after the second typhoon subjects favor purchasing insurance over time.
In summary, results from Table 5 suggest that individuals feel that the risk of having another typhoon increases after a few periods without any disaster (reverting the short time effect of the gambler’s fallacy theory). Taken together with the availability heuristic causing a purchase of insurance immediately after a disaster, insurance demand increases over time. Table 7 reveals a similar phenomenon. The insurance demand decreases immediately after the third typhoon but then increases again so that it moves toward the previous level before the third typhoon.
17
Table 5: The Observed Impact of the Second Typhoon (Game 10) in the Early
Typhoon Scenario
Short Term Impact Long Term Impact P9 P11 P11-P9 P12-20 P12-20-P11
P12-20-P9
Early Typhoon Scenario
Partial & Full Protection
70.49% (0.06)
59.02% (0.06)
-11.47% (0.04)***
73.22% (0.17)
14.20% (0.04)***
2.73% (0.02)
Partial Protection
21.31% (0.05)
21.31% (0.05)
0.00% 23.50% (0.16)
2 .19% (0.02)
2.19% (0.02)
Full Protection
49.18% (0.06)
37.70% (0.06)
-11.48% (0.04)***
49.73% (0.19)
12.03% (0.04)***
0.55% (0.01)
Late Typhoon Scenario
Partial & Full Protection
53.03% (0.06)
59.09% (0.06)
4.55% (0.03)*
53.20% (0.19)
-5.89% (0.03)**
0.17% (0.01)
Difference -16.02%
(0.05)*** 20.10%
(0.04)*** 2.57% (0.02)
Note: Standard deviation is shown in parentheses. *10% level of significance; ** 5% level of
significance; ***1% level of significance.
Table 6: The Observed Impact of the Second Typhoon (Game 28) in the Late Typhoon Scenario
Short Term Impact P27 P29 P29-27
Late Typhoon Scenario
Partial & Full Protection
60.61% (0.06)
63.64% (0.06)
3.03% (0.02)
Partial Protection 22.73% (0. 05)
19.70% (0.05)
-3.03% (0.02)
Full Protection 37.88% (0.06)
43.94% (0.06)
6.06% (0.03)**
Note: Standard deviation is shown in parentheses. ** 5% level of significance.
18
Table 7: The Observed Impact of the Third Typhoon (Game 21) in the Early Typhoon Scenario
Short Term Impact Long Term Impact P20 P22 P22-P20 P23-28 P23-28-P22
P23-28-P20
Early Typhoon Scenario
Partial & Full Protection
77.05% (0.05)
65.57% (0.06)
-11.48% (0.04)***
72.13% (0.14)
6.56% (0.03)**
-4.92% (0.03)*
Partial Protection
24.59% (0.06)
21.31% (0.06)
-3.28% (0.02)
24.32% (0.14)
-3.55% (0.02)
-0.27% (0.01)
Full Protection
52.46% (0.06)
44.26% (0.06)
-8.20%
(0.04)** 47.81% (0.16)
3.55% (0.02)
-4.65% (0.03)*
Note: We exclude game 29 and 30 from the analysis to avoid the game ending effects. Standard
deviation is shown in parentheses. ** 5% level of significance. ***1% level of significance.
A switch from insurance protection (including partial and full insurance) to no insurance protection is an indication for gambler’s fallacy. We create a variable labeled as Gambling Switcher, which is equal to 1 if a person switches from insurance protection to no insurance after the typhoon strikes. We find that the only variable that shows significant explanatory power is gender. Male participants are two times more likely to switch from insurance protection to no protection immediately after the typhoon. If the stronger definition of gambling switchers is applied, no female participants makes a switch from full protection to no protection, indicating that women are much less likely to be influenced by the gambler’s fallacy. This is consistent with Suetens and Tyran (2012), which found evidence supporting that gambler’s fallacy is more applicable to men than women. In their study of lottery outcome, they found that men are 1% less likely to bet on numbers drawn in the previous week than on numbers not drawn, while women do not react to the previous week’s drawing outcome. Section 6: Comparison of our Findings with U.S. Experiments
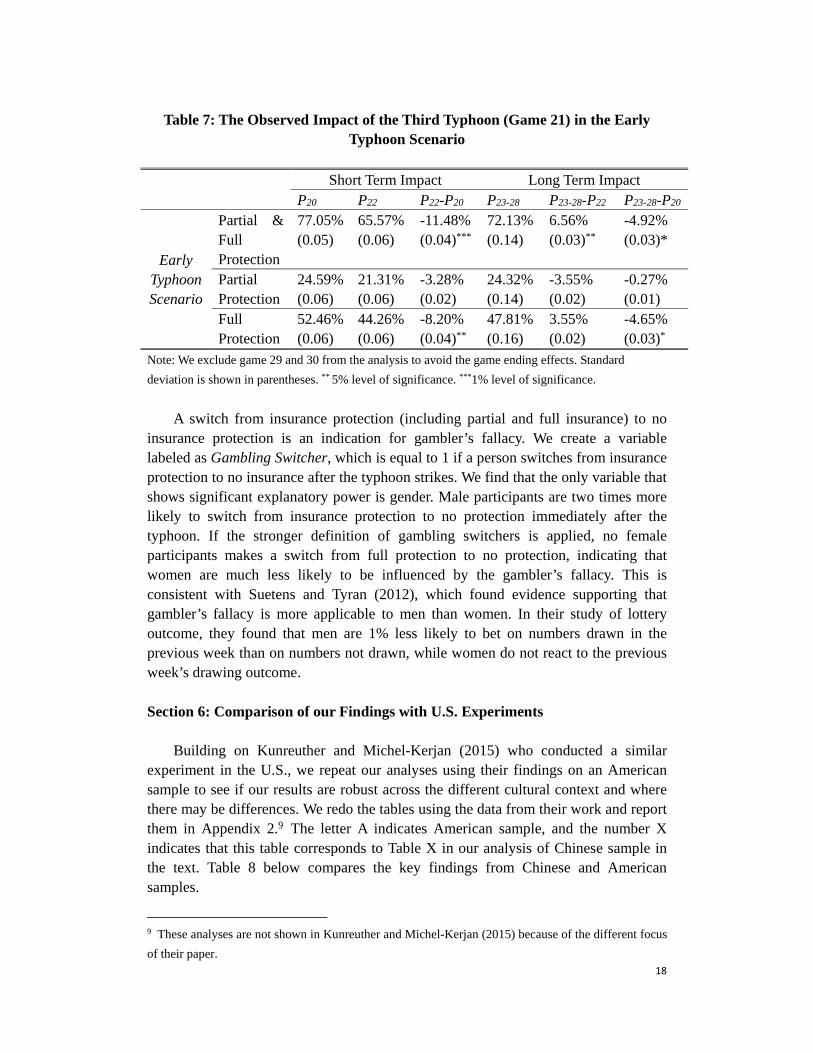
Building on Kunreuther and Michel-Kerjan (2015) who conducted a similar experiment in the U.S., we repeat our analyses using their findings on an American sample to see if our results are robust across the different cultural context and where there may be differences. We redo the tables using the data from their work and report them in Appendix 2.9 The letter A indicates American sample, and the number X indicates that this table corresponds to Table X in our analysis of Chinese sample in the text. Table 8 below compares the key findings from Chinese and American samples.
9 These analyses are not shown in Kunreuther and Michel-Kerjan (2015) because of the different focus
of their paper.
19
Table 8: Comparison between Chinese and American Results: Availability
Heuristic & Gamblers’ Fallacy effects China U.S.
Availability Heuristic
short-term effect
Impact of 1st typhoon in the early scenario
(table 2 vs. table 2A)
√ √
Impact of 1st typhoon in the late scenario
(table 3 vs. table 3A)
√ --
Availability Heuristic
long-term effect
Impact of 1st typhoon in the early scenario
(table 2 vs. table 2A)
-- --
Impact of 1st typhoon in the late scenario
(table 3 vs. table 3A)
-- --
Gamblers’ Fallacy
short-term effect
Impact of 2nd typhoon in the early scenario
(table 5 vs. table 5A)
√ √
Impact of 2nd typhoon in the late scenario
(table 6 vs. table 6A)
-- √
Impact of 3rd typhoon in the early scenario
(table 7 vs. table 7A)
√(p<.01) √
Gamblers’ Fallacy
long-term effect
Impact of 2nd typhoon in the early scenario
(table 5 vs. table 5A)
-- --
Impact of 3rd typhoon in the early scenario
(table 7 vs. table 7A)
√(p<.10) --
Significant Predictors of Availability Heuristic (table 4 vs. table 4A) Gender (-)
Income (-)
Age (-)
Gender (-)
Significant predictor of GF (table 8 vs. table 8A) Gender
(+)
--
We have the following observations: First, Table 2A shows that the availability heuristic has a similar impact on
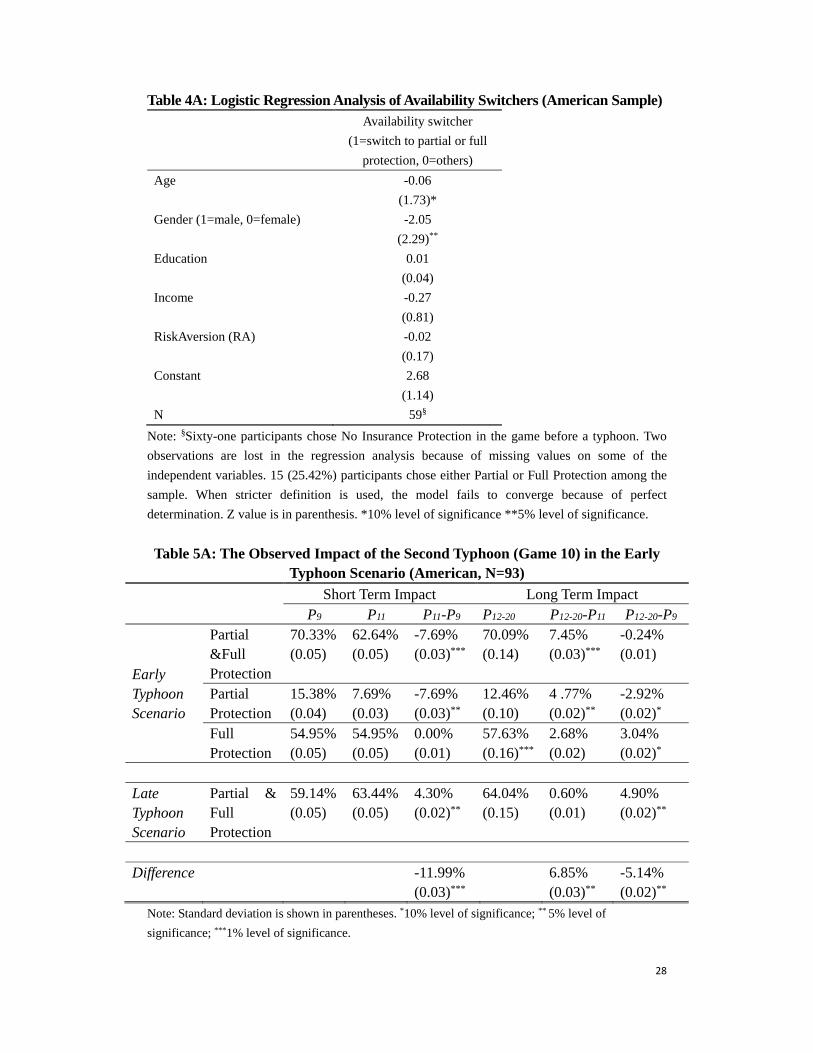
American’s insurance choice in that insurance demand rises sharply in the game right after the occurrence of the first typhoon10 in the early typhoon sequence (column P6-P4). In the long run, insurance demand regresses but still maintains a much higher level than what would be if the case if no typhoon had occurred. This observation is similar to our Chinese experiment. A difference appears to be in the magnitude following a disaster where there is a 7.61% increase in insurance purchase in the U.S. experiment, compared to a 14.38% increase in the Chinese sample. The lower susceptibility to the availability heuristic in the U.S. is confirmed when we looked at the impact of the first typhoon in the late disaster sequence, summarized in Table 3A, where there is no evidence supporting the availability heuristic in the United States experiments.
10 In the U.S. experiment the disaster was deemed a hurricane that is identical in nature to a typhoon in
China. We use the word typhoon in our comparison between the two experiments.
20
To further gain insights on this difference between Chinese and American sample, 60.00 percent of the Chinese sample make a switch from no protection to partial or full protection after a typhoon (as we defined in the analysis of Table 4) as a result of the availability heuristic while 25.42 percent for the American sample (see Table 4A), a T test reveals that there exists a statistically significant difference between these two (t=2.60, p<.01). This tells us that Chinese seems to be more susceptible to the influence of availability heuristics.
As to Gambler Switchers, among 77 persons who chose either Partial Protection
or Full Protection before the typhoon for both early (in game 4) and late (in game 18) typhoon scenarios in Chinese sample, only 8 (10.39%) switch to No Protection. Similarly, there are 11 (8.94%) Gambler Switchers among a total of 123 participants choosing either Partial Protection or Full Protection for both typhoon scenarios in American sample. A T test reveals that there isn’t any significant difference between the two country samples (t=0.25, p>.10). This suggests that neither Chinese nor Americans are susceptible to the influence of gambler fallacy.
In the Chinese sample, the average insurance purchase from game 12 to game 20
after the second typhoon in the early typhoon scenario reaches 73.22%, which is up 14.20% from game 11 and even higher (2.73%) than that in game 9, the game right before the typhoon. In the American sample, the average insurance purchase from game 12 to game 20 after the second typhoon reaches 70.09%, which is up 7.45% from game 11 and slightly lower (-0.24%) than game 9.
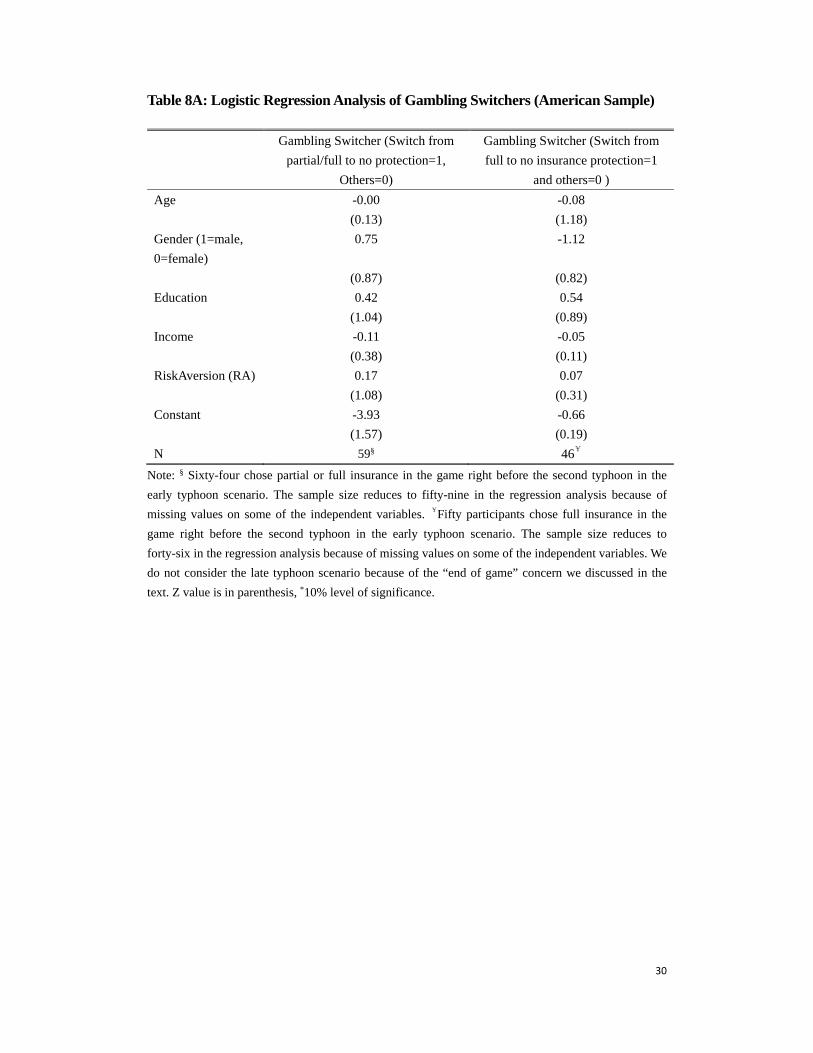
When we looked at the characteristics that predict availability switchers (Table 4A) and gambling switchers (Table 8A), we find that gender has a similar predictive power for availability switchers. This is revealed by the statistically significant and negative coefficient of the gender variable. A closer look at the data shows that among the availability switchers in the American sample, only 2 are males and 12 are females. When a stricter definition is used, none of the males make a switch after the typhoon from no insurance protection to full protection, an even stronger evidence for a gender effect. Table 8A reports none of the variables have significant predictive power for gambler switchers in the American sample.
In sum, the commonality between Chinese and American is much more pronounced than the differences. The short term and long term impact of availability heuristics and gambling fallacy demonstrate a very similar pattern in both Chinese and American experiments. Theories seem to have universal value in explaining both Chinese and American insurance response to the occurrence of a typhoon. The only difference is that Americans seem to be less susceptible to the availability heuristic.
21
Section 7: Conclusion
In this paper we carry out a repeated game to study how the availability heuristic and gambler’s fallacy affect insurance demand in both the short term and long term. We develop and experiment with 30 consecutive games to mimic a person’s repeated choice of natural disaster insurance purchase or lack of purchase. We find that when people experience the first typhoon, the availability heuristic clearly dominates and insurance demand goes up sharply. It then decreases when there are no disasters in ensuing games. But insurance demand is still higher than prior to the first typhoon suggesting a long term impact of the availability heuristic.
We also find that when people experience a second or a third typhoon, the gambler’s fallacy plays a more significant role with many individuals (mostly male) deciding not to buy insurance for the next few games. But then, the demand increases again to return to the level before the typhoon.
Linking demographic information to susceptibility to availability heuristic and gambler’s fallacy, we find that the only consistently significant variable is gender. Women are more likely to be affected by availability heuristic and switch to insurance after a disaster occurs, and men are more likely to be affected by the gambler’s fallacy and switch to no insurance after a disaster. Having said this, there appears to exist an equilibrium level of insurance demand that is pretty stable in the long run.
These findings should be useful for policy makers or insurance industry leaders who are interested in developing natural disaster insurance. According to our findings, the market fluctuation caused by behavioral biases such as availability heuristic and gambler’s fallacy is more likely to be a short term phenomenon. As we discussed in Section 5, we have evidence that the availability heuristic increases the demand for insurance right after the typhoon, but this elevated demand erodes as time goes. Similarly, the gamblers’ fallacy caused insurance purchase to drop in the short term, but insurance demand bounced back several periods after the typhoon. To correct the undesired short term market fluctuation, dedicated efforts to ease the availability heuristic could be targeted to women and to young people who are likely to experience the disaster for the first time as potential insurance consumer; and efforts to ease effects of the gambler’s fallacy could be targeted to men and to older people who are likely to have some experiences with natural disasters.
China is looking at the possibility of having insurance as a complement to its current natural disaster mitigation system. Insurance not only can provide resources needed for disaster recovery, but also ease burdens on public assistance and could potentially create economic incentives for risk mitigation if insurance price is risk-based (Yin, Pfaff and Kunreuther, 2011). However, a key challenge is low demand for insurance, and gambler’s fallacy plays an important role. Yin (2013) reported that even people in areas with frequent typhoon believe that their houses
22
would not be damaged in a typhoon and therefore decline to consider insurance. This is somewhat consistent with our findings. Risk communication and the benefits provided by insurance protection should be done immediately after a typhoon in areas with less frequent typhoon to take advantage of availability heuristics, and should wait for a few quiet periods in typhoon prone areas to avoid the negative effects of gambler’s fallacy.
Acknowledgments This work is partially supported by the Zurich Insurance Foundation, the Center for Risk and Economic Analysis of Terrorism Events (CREATE) at the University of Southern California (U.S. Department of Homeland Security’s Center of Excellence), the Travelers-Wharton Partnership for Risk Management Fund, and the Wharton Risk Management and Decision Processes Center. The first and the second authors' work on this paper were supported in part by research grants from the National Natural Science Foundation of China (no. 71322305 and no. 71132003) as well as a special fund of social cognition in intersection area of Arts and Science of Shanghai Jiao Tong University. References Atreya, A., Ferreira, S., & Michel-Kerjan, E. (2015). What drives households to buy
flood insurance? New evidence from Georgia. Ecological Economics, 117, 153-161.
Bargh, J. A. (1996). Principles of automaticity. In E. T. Higgins & A. Kruglanski (Eds.), Social psychology: Handbook of basic principles (pp. 169-183). New York: Guilford.
Barron, G., & Leider, S. (2010). The role of experience in the gambler’s fallacy. Journal of Behavioral Decision Making, 23 (1): 117-129.
Botzen, W.J.W., Kunreuther, H. and Michel-Kerjan, E. (2015). Divergence between individual perceptions and objective indicators of tail risks: Evidence from floodplain residents in New York City. Judgment and Decision Making, 10(4): 365-85.
Bravata, D. M. (2000). Making medical decisions under uncertainty. Seminars in Medical Practice, 3 (2), 6-14.
Browne, M. J., & Hoyt, R. E. (2000). The demand for flood insurance: Empirical evidence. Journal of Risk and Uncertainty, 20 (3): 291-306.
Brislin, R. W. (1980). Translation and content analysis of oral and written material. In Triandis, H. C. and Berry, J. W., Eds., Handbook of cross-cultural psychology: Methodology, Allyn and Bacon, Boston, 389-444.
Cheng, X. (2005). Changes of flood control situations and adjustments of flood management strategies in China. Water International, 30, 108-113.
Croson, R., & Sundali, J. (2005). The gambler’s fallacy and the hot hand: Empirical
23
data from casinos. The Journal of Risk and Uncertainty, 30 (3): 195-209.
Cummins, J. D., & Danzon, P. M. (1997). Price Shocks and Capital Flows in Liability Insurance. Journal of Financial Intermediation, 6 (1): 3-38.
Cummings, J. D., & Lewis, C. M. (2003). Catastrophic Events, Parameter Uncertainty and the Breakdown of Implicit Long-term Contracting: The Case of Terrorism Insurance. The Journal of Risk and Uncertainty, 26 (2/3): 153-178.
Ganderton, P. T., Brookshire, D. S., McKee, M., Steward, S., & Thurston, H. (2000). Buying insurance for disaster-type risks: experimental evidence. Journal of Risk and Uncertainty, 20 (3): 271-289.
Han, G., & Kasperson, R. E. (2011). Dilemmas and pathways to dealing with flood problems in twenty-first century China. International Journal of Disaster Risk Science, 2(3), 21-30.
Higgins, E. T. (1996). Knowledge activation: Accessibility, applicability, and salience. In E. T. Higgins & A. W. Kruglanski (Eds.), Social Psychology: Handbook of basic principles (pp. 133-168). New York: Guilford.
Holt, C. A., & Laury, S. K. (2002). Risk aversion and incentive effects. The American Economic Review, 92 (5): 1644-1655.
Kahneman, D., & Tversky, A. (1982). The simulation heuristic. In D. Kahneman, P. Slovic, & A. Tversky (Eds.), Judgment under uncertainty: Heuristics and biases (pp. 201-208). New York: Cambridge University Press.
Kunreuther, H., & Michel-Kerjan, E. (2015). Demand for Fixed-Price Multi-Year Contracts: Experimental Evidence from Insurance Decisions. Journal of Risk and Uncertainty. 51(2) 171-194.
Kunreuther, H., & Michel-Kerjan, E. (2009). At War with the Weather: Managing Large-Scale Risks in a New Era of Catastrophes. Cambridge: MIT Press.
Lei, Y., Liu, C., Zhang, L., Wan, J., Li, D., & Yue, Q. (2015). Adaptive governance to typhoon disasters for coastal sustainability: A case study in Guangdong, China. Environmental Science & Policy, 54, 281-286.
Liu, D., Liang, P., & Xie, B. (2009). Typhoon disaster in China: Prediction, prevention, and mitigation. Natural Hazards, 49, 421-436.
Meyer, R. J. (2012). Failing to learn from experience about catastrophes: The case of hurricane preparedness. Journal of Risk and Uncertainty, 42, 25-50.
Michel-Kerjan, E., Lemoynes de Forges, S., & Kunreuther, H. (2012). Policy Tenure under the National Flood Insurance Program. Risk Analysis. 32, 644-658.
Palm, R. (1995). Earthquake insurance: A longitudinal study of California homeowners. Boulder, CO: Westview Press.
Palm, R. and Carroll, J. (1998). Illusions of Safety: Cultural and Earthquake Hazard Response in California and Japan Boulder, CO: Westview Press.
24
Risk Management Solutions (2014). “When ’The Big One’” Hits http://rms.com/images/loma-prieta/pdf/WhenTheBigOneHits.pdf
Ross, M., & Sicoly, F. (1979). Egocentric biases in availability and attribution. Journal of Personality and Social Psychology, 37 (3): 322-336.
Suetens, S., & Tyran, J. R. (2012). The gambler’s fallacy and gender. Journal of Economic Behavior & Organization, 83(1), 118-124.
Tversky, A., & Kahneman, D. (1974). Judgment under uncertainty: Heuristics and biases, Science, 185(4157), 1124-1131.
Tversky, A., & Kahneman, D. (1973). Availability: A heuristic for judging frequency and probability, Cognitive Psychology, 5 (2), 207-232.
Wilkinson, C. (2008). The California earthquake authority. Briefing, Insurance Information Institute, http://server.iii.org/yy_obj_data/binary/794172_1_0/CEA.pdf.
World Bank (2008). Catastrophe Insurance Policy for China. World Bank Good Practice Notes. http://siteresources.worldbank.org/CHINAEXTN/Resources/318949-1217387111415/Catastrophe_Insurance_en.pdf
Xie, W., Li, N., Wu, J. D., & Hao, X. L. (2014). Modeling the economic costs of disasters and recovery: Analysis using a dynamic computable general equilibrium model. Natural Hazards and Earth System Sciences, 14, 757-772.
Yin, H. (2013). Insurance Approach for Financing Extreme Climate Events Losses in China: A Status Analysis. Economy and Environment Program for Southeast Asia. Available at www.eepsea.net.
Yin, H., Pfaff, A., and Kunreuther, H. (2011). Can Environmentla Insurance Succeed Where Other Strategies Fail? The Case of Underground Storage Tanks, Risk Analysis 31(1):12-24.
25
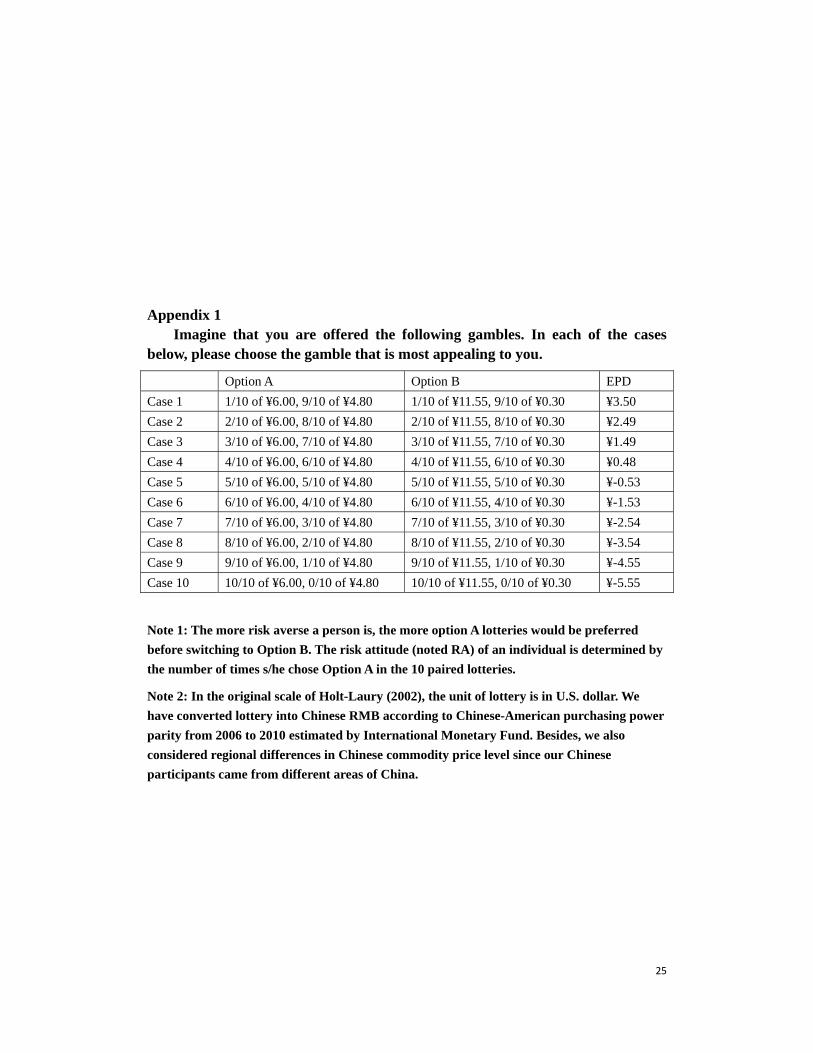
Appendix 1
Imagine that you are offered the following gambles. In each of the cases below, please choose the gamble that is most appealing to you.
Option A Option B EPD
Case 1 1/10 of ¥6.00, 9/10 of ¥4.80 1/10 of ¥11.55, 9/10 of ¥0.30 ¥3.50
Case 2 2/10 of ¥6.00, 8/10 of ¥4.80 2/10 of ¥11.55, 8/10 of ¥0.30 ¥2.49
Case 3 3/10 of ¥6.00, 7/10 of ¥4.80 3/10 of ¥11.55, 7/10 of ¥0.30 ¥1.49
Case 4 4/10 of ¥6.00, 6/10 of ¥4.80 4/10 of ¥11.55, 6/10 of ¥0.30 ¥0.48
Case 5 5/10 of ¥6.00, 5/10 of ¥4.80 5/10 of ¥11.55, 5/10 of ¥0.30 ¥-0.53
Case 6 6/10 of ¥6.00, 4/10 of ¥4.80 6/10 of ¥11.55, 4/10 of ¥0.30 ¥-1.53
Case 7 7/10 of ¥6.00, 3/10 of ¥4.80 7/10 of ¥11.55, 3/10 of ¥0.30 ¥-2.54
Case 8 8/10 of ¥6.00, 2/10 of ¥4.80 8/10 of ¥11.55, 2/10 of ¥0.30 ¥-3.54
Case 9 9/10 of ¥6.00, 1/10 of ¥4.80 9/10 of ¥11.55, 1/10 of ¥0.30 ¥-4.55
Case 10 10/10 of ¥6.00, 0/10 of ¥4.80 10/10 of ¥11.55, 0/10 of ¥0.30 ¥-5.55
Note 1: The more risk averse a person is, the more option A lotteries would be preferred
before switching to Option B. The risk attitude (noted RA) of an individual is determined by
the number of times s/he chose Option A in the 10 paired lotteries.
Note 2: In the original scale of Holt-Laury (2002), the unit of lottery is in U.S. dollar. We
have converted lottery into Chinese RMB according to Chinese-American purchasing power
parity from 2006 to 2010 estimated by International Monetary Fund. Besides, we also
considered regional differences in Chinese commodity price level since our Chinese
participants came from different areas of China.
26
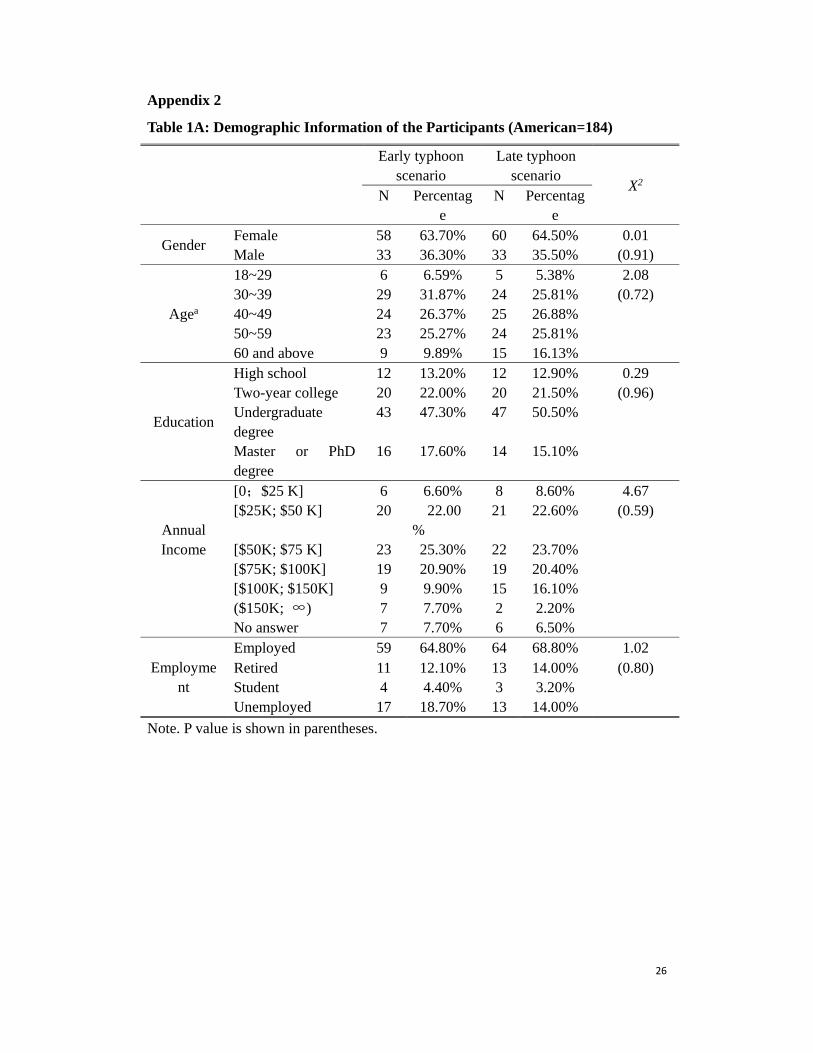
Appendix 2
Table 1A: Demographic Information of the Participants (American=184)
Early typhoon scenario
Late typhoon scenario
X2 N Percentag
e N Percentag
e
Gender Female 58 63.70% 60 64.50% 0.01 Male 33 36.30% 33 35.50% (0.91)
Agea
18~29 6 6.59% 5 5.38% 2.08 30~39 29 31.87% 24 25.81% (0.72) 40~49 24 26.37% 25 26.88% 50~59 23 25.27% 24 25.81% 60 and above 9 9.89% 15 16.13%
Education
High school 12 13.20% 12 12.90% 0.29 Two-year college 20 22.00% 20 21.50% (0.96) Undergraduate degree
43 47.30% 47 50.50%
Master or PhD degree
16 17.60% 14 15.10%
Annual Income
[0;$25 K] 6 6.60% 8 8.60% 4.67 [$25K; $50 K] 20 22.00
% 21 22.60% (0.59)
[$50K; $75 K] 23 25.30% 22 23.70% [$75K; $100K] 19 20.90% 19 20.40% [$100K; $150K] 9 9.90% 15 16.10%
($150K; ∞) 7 7.70% 2 2.20% No answer 7 7.70% 6 6.50%
Employment
Employed 59 64.80% 64 68.80% 1.02 Retired 11 12.10% 13 14.00% (0.80) Student 4 4.40% 3 3.20% Unemployed 17 18.70% 13 14.00%
Note. P value is shown in parentheses.
27
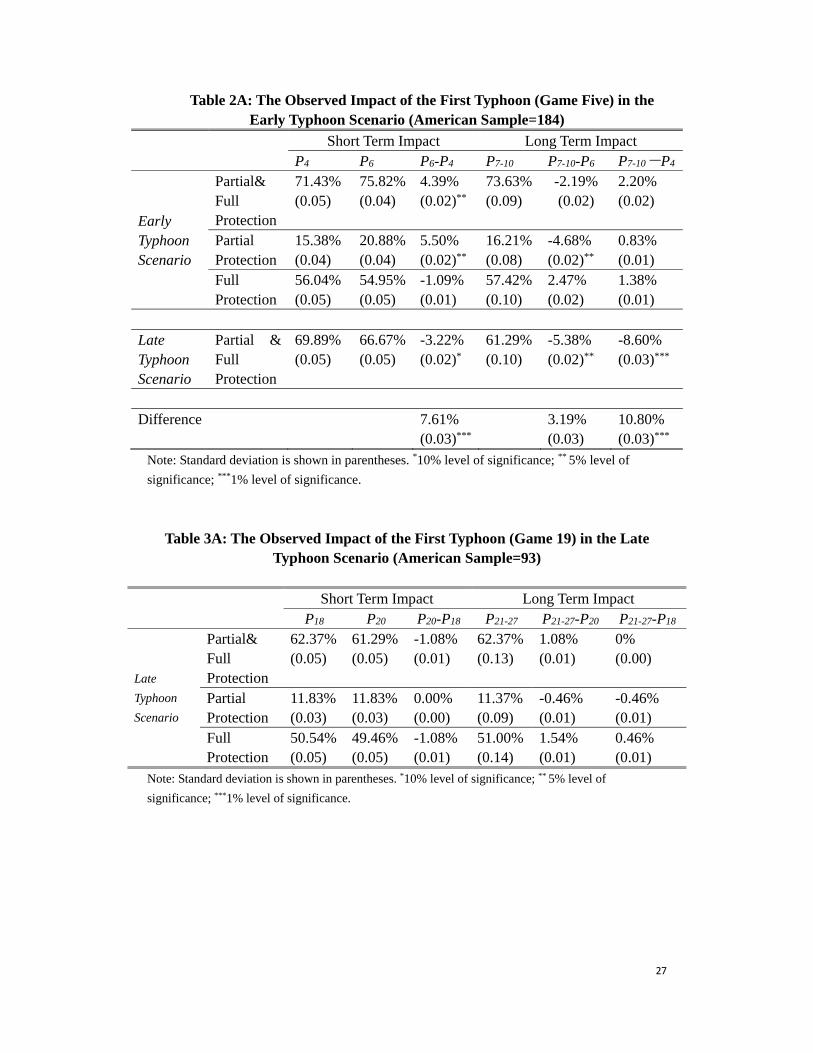
Table 2A: The Observed Impact of the First Typhoon (Game Five) in the Early Typhoon Scenario (American Sample=184)
Short Term Impact Long Term Impact P4
P6 P6-P4 P7-10 P7-10-P6 P7-10-P4
Early Typhoon Scenario
Partial& Full Protection
71.43% (0.05)
75.82% (0.04)
4.39% (0.02)**
73.63% (0.09)
-2.19% (0.02)
2.20% (0.02)
Partial Protection
15.38% (0.04)
20.88% (0.04)
5.50% (0.02)**
16.21% (0.08)
-4.68% (0.02)**
0.83% (0.01)
Full Protection
56.04% (0.05)
54.95% (0.05)
-1.09% (0.01)
57.42% (0.10)
2.47% (0.02)
1.38% (0.01)
Late Typhoon Scenario
Partial & Full Protection
69.89% (0.05)
66.67% (0.05)
-3.22% (0.02)*
61.29% (0.10)
-5.38% (0.02)**
-8.60% (0.03)***
Difference 7.61%
(0.03)*** 3.19%
(0.03) 10.80% (0.03)***
Note: Standard deviation is shown in parentheses. *10% level of significance; ** 5% level of
significance; ***1% level of significance.
Table 3A: The Observed Impact of the First Typhoon (Game 19) in the Late Typhoon Scenario (American Sample=93)
Short Term Impact Long Term Impact P18
P20 P20-P18 P21-27 P21-27-P20 P21-27-P18
Late
Typhoon
Scenario
Partial& Full Protection
62.37% (0.05)
61.29% (0.05)
-1.08% (0.01)
62.37% (0.13)
1.08% (0.01)
0% (0.00)
Partial Protection
11.83% (0.03)
11.83% (0.03)
0.00% (0.00)
11.37% (0.09)
-0.46% (0.01)
-0.46% (0.01)
Full Protection
50.54% (0.05)
49.46% (0.05)
-1.08% (0.01)
51.00% (0.14)
1.54% (0.01)
0.46% (0.01)
Note: Standard deviation is shown in parentheses. *10% level of significance; ** 5% level of
significance; ***1% level of significance.
28
Table 4A: Logistic Regression Analysis of Availability Switchers (American Sample) Availability switcher
(1=switch to partial or full
protection, 0=others)
Age -0.06
(1.73)*
Gender (1=male, 0=female) -2.05
(2.29)**
Education 0.01
(0.04)
Income -0.27
(0.81)
RiskAversion (RA) -0.02
(0.17)
Constant 2.68
(1.14)
N 59§
Note: §Sixty-one participants chose No Insurance Protection in the game before a typhoon. Two
observations are lost in the regression analysis because of missing values on some of the
independent variables. 15 (25.42%) participants chose either Partial or Full Protection among the
sample. When stricter definition is used, the model fails to converge because of perfect
determination. Z value is in parenthesis. *10% level of significance **5% level of significance.
Table 5A: The Observed Impact of the Second Typhoon (Game 10) in the Early
Typhoon Scenario (American, N=93)
Short Term Impact Long Term Impact P9 P11 P11-P9 P12-20 P12-20-P11
P12-20-P9
Early Typhoon Scenario
Partial &Full Protection
70.33% (0.05)
62.64% (0.05)
-7.69% (0.03)***
70.09% (0.14)
7.45% (0.03)***
-0.24% (0.01)
Partial Protection
15.38% (0.04)
7.69% (0.03)
-7.69% (0.03)**
12.46% (0.10)
4 .77% (0.02)**
-2.92% (0.02)*
Full Protection
54.95% (0.05)
54.95% (0.05)
0.00% (0.01)
57.63% (0.16)***
2.68% (0.02)
3.04% (0.02)*
Late Typhoon Scenario
Partial & Full Protection
59.14% (0.05)
63.44% (0.05)
4.30% (0.02)**
64.04% (0.15)
0.60% (0.01)
4.90% (0.02)**
Difference -11.99%
(0.03)*** 6.85%
(0.03)** -5.14% (0.02)**
Note: Standard deviation is shown in parentheses. *10% level of significance; ** 5% level of
significance; ***1% level of significance.
29
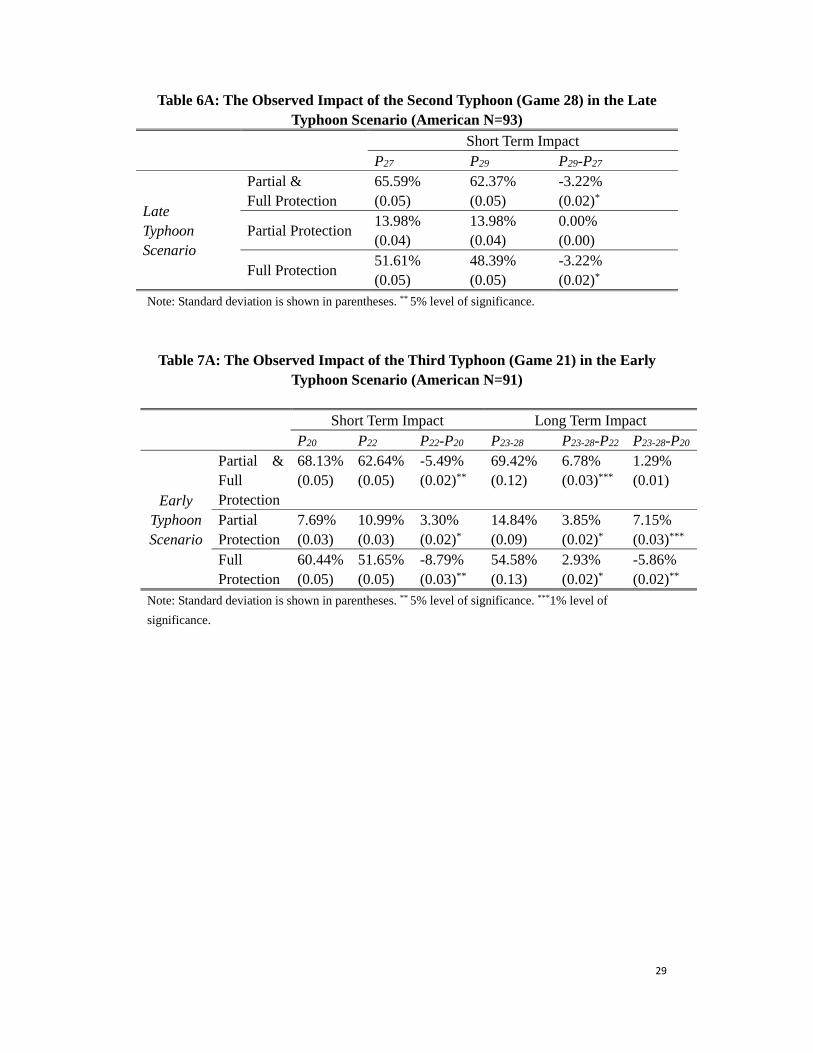
Table 6A: The Observed Impact of the Second Typhoon (Game 28) in the Late Typhoon Scenario (American N=93)
Short Term Impact P27 P29 P29-P27
Late Typhoon Scenario
Partial & Full Protection
65.59% (0.05)
62.37% (0.05)
-3.22% (0.02)*
Partial Protection 13.98% (0.04)
13.98% (0.04)
0.00% (0.00)
Full Protection 51.61% (0.05)
48.39% (0.05)
-3.22% (0.02)*
Note: Standard deviation is shown in parentheses. ** 5% level of significance.
Table 7A: The Observed Impact of the Third Typhoon (Game 21) in the Early Typhoon Scenario (American N=91)
Short Term Impact Long Term Impact P20 P22 P22-P20 P23-28 P23-28-P22
P23-28-P20
Early Typhoon Scenario
Partial & Full Protection
68.13% (0.05)
62.64% (0.05)
-5.49% (0.02)**
69.42% (0.12)
6.78% (0.03)***
1.29% (0.01)
Partial Protection
7.69% (0.03)
10.99% (0.03)
3.30% (0.02)*
14.84% (0.09)
3.85% (0.02)*
7.15% (0.03)***
Full Protection
60.44% (0.05)
51.65% (0.05)
-8.79%
(0.03)** 54.58% (0.13)
2.93% (0.02)*
-5.86% (0.02)**
Note: Standard deviation is shown in parentheses. ** 5% level of significance. ***1% level of
significance.
30
Table 8A: Logistic Regression Analysis of Gambling Switchers (American Sample)
Gambling Switcher (Switch from
partial/full to no protection=1,
Others=0)
Gambling Switcher (Switch from
full to no insurance protection=1
and others=0 )
Age -0.00 -0.08
(0.13) (1.18)
Gender (1=male,
0=female)
0.75 -1.12
(0.87) (0.82)
Education 0.42 0.54
(1.04) (0.89)
Income -0.11 -0.05
(0.38) (0.11)
RiskAversion (RA) 0.17 0.07
(1.08) (0.31)
Constant -3.93
(1.57)
-0.66
(0.19)
N 59§ 46¥
Note: § Sixty-four chose partial or full insurance in the game right before the second typhoon in the
early typhoon scenario. The sample size reduces to fifty-nine in the regression analysis because of
missing values on some of the independent variables. ¥Fifty participants chose full insurance in the
game right before the second typhoon in the early typhoon scenario. The sample size reduces to
forty-six in the regression analysis because of missing values on some of the independent variables. We
do not consider the late typhoon scenario because of the “end of game” concern we discussed in the
text. Z value is in parenthesis, *10% level of significance.


![Gambler’s Ruin Bandit Problem · A. Gambler’s Ruin Problem If action F is removed from the GRBP, it becomes the Gambler’s Ruin Problem. In the model of Hunter et al. [10] of](https://img.pdfslide.us/doc/110x75/5f0c18f57e708231d433ba74/gambleras-ruin-bandit-problem-a-gambleras-ruin-problem-if-action-f-is-removed.jpg)