Embed Size (px)
Citation preview

AUTOMATIC TRACER-DILUTION METHOD USED FOR STAGE- DISCHARGE RATINGS AND STREAMFLOW HYDROGRAPHS ON SMALL IOWA STREAMS
By Philip J. Soenksen
U.S. GEOLOGICAL SURVEY
Water-Resources Investigations Report 89-4187
Prepared in cooperation with theHIGHWAY RESEARCH BOARDHIGHWAY DIVISIONIOWA DEPARTMENT OF TRANSPORTATION
Iowa City, Iowa 1990
DEPARTMENT OF THE INTERIOR
MANUEL LUJAN, JR., Secretary
U.S. GEOLOGICAL SURVEY
Dallas L. Peck, Director
Any use of trade, product, or firm namesin this publication is for descriptive purposesonly and does not imply endorsement by the
U.S. Government
For additional information Copies of this report can bewrite to: purchased from:
District Chief U.S. Geological SurveyU.S. Geological Survey Books and Open-File Reports Section400 South Clinton Federal Center, Bldg. 810P.O. Box 1230 Box 25425Iowa City, Iowa 52244-1230 Denver, Colorado 80225
11

CONTENTS
Page
Abstract..........................................................................................^^ 1Introduction.........................................................................._ 1
Purpose and scope......................................................................................................................... 2Acknowledgments........................................................................................................................ 2
Automatic tracer-dilution method............................................................................................................... 2System design............................................................................................................................... 2Tracer.....................................................................................................................................^ 5
Dye losses....................................................................................................................... 5Background fluorescence............................................................................................... 7
Mixing.......................................................................................................................................... 7System equipment......................................................................................................................... 9
Signal component........................................................................................................... 9Stage-recording component............................................................................................ 9Tracer-injection component........................................................................................... 12Stream-sampling component.......................................................................................... 17Sample-analysis component........................................................................................... 17
Field operations............................................................................................................................ 23System preparation......................................................................................................... 23Site servicing.................................................................................................................. 24
Laboratory operations................................................................................................................... 24Sample analysis.............................................................................................................. 24Discharge computation................................................................................................... 24
Site studies: descriptions, ratings, and streamflow hydrographs............................................................... 25Silver Creek at Welton - site 1...................................................................................................... 25East Branch Iowa River above Hayfield - site 2........................................................................... 25West Beaver Creek at Grand Junction-site 3.............................................................................. 28Middle Raccoon River tributary at Carroll - site 4....................................................................... 28South Otter Creek tributary near Woodburn - site 5..................................................................... 31South Fox Creek near West Grove - site 6................................................................................... 31Perry Creek near Hinton - site 7................................................................................................... 34Willow Creek near Soldier - site 8............................................................................................... 34
Summary and conclusions .......................................................................................................................... 37Selected references...................................................................................................................................... 38Supplemental information........................................................................................................................... 39
ill

ILLUSTRATIONS
Page
Figure 1. Map showing location of crest-stage gaging stations selected for automatictracer-dilution study............................................................................................. 3
2. Graph showing concentration-time curve for constant-rate injection........................ 4
3. Diagram of automatic tracer-dilution field components............................................. 6
4. Graphs showing comparison of background fluorescence with gage height duringhigh flows at two automatic tracer-dilution sites................................................ 8
5. Schematic diagram of signal-component relays for system shown in figure 3.......... 41
Figures 6.-13. Photographs showing:
6. Radio signal device for stream sampler...................................................................... 10
7. Stage-recording structure and equipment................................................................... 11
8. Stilling pipe, screened intake, mounting pipe, and crest-stage gage for site 1........... 13
9. Large (original) tracer-injection structure and equipment.......................................... 14
10. Small (revised) tracer-injection structure for positive-displacement pump andrelated equipment................................................................................................ 15
11. Dual-head peristaltic pump and single-head positive-displacement pumpwith flow splitter.................................................................................................. 16
12. Riser-type injection line.............................................................................................. 18
13. Dye-injection nozzles................................................................................................. 19
14. Graph showing relation of pump rates to head differences for peristalticand positive-displacement pumps........................................................................ 20
15. Graph showing relation of pump rates to direct-current voltage for thepositive-displacement pump at a pump setting of 10.......................................... 21
16. Photograph showing stream sampler and sampling structure.................................... 22
17. Field form for inspecting and servicing automatic tracer-dilution equipment, usingrhodamine-WT dye at crest-stage gages.............................................................. 42
18. Laboratory form for computing automatic tracer-dilution discharge measurements using fluorometer readings, dilution factors, and injection rates....................................................................................................... 45
IV

ILLUSTRATIONS
Page
Figures 19.-26. Graphs showing:
19. Automatic tracer-dilution measurements, rating, and hydrographs for flowof September 24,1986 at Silver Creek at Welton , Iowa (site 1)........................ 26
20. Comparison of automatic tracer-dilution measurements with rating curve forSilver Creek at Welton, Iowa (site 1).................................................................. 27
21. Comparison of automatic tracer-dilution measurements with rating curves forWest Beaver Creek at Grand Junction, Iowa (site 3).......................................... 29
22. Selected gage-height hydrographs for West Beaver Creek at Grand Junction,Iowa (site 3)......................................................................................................... 30
23. Comparison of automatic tracer-dilution measurements with preliminary ratingcurve for Middle Raccoon River tributary at Carroll, Iowa (site 4).................... 32
24. Selected gage-height hydrographs for Middle Raccoon River tributary atCarroll, Iowa (site 4)............................................................................................ 33
25. Comparison of automatic tracer-dilution measurements with rating curve forPerry Creek near Hinton, Iowa (site 7)................................................................ 35
26. Comparison of automatic tracer-dilution measurements with estimated ratingcurve for Willow Creek near Soldier, Iowa (site 8)............................................ 36
TABLES
Page
Table 1. Automatic tracer-dilution stations.............................................................................. 5

CONVERSION FACTORS
For readers who prefer to use International System (SI) units rather than the inch-pound terms used in this report, the following conversion factors may be used.
Multiply inch-pound unit By To obtain SI units
inch 25.4 millimeterfoot 0.3048 metermile 1.609 kilometersquare mile 2.590 square kilometergallon 3.785 litergallon 3.785 x 10³ milliliterfoot per second 0.0348 meter per secondsquare foot per second 0.09290 square meter per secondcubic foot per second 0.028317 cubic meter per secondfoot per foot 1.0 meter per meter
VI

Symbol
B
C
Cd
SYMBOLS, DEFINITIONS, AND UNITS
Definition
Average width of stream
Plateau concentration of injected tracer after dilution by streamflow
Maximum desired concentration of injected tracer after dilution by streamflow
Concentration of injected tracer solution
Concentration of dye solution
Unit
Ci,C2,C3,Q Concentrations resulting from serial dilutions 1 through 2, 3, and 4 dilution steps
Mean depth of stream
Dilutions for each step, 1, 2, 3, and 4 of a serial dilution
Transverse mixing coefficient
Volume of dye coefficient
Ez
K
L0
n
q
Q
Qtrg
s
SGd
SGW
SGt
t
T
v
Vd
Vdw
Channel length required for optimum mixing; usually corresponds to about 95 percent mixing
Number of samples
Rate of constant-rate injection
Total stream discharge
Stream discharge when system is triggered
Water-surface slope
Specific gravity of dye solution
Specific gravity of water
Specific gravity after step 1 of a serial dilution
Time interval between samples
Time duration that tracer is injected
Mean stream velocity
Volume of dye solution
Volume of dye/water mixture after a dilution
ft
M-g/L
M-g/L
M-g/L
M-g/L
ft
ftVs
(mL/min)/(ft3/s)
ft
mL/min
ftVs
ftVs
ft/ft
mm
min
ft/s
mL
mL
Vll
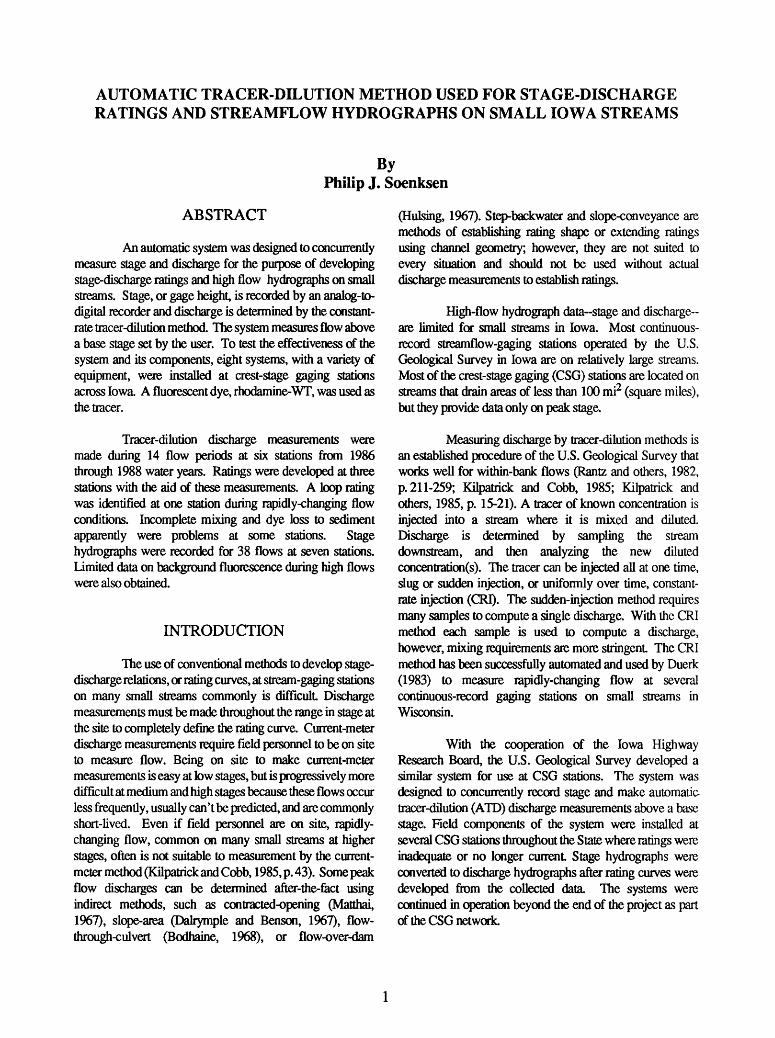
AUTOMATIC TRACER-DILUTION METHOD USED FOR STAGE-DISCHARGE RATINGS AND STREAMFLOW HYDROGRAPHS ON SMALL IOWA STREAMS
By Philip J. Soenksen
ABSTRACT
An automatic system was designed to concurrently measure stage and discharge for the purpose of developing stage-discharge ratings and high flow hydrographs on small streams. Stage, or gage height, is recorded by an analog-to- digital recorder and discharge is determined by the constant- rate tracer-dilution method The system measures flow above a base stage set by the user. To test the effectiveness of the system and its components, eight systems, with a variety of equipment, were installed at crest-stage gaging stations across Iowa A fluorescent dye, rhodamine-WT, was used as the tracer.
Tracer-dilution discharge measurements were made during 14 flow periods at six stations from 1986 through 1988 water years. Ratings were developed at three stations with the aid of these measurements. A loop rating was identified at one station during rapidly-changing flow conditions. Incomplete mixing and dye loss to sediment apparently were problems at some stations. Stage hydrographs were recorded for 38 flows at seven stations. Limited data on background fluorescence during high flows were also obtained.
INTRODUCTION
The use of conventional methods to develop stage- discharge relations, or rating curves, at stream-gaging stations on many small streams commonly is difficult. Discharge measurements must be made throughout the range in stage at the site to completely define the rating curve. Current-meter discharge measurements require field personnel to be on site to measure flow. Being on site to make current-meter measurements is easy at low stages, but is progressively more difficult at medium and high stages because these flows occur less frequently, usually can'tbe predicted, and are commonly short-lived. Even if field personnel are on site, rapidly- changing flow, common on many small streams at higher stages, often is not suitable to measurement by the current- meter method (Kilpatrick and Cobb, 1985, p. 43). Some peak flow discharges can be determined after-the-fact using indirect methods, such as contracted-opening (Matthai, 1967), slope-area (Dalrymple and Benson, 1967), flow- through-culvert (Bodhaine, 1968), or flow-over-dam
(Hulsing, 1967). Step-backwater and slope-conveyance are methods of establishing rating shape or extending ratings using channel geometry; however, they are not suited to every situation and should not be used without actual discharge measurements to establish ratings.
High-flow hydrograph data-stage and discharge- are limited for small streams in Iowa. Most continuous- record streamflow-gaging stations operated by the U.S. Geological Survey in Iowa are on relatively large streams. Most of the crest-stage gaging (CSG) stations are located on streams that drain areas of less than 100 mi2 (square miles), but they provide data only on peak stage.
Measuring discharge by tracer-dilution methods is an established procedure of the U.S. Geological Survey that works well for within-bank flows (Rantz and others, 1982, p. 211-259; Kilpatrick and Cobb, 1985; Kilpatrick and others, 1985, p. 15-21). A tracer of known concentration is injected into a stream where it is mixed and diluted. Discharge is determined by sampling the stream downstream, and then analyzing the new diluted concentration(s). The tracer can be injected all at one time, slug or sudden injection, or uniformly over time, constant- rate injection (CRT). The sudden-injection method requires many samples to compute a single discharge. With the CRI method each sample is used to compute a discharge, however, mixing requirements are more stringent The CRI method has been successfully automated and used by Duerk (1983) to measure rapidly-changing flow at several continuous-record gaging stations on small streams in Wisconsin.
With the cooperation of the Iowa Highway Research Board, the U.S. Geological Survey developed a similar system for use at CSG stations. The system was designed to concurrently record stage and make automatic tracer-dilution (ATD) discharge measurements above a base stage. Field components of the system were installed at several CSG stations throughout the State where ratings were inadequate or no longer current. Stage hydrographs were converted to discharge hydrographs after rating curves were developed from the collected data. The systems were continued in operation beyond the end of the project as part of the CSG network.

Purpose and Scope
This report describes the AID system and its effectiveness with various types of equipment in the development of ratings and hydrographs at several CSG stations for water years (October 1-September 30) 1986 through 1988. Held equipment was installed at eight CSG stations across the State (fig. 1, table 1). The stations have drainage areas that range from 0.71 to 30.8 mi2 and are in several different landform regions with different runoff characteristics.
Acknowledgments
A number of individuals, cities, counties, and Highway Division Regions of the Iowa Department of Transportation permitted installation of equipment on land under their ownership or jurisdiction, and their cooperation is gratefully acknowledged. Two U.S. Geological Survey employees were especially helpful to the author in carrying out this study: Marvin Duerk, of Wisconsin, who answered many questions regarding system equipment; and David Hash, of Iowa, who analyzed most of the tracer-dilution samples and who shop-tested injection pumps against various hydraulic heads.
AUTOMATIC TRACER-DILUTION METHOD
When a tracer of known concentration (C) is injected at a constant rate (q) into a stream with steady discharge (Q) for a sufficient period of time, the concentration of the tracer downstream, after complete mixing, eventually will reach equilibrium (c), as shown in figure 2, and then decrease when injection is stopped If no tracer is lost and background concentrations are accounted for, the principal of conservation of mass applies and the tracer injected (qC) will equal the tracer flowing past the sampling point [(Q4<])c]. When the injection rate is small compared to the stream discharge, the equation can be expressed as
Q = 5.89xlO~7<7- (1)
whereQ = stream discharge, in ftVs (cubic feet per
second);q = injection rate, in mL/min (milliliters per minute); C = tracer concentration injected into the stream, in
|lg/L (micrograms per liter);
c = tracer concentration at the sampling point (minus any background concentration), in |ig/L.
Applying the above equation to actual flow situations theoretically requires that no longitudinal dispersion of tracer occurs. Of course, any tracer injected into a given element of flow does disperse. With the CRI method, however, tracer is injected into all elements of flow, and tracer from each of the other elements also disperses. By the principle of superposition, tracer also is gained by each element of flow from other elements, and equation 1 is valid to the extent that gains equal losses. For steady flow this is true once the plateau concentration is reached (fig. 2; Kilpatrick and Cobb, 1985, p. 4-6).
Dispersion varies with flow, and relative gains and losses of individual elements of flow vary during unsteady flow, especially if flow is changing rapidly. Therefore, the effective use of equation 1 is limited, though to an unknown extent, by the rate of change of flow. Unsteady flow has been successfully measured with the CRI method on several occasions, with the best results obtained during flood recessions (Kilpatrick and Cobb, 1985, p. 4043; and Duerk, 1983, p. 3). Rapidly changing flow did not seem to substantially affect the results of this study.
There are other requirements that must be met, or nearly met, if stream discharge is to be satisfactorily measured by this method The injection rate must be accurately measured and remain steady. Tracer losses should be minimal during the entire measuring process. Background concentrations of the tracer in the stream, if any, should be measured and subtracted from sample concentrations. Finally, complete mixing should occur between the injection point and the sampling point Each of these requirements is discussed in more detail later in the report. When these requirements were met, the computations were straightforward and results were acceptable.
System Design
The ATD system was designed to obtain stage and discharge data; it can be broken down into five components: (1) signal, (2) stage-recording, (3) tracer-injection, (4) stream-sampling, and (5) sample-analysis. The stage- recording component provides a digital record of stream gage height and the other components provide the discharge record Except for sample analysis, which is done in the District laboratory, the other four components were designed to work automatically on site during flows above a base stage, or gage height The design of this system was mainly based on the work of Duerk (1983) in Wisconsin.

96
°9
2(
NO
RT
HJW
ES
T
IOW
A
PL
AI
~i ~
- - |- -
i
- --
- -I
DE
S
MO
WE
S
1
I O
W
Co
un
cil
Blu
ffs
SO
UT
HE
RN
! lO
WA
'DR
IFT
-PL
AIN
I I
J'~
-"
"
~L-~I.
Landfo
rm R
egio
ns of
Iow
a,
modifi
ed f
rom
P
rio
r,
19
76
30
6090
M
ILE
S
SO
UT
HE
RN
IOW
A
DR
IFT
P
LA
IN
MIS
SIS
SIP
PI
AL
LU
VIA
L
PL
AIN
EX
PL
AN
AT
ION
0 30
60
90
KIL
OM
ET
ER
S
Fig
ure
1. Location
of
cre
st-
sta
ge
ga
gin
g s
tatio
ns
sele
cte
d fo
r auto
matic
tr
ace
r-d
ilutio
n s
tud
y
'A
GA
GIN
G
ST
AT
ION
A
ND
S
ITE
N
UM
BE
R
U.S
. G
EO
LO
GIC
AL
S
UR
VE
Y
OF
FIC
E
LO
CA
TIO
N

oI-
DCI- Z UJoz o oDC UJ O
DCI-
Rateau
Tail
Background
TIME
Figure 2. Concentration-time curve for constant-rate injection.

Table I. Automatic tracer-dilution stations
[1C, Iowa City; FD, Fort Dodge; CB, Council Bluffs]
Sitenumber(fig. 1)
12345678
0542189005448600054816900548334905487350054941100659995006609560
U.S. Geological Surveygaging station number and name
Silver Creek at WeltonEast Branch Iowa River above HayfieldWest Beaver Creek at Grand JunctionMiddle Raccoon River tributary at CarrollSouth Otter Creek tributary near WoodburnSouth Fox Creek near West GrovePerry Creek near HintonWillow Creek near Soldier
Drainagearea
(squaremiles)
9.032.23
12.66.58
.7112.230.829.1
Servicingoffice
1CFDFDFD1C1CCBCB
The usual configuration of the ATD field components is shown in figure 3. As water rises above the base gage height, the signal component activates all the other field components simultaneously. The stage-recording component records gage height at a set interval, based on its own timer, until it is manually turned off. As long as the stage remains above the base gage height, the tracer-injection component pumps continuously, and the stream sampler collects a sample whenever the stage-recorder is activated. When the stage falls below base gage height, the tracer- injection and stream-sampling components shut off. Should the stage rise above the base gage height again, both components are reactivated and operate as before. The stream sampler ceases to take samples once it reaches capacity but the tracer-injection component continues to operate, even if all of the tracer has been pumped out
After samples are collected and sent to the lab, each is analyzed to determine tracer concentration. The first one or more samples, taken before any tracer has reached the sampling point, provide the background concentration of tracer in the stream. All remaining samples are adjusted for background concentration, which is assumed to remain constant, and used to compute stream discharge. Samples are coordinated with the gage-height record, and measurements are plotted on an appropriate rating diagram.
Tracer
Rhodamine-WT was the tracer used in this study. It is a fluorescent dye that can be measured at concentrations less than 0.1 |ig/L with a fluorometer. It is commercially available as a 20-percent solution in bulk quantities. For its hydrologic investigations, the U.S.Geological Survey allows a maximum concentration of 10 |Og/L in streams at water
intakes that result in direct or indirect human consumption (Wilson, Cobb, and Kilpatrick, 1984). Although no such intakes were known to be downstream from any of the study sites, computations of dye injection rates and volumes of dye to be injected were based on thislimit as a precaution. This also standardized the computations.
Dye Losses
Any tracer loss during system operations results in a computed discharge greater than the true discharge. Losses of rhodamine-WT dye can occur from oxidation by chemicals such as chlorine, from photochemical decay by sunlight, from wind drift if the dye injection line is suspended above the water surface, and from sorption to fine sediment particles and aquatic plants (Rantz and others, 1982, p. 216; Kilpatrick and Cobb, 1985, p. 37). In this study, distilled water was used for dye injection mixtures to prevent losses from chlorine. Photochemical decay losses should have been minimal because travel times in the streams were quite short and the dye injection structure and stream sampler were sealed against light Wind drift was eliminated by anchoring injection lines in the flow area of the channel, except at site 8. There appeared to be no substantial sediment sorption when samples were decanted and analyzed promptly after sediment had settled Sorption losses probably occurred at site 8, which has heavy sediment loads, when the samples were not decanted for several weeks after they were collected. At site 4, several sets of samples were remixed after settling and may have had sorption losses as well. Long exposure periods to other stream-water constituents or sample storage containers also may result in some dye loss. A 1988 re-analysis of samples collected during 1986 from site 1 indicated an average decrease in concentration of about 25 percent

TRACER-INJECTION COMPONENT
To stream
Automatic stream sampler
Hard-wireconnection or
Radio transmitterand receiver
SIGNAL, STAGE-RECORDING AND STREAM-SAMPLING COMPONENTS
Signal relays
Float switch
Stage recorder
To stream
Figure 3. Automatic tracer-dilution field components.

Background Fluorescence
Although rhodamine-WT dye may not be present in the streamflow, natural fluorescence or turbidity that produces a fluorometer reading must be treated as background concentrations of tracer. For this study, it was assumed that background concentrations remained constant during sampled flows, which eliminated the need for a second stream sampler (upstream from the tracer-injection component) for the sole purpose of measuring background concentrations. The initial one or more stream samples, collected before any dye had reached the sampling location, were used to adjust for background concentrations on all remaining samples of a set This results in errors only to the extent that the difference between actual and estimated background concentration is a proportion of the injected dye concentration of an individual sample. Background fluorescence becomes increasingly important as stream discharge increases. The dye injected becomes more diluted and the background concentration becomes a larger proportion of the total (background plus injected dye) concentration of the sample.
During 1986 at site 4, and during 1987 at site 5, entire sets of background samples were collected when dye injection pumps did not work during high flows (fig. 4). Background concentrations were variable at site 4, ranging from 2 to 6 percent of the maximum expected concentration of injected dye. Other background samples from this site had lower concentrations. Background concentrations were almost uniform at site 5 and only about 1 percent of the 10 mg/L limit for injected dye.
It is critical to obtain adequate mixing of the tracer, both laterally and vertically in the channel, if accurate results are to be derived from the tracer-dilution method, especially if only one point in the stream is sampled. Complete mixing requires a relatively long mixing reach. However, for measuring rapidly changing flow and for servicing equipment, it is desirable to have a short mixing reach. A proper balance of these two requirements must be met The following equation from Kilpatrick and Cobb (1985, eq. 4) was used to compute, or check for adequacy of, mixing distances; it was adapted from Yotsukura and Cobb (1972, eq. 29), and Fischer and others (1979, eqs. 5 and 10).
(2)
where
LQ = distance required for optimum mixing, in ft; v = mean stream velocity, in ft/s (feet per second); B = average stream width, in ft; and EZ = transverse mixing coefficient, in ft?/s (square
feet per second).
Mean stream velocity was estimated using the Manning equation. The transverse mixing coefficient was computed from the following equation taken from Kilpatrick and Cobb (1985, p. 7):
E2 = 1.13D 1 '5/5 (3)
whereD = mean depth of the stream, in ft; and s = water-surface slope, in ft/ft (feet per foot).
Since the width factor in equation 2 is squared, any decrease in it will disproportionally decrease the required mixing distance. If two dye injection points are used, the effective width is decreased by a factor of two and the distance is decreased by a factor of four, if three injection points are used, the distance is decreased by a factor of nine. At most sites, the mixing distance was decreased by using at least two injection points. Injection points were positioned in the channel cross section so that equal quantities of tracer were injected into equal areas of flow; for simplicity, it was assumed that equal areas would convey equal quantities of flow.
Several things must be considered when using multiple injection points. First, flow from each dye injection point must be the same, or the computed mixing distance may actually be increased (Kilpatrick and Cobb, 1985, p. 35). This was a concern at some of the stations where splitters were used to divide flow from a single pump head. Secondly, unless the mixing reach is rectangular, required injection point spacing changes with stage as the cross-sectional area and flow distribution changes. However, actual injection point spacing remained fixed. Depending on the particular mixing reach, this may or may not be a concern since mixing distances generally vary with stream depth also. If the injection-point spacing is based on the stage with the longest mixing distance, then the "additional" distance available at other stages might be enough to compensate for the extra distance required because of improper injection-point spacing. Mixing distances and injection-point spacing usually were computed at base flow and bankfull stage to determine the expected range. If mixing distance and injection-point spacing were close for the two conditions then average values of each were used Otherwise, values for the stage most in need of discharge measurements were used

ccLJLI
CC LJLI 0.
Occ o
cc
LJLI Oz o oLJLI>- Q03< LJLI OzLJLI O COLJLI CCO
occ
o<CQ
0.9
0.8
0.7
0.6
0.5
0.4
0.3
0.2
0.1
0.6
0.5
Q 0.4
0.3
0.2
0.1
0.0
Site 4 - Middle Raccoon River tributary at Carroll - August 13,1986
o oo o
o o
O BACKGROUND FLUORESCENCE
GAGE HEIGHT FROM RECORDER
I
Site 5 - South Otter Creek tributary near Woodburn - June 24,1987
o o ooooooo oooooo o
o o o
25
24
23
22
21
20
19
18
17
16
57
56
55
54
53
52
51
LJJ LJJ
O LJJ I LJJ O <O
1TIME, IN HOURS AFTER SYSTEM TRIGGERED
Figure 4. Comparison of background flourescence with gage height during high flowsat two automatic tracer-dilution sites.
System Equipment
Four structures were designed for the system components - one for stage-recording, one for stream- sampling, and two for tracer-injection (one for each of two main types of pumps used). All structures were designed to be as small as possible for portability and ease of handling, yet strong enough for continuous field use and for protection against possible vandalism. The tracer-injection and stream- sampling structures were made with handles and long wooden legs, so they could be carried by one or two people and installed using hand tools.
Signal Component
The main part of the signal component was a relay box designed to activate each of the other field components at the appropriate times. It was housed in the stage-recording structure and was activated by a micro-switch attached to the stage recorder near the float tape. Below base gage height, the micro switch circuit is open and the system is off. When the stream rises above base gage height, the micro switch circuit closes and the signal component activates. A schematic diagram of the relay box (fig. 5) and a more detailed discussion of its operation are in the Supplemental Information section (Operation of the relay system) at the back of this report.
Two signal methods from the relay box to other equipment were used-hard-wire connection and radio signal. Hard-wire connections were used for most situations. However, when signal transmission distances were fairly long (300400 ft or greater) or when hard-wire connections could not be reliably maintained, a radio signal device was used Because of the system layout, there was always one short and one long signal transmission distance at each site. Either the stream-sampling component (usually) or the tracer-injection component was near the CSG with the other field components. The remaining component was located upstream (usually) or downstream a distance equal to the mixing length.
The radio signal device was a one-channel, Auto Page 1100 vehicle theft pager1 . The transmitter has a maximum signal output of 1 watt and operates from a 12VDC (volts of direct-current) power source. It was housed in the stage-recording structure to which a standard
of trade names in this report is for identification purposes only and does not constitute an endorsement by the U.S. Geological Survey.
car antenna was attached. The receiver, housed with either the tracer-injection or stream-sampling equipment, was modified to use an outside antenna and operate from 12 VDC instead of 9 VDC. Each pager had its own tone code and no license was required to operate it The transmitter was activated by the stage-recorder timer and transmitted for about 15 seconds. Upon receipt of a signal, the receiver activated another relay which turned on either the injection or the sampling equipment
The radio device worked well for triggering the stream sampler because only one short signal was required to activate the internal electronics that control the sampling cycle. Only site 1 was set up in this manner, and its device layout is illustrated in figure 6. The tracer-injection equipment, however, had to be turned both on and off according to gage height Two alternatives were considered. One alternative involved the use of two radios-one to turn the pump on, and one to turn it off. To limit costs, this solution was not tested; in retrospect, however, it may have been the better alternative. For the alternative actually used, a time delay was built into the receiver. The time delay was to exceed the time of the stage-recording cycle so that the tracer- injection equipment would remain running until a new signal could reset the time delay. Since no signals were sent when the stream was below base gage height, the tracer-injection pump automatically shut off after the time delay had expired. An 11-minute delay was considered possible, but, given the electronics of the receiver, only about one-half of that was obtained. This limited its use to sites where a short sampling interval was desired. Cost of a radio-signal device with time delay was about $ 150.
Stage-Recording Component
The stage-recording component consisted of an analog-to-digital recorder (ADR) with a U.S. Geological Survey, type 3 solid-state timer and 12 VDC power source; steel float tape, weight, and 2 1/2-in. (inch) float to sense stage; 3-in. PVC (polyvinyl chloride) pipe to serve as a stilling well; 2-in. metal pipe with standoff brackets to support the structure and house the float-tape weight; and a structure to house the equipment A hinged metal box was designed to hold the ADR, timer, 12-volt gel-cell battery, signal relay box and radio transmitter, (fig. 7). When opened for servicing, the top one-half of the box lid served as a shelf for the ADR lid and other items. Pipe couplings were welded to the bottom of the box for attaching the mounting and stilling well pipes. The box was bolted directly to a bridge, wingwall, or other solid surface, or was screwed onto the top of an existing CSG (stick removed) or other 2-in. pipe.

KAD10 TRIGGER DEVICE
FOR
REMOTE SAMPLER
Figure 6.--Radio signal device for stream sampler.
10

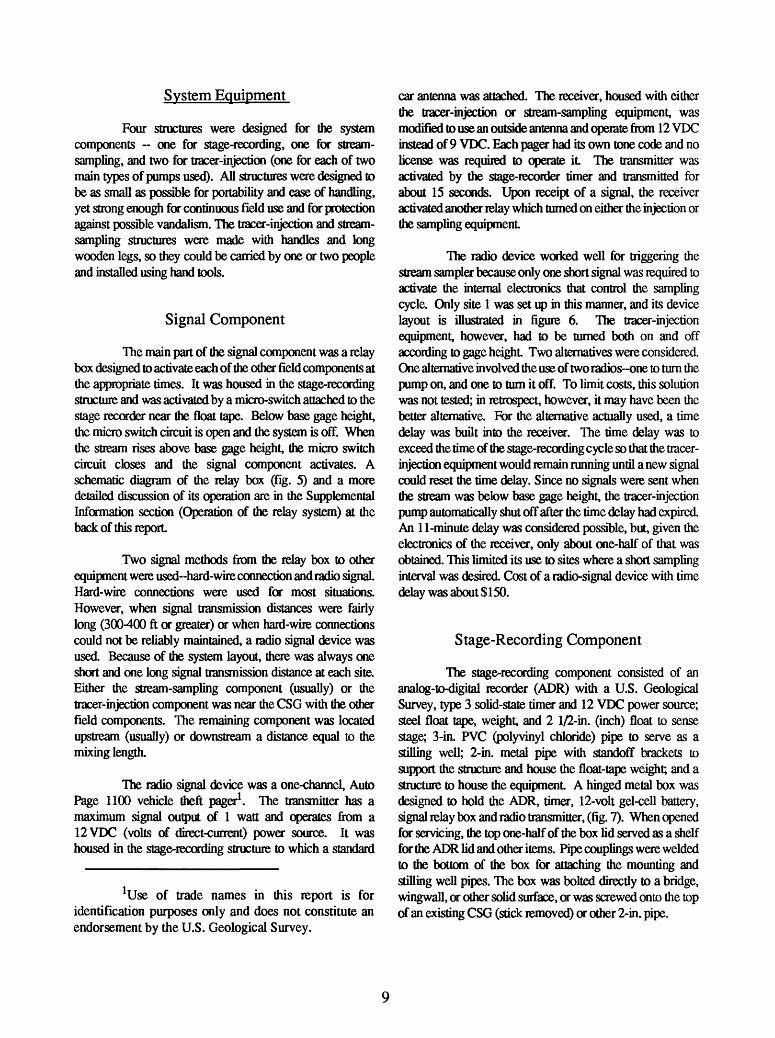
Figure /.--Stage-recording structure and equipment.
11

The 3-in. PVC pipe was secured with stiffener brackets to the stronger 2-in. metal pipe. The stilling-well pipe was left open at the bottom, or a 3-in. PVC horizontal intake was installed using various pipe fittings. Intakes were secured by taping joints or burying in place, rather than gluing, to aid in repair and disassembly. Bolts through the stilling-well pipe wall functioned as a float rest At some sites a screen was installed over the end of the pipe or intake to prevent debris from clogging the inside of the stilling well. The stilling-well pipe and screened intake, and mounting pipe for site 1 are shown in figure 8 next to the CSG.
Tracer-Injection Component
Originally, only one tracer-injection box was planned for the different types of equipment to be used. It was designed for a 20-liter dye jug, marine/RV deep-cycle battery, and any one of three pumps to be tested (fig. 9). The relatively low maximum pumping rate and low power consumption of the positive-displacement pump, however, made the use of both a smaller jug and battery with this pump practical Another smaller structure was designed for the positive-displacement pump, a 10-liter dye jug, and an 8 A- hr (ampere-hour) gel-cell battery (fig. 10). It was designed to mount on a single wooden 4x4-in. post
Dye-injection pumps had to be portable, operate on 12 VDC power, and have an adjustable pump rate that would remain steady, once set Pumps tested included Masterflex and Geotech peristaltic (both could be used with one or two heads), and Fluid Metering, Inc. (FMI) positive displacement (had to be used with a flow splitter for more than one injection point). The Geotech pump drive (Series I - 0701) with Masterflex long-shaft pump head (7016-00) requires from 2 to 5 A (amperes) of current. After installation it was discovered that the Geotech pump rate could not be adjusted slow enough for use with even the 20-liter jug and the required pumping times. It was replaced after one flow event and not used again.
The Masterflex pump drive (7533-20) with Masterflex pump head (7016-20) requires approximately 3 A of 12-VDC current. Since the injection pump operates whenever base gage height is exceeded (whether or not there is any dye left), a deep-cycle battery of at least 80 A-hr was used to prevent battery drawdown during floods of long duration. The rate adjustment knob could not be secured in position, so care was taken not to disturb it once the pump rate was set With dual heads, as it was normally used, the Masterflex pump is rated from 32 to 144 mL/min. It provided a reliable split of the dye-injection mixture for two injection points.
The FMI pump drive and head (RP-BG75-2CS Y) requires only 60-100 mA (milliamperes) of current to operate and was used with an 8 A-hr gel-cell battery. It is rated from 0-46.5 mL/min (maximum rate usually exceeded this) and the adjustment lever can be secured in place. The materials used in the pump head (piston - ceramic, cylinder case - stainless steel, and cylinder liner - carbon) were specifically recommended by the manufacturer for use with rhodamine- WT and allowed the pump to run dry without damage. The pump was reliable and worked well with a single injection point However, for more than one injection point, a flow splitter was necessary. The flow splitter did not always provide equal splits of the flow. The two pumps and batteries primarily used during this study are shown in figure 11.
Two types of flow splitters were used for multiple- point dye injection: a commercial, plastic "Y" fitting for two- point injection; and manifold fittings made from thin brass and copper tubing for two- and three-point dye injection (Kilpatrick and Cobb, 1985, p. 36-37). No difference in performance was noted. Pump tests at sites with flow splitters often showed unequal flows from the different injection points, although each line was clear and of equal length. How usually went to one injection point to the exclusion of all others. If flow was manually redirected to another injection point it usually would flow only to that point It was assumed that when water covered the injection points during a flow event, the additional hydraulic head resistance on all lines would produce a uniform flow from each injection point Results from a number of flow events indicated that the assumption was questionable. Whether this was a result of the flow splitter design or construction, or of the components and construction of the injection lines and points is not known. Considering the critical nature of equal flow from injection points, more work is necessary to test the efficiency of flow splitters at various hydraulic heads and to develop a better design as necessary.
Injection points, or nozzles, were anchored in the channel whenever possible, to eliminate wind drift, eliminate construction of an overhead suspension device, and also to improve mixing. Original injection lines consisted of Masterflex, size 16, C-FLEX tubing inside of 1/2-in. galvanized metal pipe. The lines were positioned horizontally in the channel about 1/2 to 1 ft above the normal low-water surface. This design resulted in broken or cracked joints and washed-out lines because of trash collecting on the lines. At several sites, water that entered the lines because of cracked joints froze during the winter and ruined the inside tubing.
12

Figure 8.--Stilling pipe, screened intake, mounting pipe, and crest-stage gage for site 1.
13
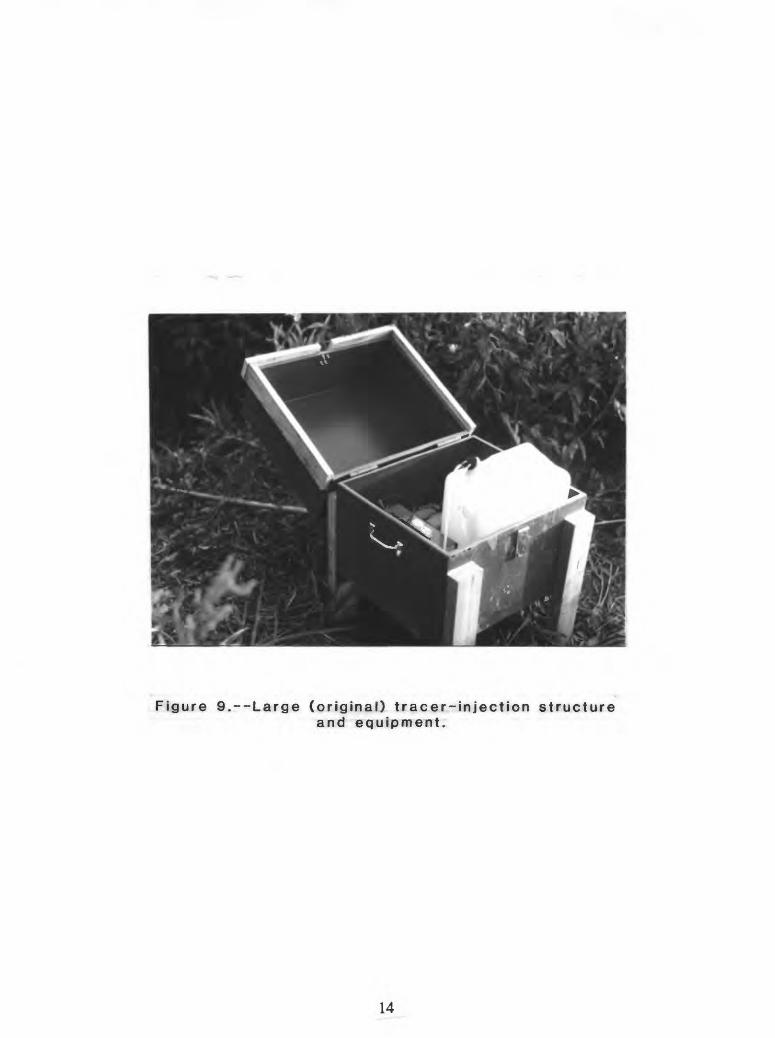
Figure 9.--Large (original) tracer-injection structureand equipment.
14

Fig
ure
10.-
-Sm
all
(revis
ed)
tracer-
inje
ction str
uctu
re
for
po
sitiv
e-d
isp
lace
me
nt
pu
mp
and
rela
ted
equip
ment.
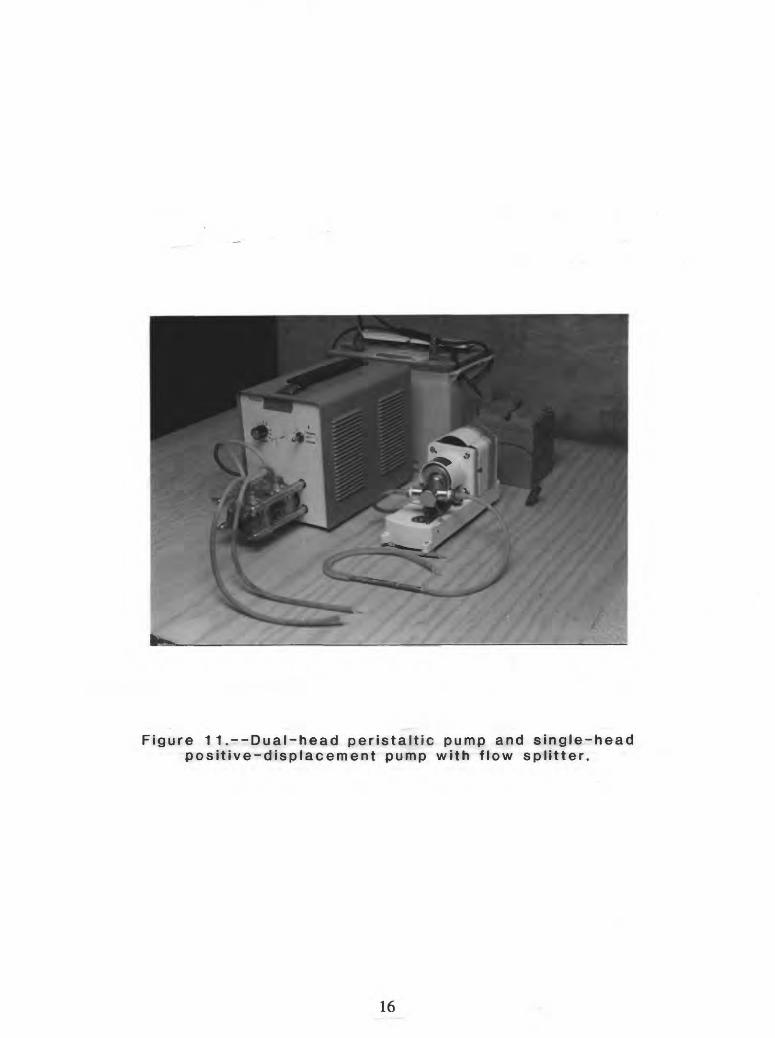
Figure 1 1 .--Dual-head peristaltic pump and single-head positive-displacement pump with flow splitter.
16

Re-designed injection lines consisted of C-FLEX tubing inside of 3/4-inch flexible plastic pipe, buried from injection box to channel bank, above normal low-water surface, and 1/2-in. galvanized metal pipe, from plastic pipe to injection nozzles. The metal pipe just fit inside the plastic pipe, and the two were held together by a metal clamp. In the channel, the lines were placed along the channel bottom with vertical risers for each injection nozzle. Each riser was secured to and protected by a fencepost on the upstream side (fig. 12). The riser-type injection lines withstood high flows well. Two such lines were left in-place during winter periods with no problems. Those lines were cleaned with alcohol and then pumped dry before the injection nozzle ends were taped shut for the winter. Splices in the C-FLEX tubing at the plastic-to-metal connection also were added to most of the new injection lines so that the entire metal part of the line, with tubing inside, could be easily removed for repair or winter storage.
Up to three injection points were installed with the above design. However, care was taken during assembly not to twist the tubing lines inside or to wrap them around each other. Several types of injection nozzles were used, but basically consisted of 1/4-in. OD (outside diameter) copper tubing through brass and galvanized metal adapter fittings (fig. 13). The C-FLEX tubing - 1/8-in. ID (inside diameter) ~ fit tightly over the copper tubing and a compression fitting held the copper tubing to the brass fitting. The brass fitting threaded into the galvanized metal fitting.
The dye-injection pumps worked against variable outlet heads during flow events (except site 8) because the dye-injection points were in the stream channel slightly above the normal low-water level. Pump tests to determine injection rates were done on site during low-water conditions when there was no outlet head. To determine what corrections, if any, to apply to the base pump rates determined in the field, both the Masterflex and FMI pumps were shop- tested for various head differences (inlet minus outlet head) and various pump settings. The results (fig. 14) indicate a decrease in pumping rate with increasing outlet head for nine out of the ten sets of tests. For the Masterflex pump tests, the average change in pump rale (rnL/min) per unit change in head difference (ft) was 0.18. For the FMI pump this factor was 0.20. The base injection rates, determined on site, were adjusted accordingly for the head difference of individual stream samples.
Additional tests indicated that pumping rates for the FMI pump also changed in relation to battery voltage (fig. 15). No adjustments were made to pumping rates based on voltage change for the following reasons: (1) battery capacity was matched to meet the requirements of the pump type and
total injection time, thus limiting voltage drop; (2) pump tests made before and after events, with the same battery, generally showed little change; and (3) there was no way to determine actual voltage at the time of the first and last sample. It was necessary to keep fully-charged batteries in service and perform pump tests during site visits.
Stream-Sampling Component
Existing small gage structures, with side-access doors, were used to house the sampling equipment at seven sites (fig. 16). When the supply of existing structures was depleted, a new structure was designed and built. Because two of the existing structures had been partially submerged by unexpectedly high water, the new structure was built with a large cap-like lid hinged to a shallow base so the air pocket under the lid would prevent damage to the working components and control box of the sampler.
Manning model S-4050 discrete samplers with 3/8- in. ID reinforced PVC tubing and standard polyethylene bottles were used in this study. They were limited to 40 ft of sample line and 25 ft of suction head. These samplers could collect up to 24 discrete samples and purge the sample line with both water and air before each sample. Purging takes about 1 minute between the start of the sample cycle and actual drawing of the sample. The samplers were triggered through the "FLOW" port in the sampler control box by a switch closure in the signal relay box via hard-wire connection or through a radio transmitter and receiver. The samplers could have been activated initially through the "FLOW" port and thereafter with their own timers, but to ensure coordination with the ADR this method was not used. External 12-VDC deep-cycle batteries (80 A-hr or greater) were used to provide an adequate power supply. Because of their design, any air leak in the sampler hinders its ability to draw a sample. The most frequent problem encountered was the pinch-tube solenoids sticking open or only partially closing. When this happened, the internal vacuum necessary to draw water up the sample line was lost and no sample was collected. The control unit, containing the trigger mechanism and other electronics, was another source of problems.
Sample-Analysis Component
A Turner Designs model 10 fluorometer was used with a rhodamine-WT accessory kit (10-041) containing the necessary lamps and filters for analysis of dye concentration in stream samples. It is both a laboratory and a field instrument that uses either 110 volts alternating-current or 12 VDC. It can analyze discrete samples, as in this study, or
17

Figure 12.--Riser-type injection line.
18
INJECTION
NOZZLES
Figure 1 3.--Dye-injection nozzles.

LJJ1-
2
LLILITERS PER N
2
LLJ1-
ccQL
Q_
1OU
160
140
120
100
80
60
40
20
0-^
i i i i i i i i
rj _ n Q Q10 0 u 0 ° u
so e o" ° ° °
eo e Q 0 o Q
4O o o Q 9 °
O PERISTALTIC PUMP TEST (MASTERFLEX - 2 HEADS)
10 »^ 9^ «?S *^ POSITIVE-DISPLACEMENT2 Q O ̂O *-* e ̂O PUMP TEST (FMI)
°* * 2 PUMP SETTING AND6 RELATION OF PUMP RATE
TO HEAD DIFFERENCE
~ 4 * * * 9
I I 1 I I I I I
4-20 2 4 6 8 10 12 V
HEAD DIFFERENCE (INLET-OUTLET). IN FEET
Figure 14. Relation of pump rates to head differences for peristaltic andpositive-displacement pumps.
20

ini-
65
cn 60LU Q.03CC LUt~i 55
LU
CC 0.2 Z) Q.
50
4511
A
D D
A PUMP RATE MEASUREMENT FOR +7.1 FOOT HEAD DIFFERENCE (INLET-OUTLET)
PUMP RATE MEASUREMENT FOR +2.2 FOOT HEAD DIFFERENCE (INLET-OUTLET)
D PUMP RATE MEASUREMENT FOR -2.8 FOOT HEAD DIFFERENCE (INLET-OUTLET)
_______________I__________________I__________________I
11.5 12
VOLTAGE, IN DC VOLTS
12.5 13
Figure 15. Relation of pump rates to direct-current voltage for the positive-displacement pump at a pump setting of 10.
21

Figure 16.--Stream sampler and sampling structure.
22
continuous flow. All samples for this study were analyzed at the District laboratory in Iowa City using procedures from Wilson, and others (1984).
Field Operations
On-the-job training and written instructions were given to field personnel who serviced the stations. Time for more formal training was not available. A number of opportunities to measure significant floods were lost because of misunderstandings or incomplete testing of the field systems. Because the procedures and equipment are new to many field personnel it is suggested that those who will operate this type of station in the future help install the equipment at the site, and be given some formal training.
System Preparation
After the equipment was installed and tested the sampling interval was selected The proper interval varies depending, to a great extent, on runoff characteristics of the basin and individual storms. At any one site, the correct interval for one storm may be too short or too long for another storm. Sampling intervals used in this study ranged from 5 to 15 minutes. Because the sampler was triggered by the ADR through the relay box, the interval was selected from those available for the ADR timer.
The calculation for the volume of dye (Vd) to be injected, which has a known concentration (Cd), was then made. The calculation was based on the total time of injection (T) and any limiting condition of maximum concentration in the stream (cmax). Maximum concentration occurs at the discharge related to base gage height, referred to here as trigger discharge (C^J. Trigger discharge was estimated even if no rating existed for a site. By the principle of continuity, the total dye injected equals the dye in the stream, or (Vd Cd) = (Q T c^) with no units conversion. There was no need to inject dye after the capacity of the sampler had been reached; therefore, the time of injection was set equal to the number of samples (n) times the sampling interval (t). The equation is then written in the following form.
For the specific conditions that existed for this study, the above equation simplifies to
(5)
whereVd = volume of rhodamine-WT dye as 20-percent
solution by weight (specific gravity of 1.19), inmL;
K = 1.713, which is a constant based on n = 24samples, c = 10 ng/L;
Cd = 2.38 x 10* M-g/L and units conversion; t = sampling interval (same as ADR punch cycle), in
minutes; and Q = trigger discharge, in ftVs.
The dye-injection rate was then determined. Injection of the dye in concentrated form presented several problems. The concentrated dye is viscous and could clog pump heads and lines if it dried. Pumping rates also would be low, and any fluctuation in a low pumping rate could have a large percent effect on the quantity of dye injected and on the final discharge computation. When the dye was diluted with distilled water, the dye mixture was less viscous, and the pumping rate had to be increased to keep the actual quantity of dye being injected the same. The faster the pumping rate, the less effect a small change in the rate would have on discharge computations. Therefore, the dye injection rate should be as fast as the size of the dye container and the sampling interval will allow. However, the total amount of dye plus water should not exceed 80 percent capacity of the dye container so the dye and water can be adequately mixed The pumping rate was estimated, based on the container size and pump being used Then the pump was set and the exact injection rate determined from a pumping test The volume of dye/water mix (Vdw) then was determined from the following equation
(6)
whereVdw = volume of dye/water mix, in mL; q = injection rate of dye/water mix in mL; and n = 24, the number of samples taken.
Vd = (4)
23

The volumes of dye and water were not precisely measured in the field. Rather, a volume of dye approximately equal to that computed was poured into the dye container and then, using the approximate scale on the dye container, water was added until the volume of dye/water mix equaled that computed The solution was thoroughly mixed and a sample collected The approximate dilution (Dj = VyVdw) was recorded on the bottle for later use. The precise value of Dj was determined later as described in the Discharge Computation section.
Site Servicing
Routine servicing depended on whether the system had been triggered or not During any inspection the sampler always was serviced before the injection pump to avoid contamination of sample bottles with dye. An explanation of how equipment was serviced and an example field form (fig. 17) are in the Supplemental Information section (Checklist of instructions and field form) at the back of this report.
Laboratory Operations
Sample Analysis
Samples were sent to the District laboratory in Iowa City as soon as possible after they were collected. The sample of dye injection mixture corresponding to the stream samples was precisely diluted three more times in the laboratory (D2, D3, D4) to within the expected range of stream sample concentrations. The fiuorometer was calibrated with standards prepared from the concentrated dye (20-percent solution), and readings were taken for all samples. The readings were adjusted to read as dye concentration based on the known standards, and then the background concentrations of fluorescence were subtracted from the stream sample concentrations. These final concentrations (C4 - injection mixture, and c - stream samples) and the laboratory dilution factors were used directly in the computations of discharge.
Q = 5.89xl<r7 - 2 -* (7)SG
whereC4 = dye concentration, from fluorometer reading,
of the dye/water mixture after four dilutions, D j - done in the field, and D2, D3, D4 - done in the laboratory;
c = dye concentration, from fluorometer readings, of the stream samples (adjusted fluorometer reading minus background fluorescence);
SGj = specific gravity of the dye/water mixture (from equation 10) after the first dilution, Dlt which represents the injection mixture of concentration Cj and is computed from equation 9; and
Dj, D2, D3, D4 = dilutions for each step, 1,2,3, and 4 of a serial dilution.
The specific gravity, SGj, usually will be close to 1.00 depending on the quantity of the first dilution. It can be estimated from the approximate values of Vd and Vdw marked on the original dye injection mix sample bottle as follows
(SGdVd) + (SGwVw)
dw(8)
whereSGd = specific gravity of dye solution, which is 1.19
for rhodamine-WT 20 percent by weight;Vd = volume of dye solution, in mL;SGW = specific gravity of water, which is 1.00;Vw = volume of water, in mL; andVdw = volume of dye/water mixture (Vd + Vw), in
mL.
For computation of equation 7, more precise determinations of Dj and SGj were made using the equations shown below.
Discharge Computation
Equation 1 has been rewritten by Kilpatrick and Cobb (1985, eq. 11) so that discharge can be computed directly in terms of the fluorometer readings and laboratory dilution factors. A similar equation with actual concentrations in place of direct fluorometer readings was used to compute discharge for this study. It is shown below.
(9)
and
SGl = (10)
24

A laboratory form (fig. 18) for recording fluorometer readings and making discharge computations was developed and is shown in Supplemental Information section (Laboratory form) at the back of this report
SITE STUDIES: DESCRIPTIONS, RATINGS, AND STREAMFLOW
HYDROGRAPHS
Discharge data were collected for 14 flows at 6 of the 8 stations during the 3-year study, although not all were considered usable. With the aid of ATD measurements, rating curves were completed at sites 1 and 3, and partially completed at site 4. Sites 2,7, and 8, each with one set of discharge data, showed problems apparently because of incomplete mixing and dye loss to sediment No discharge data were collected during two high flows at site 5, and no flows above trigger discharge occurred at site 6 during the time that ATD equipment was installed.
Stage hydrograph data were collected on 38 flows at 7 of the 8 stations. Several of these flows were only high enough to trigger (he ATD system before receding. Discharge hydrographs were developed for stations with completed ratings. Rating curves and hydrographs are discussed for each of the stations described below.
Silver Creek at Welton - Site 1
The basin drains a 9.03 mi2 area of the Southern Iowa Drift Plain that is steeply to slightly rolling with total relief of about 180 ft It is about a 1.5 hour drive from the Iowa City office. There are no other gaging stations in the area. The station was established in 1965, and by 1986, a good peak gage-height record had been obtained. However, no stage-discharge rating was ever established, since only one low-flow and one high-flow discharge measurement were made during that time. Medium-flow measurements were needed to complete the rating.
The stage-recording structure was mounted alongside the existing CSG on the downstream side of the U.S. Highway 61 bridge. Because of low banks upstream and another bridge 800 ft downstream, it was decided to place the tracer-injection structure at the U.S. Highway 61 bridge and the stream-sampling structure at the downstream bridge. Access to both structures was easy, but, because discharge and gage-height data were collected at different locations, time of travel between the two locations had to be accounted for when matching gage heights to each of the stream samples. The injection system originally consisted of a dual- head pump and dual, in-line nozzles. The sampler was
triggered by a radio signal and the injection pump was triggered by a wire connection. The radio trigger worked well despite vegetation between transmitter and receiver. Results obtained at this station illustrate the potential of the ATD method for measuring discharge.
A medium-flow event triggered the ATD equipment shortly after it was installed in June 1986; however, those samples were contaminated by a large flood in July before the station was serviced. A contracted-opening measurement was made for the flood at the bridge downstream of the CSG. Another set of samples was obtained from a bankfull flow in September 1986. The ATD measurements defined a loop rating (fig. 19). The discharge and gage-height hydrographs (fig. 19), illustrate how the discharge peak preceded the gage-height peak for this flood. The rate of change in stage, which apparently caused the loop rating, varied from 44.0 ft/hr (feet per hour) on the rise to -2.2 fl/hr on the recession. Using the gage-height hydrograph and the AQ/J procedure described by Kennedy (1984, p. 26-37), the ATD measurements were adjusted for the rate of change in stage as shown.
The contracted-opening measurement and adjusted ATD measurements for 1986 are plotted on the rating diagram in figure 20, and indicate a shift to the left from the contracted-opening measurement made in 1971. A 1987 step-backwater analysis plots well in relation to the ATD measurements and, to a lesser extent, the 1986 indirect measurement Channel cross-section data from the step- backwater analysis indicated that the downstream channel had filled considerably since 1971, thus confirming the rating shift Two final ratings were developed Rating 2 was based on measurements made since 1986 and the shape of the step- backwater analysis. Rating 1 was developed from one low- flow and one high-flow measurement and the shape of Rating 2.
After ratings were established, the equipment was left at this site to study the loop rating at lower gage heights. The base gage height and trigger discharge were reduced by lowering the stilling pipe. The dual-head pump was replaced by a single-head pump and the dual-point horizontal injection line has been replaced by a single-nozzle, riser-type line.
East Branch Iowa River Above Havfleld - Site 2
The drainage basin for this station is 2.23 mi2 and is in the DesMoines Lobe landform region. The topography is flat with poor natural drainage. Total relief is about 50 ft and the channel has been dredged upstream and downstream
25
ME
AS
UR
EM
EN
TS
AN
D R
AT
ING
K)
ON
UJ
LLJ
U_
O o CD CO X
CD
UJ I LU
AU
TO
MA
TIC
TR
AC
ER
-DIL
UT
ION
M
EA
SU
RE
ME
NT
O
ME
AS
UR
EM
EN
T A
DJU
ST
ED
FO
R
RA
TE
OF
CH
AN
GE
IN
ST
AG
E
CO
NS
TA
NT
-ST
AG
E R
AT
ING
200
300
400
500
DIS
CH
AR
GE
, IN
CU
BIC
FE
ET
PE
R S
EC
ON
D
600
Q O
O LU LU
Q_ & LU CO z>
o
600
HY
DR
OG
RA
PH
S
500
400
300
LJJ
O cc
200
100
»
Gag
e he
ight
Dis
char
ge
\ (fr
om u
nadj
uste
d \
mea
sure
men
ts)
_L20
0021
00
2200
24-H
OU
R T
IME
o
q
o
oo LU I LU
r-
®5
<
O
2300
Fig
ure
19. A
uto
matic tr
acer-
dilu
tion
me
asu
rem
en
ts,
ratin
g,
and
hyd
rogra
phs
for
flow
o
f S
epte
mber
24,
1986,
at
Silv
er
Cre
ek
at
We
lton
, Io
wa (s
ite
1).

30
to
LU
LU O
p O n:
g LU IE LU O < O
10 0.2
\ S
ept
2 19
72
O
AU
TO
MA
TIC
TR
AC
ER
-DIL
UT
ION
ME
AS
UR
EM
EN
T -
SE
PT
24,
198
6 (a
djus
ted
for
rate
of c
hang
e In
sta
ge)
.
CU
RR
EN
T-M
ET
ER
ME
AS
UR
EM
EN
T
4
CO
NT
RA
CT
ED
-OP
EN
ING
ME
AS
UR
EM
EN
T
-X
ST
EP
-BA
CK
WA
TE
R A
NA
LYS
IS -
19
87
1010
0 1,
000
DIS
CH
AR
GE
, IN
CU
BIC
FE
ET
PE
R S
EC
ON
D
8,00
0
Fig
ure
20. C
om
parison
of
auto
matic tr
ace
r-d
ilutio
n m
easu
rem
ents
w
ith ra
ting cu
rve
fo
r S
ilver
Cre
ek
at
We
lton
, Io
wa (s
ite
1).
from the gage. Travel time from the Fort Dodge field office is about 1.5 hours. The station originally was established in 1952, and was re-established in 1971 after the bridge was replaced with a 9-ft CMP (corrugated metal pipe) culvert. Since 1971 only four low-flow current-meter measurements have been made. A stage-discharge rating is difficult to establish because of backwater from vegetation in the channel during the growing season. The bottom of the culvert has filled in about 125 ft, to a level that is even with the channel bottom.
The stage-recording box was installed on an abandoned CSG pipe at the downstream end of the culvert. The tracer-injection component included the structure on the upstream road embankment, a single-head pump with flow splitter, and a dual-riser injection line at the upstream end of the culvert. Mixing distance was approximately 70 ft The sampler was installed on the downstream embankment near the stage recorder. All connections to the signal system were hard-wired, with the tracer-injection signal wire going through the culvert.
After equipment was installed in July 1986, four flows were recorded. Three of the flows occurred in fairly quick succession during September and October 1986. The site was not serviced until after the third flow, and only one set of samples was obtained. The fourth flow was recorded the following spring before the injection and sampling equipment were reinstalled. No flows above the base gage height have occurred since that time.
Samples were collected and discharges computed, but the results are questionable. The first few measurements plotted reasonably well on the rating diagram, but the remaining measurements are scattered and generally plot on a flatter slope than expected. According to calculations, the mixing distance was adequate, although only 70 feet An unequal split from the injection nozzles could be a cause of inadequate mixing and the questionable results.
The stage-recording structure was mounted on a bridge abutment, near the existing CSG, with an intake to the stilling pipe. The tracer-injection structure and line were about 300 ft upstream, just downstream from an old highway and bridge, which made servicing easy. The original dual- point, horizontal injection line was washed out and the dual- head pump ruined by a flood during 1986. A second injection system consisted of a single-head pump with flow splitter and a dual-riser line. The stream-sampling structure was next to the bridge wingwall near the CSG. Both the dye injection pump and water sampler were hard-wired for signaling.
Some favorable results were obtained at this site using the ATD method Three sets of measurements were made during 1986 and 1987 and are shown on the rating diagram in figure 21. Only the first part of the large flood of June and July 1986 (fig. 22) was sampled before sampler capacity was depleted because of the slow rise. However, the slow rise enabled field personnel to make current-meter measurements on the peak and recession of the flood. All of these measurements (fig. 21) were used to define rating 2. Rating 1 was extended upward on the basis of the new rating.
In July and August 1987 two more sets of ATD samples were obtained using a single-head pump and flow splitter. The results are not as favorable. As a whole, the July ATD measurements agree with two current-meter measurements made in August, and all of these measurements together define a shift rating between Ratings 1 and 2. However, the ATD measurements are somewhat scattered on the plot Measurements made during the flow in August 1987 (fig. 22) follow the proper slope, but plot to the left of the current-meter measurements made the following day (fig. 21). Mixing distance was the same for all ATD measurements and was adequate for the June 1986 ATD measurements with the dual-head pump. For the 1987 ATD measurements, however, mixing appears inadequate. If the flow splitter was not dividing the flow properly, this would have the effect of increasing the required mixing distance.
West Beaver Creek at Grand Junction - Site 3
The drainage basin of this station is 12.6 mi2 and is in the Des Moines Lobe landform region. The upper one-half of the basin drains a hilly area of moderate relief (about 100 ft), although channel slopes are not steep. The lower one-half of the basin generally is much flatter and has low relief (about 40 ft) and flat channel slopes. It is less than a 1- hour drive from the Fort Dodge field office. A CSG was installed at this station in 1966. When this study began, the rating was old and not defined for high gage heights.
Middle Raccoon River Tributary at Carroll - Site 4
This basin drains a 6.58 mi2 area near the border between the Southern Iowa Drift Plain and the Des Moines Lobe landform regions. The basin generally is hilly with total relief of more than 200 ft, but the valley is wide and the channel slope mild upstream and downstream from the gage. The channel is uniform with steep banks and appears to have been straightened A CSG was installed at this site in 1966 and operated until 1978 when the bridge was replaced. The CSG was re-installed in 1979. From then until the beginning
28

to
LU
LU O Cvj
CO o LU X
LU o
< o
15 10 0.4
June
8 19
67 \
O
AU
TO
MA
TIC
TR
AC
ER
-DIL
UT
ION
ME
AS
UR
EM
EN
T -
JUN
E 2
9, 1
986
D
AU
TO
MA
TIC
TR
AC
ER
-DIL
UT
ION
ME
AS
UR
EM
EN
T -
JULY
13,
198
7
O
AU
TO
MA
TIC
TR
AC
ER
-DIL
UT
ION
ME
AS
UR
EM
EN
T -
AU
G 2
5, 1
987
CU
RR
EN
T-M
ET
ER
ME
AS
UR
EM
EN
T
1010
0
DIS
CH
AR
GE
, IN
CU
BIC
FE
ET
PE
R S
EC
ON
D
1,00
0
Fig
ure
2
1.
Co
mp
ariso
n
of
auto
matic
tr
ace
r-d
ilutio
n
me
asu
rem
en
ts w
ith ra
ting cu
rves
for
West
B
ea
ver
Cre
ek
at
Gra
nd Ju
nct
ion
, Io
wa (s
ite
3).

LLJ
6LU O q CM
00 O LU
X
LU
24
00
1
20
0
24
00
1
20
0
24
00
JUN
E 2
9, 1
986
JUN
E 3
0, 1
986
24
00
12
00
24
00
12
00
24
00
1
20
0
24
00
AU
GU
ST
25,
198
7 A
UG
US
T 2
6, 1
987
AU
GU
ST
27,
198
7
24
-HO
UR
TIM
E
Fig
ure
2
2.-
-Se
lecte
d
ga
ge
-he
igh
t hydro
gra
phs
for
West
Be
ave
r C
reek
at
Gra
nd
Ju
nctio
n,
Iow
a (s
ite
3).

of this study, only three fairly tow current-meter measurements were made, despite repeated attempts to make medium- and high-flow measurements.
The stage-recording structure was mounted onto the existing CSG pipe on the left downstream bridge pier. The tracer-injection structure was installed at the top of the left bank about 500 ft upstream from the CSG, and the stream-sampling structure was near the left downstream end of the bridge. Originally, the signal component was completely hard-wired, and the tracer-injection component consisted of a dual-head pump with dual in-line nozzles. The pump was destroyed by high water in June 1986 and was replaced with a single-head pump and flow splitter. After several events with only fair results and repeated wire breakages, a single-riser injection line and a radio signal device for the injection component were installed in July 1988. A solar panel also was installed at that time to prevent battery drain from the radio receiver and to eliminate battery switching.
Few usable ATD discharge measurements were made at this station, although a substantial number of flows occurred and were recorded by the ADR. Two sets of samples were obtained in June 1986 with the dual-head pump. The first set showed a considerable loss of dye, possibly to sediment, as the samples were not decanted but remixed when the station was serviced The second set was ruined, along with the sampler and injection pump, during the large flood of June 29, 1986. A contracted-opening measurement was made of that flood and is shown on the rating diagram in figure 23 with the usable ATD measurements made after that time. All ATD measurements shown are for the single-head pump and flow splitter. The August 12, 1987, ATD measurements are scattered and considered marginal. However, they do show the expected bend in the rating when flow exceeds bankfull. The ATD measurements of August 16 and 25,1987, and June 8,1988, follow the slope of the rating and generally plot within the range of the current-meter measurements made. Equipment malfunctions and operational errors prevented measurements at higher gage heights. False triggering of the radio receiver, resulting in loss of injection solution during low flows, may have been a problem as well.
During the project, 16 separate flows above base gage height were recorded by the ADR. The peaks are fairly well distributed between the base gage-height of about 17 ft and the maximum flood peak of about 25 ft Gage-height hydrographs for the flows with ATD measurements, discussed above, are shown in figure 24.
South Otter Creek Tributary near Woodburn - Site 5
This basin drains a 0.71 mi2 upland plateau area of the Southern Iowa Drift Plain. Channel slope is steep and basin relief is about 80 ft. It is about a 2.5 hour drive from the Iowa City office. The station originally was established in 1953 with the CSG located on a timber and pile bridge. An excellent gage height record was obtained until 1985 when the bridge was replaced with a 9-ft CMP culvert Only two tow-flow current-meter measurements and one high-flow indirect measurement were made before 1986, and the rating was never defined
A wooden platform was built on top of the downstream end of the culvert to mount the stage-recording and stream-sampling structures. The channel upstream from the culvert did not provide a particularly good mixing reach (non-uniform channel) and was in an area heavily used by cattle. Therefore, the tracer-injection structure was placed on the upstream embankment with a riser-type injection line anchored at the upstream end of the culvert. To compensate for the high velocities expected through the 70 ft culvert, a three-point injection line and three-way flow splitter were constructed. Spacing between the injection points was based on the culvert flowing one-half full. Hard-wiring was used to make all signal connections.
Stage hydrographs were recorded for two flows since equipment was installed in June 1987, but no ATD measurements were made for either flood A loose section of tubing jammed the dye injection pump during a June 1987 flood and no dye was injected; however, the samples collected were useful in the study of background fluorescence discussed earlier. The sampler malfunctioned during a flow in August 1987. No flows above the base gage height have occurred since that time. Indirect culvert measurements were made on both of the above-mentioned flows, and a September 1986 flood No rating for present conditions has yet been developed.
South Fox Creek near West Grove - Site 6
This station has a drainage area of 12.2 mi2 in the Southern Iowa Drift Plain landform region. The topography is hilly throughout and total basin relief is about 140 ft Driving time from the Iowa City office is about 2.5 hours. One low-flow and one high-flow measurement have been made at this station since it was established in 1966.
31

20
OJ
LU
LU O O IT)
X
O LLJI LJL
J O
<
O
10 0.5
<
J
/ !\ J
uly
23 |
vter1
919
82
' <S
^
1979
\ A fr \
\ ^ \Ai 1^ 6 jg
2<9
87
?' 3
Al 1
s Tjg 98 s X
13 R \
\ _jS
^O
yS
U
^\J
un
e
198
A^'
16
4
A
/ D
/
O
f
o
f
c
4
c^A
i
_**-
\*
\
"i^*
* \
& ME Prt
Hir
June
19
- ~~
~
nina
ry r
atin
g 1
(29 \ __
-
AU
TO
MA
TIC
TR
AC
ER
-DIL
UT
ION
ME
AS
UR
EM
EN
T -
AU
G 1
2,
AU
TO
MA
TIC
TR
AC
ER
-DIL
UT
ION
ME
AS
UR
EM
EN
T -
AU
G 1
6,
AU
TO
MA
TIC
TR
AC
ER
-DIL
UT
ION
ME
AS
UR
EM
EN
T-
AU
G 2
5,
AU
TO
MA
TIC
TR
AC
ER
-DIL
UT
ION
ME
AS
UR
EM
EN
T -
JU
NE
8,
JUR
RE
NT
-ME
TE
R M
EA
SU
RE
ME
NT
CO
NT
RA
CT
ED
-OP
EN
ING
ME
AS
UR
EM
EN
T
^^
^ w 19
87
1987
1QP
7
i yoo
1010
0
DIS
CH
AR
GE
, IN
CU
BIC
FE
ET
PE
R S
EC
ON
D
1,00
05
,00
0
Fig
ure
23. C
om
parison
of
au
tom
atic
tr
ace
r-d
ilutio
n m
ea
sure
me
nts
w
ith pre
limin
ary
ra
ting
curv
e fo
rM
idd
le
Ra
cco
on
R
ive
r tr
ibu
tary
a
t C
arr
oll,
Io
wa (s
ite 4
).
^^
, ft'«
a
10
OJ
OJ
LU
LU
6o"
o to LU I
4LU
O
< O
1800
21
00
2400
09
00
1200
15
00
1500
18
00
2100
AU
GU
ST
12,
198
7 A
UG
US
T 1
6,1
987
AU
GU
ST
25,
198
7
24-H
OU
R T
IME
2400
03
00
0600
09
00
JUN
ES
, 19
88
Fig
ure
24. S
ele
cte
d
gage-h
eig
ht
hydro
gra
phs
for
Mid
dle
R
accoon
Riv
er
trib
uta
ry
at
Carr
oll,
Iow
a (s
ite
4),
The stage-recording structure was mounted next to the existing CSG on the downstream bridge wingwall. The tracer-injection structure was about 350 ft upstream with a dual-head pump and dual-riser injection line. The stream- sampling structure was on the road embankment near the CSG. A radio-signal device was installed for the injection component, and a hard-wire connection was made to the sampler. A solar panel was also installed at the injection site. Installation of equipment did not begin until 1987. Since that time, drought conditions have prevailed and no flows above the base gage height have occurred.
Perry Creek near Hinton - Site 7
The basin drains an area of the Southern Iowa Drift Plain, and possibly parts of the Western Loess Hills and the Northwest Iowa Plains. It is hilly throughout, with a total relief of about 280 ft. The drainage area is 30.8 mi2, the largest of the basins in this study. The channel is deep with steep banks and most flows are contained within the channel. It is about a 2-hour drive from the Council Bluffs office. The CSG was moved to this site during 1974 from a bridge 1 mile upstream, where the gage had been operated since 1952. Before this study, no measurements had been made, although a good record of peak gage heights had been obtained.
The stage-recording structure was mounted on top of the existing CSG pipe on the downstream side of the timber and pile bridge. Installation of the tracer-injection structure and the dual riser-type line was made about 250 ft upstream. A single-head peristaltic pump with flow splitter was used to inject the dye. The stream-sampling structure was located in the right, downstream road ditch with the sample line anchored near the right edge of the channel. A log and debris jam at the upstream side of the bridge was expected to aid in the mixing process. All equipment from the signal component was hard-wired. Installation was completed in late summer 1986.
One high flow and several medium flows occurred at this station during the study. An entire set of samples was collected on September 19,1986, on a medium flow, so no samples were collected when a high flow occurred the following day. The hard-wire connections to the sampler and the injection pump had broken before a small rise in the spring of 1987. The discharges computed for September 1986 are shown on the rating diagram in figure 25. Generally, they follow the slope but plot to the left of the preliminary rating based on a step-backwater analysis. This indicates excessive dye in the samples for the discharges being measured Probable reasons are an inadequate mixing distance, unequal flow from the dual injection nozzles, or both. Gage heights were recorded by the ADR for all flows.
Willow Creek near Soldier - Site 8
This station is near the edge of the Western Loess Hills but drainage is mostly from the Southern Iowa Drift Plain. The 29.1 mi2 basin is hilly with about 270 ft of total relief. Most flows are contained within the deep channel. Bank erosion and gullying are common, and sediment loads are high during flow events. The gage is a 1-hour drive from the Council Bluffs field office. No measurements were made from 1966, when the CSG was installed, until the beginning of this study. One low-flow, current-meter measurement, one high-flow, contracted-opening measurement, and an abbreviated step-backwater analysis were made during the study.
Because the channel has filled at the CSG, the stage-recording structure was mounted on the left downstream H-piling of the bridge, on the opposite bank from the CSG. An intake was used so the bottom of the stilling pipe could be as low as possible. The tracer-injection structure was installed about 250 ft upstream on the right bank. A dual-point injection line was suspended over the channel from a rope tied between two trees. It was the only such installation made during the study. The injection pump had two heads. The stream-sampling structure was located on top of the left bank, just downstream from the bridge with a sample line anchored in the flow area about 10 ft from the left bank. Hard-wire connections were made to the injection and sampling components from the signal component
Flows were recorded at this station during July and August 1987. Discharge samples were not collected during the series of flows in July because the sample line was plugged by mud The last flow of July was the largest on record, and a contracted-opening discharge measurement was made to document it The measurement was made at an old road crossing about 100 ft downstream of the present bridge. Samples were collected in August on the rise and recession of a flow. The results are similar to the loop rating shown for site 1 (fig. 19) except that they plot well to the right of the estimated rating (fig. 26), which is based on the July indirect and the shape of the step-backwater rating. Although inadequate mixing might be a problem, it may not be the primary cause of the offset The dye was injected with a dual- head pump, so flow should have been equally divided between the nozzles, and mixing distance was adequate according to computations. However, sediment loads are high in this area of Iowa, and the gage was not serviced for several weeks after the samples were collected. It is thought that dye was lost to high concentrations of sediment in the water before the site was serviced, and if this was the case, the dye loss was about 75 percent Wind drift of dye from the suspended injection line also could have been a source of dye loss.
34
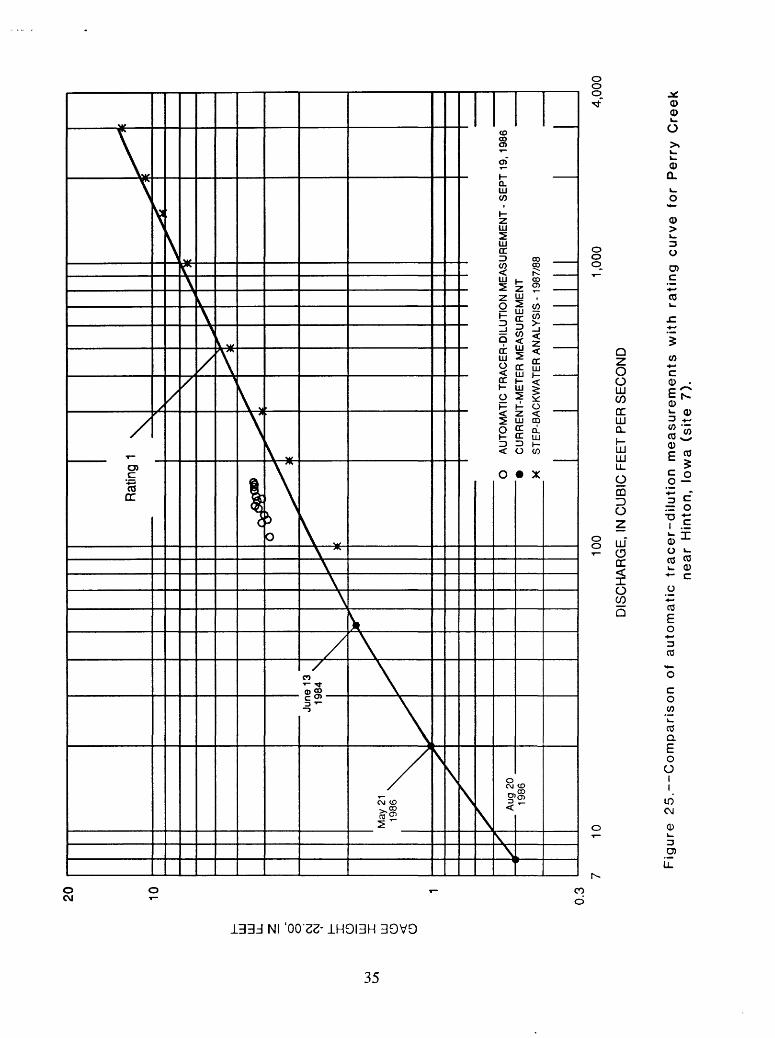
2U 10
K
LLJ
LU
UL
Z o"
o C\j
C\J I'
ll: LTJ 1 LLJ
O o
1
n o
< ^
X
May
21
1986
\
Sjr
/
/
Aug
20
1986
Jun 15
X
013
)84 \ /\ X
XX
X
)
Ratin
g
x^ai
s) ^^x
X"
^
o X
1 \^
4̂>
r
i
v
\\ .
^
^ f
\ X^)
_^
^^
f
X^
X*5
^X
3_x?^
^X
"
t
^^ k
AU
TO
MA
TIC
TR
AC
ER
-DIL
UT
ION
ME
AS
UR
EM
EN
T -
SE
PT
19,
198
6
CU
RR
EN
T-M
ET
ER
ME
AS
UR
EM
EN
T
ST
EP
-BA
CK
WA
TE
R A
NA
LYS
IS -
1987
/88
7 10
100
DIS
CH
AR
GE
, IN
CU
BIC
FE
ET
PE
R S
EC
ON
D
1,00
04
,00
0
Fig
ure
2
5.
Co
mp
ariso
n
of
au
tom
atic tr
ace
r-d
ilutio
n m
ea
sure
me
nts
w
ith
ra
ting
curv
e
for
Pe
rry
Cre
ek
ne
ar
Hin
ton
, Io
wa
(s
ite
7).

50
OJ
0\
LU
LU O o Csi
CO I g LU
X
LU
O
<
O
10 0.5
«*> \
^
^ \ \ J
uly
31 -
1986
/^
/S
App
roxi
mat
e ra
ting
«
/s
rflffs
s
^s^
^
J\\
^**
^
9
O X
\ ,.
^
)*-*^
J
^
t
^-
** * \.^
,[
Jul
y 12
19
87
***^
\
i
dO
<->
D
\ »*
"
3£ >
9
AU
TO
MA
TIC
TR
AC
ER
-DIL
UT
ION
ME
AS
UR
EM
EN
T -
AU
G 8
,
CU
RR
EN
T-M
ET
ER
ME
AS
UR
EM
EN
T
CO
NT
RA
CT
ED
-OP
EN
ING
ME
AS
UR
EM
EN
T
ST
EP
-BA
CK
WA
TE
R A
NA
LYS
IS -
198
7
V J*"1 )
1 1987
t K>
(
ff
1010
0 1,
000
DIS
CH
AR
GE
, IN
CU
BIC
FE
ET
PE
R S
EC
ON
D
7,00
0
Fig
ure
2
6.-
-Co
mp
ariso
n
of
au
tom
atic tr
ace
r-d
ilu
tio
n m
easure
ments
w
ith estim
ate
d ra
tin
g
cu
rve
for
Will
ow
C
reek
ne
ar
So
ldie
r,
Iow
a (s
ite 8
).

SUMMARY AND CONCLUSIONS
A system was developed to automatically and concurrently measure streamflow stage and discharge. A tracer-dilution method, with a fluorescent dye as the tracer, was used to measure discharge. The system was installed at eight crest-stage gage stations in Iowa using a variety of equipment. Although the quality of the results varied, they demonstrate the potential for use of this type of automatic streamgaging. Possible factors and conditions affecting performance were identified and improvements are being incorporated into the site installations. Automatic tracer- dilution (ATD) measurements were made at 6 of 8 stations during 14 flow events; however, not all the measurcments were usable. One preliminary and two final ratings were developed with the aid of ATD measurements. Stage hydrograph data, above abase gage-height, were collected on 38 flow events at seven of the eight stations. Limited information on background fluorescence during high flows was also obtained. Systems were not operated when temperatures fell below freezing.
The most serious problem seems to have been the unequal splitting of flow from a single-head pump for multiple-point injection of the dye. A redesign of the splitter, or some other part of the injection line, is needed. Until this is done, the following procedure will be followed: (1) use single-point dye injection where possible, which also eliminates injection-point spacing problems; (2) use dual- head pumps where dual-point injection is required; and (3) where possible, sample with a manifold line to get a representative sample, even if mixing is inadequate (station 2 and possibly station 5 are likely candidates).
Samplers need to be checked and serviced routinely, whether they have been activated or not Many samples were never collected, especially at site 4, because of sampler malfunction. Solenoids that work in the shop may begin to stick after a few weeks in the field. Plastic fittings are easily cracked, causing air leaks that inhibit sampler performance. It is best to have several spare samplers that can be quickly placed into service so that repair work can be done in the shop instead of the field.
The radio trigger device worked well when triggering a sampler, but not as well for triggering an injection pump because of the required time delay. More work should be done to improve the reliability and length of the time delay. Where dye injection signal distances are long and sampling intervals are short, the radio device is considered a good alternative. For short signal distances to the dye injection system, hard-wiring can be used with some type of protective conduit
During the last year of the project, solar panels were installed at a few locations. The panels insure an adequate power supply and eliminate the need to carry a battery to a remote location.
An in-line filter system would have reduced or eliminated dye losses to sediment The possible locations of a pressurized filter in the Manning sampler were limited, however, and the problem has not been solved. Because of the water purge cycle, it could not be located between the sampler and stream. It could not be located between the sampler and bottles because of gravity flow between them. Any filter would require a large capacity to handle 24 samples and still allow the necessary flow of air for the sampler to operate properly. Until some type of filter is developed, it is important to service the ATD stations promptly after a flood, decant only clear water, and analyze the samples in a reasonable amount of time.
After a flow, it is important to always service the sampler before servicing the dye injection site. The dye is concentrated and even a small amount can contaminate a stream sample. While handling and sampling the dye mixture, it is best to use disposable gloves - usually two layers. This helps to eliminate the direct contamination problem and decreases the spread of dye to other equipment where it could be picked up again. It also is advisable to sample the dye injection mixture before and after a flow event This serves as a check on whether the dye mix has lost any of its fluorescence during storage in the field.
37

SELECTED REFERENCES
Bodhaine, G. L., 1968, Measurement of peak discharge at culverts by indirect methods: U.S. Geological Survey Techniques of Water-Resources Investigations Report, Book 3, chapter A3,60 p.
Dalrymple, Tate, and Benson, M. A., 1967, Measurement of peak discharge by the slope-area method: U.S. Geological Survey Techniques of Water- Resources Investigations Report, Book 3, chapter A2,12p.
Duerk, M. D., 1983, Automatic dilution gaging of rapidly varying flow: U.S. Geological Survey Water Resources Investigations Report 83-4088,17 p.
Fischer, H. B., and others, 1979, Mixing in inland and coastal waters: New York, Academic Press, Inc., 483 p.
Hulsing, Harry, 1967, Measurement of peak discharge at dams by indirect methods: U.S. Geological Survey Techniques of Water-Resources Investigations Report, Book 3, chapter A5,29 p.
Interagency Advisory Committee on Water Data, 1982, Guidelines for determining flood flow frequency (2nd ed, revised): Reston Va., U.S. Geological Survey, Office of Water Data Coordination, Hydrology Subcommittee Bulletin 17B, appendices 1-14,28 p.
Kennedy, E. J., 1984, Discharge ratings at gaging stations: U.S. Geological Survey Techniques of Water- Resources Investigations Report, Book 3, chapter A10,59p.
Kilpatrick, Frederick A., Cobb, Ernest D., 1985, Measurement of discharge using tracers: U.S. Geological Survey Techniques of Water- Resources Investigations Report, Book 3, chapter A16,52p.
Kilpatrick, F. A., Kaerhrle, W. R., Hardee, Jack, Cordes, E. H., and Landers, M. N, 1985, Development and testing of highway storm-sewer flow measurements and recording system: U.S. Geological Survey Water-Resources Investigations Report 854111,98 p.
Matthai, H. F., 1967, Measurement of peak discharge at width contractions: U.S. Geological Survey Techniques of Water-Resources Investigations Report, Book 3, Chapter A4,44 p.
Prior, Jean C, 1976, A regional guide to Iowa landforms: Iowa Geological Survey Educational Series 3,72 p.
Rantz, S. E., and others, 1982, Measurement and computation of streamflow, v. 1: U.S. Geological Survey Water-Supply Paper 2175,284 p.
Wilson, J. F., Jr., Cobb, E. D., and Kilpatrick, F. A., 1984, Fluorometric procedures for dye tracing, U.S. Geological Survey Open-File Report 84-234,53 p.
Yotsukura, N., and Cobb, E. D., 1972, Transverse diffusion of solutes in natural streams: U.S. Geological Survey Professional Paper 582-C, 19 p.
38

SUPPLEMENTAL INFORMATION
39

Operation of the Relay System
A schematic diagram of the signal-system relay box is shown in figure 5. The operation of the relays are described below.
Terminal 1 - always "hot". Power comes directly from battery (+) and goes to stage switch (COM), and to both switches (COM) of the DPDT relay.
Terminal 2 - "hot" whenever stream is above base GH. Power comes from stage switch (NC) and goes to injection pump relay coil or radio transmitter (+), DPDT relay coil (through blocking diode) and SPST-1 relay switch. The first time the DPDT relay coil is energized from terminal 2, the relay is "locked" into that mode by power from terminal 1 through one of the NO switches of the DPDT relay. Simultaneously, power is locked to terminal 3 through the other NO switch.
Terminal 3 - once system triggered, always "hot". Power comes from one of the "locked" NO switches of the DPDT relay and goes to ADR timer.
Terminal 4 - once system triggered, "hot" during ADR punch cycle. Power comes from ADR micro switch on front of ADR; goes through SPST-1 relay coil which closes relay switch. If stream is above trigger GH, power from terminal 2 goes through SPST-1 switch and then through coil of SPST-2 relay. This closes SPST- 2 switch for terminals 5 and 6.
Terminals 5 and 6 - sampler trigger switch. Switch is closed only when stream is above trigger GH and ADR is in punch cycle. If sampler is hard-wired to relay box then "FLOW" port wires are connected to terminals 5 and 6 (either way). If sampler is triggered by radio then terminal 5 is connected to "TRIG (-)" of transmitter and terminal 6 is connected to ground - terminals 7 and 8.
Tenninals 7 and 8 with jumper wire between - ground. Return power from all 3 relay coils, ADR timer, injection relay coil and radio transmitter to battery (-). If injection pump is triggered by radio then return wire from SPST-2 relay coil is removed from ground and connected to 'TRIG (+)" on radio transmitter.
ADR - analog-to-digital recorder
COM - common
DPDT - double-pole, double-throw
GH - gage height
NC - normally closed
NO - normally open
SPST - single-pole, single throw
Checklist of Instructions and Field Form
A checklist of the site-servicing instructions and the field form (fig. 17) used in this study are shown below.
1) Check ADR; system has been triggered if:* timer is on* tape has punched beyond test values
40
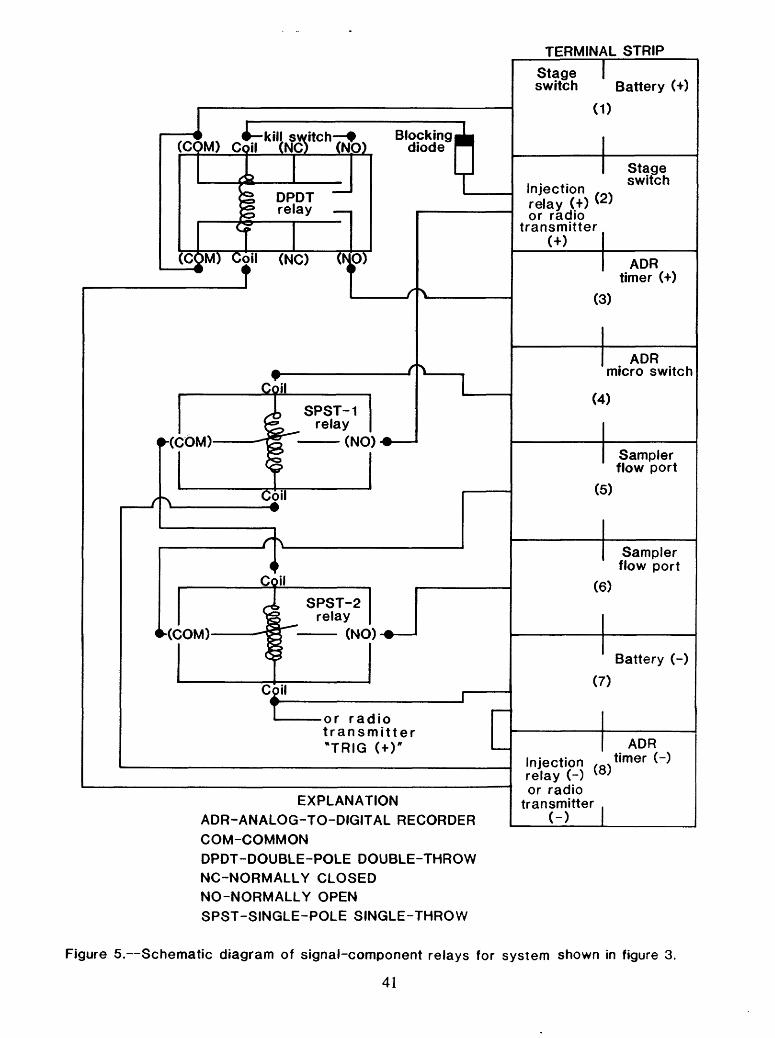
(COM) Cc> kill switch- f il (NC) (NO)
Blocking diode
DPDT ~~ relay
(COM) Coil (NC) (NO)
ty v
or radio transmitter "TRIG <+)"
TERMINAL STRIP
Stage Iswitch Battery (+)
(1)
Injection ,relay (+) (2) or radio
transmitter
Stage switch
ADR timer (+)
(3)
ADR micro switch
(4)
Sampler flow port
(5)
Sampler flow port
(6)
Battery (-)
(7)
Injection / Q v relay (-) (8) or radio
transmitter
ADR timer (-)
EXPLANATIONADR-ANALOG-TO-DIGITAL RECORDER COM-COMMONDPDT-DOUBLE-POLE DOUBLE-THROW NC-NORMALLY CLOSED NO-NORMALLY OPEN SPST-SINGLE-POLE SINGLE-THROW
Figure 5. Schematic diagram of signal-component relays for system shown in figure 3.
41

ATD-CSG NOTES
Date
Time
RP -TD
OWS
FTADR
PC r*rty
ADR
Unit
|
(Dat
um correction to
FT/AI
Batt
ery
(old/new)
: # ___ /
Timer: (ON/OFF) ;
(OK/NOK)
Rema
rks
)R ' ;
/;
Replaced?
VDC
CSG
Inside HWM (f
t)
IRated &
U/S
or D/
SBOS/TOS elev
+BOS/-TOS
1 Peak el<:o
HWM
iV
1
1 CS
G & Outside
CSG: plugged? Y/N;
Elev
I
Rated
HWM (ft)
Ifl
ushe
d? Y/
N; re
cork
ed?
Y/N
- Lo
cati
on -
Description
|
I Sampler Un
it
|Bo
ttle
s with sample:
(circle)
123456789
10
13
14
15
16
17
18
19
20
21
22
Bottles underfilled
Bott
les
overfilled
Battery (o
ld/n
ew)
: Remarks
# __ /'
; /
11
12
23
24
VDC
ATD-CSG NOTES (cont)
I In
ject
ion
Unit
|Remaining dy
e roixtv
"Old"
pump
: Settinc
Type
(]
Battery (o
ld/n
ew)
:
( Pu
m{Battery
P setting
P head(s)
Other
info
Vol
Rdg
(mL) 250
230
210
190
170
150
130
110
90
70
50Pu
mp ra
te
are
mL ;
j ; No.
heads
;?MI/Masterflex/
# /
/ VDC
3 Ra
te Tests
)
Elapsed Ti
me
(min
: se
c)
Pump
ra
te
(q)
= (Vc
(ql
= mL
/(q2
= mL/
Volume dy
e =
Units
Vd =
1.713
x
Volume dye+water -
Vdw =
mL/min
"New"
pump
: Se
ttin
c Ty
pe
(i
All
lines
cleaned?
Channel/Culvert Co
r Remarks
5lum
e pumf
min) (q3
=
min) (q4
=
conver x
min
x
>ed)/ (E
laps
ed time)
- mL/
min)
= mL/
min)
ADR cy
cle
x Qt
rgcf
s -
q x ADR cycl
e x
#x
min
x 24 -
r nMI/
Mast
ei
mL
samples mL
; No.
head
s ;
-flex/
)
idit
ions
(n
otes/sketch) -Over
Fig
ure
1
7.-
-F
ield
fo
rm
for
ins
pe
cti
ng
an
d
se
rvic
ing
a
uto
ma
tic
tr
ac
er-
dil
uti
on
eq
uip
men
t,
usi
ng
rh
od
am
ine
-WT
d
ye
at
cre
st-
sta
ge
ga
ge
s.
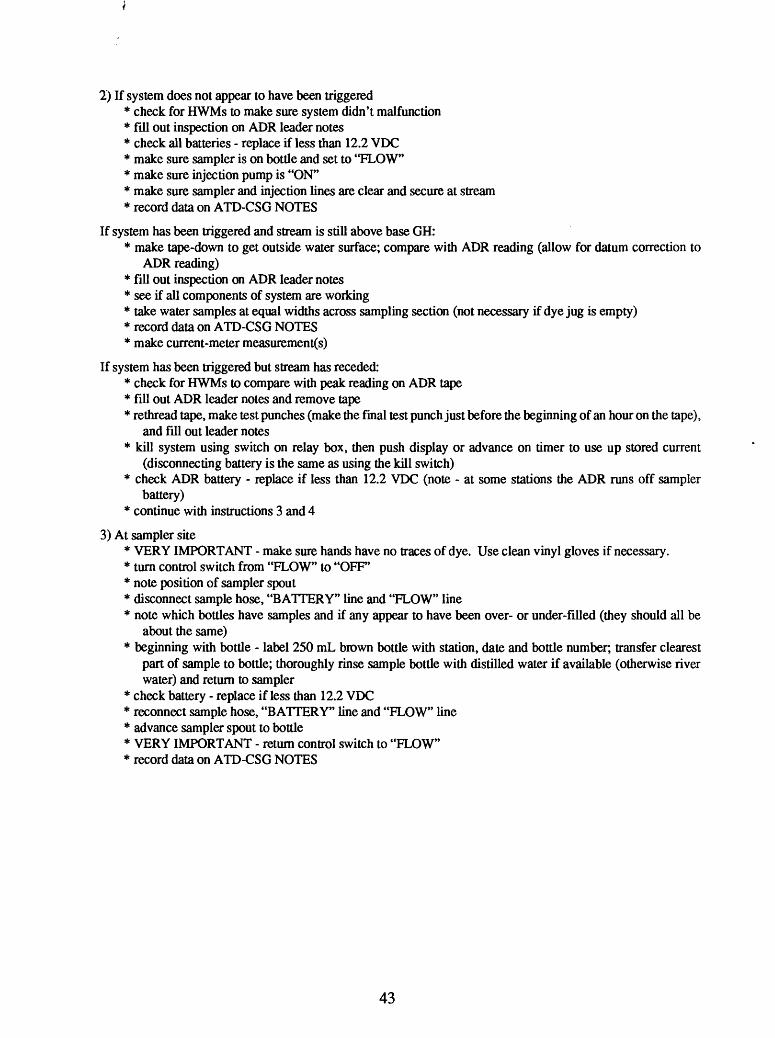
2) If system does not appear to have been triggered* check for HWMs to make sure system didn't malfunction* fill out inspection on ADR leader notes* check all batteries - replace if less than 12.2 VDC* make sure sampler is on bottle and set to "FLOW"* make sure injection pump is "ON"* make sure sampler and injection lines are clear and secure at stream* record data on ATD-CSG NOTES
If system has been triggered and stream is still above base GH:* make tape-down to get outside water surface; compare with ADR reading (allow for datum correction to
ADR reading)* fill out inspection on ADR leader notes* see if all components of system are working* take water samples at equal widths across sampling section (not necessary if dye jug is empty)* record data on ATD-CSG NOTES* make current-meter measurements)
If system has been triggered but stream has receded:* check for HWMs to compare with peak reading on ADR tape* fill out ADR leader notes and remove tape* rethread tape, make test punches (make the final test punch just before the beginning of an hour on the tape),
and fill out leader notes* kill system using switch on relay box, then push display or advance on timer to use up stored current
(disconnecting battery is the same as using the kill switch)* check ADR battery - replace if less than 12.2 VDC (note - at some stations the ADR runs off sampler
battery)* continue with instructions 3 and 4
3) At sampler site* VERY IMPORTANT - make sure hands have no traces of dye. Use clean vinyl gloves if necessary.* turn control switch from "FLOW" to "OFF'* note position of sampler spout* disconnect sample hose, "BATTERY" line and "FLOW" line* note which bottles have samples and if any appear to have been over- or under-filled (they should all be
about the same)* beginning with bottle - label 250 mL brown bottle with station, date and bottle number; transfer clearest
part of sample to bottle; thoroughly rinse sample bottle with distilled water if available (otherwise river water) and return to sampler
* check battery - replace if less than 12.2 VDC* reconnect sample hose, "BATTERY" line and "FLOW" line* advance sampler spout to bottle* VERY IMPORTANT - return control switch to "FLOW"* record data on ATD-CSG NOTES
43

4) At injection site* put on gloves to prevent dye stains* note pump rate setting (be careful not to change it) and approximate volume of any remaining dye/water
mixture* do pump-rate test with water/alcohol mixture* note battery voltage, replace if less than 12.2 VDC* if battery replaced or pump setting changed, repeat pump-rate test* compute volume of dye (Vd) required and add to jug* compute volume of dye/water mix (Vdw) required and add water to jug* thoroughly mix and retain sample in 250 mL brown sample bottle and label with station, date, and
approximate dye/water proportions* reconnect pump inlet line to dye jug make sure pump switch is "ON"* record data on ATD-CSG NOTES
Laboratory Form
The laboratory form for recording fluorometer readings and making discharge computations is shown below(fig. 18).
44
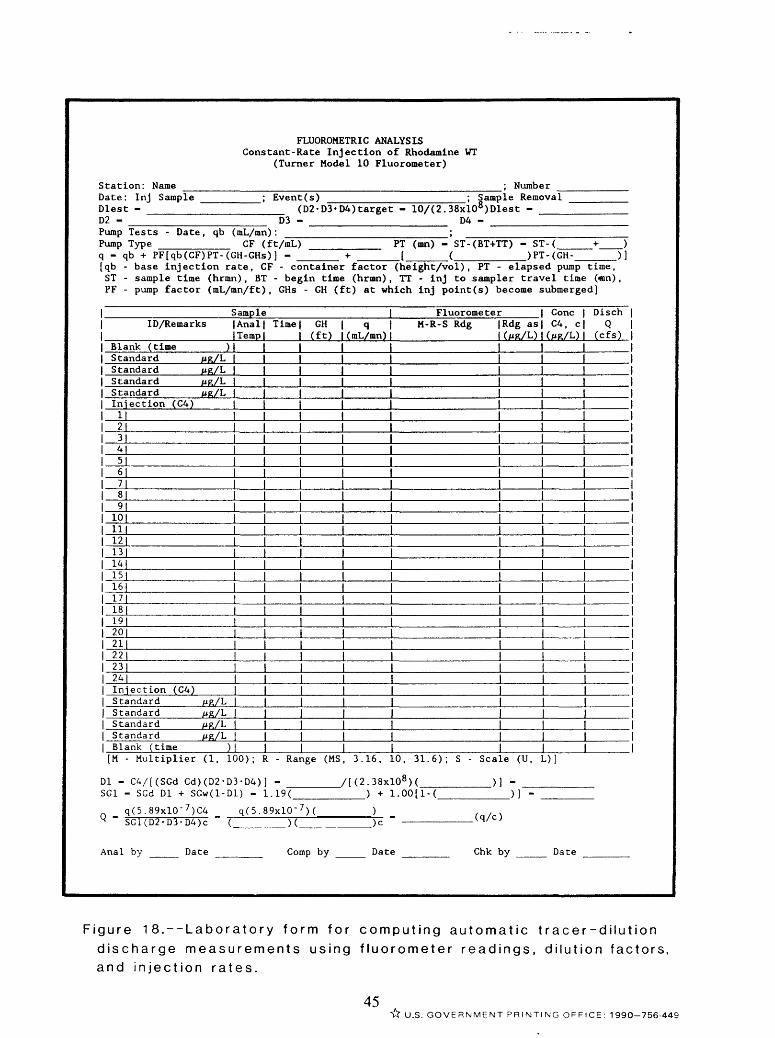
FLUOROMETRIC ANALYSISConstant-Rate Injection of Rhodamine WT
(Turner Model 10 Fluor ometer)
Station: Name __ Date: Inj Sample Dlest - ______ D2 -
NumberEvent(s) ample Removal
__________________ D3 - Pump Tests - Date, qb (mL/mn): __ Pump Type __________ CF (ft/mL)
qb + PF[qb(CF)PT-(GH-GHs)] -
(D2-D3»D4)target - .38xlO°)Dlest - D4 -
PT (ran) - ST-(BT+TT) - ST-( [_____(__________)PT-(GH- .)]
[qb - base injection rate, CF - container factor (height/vol), PT - elapsed pump time,ST - sample time (hrmn), BT - begin time (hrran), TT - inj to sampler travel time («n),PF - pump factor (mL/mn/ft), GHs - GH (ft) at which inj point(s) become submerged]
c
ID/Remarks
Blank (time )Standard PR/LStandard A»R/LStandard /*R/LStandard J*g/LInfection (C4)1121314|516|718|9|
10 111112113|14)15|16117)18 |19|20|21122|23|24|Iniection (C4)Standard PR/LStandard A»R/LStandard MR/LStandard PR/LBlank (time )
JarapltAnal Temp
i
Time GH (ft)
q(mL/mn)
Fluor ometeiM-R-S Rdg Rdg as
ConeC4, c (/*R/L)
DischQ
(cfs)
[M - Multiplier (1, 100); R - Range (MS, 3.16, 10, 31.6); S - Scale (U, L) ]
- C4/[(SGd Cd)(D2-D3-D4)] - (2 . 38xl08 ) (SG1 - SGd Dl + SGw(l-Dl) - 1.19(
,-7 ' 7_ q(5.89x!0' / )C4 _ q(5.89x10" ')(SGl(D2-D3-D4)c ( )c (q/c)
Anal by Date Comp by Date Chk by Date
Figure 18.--Laboratory form for computing automatic tracer-dilution
discharge measurements using fluorometer readings, dilution factors, and injection rates.
45U.S. GOVERNMENT PRINTING OFFICE: 1990-756-44S