Embed Size (px)
Citation preview
Comparison of Tracer-Dilution and Comparison of Tracer-Dilution and Current-Meter Measurements Current-Meter Measurements in a Small Gravel-Bed Stream, in a Small Gravel-Bed Stream, Little Lost Man Creek, CaliforniaLittle Lost Man Creek, California
Gary W. Zellweger, Ronald J. Avanzino, and Kenneth E. Bencala (1989)

Purpose of StudyPurpose of StudyPresent and compare discharge
measurements taken by two different methods:◦Tracer-dilution◦Current-meter
Suggest how much discharge is flowing through the channel gravel

BackgroundBackgroundCurrent-meter technique preferred
method to determine discharge
Issues with current-meter method:◦ Shallow depths o Rough bottom◦ Flow through gravel o Discharge variation
Continuous tracer-dilution methods can accommodate these factors

Can be used to calculate discharge at multiple sites
Requirements:◦Tracer thoroughly mixed with stream◦Conservative tracer
Tracer-Dilution MethodTracer-Dilution Method

Can be used to calculate discharge at multiple sites
Requirements:◦Tracer thoroughly mixed with stream◦Conservative tracer
Tracer-Dilution MethodTracer-Dilution Method

Can be used to calculate discharge at multiple sites
Requirements:◦Tracer thoroughly mixed with stream◦Conservative tracer
Tracer-Dilution MethodTracer-Dilution Method

Stream discharge below injection point:
Qb = Qi (Ci –Ca)
(Cb – Ca)
Qb = Stream discharge below the injection point Qi = Injectant discharge Ci = Tracer concentration in injectant Ca = Tracer concentration in stream above injection point Cb = Tracer concentration in stream below injection point
Tracer-Dilution MethodTracer-Dilution Method

Site DescriptionSite DescriptionLittle Lost Man Creek, CACoastal 3rd order stream
◦10 km length, N-NW flow◦Late summer flows 6 L/s◦Winter high flows 5,700 L/s
Study reach = 330 m◦Poorly sorted, sand-boulder◦Gravel sediments > 1 m thick

Cl-Li pumped into stream continuously (8d)◦Chloride concentration = 170.1 g/L◦Daily injection rate = 37.29±.32 mL/min◦Mixing length = 300m
Secondary injection on 7thday◦Na, Cl, rhodamine WT (24 h)◦Mixing length = 25m
Sampled hourly with automatic samplers◦300m above◦330m below
Tracer-Dilution MethodTracer-Dilution Method

Cl analysis:◦Filtered and stored w/o light, few months◦Dionex ion chromatograph
Na analysis:◦Filtered and stored w/o light, few months◦Spectrophotometer
Rhodamine WT analysis:◦Stored in glass bottle w/o light < 10d◦Fluorescence measured, Fluorometer
Tracer-Dilution MethodTracer-Dilution Method

Current-Meter MethodCurrent-Meter MethodDischarge measured with current
meter◦Three sampling days◦Two measurements/site/day
Modified 4 locationsDepth and ave. velocity
◦Measured at 17 to 25 vertical sectionsStream discharge determined by
summing flows through each measured subsection

Tracer (Chloride) Tracer (Chloride) ConcentrationsConcentrations

Current-meter Discharge Current-meter Discharge DataData

Method ComparisonMethod Comparison

Method ComparisonMethod Comparison

Method ComparisonMethod Comparison

DiscussionDiscussionCalculated discharges:
◦Current-meter 13.0 L/s◦Tracer (25m) 15.9 L/s ◦Tracer (300m) 14.4 L/s ◦Average 13.0 L/s

DiscussionDiscussionGravel zone = 25% of channel
flowGravel moves in and out between
the surface water and gravel zone
Current-meter = surface flow only
Tracer 300m = most mixing

ConclusionConclusionWater in gravel zone moves down
channel as underflow◦Can be measureable
Affects discharge measurementsTracer-dilution and current-meter
methods can yield different valuesTracer-dilution method yields
different results over different stream lengths

Testing and Comparison of Four Ionic Testing and Comparison of Four Ionic Tracers to Measure Stream Flow Loss Tracers to Measure Stream Flow Loss
by Multiple Tracer Injectionby Multiple Tracer Injection
Gary W. Zellweger(1994)

Purpose of StudyPurpose of StudyToxic metal transport, need to know
◦Where stream is losing water◦How much water is being lost
Calculate discharge for 4 tracers used in simultaneous multiple tracer dilution◦Li, Na, Cl, Br
Define limitations of method

Site DescriptionSite DescriptionSt. Kevin Gulch, CO3rd order stream
◦Flat, wetlands source◦Summer flow =
10 L/s pH ~3.6 in August
Study reach = 570 m◦Upper stream = forested, steep, narrow◦Lower stream = smaller gradient, little
vegetation, minimal hillslope

Study DescriptionStudy DescriptionTracer solution
continuously injected at 5 wells◦Lithium chloride
and sodium bromide in stream water
Injection sites ~100m apart
Parshall flumes installed, 4 sites

Parshall FlumeParshall Flume

ResultsResultsOnly 3 injection sites operated at
a time

ResultsResults
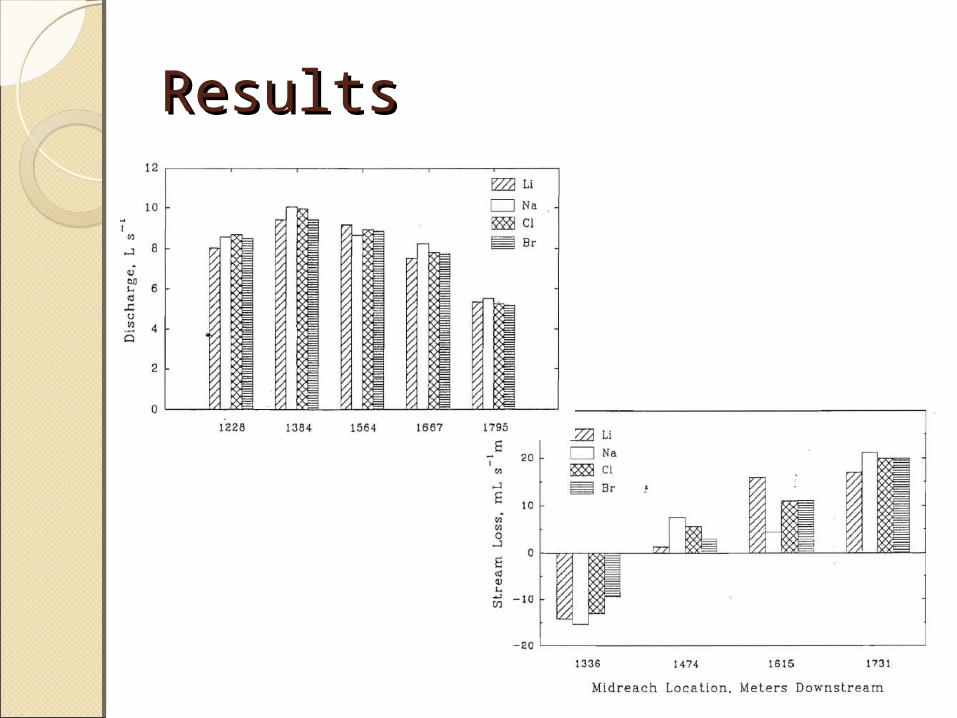
ResultsResults

DiscussionDiscussionPrecision of 2%Discharge decreasing downstream
(8%)More effective to use different
tracers at each injection siteAll tracers were conservative in St.
Kevin Gulch (116m reach)4-18% difference in discharge
measurements between flume and tracers

Evaluating the Reliability of the Stream Evaluating the Reliability of the Stream Tracer Approach to Characterize Tracer Approach to Characterize
Stream-Subsurface Water ExchangeStream-Subsurface Water Exchange
Judson W. Harvey, Brian J. Wagner and Kenneth E Bencala (1996)

Quantifying Hyporheic Quantifying Hyporheic Interactions:Interactions:
An in-depth look at three An in-depth look at three studiesstudies
Geology 230, CSUS, Spring 2013
Presented by
Emily Siegel and Jessica Bean


![[Architecture eBook] Zaha Hadid Skizzen Sketches Architecture -By Zellweger](https://img.pdfslide.us/doc/110x75/55cf98c3550346d033998a64/architecture-ebook-zaha-hadid-skizzen-sketches-architecture-by-zellweger.jpg)

![Zaha Hadid -Sketches -by Zellweger- [Architecture Ebook]](https://img.pdfslide.us/doc/110x75/54628638b1af9f03628b49f8/zaha-hadid-sketches-by-zellweger-architecture-ebook.jpg)
![[Architecture.ebook].Zaha Hadid Skizzen Sketches Architecture -By Zellweger-](https://img.pdfslide.us/doc/110x75/55cf92fc550346f57b9aedca/architectureebookzaha-hadid-skizzen-sketches-architecture-by-zellweger-.jpg)