Embed Size (px)
Citation preview
ASPRS 2008 Annual Conference Portland, Oregon ♦ April 28 - May 2, 2008
AUTOMATIC COMPILATION OF 3D ROAD FEATURES USING LIDAR AND MULTI-SPECTRAL SOURCE DATA
W. A. Harvey
David M. McKeown, Jr. TerraSim, Inc.
One Gateway Center, Suite 2050 Fort Duquesne Boulevard
Pittsburgh PA 15222 [email protected] [email protected]
ABSTRACT While many commercial cartographic feature extraction systems process panchromatic and color imagery, few
systems fully integrate airborne LIDAR data as a component of the feature extraction process. Most computational techniques seek elevation discontinuities at object boundaries or use the physics of the LIDAR signal to detect regions indicative of sharp edges and/or foliage. Automated road extraction presents a particular problem for these techniques because the height of the road surface is not significantly different from the height of the surrounding terrain.
Our approach is to use co-registered airborne LIDAR and multi-spectral source (MSS) data as additional evidence for evaluation and extrapolation of road surfaces and centerlines within a commercial road network extraction system. Thus, road tracking provides the local context for source data processing in a relatively narrow search area by using LIDAR/MSS data to contribute to feature detection and delineation. LIDAR can provide the system with a direct determination of road height, pitch, and slope, while MSS can be used to estimate surface material properties.
This work builds on previously reported work (Harvey, et al. 2006) that used multiple panchromatic image views to derive road elevation and slope while performing feature extraction. Incorporating co-registered LIDAR permits direct elevation determination and is less sensitive to occlusions and multi-image matching errors. In this paper we describe results in detection and delineation of road networks using co-registered LIDAR/MSS imagery. In addition to further automating the extraction process, we show that this approach improves road network accuracy and completeness, especially in complex urban environments.
MOTIVATIONS AND BACKGROUND While most commercial cartographic feature extraction systems work with panchromatic (black and white) and
color imagery, few systems fully integrate LIDAR data as a component of the feature extraction process. Commercial LIDAR analysis toolkits primarily are used to establish a digital elevation model (DEM) from the digital terrain model (DTM) which results from the LIDAR acquisition. During the DTM to DEM process, various man-made and natural features such as buildings and tree canopies can be "segmented" from the overall DTM since they exhibit sharp height discontinuities above the ground. These segments are represented as polygonal outlines of the boundary between the ground and the elevated features. Computational techniques that look for these height discontinuities at the object boundary, or use the physics of the LIDAR signal to detect "multi-bounce" indicative of foliage penetration, vary in effectiveness and depend on the complexity of the underlying terrain, the height of the structures being searched for, and the spatial resolution of the LIDAR compared to the size of the man-made structures.
Automated road extraction presents a particular problem for these techniques since the height of the surface of the road is generally not much different than the height of the surface of the surrounding terrain. This is especially true in complex urban areas, which are among the most challenging locations for automatic cartographic feature extraction systems. With the exception of elevated highways, causeways, and bridges, the nature of road construction and civil engineering dictates that there exists a relatively wide area on the sides of roads without large, continuous, height discontinuities. Thus, in order to exploit the height information that is available in LIDAR data we have chosen to process the reflective surface which is co-registered with the LIDAR height data.

ASPRS 2008 Annual Conference Portland, Oregon ♦ April 28 - May 2, 2008
Likewise, there are many commercial MSI-HSI classification systems that can be used to search for materials which may be indicative of road construction. However, in many areas of the world, roads (cart tracks) are essentially unpaved paths with subtle visible texture changes, nearly indistinguishable in terms of surface material from the surrounding area. Per-pixel classifiers have the limitation that collections of similarly classified image points need to be aggregated into vector data suitable for M&S data repositories, including the generation of topology and functional attribution. These observations lead directly to our approach to use a feature-based system to guide the interpretation of LIDAR/MSS data.
There are several recent results that employ airborne LIDAR data for road feature extraction. Alharthy and Bethel (2003) classify the LIDAR data using the signal intensity and height information, filtering the data to remove features unrelated to road objects. This work was focused primarily on urban road extraction where roads are delimited by significant depth discontinuities. Vosselman (2003) uses cadastral maps as a context within which to infer urban road regions from LIDAR point clouds. Filtering and fitting the point cloud data is a major emphasis in this work. Zhu, et al., (2004) detect road objects in high resolution color image data, then use LIDAR data to identify and connect roads across shadow regions. This work was also performed in the context of urban road extraction. Hu, et al., (2004) use a Hough transform to detect and extract gridded road networks from LIDAR data. Color imagery is used to classify and exclude vegetated regions from consideration in the network construction process. Finally, Clode et al. (2004) perform a classification of the LIDAR data by first using it to create a DTM, then identifying road regions by filtering based on intensity and local point density, as well as by comparing to the DTM. The road network is created from this result using connected components.
As described in the following section, our road tracking process performs local analysis and maintains a dynamically updated history of road structure and appearance in panchromatic or color imagery. As a result, the use of LIDAR with correlated EO data becomes an additional source of information useful in the decision process in the road network control layer. This focus can be used to remove the need for assumptions about the road network structure or height discontinuities with the surroundings.
OUR METHOD Our approach is to incorporate co-registered airborne LIDAR and multi-spectral source (MSS) data within
RoadMAP, a semi-automated linear feature extraction system (RoadMAP 2006). RoadMAP performs local-area processing to extrapolate from a road starting point to fully delineate road features. The LIDAR data is used to provide a direct determination of road height, pitch, and slope, and the MSS data is used to estimate surface material properties. In a parallel effort to provide automated road starting points, we pre-process the LIDAR/MSS imagery to create a "traffickability map" where we detect and delineate areas within the scene that contain likely avenues for roads.
These experiments were performed using a LIDAR/MSS data set acquired over a 1.5 x 4.5 km strip of south Baltimore, MD, just west of the Inner Harbor. The area includes many interesting transportation features, such as intersecting overpasses and bridges, as well as a rich mix of city and highway roads. The specifications of the data set are provided in Table 1.
Acquisition date: April 2006 Intensity: 3201 rows X 9151 cols X 8-bits [0.5m/pixel] First-return LIDAR DEM: 3201 rows X 9151 cols X 32-bits [0.5m/pixel] Last-return LIDAR DEM: 3201 rows X 9151 cols X 32-bits [0.5m/pixel] Color MSS: 6000 rows X 4000 cols X 24-bits [1.0m/pixel]
Table 1: LIDAR/MSS Data Set - Baltimore, MD
Tracking in Co-Registered LIDAR/MSS Data Based upon previously reported work (Harvey, et al. 2006) that used multiple panchromatic image views to
photogrammetrically derive road elevation and slope while performing feature extraction, we have integrated the use of DEM information into RoadMAP's automated road tracking module. Provided with panchromatic or MSS data and an overlapping LIDAR DEM, RoadMAP uses the coordinate system information provided with the geo-referenced image data to monoplot the tracked road path, intersecting it with the underlying DEM to dynamically

ASPRS 2008 Annual Conference Portland, Oregon ♦ April 28 - May 2, 2008
generate 3D object coordinates. 3D smoothness constraints are applied as tracking progresses to aid localization at each step. Incorporating co-registered LIDAR permits direct elevation determination and allows for less sensitivity to occlusions and multi-image matching errors.
Special consideration must be given to overpasses and underpasses where both visual cues and elevation information are temporarily obscured. RoadMAP already handles these occurrences by extrapolating forward using the recent path history as a guide. If the road surface is "re-discovered" with high confidence within a given distance, then tracking continues. The obscured portion of the road path is interpolated using the 3D coordinates of points on both sides of the guessed path. Thus, road tracking provides the local context for source data processing in a relatively narrow search area by using LIDAR/MSS data to contribute to feature detection and delineation.
Figure 1 shows an extracted 3D road network overlaid on the LIDAR DEM. We’ve selected one of the roads, displayed in yellow, and plotted the elevation profile along the road, using the yellow arrows to correspond the two figures. The road centerline elevations shown here are typical of the highly correlated elevation values observed on road surfaces in high-resolution airborne LIDAR. This permits the identification of other details associated with the road surface and the surroundings. For instance, in this example, vehicles can be identified along the path, and the tilt of the overpass decks can be measured (5% grade or about 3° for both decks).
Figure 1: RoadMAP 3D road centerline (yellow) overlaid on LIDAR DEM with its associated elevation profile. Building the Traffickability Map
In addition to tracking in the LIDAR/MSS image data, we also pre-process the data into a "traffickability map" to detect and delineate areas within the scene that contain likely avenues for roads. This processing is performed in object space so that other raw and processed data can easily be correlated and used for making decisions. Initially, we classify the LIDAR DEM using measures similar to Clode, et. al (2004), followed by identification of flat regions. Using connected components to group those flat “seed” regions, we then grow the seed regions into areas of the DEM with similar height statistics. The result of this process is the traffickability map. The process classifies roads and road-like features regardless of whether the roads are in flat, sloped, or undulating terrain.

ASPRS 2008 Annual Conference Portland, Oregon ♦ April 28 - May 2, 2008
Figure 2: Details in parallel LIDAR elevation profiles and the corresponding traffickability map.
The traffickability map can also be used to provide a context within which we can perform further analysis of
the details present in the LIDAR data. In Figure 2, we plotted the elevation profile for a road centerline (green), as well as plotting parallel profiles for the left (red) and right (yellow) sides of the road. Elevated features along the left and right profiles can be identified by their profiles using the centerline elevation as an estimate of the local terrain.
Generating the traffickability map in object space allows the overlap and fusion of data from other sources. For example, edge data derived from panchromatic and/or MSS data can be overlapped and used for texture analysis to classify portions of the traffickability map. Classification data can also be merged and used for filtering or attribution. The data can be combined logically or weighted and factored into a confidence score.
The final step will be to convert the traffickability map to a set of vectors, and from the vectors generate partial road hypotheses. The partial road features will be provided as starting points for the road tracker, which will extend and delineate the roads in 3D and then connect any intersecting roads in 3D to generate a topologically consistent road network.
EXPERIMENTAL RESULTS We performed two sets of experiments, both using the Baltimore LIDAR data set described in Table 1. In the
first experiment, we augmented RoadMAP with the LIDAR extraction module described in the previous section, and then used it to semi-automatically extract the 3D road network in the south Baltimore data. In the second experiment, we implemented the traffickability map operator and applied it to the Baltimore data. We then compared the results to the RoadMAP road network. We use the methodology described in (Harvey, et. al, 2004).
Figure 3 shows a color-coded view of the first-return LIDAR data along side the panchromatic data overlaid with the extracted 3D road network. All of the major roads and many minor roads have been extracted, though most alleys and smaller roads were omitted. Table 2 presents some characteristics of the extracted road network.
Data Set # of
Roads # of
Intersections Length (2D/3D)
[km] Extraction Time
[min] Baltimore 219 251 76.51 / 76.65 108
Table 2: Characteristics of the extracted 3D road network
Elevation Profiles Intensity Image Traffickability Map

ASPRS 2008 Annual Conference Portland, Oregon ♦ April 28 - May 2, 2008
Figure 3: Color-coded LIDAR elevation data (left) and the intensity image with the RoadMAP 3D road network
(right) over Baltimore, MD. Road elevations range from 7 (blue) to 37 meters (green). 3D Extraction and Visualization
Some of the most interesting 3D roads are in the southern portion of this data set where a group of major highway interchanges intersect. This area is highlighted in Figures 4 through 6. The left image in Figure 4 is a perspective view, looking west, of a triangulated version of the LIDAR data, demonstrating the complicated nature of the source data. The right image in Figure 4 displays the data from the same viewpoint, though here we integrated the extracted 3D roads into the terrain to show the accuracy of the extracted road network.
One motivation for the generation of 3D road data is to support modeling and simulation (M&S) applications, which typically use DEM source data and 2D cartographic vectors to generate visualizations and correlated constructive simulations. Transportation vectors receive their elevation by interpolating elevations from the DEM. This obviously is a problem for bridges, overpasses, and cloverleafs which are above the ground. Next generation M&S applications have the requirement and capability to reason about line of sight and traffickability under raised transportation structures, the limitation in the generation of M&S databases is currently in the paucity of full 3D source vector data, as well as techniques to auto-generate full 3D geometry.

ASPRS 2008 Annual Conference Portland, Oregon ♦ April 28 - May 2, 2008
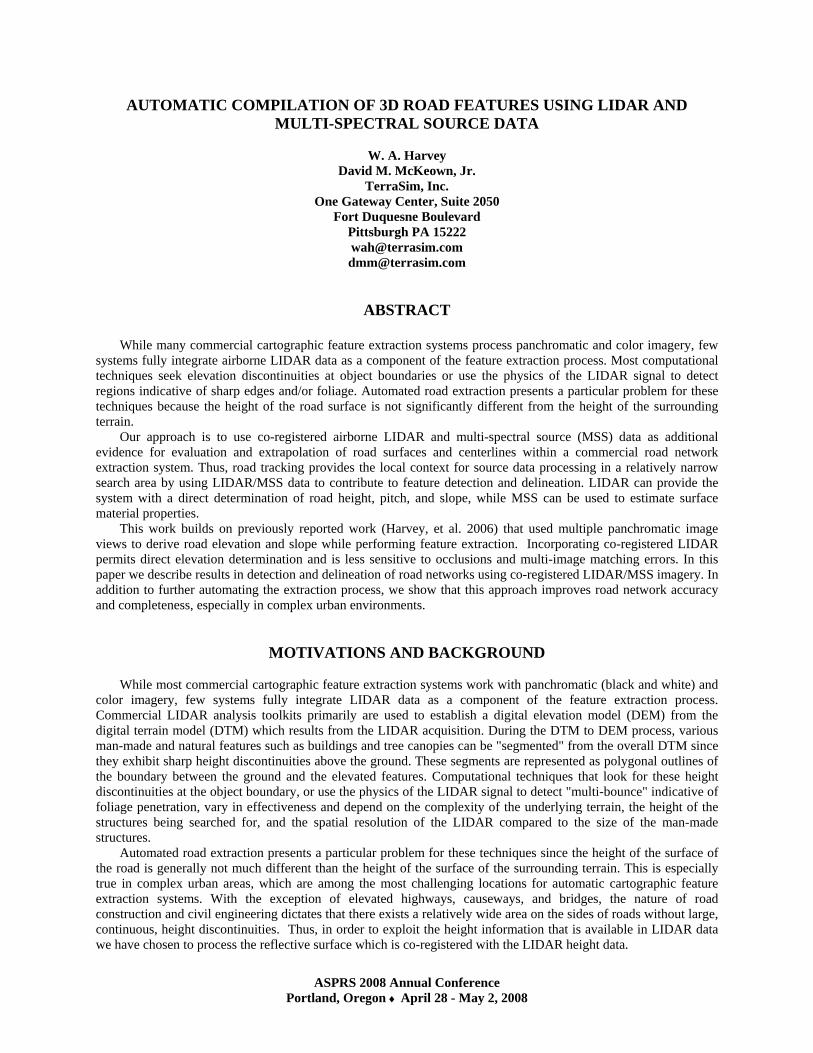
Figure 5 and 6 show a TerraTools® (TerraTools 2008) automatically generated visualization of the extracted 3D overpass data using the centerlines and the attribution that RoadMAP attaches to each extracted road object. Using a simple spacing model, support pylons were dropped from the extracted bridge deck to the bathymetric surface below. The overpasses were given simple road surface appearance textures, with geometry for side walls extruded at the edges of the roads. The visualization clearly shows the interpenetrating nature of the 3D road network which is critical for understanding the virtual environment.
Figure 4: Perspective view of a TIN generated from the LIDAR DEM over the southern portion of the Baltimore,
MD data set (left), with a similar view showing the integrated 3D roads extracted using RoadMAP (right).
Figure 5: A TerraTools® visualization of the area presented in Figure 4 highlighting the interpenetrating 3D road
network generated using RoadMAP.
ASPRS 2008 Annual Conference Portland, Oregon ♦ April 28 - May 2, 2008
Figure 6: Another perspective view (looking east) of the southern portion of the 3D road network showing the result of a tracking error on one of the overpass segments.
Application of Classification and Traffickability Map Analysis for Road Detection
Road detection and the underlying segmentation of an image into areas where a road network may be present is critical to fully automated processing in urban areas. RoadMAP is used to semi-automatically extract roads via tracking from a human generated “road seed” point, however other modalities to initiate tracking are possible. In this second experiment the goal is to delineate areas that have high probability of containing roads, not necessarily directly extract the road network. Thus these road seed points, which may appear to be nearly continuous road vectors, would be passed to RoadMAP automatically as points with direction and width to initiate fully automated extraction.
Results from our second experiment on road detection using LIDAR and image classification are shown in Figures 7 and 8. We first applied the traffickability map operator, described previously, to the airborne LIDAR DEM. The results are shown in the left side of Figure 8, with the entire process taking about 1 minute. A visual evaluation demonstrates that the operator correctly recognizes most of the detail in the road network, including elevated road surfaces in the south as well as alleys in the urban canyon areas. This detail is reflected in the high accuracy numbers, presented in Table 3, when comparing this result to that obtained semi-automatically using RoadMAP (right side of Figure 3). Parking lots and other flat, open areas are recognized as traffickable and, thus, are included in the traffickability map, though they would commonly be excluded from a final road network product. Removing these features requires further semantic analysis. In spite of these questions, the results provide encouragement that integrating this operator into a system like RoadMAP is likely to increase the level of automation while improving the network extraction results.
We then performed a supervised classification of the co-registered MSS data, classifying the results into six different material categories: building, shadow, soil, asphalt, vegetation, and water. A colorized version of the classifier result is presented in the left side of Figure 7 along with a color/class legend (right). The classifier appears to correctly label many of the road, water, and vegetation areas, while the other classes, particularly building and shadow, appear to be more intermixed.
We then combined the classification results using the traffickability map as a logical mask to generate the result shown in Figure 8 (right). Visually, the majority of the road network is classified as asphalt, with many roads also

ASPRS 2008 Annual Conference Portland, Oregon ♦ April 28 - May 2, 2008
being labeled as shadow. We could eliminate some of the open areas by excluding soil as an incompatible material label. The building and vegetation classes appear to bleed somewhat into the road network, though much of this appears to be due to differences in resolution (0.5m LIDAR compared to 1.0m MSS), as well as a small amount of mis-registration. Again, even with these issues, it appears as though we can refine the traffickability map using co-registered MSS data, as well as reliably apply surface material attributes to roads derived from this process.
Next steps include the evaluation of road seeds and the use of the traffickability map to control RoadMAP in tracking the road in the original imagery. RoadMAP will fill gaps within the traffickability map, build topology for the road network, and assign attribution based upon intrinsic properties of the extracted road (width, material) or using functional codes (highway, light duty road, cart track) based upon user interaction.
Figure 7: Gaussian Maximum Likelihood (GML) supervised classification results over
Baltimore, MD with the corresponding class/color legend.
Vegetation
Building
Soil
Water
Shadow
Asphalt

ASPRS 2008 Annual Conference Portland, Oregon ♦ April 28 - May 2, 2008
Figure 8: Traffickability map (TM) results (left) and combined TM/GML classification results (right) over
Baltimore, MD.
True Positives False Positives Branching Factor 80.17% 19.83% 0.25
Table 3: Accuracy results comparing the traffickability map results to the RoadMAP 3D road network

ASPRS 2008 Annual Conference Portland, Oregon ♦ April 28 - May 2, 2008
CONCLUSIONS We have presented the results of two experiments combining the use of LIDAR and MSS data for 3D road
extraction. Our method assumes that elevation cues alone may be unreliable, even in urban areas, and that processing the LIDAR with co-registered reflective imagery will produce the most robust extraction results. The results presented demonstrate that integrating high-resolution airborne LIDAR into the feature extraction process improves the results of extraction and shows promise for increasing the accuracy and level of automation. Our future work will focus on vector production from the traffickability map, as well as integrating the process into our commercial road network extraction system, RoadMAP.
ACKNOWLEDGEMENTS . The authors would like to thank Mr. Chris Gard at U.S Army ERDC-TEC, Fort Belvior, VA, and Mr. Dan
Stevens at JFCOM/J7 for providing support and test data for this work.
REFERENCES
Alharthy, A. & Bethel, J. (2003). Automated road extraction from LIDAR data. Proceedings of American Society of Photogrammetry and Remote Sensing. Anchorage, Alaska. CD-ROM.
Clode, S. Kootsookos, P. & Rottensteiner, F. (2004). The automatic extraction of roads from LIDAR data.
International Archives of Photogrammetry, Remote Sensing and Spatial Information Sciences. Istanbul, Turkey. Volume XXXV-B3, pp. 231-236. International Society for Photogrammetry and Remote Sensing.
Harvey, W., McGlone, J., McKeown, D., and Irvine, J. (2004). User-centric evaluation of automated road network
extraction. Photogrammetric Engineering and Remote Sensing. Volume 70, Number 12, pp. 1353-1364. Harvey, W., Cochran, S. & McKeown, D. (2006). Performance analysis of autonomous multi-image road tracking.
Proceedings of American Society of Photogrammetry and Remote Sensing. Reno, Nevada. CD-ROM. Hu, X., Tao, C.V. and Hu, Y. (2004). Automatic Road Extraction From Dense Urban Area by Integrated Processing
of High Resolution Imagery and LIDAR Data. International Archives of Photogrammetry, Remote Sensing and Spatial Information Sciences. Istanbul, Turkey. Volume XXXV-B3, pp. 288-292.
RoadMAP (2008). RoadMAP from TerraSim® Product Description.
http://www.terrasim.com/products/roadmap/ TerraTools (2008). TerraTools® Geospatial Visualization Toolset Product Description.
http://www.terrasim.com/products/terratools/ Vosselman, G. (2003). 3D reconstruction of roads and trees for city modeling. International Archives of
Photogrammetry, Remote Sensing and Spatial Information Sciences. Dresden, Germany. Volume XXXIV-3/W13, pp. 231-236. International Society for Photogrammetry and Remote Sensing.
Zhu, P., Lu, Z., Chen, X., Honda, K. and Eiumnoh, A. (2004). Extraction of city roads through shadow path
reconstruction using laser data. Photogrammetric Engineering and Remote Sensing, Volume 70, Number 12, pp. 1433-1440.