Embed Size (px)
Citation preview

Registration number 84
Automated Trading System for OnlineBetting Exchange Betfair
Supervised by Dr Graeme Richards
University of East Anglia
Faculty of Science
School of Computing Sciences

Abstract
In this work a study of Betfair’s betting exchange is carried out with extensive focus
on identifying factors that influence market direction. Based on research, two trading
strategies are proposed backed up by analysing ten data sets of Betfair historic data.
Four main factors are identified as market influences. These factors are used to develop
a multithreaded automated trading system that interacts with the Betfair API indepen-
dently making subsequent trades on predicting the market direction. An Android ap-
plication is also developed to act as a user interface for the system. The system is run
for a period of 20 days. An outstanding success rate is observed resulting in a 21%
cumulative profit on stake over the 20 day period.
Acknowledgements
I would like to thank my project supervisor Dr Graeme Richards for all his help and
feedback he has provided on my work throughout. I would also like to thank Dr Peirre
Chardaire and Dr Richard Harvey for the organisational support they have provided
throughout running the module.

CMPC3P2Y Contents
Contents
1. Introduction 1
1.1. Betfair Betting Exchange . . . . . . . . . . . . . . . . . . . . . . . . . 1
1.2. Trading with Betfair . . . . . . . . . . . . . . . . . . . . . . . . . . . . 1
1.3. Betfair Developer Program . . . . . . . . . . . . . . . . . . . . . . . . 2
1.4. Advantages of Automated Trading . . . . . . . . . . . . . . . . . . . . 3
1.4.1. Avoiding Human Error . . . . . . . . . . . . . . . . . . . . . . 3
1.4.2. Human Emotion . . . . . . . . . . . . . . . . . . . . . . . . . 4
1.4.3. No Time Limitations . . . . . . . . . . . . . . . . . . . . . . . 4
1.4.4. Multiple Market Analysis . . . . . . . . . . . . . . . . . . . . 4
1.4.5. Speed . . . . . . . . . . . . . . . . . . . . . . . . . . . . . . . 4
2. Literature Review 5
2.1. Prediction Markets . . . . . . . . . . . . . . . . . . . . . . . . . . . . 5
2.2. Sports Betting Arbitrage . . . . . . . . . . . . . . . . . . . . . . . . . 6
2.3. Existing Trading Strategies . . . . . . . . . . . . . . . . . . . . . . . . 7
2.3.1. In Play Strategies . . . . . . . . . . . . . . . . . . . . . . . . . 7
2.3.2. Pre in play Strategies . . . . . . . . . . . . . . . . . . . . . . . 8
2.3.3. Swing Trading . . . . . . . . . . . . . . . . . . . . . . . . . . 9
2.3.4. Scalping . . . . . . . . . . . . . . . . . . . . . . . . . . . . . 10
2.4. Time Series Data Analysis . . . . . . . . . . . . . . . . . . . . . . . . 11
2.4.1. Machine Learning . . . . . . . . . . . . . . . . . . . . . . . . 12
2.4.2. Case Based Reasoning . . . . . . . . . . . . . . . . . . . . . . 12
2.4.3. Other Machine Learning Algorithms . . . . . . . . . . . . . . . 12
3. Proposed Trading Strategies 13
3.1. Strategy A . . . . . . . . . . . . . . . . . . . . . . . . . . . . . . . . . 13
3.2. Strategy B . . . . . . . . . . . . . . . . . . . . . . . . . . . . . . . . . 14
4. Modelling Betfair Historical Data 15
4.1. Data Set . . . . . . . . . . . . . . . . . . . . . . . . . . . . . . . . . . 15
Reg: 84 iii

CMPC3P2Y Contents
5. Proposed Hypotheses 16
5.1. Weight of Money . . . . . . . . . . . . . . . . . . . . . . . . . . . . . 16
5.2. Back and Lay Over-rounds . . . . . . . . . . . . . . . . . . . . . . . . 17
5.3. Lowering Risk . . . . . . . . . . . . . . . . . . . . . . . . . . . . . . . 17
5.4. Volume Spikes . . . . . . . . . . . . . . . . . . . . . . . . . . . . . . 18
6. Data Analysis 18
6.1. Methods of Analysis . . . . . . . . . . . . . . . . . . . . . . . . . . . 18
6.2. Results . . . . . . . . . . . . . . . . . . . . . . . . . . . . . . . . . . . 21
6.2.1. Weight of Money . . . . . . . . . . . . . . . . . . . . . . . . . 21
6.2.2. Back and Lay Over-rounds . . . . . . . . . . . . . . . . . . . . 23
6.2.3. Trading In Non Volatile Markets . . . . . . . . . . . . . . . . . 26
6.2.4. Volume Spikes . . . . . . . . . . . . . . . . . . . . . . . . . . 28
6.3. Conclusions . . . . . . . . . . . . . . . . . . . . . . . . . . . . . . . . 29
7. Implementation 30
7.1. Automated Betfair Tool . . . . . . . . . . . . . . . . . . . . . . . . . . 31
7.1.1. Trading Thresholds and Rules . . . . . . . . . . . . . . . . . . 33
7.2. User Interface . . . . . . . . . . . . . . . . . . . . . . . . . . . . . . . 36
8. Results 37
8.1. Strategy Success . . . . . . . . . . . . . . . . . . . . . . . . . . . . . 39
9. Conclusion 39
References 41
A. Other Examples to Show Weight of Money Affect 44
B. Example Green Screens 45
Reg: 84 iv

CMPC3P2Y List of Figures
List of Figures
3.1. English Premier League - Relegation . . . . . . . . . . . . . . . . . . 14
4.1. Historic Data - Everton vs Norwich - Draw . . . . . . . . . . . . . . . 16
4.2. Data Set Overview . . . . . . . . . . . . . . . . . . . . . . . . . . . . 17
Reg: 84 v

CMPC3P2Y 1. Introduction
1. Introduction
1.1. Betfair Betting Exchange
Betfair was launched in June 2000 and has had a huge impact in the way in which
betting is perceived and has revolutionized sports betting. Betfair is an online betting
exchange which doesn’t directly set the odds of the selections users can place bets on.
Instead Betfair simply provides a market and allows users to essentially trade-off against
each other for the best available price. Instead of the traditional betting model where
the bookmaker will set fixed odds of the implied probabilities of a selection, a betting
exchange allows users to effectively become the bookmaker and offer their own implied
probabilities for other users to place bets on. Placing a bet on an outcome is known as
a "back" bet whereas offering a bet to be backed by another user is called a "lay" bet.
Betfair claims to process more than six million transactions every day which is more
than all European stock exchanges combined, Alberola and Garcia-Fornes (2013).
1.2. Trading with Betfair
The above concept of being able to both back and lay on the same outcome provides
the opportunity to make profits on market movements in a similar way to how stock
market traders do on the stock market. For example consider the scenario below: A
bet is placed for £10 on a selection with odds of 10/1 (Back Phase). A second bet is
then offered to the market to take a £10 bet on the same selection with odds of 9/1 (Lay
Phase).
Back Phase: Potential winnings = £100 Potential Loss = £10
Lay Phase: Potential winnings = £10 Potential Loss = £90
From these figures we can see that if the selection wins the back bet will win £100
but the lay bet will lose £90 resulting in a net profit of £10. On the other hand if the
selection loses the lay bet will win £10 and the back bet will lose £10 resulting in a
break even situation. To further eliminate relying on the selection winning in order to
Reg: 84 1

CMPC3P2Y 1. Introduction
make a profit, the profits can be hedged across all selections to lock in a guaranteed
profit, this is often known as "greening up" to represent a green profit figure displayed
over all selections on the screen. For example if the selection was "laid" for £11 instead
of £10 this would lock in a £1 profit if the selection was to win or lose.
This may appear a very easy way to gain profits on the exchange however in order
for the above scenario to play out successfully it is required that a lay bet is placed at
odds of lower than the odds of the placed back bet or the opposite (backing at a higher
price than the original lay bet). This would therefore involve correctly predicting the
market to move in a certain direction, in the above scenario this is represented as the
odds dropping from 10/1 to 9/1.
1.3. Betfair Developer Program
The Betfair developer program is designed to allow users to develop their own appli-
cations and software that can interact with the exchange. The program is dedicated to
assisting Betfair customers with integrating their applications into the Betfair exchange
platforms. Betfair (2013a)The API uses an XML-based interface description language
known as Web Services Description Language (WSDL) which can be loaded into an
IDE project. The API is pulled from an URL and the various built in functions and vari-
ables are then accessible from within the project. There are three options when signing
up to the program which include:
• Personal Free Access - This is the most basic of the developer spaces aimed for
personal use it offers limited API services with various caps on data requests, for
most of the API functions 60 requests per minute is the limit. A full list can be
found at Betfair (2013b)
• Software Vendor - This option is applicable for developers that wish to com-
mercialise their application. These applications are often trading software that
provide enhanced tooling and analysis of the markets, there are various software
vendor applications available including BetAngel, GeeksToy and FracSoft. This
service has an undisclosed fee which is expected to be quite large.
Reg: 84 2

CMPC3P2Y 1. Introduction
• Personal Full Access - This is similar to the personal free access service but
has no data limitations. However for this service a charge of £200 per month is
required.
The API itself contains a powerful set of features that allow advanced market navigation,
search, odds retrieval and bet placement. The API also provides Betfair account related
services via the Accounts API.Betfair (2013a) The API is available for various platforms
including Java, Python, and Visual Basic 5 and 6.
1.4. Advantages of Automated Trading
As Betfair is a prediction market it is very similar to modern day financial markets,
here some of the advantages of automated trading versus manual trading are considered
both lowering risk by excluding factors such as human error and emotion as well as
performance enhancing factors such as increased speed and efficiency and analysing
markets in parallel.
1.4.1. Avoiding Human Error
Human error and risk management are considered vitally important factors in financial
market trading. A study by (1Baddeley and Longman, 1973) shows that humans have
a tendency to incur error in even the simplest of tasks. Baddeley and Longman’s study
shows a 1% error rate for postal workers copying down the correct postal code on de-
liveries, a seemingly simple task however this shows that human error is inevitable in
almost everything. In relation to financial market trading these types of human errors
are often magnified because of the large amounts of money at stake. In October 2012
Google saw $22 Billion wiped off there market value caused by someone accidently
e-maling the wrong person. More recently in January 2014 a trader lost approximately
£400,000 in 30 seconds when he accidentally bought a large amount of shares of bank
HSBC Mason (2014). This type of error is often referred to as a "fat finger" trade, where
the trader buys the wrong, or wrong amount of shares by accident. Factors that lead to
human error can include tiredness, inexperience, complacency, distractions and fatigue.
Reg: 84 3

CMPC3P2Y 1. Introduction
1.4.2. Human Emotion
Trading in financial markets is one of the most emotionally connected occupations, this
is because traders are dealing with their own or other peoples money and feel a strong
connection to the outcomes of their trades. In a study by Lo (2005) the authors show a
direct link between fear and greed to trading performance. As well as greed and fear,
stress and pressure can play a major part in human performance. In a study by Guttman
(1983) a group of candidates are asked to perform the simple task of turning a control
in a particular direction. However the conditions of the experiment involved trying to
perform the task under extreme stress. The results show an error rate of 50% per turn of
the control. Overconfidence can also be an emotion experienced by traders that appear
to be doing very well, the overconfidence can lead to taking increased unnecessary
risks, often resulting in an overall decrease in performance. Odean (2001) show that
overconfidence in both men and women decreased trading performace by 2.65% and
1.72% respectively. Finally as this work aims to trade on a betting exchange using an
automated approach eliminates any gambling and addiction based emotional conflicts.
1.4.3. No Time Limitations
Betfair betting exchange runs seven days a week twenty four seven, using an automated
approach means that full exposure to the markets is possible. Analysis can be done con-
tinually unlike manual traders which may miss opportunities outside of normal trading
hours.
1.4.4. Multiple Market Analysis
Manual traders can only fully focus on one market at a time, whereas using an auto-
mated approach multi threading can be introduced to both analyse and trade on multiple
markets at the same time. This advantage therefore increases coverage and efficiency.
1.4.5. Speed
Using rule based algorithms the advantage of automation means that spotting patterns
and trends as well as simply placing bets is a lot faster. For some trading strategies
Reg: 84 4

CMPC3P2Y 2. Literature Review
speed is vitally important.
2. Literature Review
In this section a brief look into the background of betting exchanges and sports arbi-
trage is discussed followed by a look into different trading strategies and factors that
have been found to influence marlet direction. Finally looking into techniques used for
technical market analysis.
2.1. Prediction Markets
Wolfers and Zitzewitz (2004)state that Betfair can be categorized as a prediction market,
a form of financial market that is based on speculation of the outcome of an unknown
future event. S.J. Hardiman (2011) states Bets placed act as assets which have a value
related to the outcome of an event. Prediction markets have proved to be extremely
accurate at predicting the true probabilities of future events occurring. J.E. Berg (2008)
A recent study showed that the Iowa Political Stock Market has been shown to beat
opinion polls at forecasting the outcomes of presidential elections.
Prediction markets are fuelled by the views of a large contingency, battling for a prize in
the case of Betfair’s betting exchange, the stake multiplied by the estimated probability
that they are correct. Betfair being the largest betting exchange in the world abides by
this accuracy on high volume markets, often sports such as football, tennis and horse
racing. Betfair processes more than five million transactions every day which is more
than all European stock exchanges combined Goncalves (2013). The market fluctuates
due to the supply and demand of a particular price being offered. If lots of people be-
lieve that the implied probability is greater than the actual probability then the odds will
shorten. The same can be said if the implied probability is less than the actual probabil-
ity then the odds will rise. This is due to the competitiveness of the market, users are
fighting for the best available price for both backing and laying, which in turn balances
the market. For example if there is a high demand to back a particular selection then
Reg: 84 5

CMPC3P2Y 2. Literature Review
people that are trying to lay the selection will most likely lower there asking price as not
to offer over the odds of the true probability, thus balancing the market.
2.2. Sports Betting Arbitrage
Arbitrage is the concept of placing bets on all outcomes of an event where all outcomes
will result in a profit. Arbitrage focuses on creating a book percentage of less than 100%
which puts the better in a position where betting on all selection will guarantee profit.
The book percentage can be defined as the sum of 100 divided by the odds of each se-
lection. The book percentage will always be above 100% for the bookmaker to make a
profit. For example if the book percentage was 105% this represents that the bookmaker
will make £105 for every £100 they pay out.
Originally sports arbitrage would be done between 2 or more bookmakers that was of-
fering different odds on selections in the same event. This type of arbitrage is discussed
by D.C. Edelman (2004) Consider the following scenario:
In an event of 2 possible outcomes either player A winning or player B winning. If
one bookmaker was offering odds of 3.5 for player A and 1.37 for player B we can
work out the book percentage as the sum of 100/selection odds:
Book Percentage = 100/3.5 + 100/1.37 = 101.56%
As we can see the book percentage here shows the bookmaker will win £101.56 for
every £100 he pays out. However if another bookmaker was offering odds of 3.2 for
player A and 1.42 for player B we can again work out the book percentage as:
Book Percentage = 100/3.2 + 100/1.42 = 101.67%
Again these odds would result in a guaranteed profit for the bookmaker as the book
percentage is greater than 100%. However if someone was to take the odds for player A
from the first bookmaker of 3.5 and the odds for player B from the second bookmaker
Reg: 84 6

CMPC3P2Y 2. Literature Review
of 1.42 we can again work out the book percentage as:
Book Percentage = 100/3.5 + 100/1.42 = 98.99%
The punter is now in a successful arbitrage situation, for every £100 they win they
will lose only £98.99 resulting in a profit of 1.01%. Before the arrival of betting ex-
changes this would be very hard to come by as many bookmakers would set up book
percentages of between 105% - 120%, E. Franck (2009) found that the average book
percentage excluding exchanges was between 110.9% and 114.1%. With book percent-
ages this high it would be very hard to find arbitrage opportunities where the odds where
so far apart. As Betfair is a betting exchange and doesn’t set the odds of selections we
find that the average book percentage is a lot lower than other bookmakers at 102.6%
excluding commission O’Connor (2013), on higher profile events the book percentage
can drop to fluctuate between 100.1% - 101%.
Typically arbitrage is done over two or more bookmakers however trading on the Bet-
fair exchange can be considered a type of arbitrage betting as the market prices fluctuate
and can present the arbitrage opportunities of "backing" high and "laying" low. How-
ever this form of arbitrage is more risky as it involves predicting the market direction in
order to formulate the book percentage at less than 100%.
2.3. Existing Trading Strategies
Since the introduction of betting exchanges there has been many different trading strate-
gies developed and used by traders.
2.3.1. In Play Strategies
One of the most common trading strategies is trading the in play markets on Betfair.
A market that is in play means that the event has already started, this therefore means
there will be high volatility in the market as the odds rise and fall dependent on things
happening during the event. For example if a goal is scored in a football match the odds
Reg: 84 7

CMPC3P2Y 2. Literature Review
will change drastically. Football and Tennis markets are often traded in play, Wozniak
(2011) Investigates the in play markets of tennis, his work shows how volatile the mar-
ket can be often swinging up and down large amounts. In this paper Wozniak develops a
trading strategy to calculate probabilities of a player winning a game based on a Markov
Chain, "a stochastic model describing a sequence of possible events in which the prob-
ability of each event depends only on the state attained in the previous event." Lawler
(2006). The probabilities are then compared to the implied probabilities on Betfair and
trades are opened where the Markov Chain probabilities are higher than those on the
exchange. The trade is then closed when the swing in the market occurs.
Although in play market trading can be very lucrative offering large swings in mar-
ket prices it is also very risky, with big profits also comes big loses. The market can
swing in both directions as is pointed out by Ovregard (2008) the in play markets are
very volatile and effective contingency planning is highly required. To implement this
Ovregard, and Oyvind Norstein employ a stop loss technique for their in play trading
strategy.
A stop loss is a rule set by the trader to protect the open trades from going drastically in
the wrong direction and producing large losses.
2.3.2. Pre in play Strategies
Many traders prefer to trade before the market goes in play as this is less risky, the
markets are a lot less volatile and traders can rely on market trends and analytics to
predict market direction and not random events that occur in play. Horse Racing is a
very popular market for pre in play traders. One of the most famous and successful
Betfair traders Adam Heachcote heavily traded the horse racing markets between 5 - 15
minutes before the off. Heachcote wrote a blog in 2009 of how he started trading with
a bankroll of £6000 in which he accumulated £296,208.92 in just one year. Heathcote
(2012) Trading software BetAngel founder Peter Webb also claims to be very successful
using pre in play strategies. He claims a turnover of a quarter of a billion pounds a year
trading on betfair and is known as "The master of the markets" Blincoe (2010) Webb
Reg: 84 8

CMPC3P2Y 2. Literature Review
discusses various trading strategies in his blog Webb (2013), two of the main techniques
he refers to are swing trading and scalping.
2.3.3. Swing Trading
A swing trade is a large market movement in one direction. A large swing in the market
may be triggered by several factors. Goncalves (2013) paper explores the notion of the
"weight of money" concept. The weight of money encapsulates the supply and demand
of a particular selection by looking at how much money is waiting to be matched on
either side of the market. If there is a higher amount of money waiting to be matched
on one side of the market then this represents a high demand of people wanting to take
this price and an expected drop in price. Likewise if there is a low amount of money on
one side of the market this represents a weak demand for the price and an expected rise
in the price will occur.
This concept has been explored by Christiansen (2007). In Christiansen’s study a pre-
diction market is set up and a set of traders attempt to make a favoured selection appear
more likely to win by placing large amounts of money at certain positions in the market.
Although the money wasn’t real the results showed that the apparent high demand of
a selection represented by large sums of money could manipulate traders into believ-
ing that the selection was more likely to trend positively. Other factors discussed by
Nordsted (2009) that are believed to have effect on the direction of the market include:
• Large Volume Spikes - Large volume spikes can often be a sign of high demand
and are also not prone to market manipulation as the weight of money concept is.
• Competitor Movements - Markets will always remain balanced, if one selection
is trending positively then other selections must be trending negatively.
• News - News of influencing events such as injuries or non-runners will almost
definitely have an effect on the market.
• Graphical correlation and trends - Spotting trends and patterns from the graph
of the previously traded prices as well as statistical analysis such as last traded
Reg: 84 9

CMPC3P2Y 2. Literature Review
price and moving averages can provide vital information about future trends.
• External Price Movements - Movements in external bookmaker prices, espe-
cially if multiple bookmakers are trending this can represent false pricing or
a high demand. An arbitrage strategy highlighted in Constantinou and Fenton
(2012) uses the website Oddschecker (www.oddschecker.com) to compare the
odds across a range of bookmakers.
• The Book Percentage - Not so much a sign of a market swing, however if the
book percentage is tight (close to 100%) then the odds are less likely to drop
than if the book percentage was loose. This is because dropping below 100%
would mean it would be possible to back all selections at their current prices
and make a profit for this reason the book percentage will very rarely dip below
100%. Therefore the if the book percentage is close to 100% the odds are unable
to increase anymore as this will lower the book percenatage further
• Momentum - When a selection begins to move in a particular direction it can pick
up momentum as traders adopt a frenzy like attitude to all get in on the market
movement. Docherty and Eastion (2011) explore this concept with a trading strat-
egy for the 2008 Ryder cup sports market by trading over short term (1 minute)
momentum periods.
Nordsted explains no one factor is the key to predicting the market direction, appropriate
consideration of all factors is needed, however the main market mover is money.
2.3.4. Scalping
Scalping is the second of the two techniques referred to by Webb. Scalping involves a
very short term trade which is often only active a number of seconds before it is closed.
To scalp a market the trader is looking to take a very small market movement in each
direction. A trade is opened with the intention to sell at one point below the original
value, an ideal market to employ the scalping technique would be on a selection that has
no real trend correlation, a simple one point move is all that is required. Unlike swing
trading scalping does not require as much prediction of which way the market is going
Reg: 84 10

CMPC3P2Y 2. Literature Review
to move it simply just requires 2 bets (1 back and 1 lay to be matched next to each other.
Bets (2012) discusses various scalping techniques:
• Low volume scalping - This technique involves getting money down early on
odds that don’t have much liquidity, this therefore places the trader at the front of
the queue for money waiting to be matched. If the trader can manage to get fairly
near the front of the queue on each side of the market and the odds are sustained
then both bets will be matched and a profit is locked in.
• Range scalping - This technique involves finding the upper and lower thresholds
of a selections trading activity. This may not be apparent in all markets however
some selections will tend to trade between a set of virtual limits. Range scalping
involves identifying these thresholds placing marker trades at these positions and
then sell at one point below the threshold.
• Trend scalping - Similar to swing trading the trader looks to predict the direction
of the market, opening a position in the market and immediately exiting if the
market moves 1 point in the predicted direction. A 1 point stop loss is normally
used to suggest that the key to trend scalping is to get over a 50% success rate as
a successful scalp would result in +1 point and a negative scalp results in âAS1
point.
2.4. Time Series Data Analysis
Betfair data can be defined as a type of time series data. A time series is a sequence of
consecutive data points, measured at equally spaced time intervals. A trend is the way in
which a variable changes over these time periods. There are various techniques used to
analyse time series data. In order to effectively predict the future market direction and
other trading opportunities, consider the various approaches and techniques that can be
used to design and build an effective trading algorithm for market analysis and analysis
of historical data.
Reg: 84 11

CMPC3P2Y 2. Literature Review
2.4.1. Machine Learning
As the problem description is to classify the future market direction of a given mar-
ket based on a set of market conditions the variable we want to classify is discrete, as
the market direction will either go up or down. Therefore we will look at the various
machine learning classification algorithms which could be used. In Ovregard (2008)
market analysis and future price predictions are done using an artificial neural network
(ANN). A neural network can be defined as "a computing system made up of a num-
ber of simple, highly interconnected processing elements, which process information
by their dynamic state response to external inputs" Caudill (1987) ANN algorithms can
be trained using a set of training data. Ovregard and Oyviind Norstein use historical
data of the tennis in play markets to train their algorithm to classify a profitable or
non-profitable trade based on a set of condition variables or neurons. To develop and
train the algorithm The Fast Artificial Neural Network (FANN) open source software
was used. ANN algorithms have also been used in other financial markets, Pissarenko
(2002) explores the use of neural networks for financial time series prediction, a train-
ing algorithm is used to find the optimum weights between neurons that determine the
global minimum of the error function.
2.4.2. Case Based Reasoning
Another approach used by Alberola and Garcia-Fornes (2013) is to use a case based
reasoning classification algorithm to predict future odds by finding similarities with
past events. The algorithm will also find the best trading decision based on the current
conditions of the event. The algorithm was tested on the football over/under 2.5 goals
market against a set of 11 human traders with varied experience on betting exchanges,
the CBR algorithm scored the highest yield percentage of +8.5%.
2.4.3. Other Machine Learning Algorithms
There has been various work done on using machine learning algorithms to attempt to
correctly predict results of sports events. In M.B. Kim (2008) a rule-based reasoning
and Bayesian network model is used to predict football results. Historical data of pre-
Reg: 84 12

CMPC3P2Y 3. Proposed Trading Strategies
vious games is used as training data. The Bayesian network is a collection of nodes
representing variables that are interconnected by conditional dependencies. Each node
will have a related probability which is used to calculate the probability of an event
occurring. Another interesting algorithm is Support Vector Machine (SVM) seen by
many as the best off-the-shelf machine learning algorithm Liu and Lai (2010). SVM
is a binary linear classifier so it will classify an object as either one output or not the
output, which would suit the trading problem as there is only two market directions up
and down. SVM classifiers work by assigning objects a position in space which can be
clearly divided into two outputs.
3. Proposed Trading Strategies
Based on reasearch findings, two trading strategies are presented strategy A takes ad-
vantage mainly of the weight of money influence on the market whereas strategy B takes
advantage of trading in non volatile markets.
3.1. Strategy A
Unlike most trading strategies that are aimed at exploiting swings in volatile markets
such as horse racing this strategy is aimed at finding non volatile markets with a non
volatile selection. Upon finding a suitable market and selection a back bet is then placed
at the current lay price. This bet stays unmatched and joins the waiting money queue at
the lay price. As more money is traded on the selection the unmatched bet moves closer
to the front of the queue of waiting money until it is eventually matched to a layer. A
counter lay bet is then placed at the current back price which again stays unmatched
and waiting in the queue. This is now attempting to close the trade for a 1 point profit.
Providing that the market does not drastically move in the opposite direction as long
as the selection either comes down in price or remains the same price as more money
is traded on the selection the unmatched bet once again nears the front of the queue of
money waiting to be matched and becomes matched resulting in a one point profit. For
this reason it is very important to select a non volatile market and selection. As well as
being non volatile it is equally important that the amount of money being traded on the
Reg: 84 13

CMPC3P2Y 3. Proposed Trading Strategies
selection is reasonably high in order to flush the unmatched bets through the queue of
unmatched money. Most football match odds markets are fairly non volatile before the
match begins they also have a high volume throughput which makes them the perfect
target for this strategy. Also to enhance the non volatility factor the draw selection is the
only selection considered for trading as this is the least volatile selection in the market.
Finally this strategy also requires a strict exit strategy, for successful trades a 1 point
profit is the exit trade however as the entry trade will remain unmatched for a period of
time, it is important to keep monitoring the market and the selection to ensure that that
the conditions remain in the prime state. If the position deteriorates then the unmatched
bet can be cancelled with no profit or loss. Likewise if the entry trade does get taken and
then the position starts to deteriorate it is still possible to exit at the same price, this is
because the entry back trade was matched at the current lay price, therefore the current
lay price is still available to lay, simply issuing a lay bet at the current odds would result
in a scratch trade. In the unlikely event that the unmatched bet gets taken and the market
moves drastically in the wrong direction a stop loss of 1 point will be triggered to exit
with a 1 point loss.
3.2. Strategy B
Strategy B is aimed at exploiting holes in the market. With the same initial strategy as
strategy A a non volatile but high volume market and selection are required, so again
pre football match odds markets are selected and the draw is the selection of interest.
The market is then monitored for areas where there is a considerably low amount of
money waiting to be matched, supported by a large amount of money one place to the
right. This can be seen below in figure 3.1 with West Ham.
www.betfair.com/exchange
Figure 3.1: English Premier League - Relegation
Reg: 84 14

CMPC3P2Y 4. Modelling Betfair Historical Data
The hole is at the 3.45 odds as there is a small amount of money here, however it
is also backed up by a large amount of money to the right at 3.5. The hole should
be approximately 5 times less than money waiting at the current price with a support
amount of at least three times more than the money waiting at the current price. The
trade is then entered at the position of the hole, if the selection odds move in the correct
direction then the unmatched bet will be extremely close to the front of the queue with
a larger amount of unmatched money as this will now be the current available lay price.
The exit strategy is the same as in strategy A.
4. Modelling Betfair Historical Data
4.1. Data Set
To uncover the conditions that effect market movement and direction a data set of betfair
historical data is used. A data set of 10 previous football matches is used. The histor-
ical market data is obtained from Fracsoft a company that records and stores exchange
data from a variety of betfair markets. As this work focuses on developing a low risk
strategy, pre in play football match odds markets are the only markets considered as
data candidates. The ten markets where selected at random from a range of different
leagues and competitions to ensure that most market domains were represented. En-
glish Premier League, Italian Serie A, Spanish La Liga, German Bundasliga, European
Champions League and Internationals where all represented. The data obtained from
Fracsoft contains records of each selection in the market updated every second contain-
ing the following data fields:
• Back and lay Odds - The best three available back and lay prices, in figure 4.1
these are represented by the columns BP1, BP2, BP3, LP1, LP2, LP3.
• Back and lay amounts waiting to be matched - The amount of unmatched
money waiting to be matched on each of the best three available back and lay
prices. In figure 4.1 these are represented by the columns BV1, BV2, BV3, LV1,
LV2, LV3.
Reg: 84 15
CMPC3P2Y 5. Proposed Hypotheses
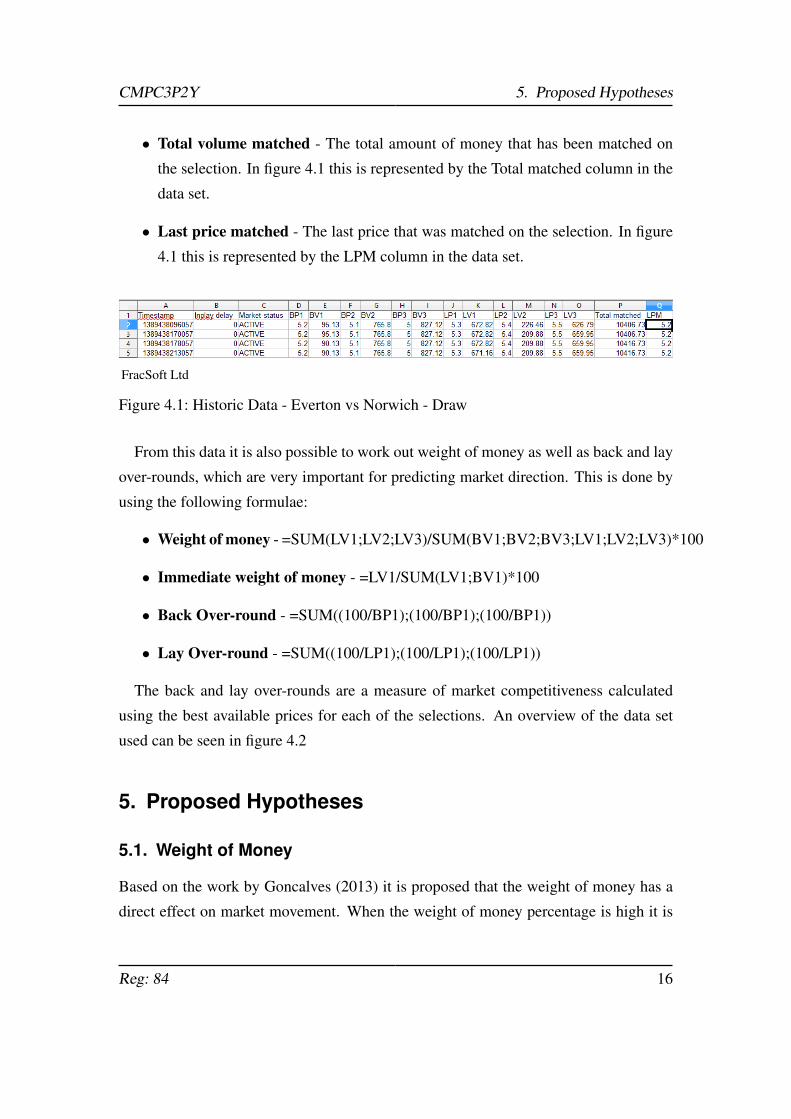
• Total volume matched - The total amount of money that has been matched on
the selection. In figure 4.1 this is represented by the Total matched column in the
data set.
• Last price matched - The last price that was matched on the selection. In figure
4.1 this is represented by the LPM column in the data set.
FracSoft Ltd
Figure 4.1: Historic Data - Everton vs Norwich - Draw
From this data it is also possible to work out weight of money as well as back and lay
over-rounds, which are very important for predicting market direction. This is done by
using the following formulae:
• Weight of money - =SUM(LV1;LV2;LV3)/SUM(BV1;BV2;BV3;LV1;LV2;LV3)*100
• Immediate weight of money - =LV1/SUM(LV1;BV1)*100
• Back Over-round - =SUM((100/BP1);(100/BP1);(100/BP1))
• Lay Over-round - =SUM((100/LP1);(100/LP1);(100/LP1))
The back and lay over-rounds are a measure of market competitiveness calculated
using the best available prices for each of the selections. An overview of the data set
used can be seen in figure 4.2
5. Proposed Hypotheses
5.1. Weight of Money
Based on the work by Goncalves (2013) it is proposed that the weight of money has a
direct effect on market movement. When the weight of money percentage is high it is
Reg: 84 16

CMPC3P2Y 5. Proposed Hypotheses
Figure 4.2: Data Set Overview
proposed the price will decrease. Likewise when the weight of money percentage is low
it is proposed the price will increase.
5.2. Back and Lay Over-rounds
It is proposed that as each side of the market becomes more competitive the price is
affected. It is proposed that a low back over-round represents a highly competitive price
and therefore will result in a price decrease. Likewise it is proposed that a low lay
over-round represents a less competitive price for laying and therefore the price will
decrease.
5.3. Lowering Risk
The underlying concept of both trading strategies is to lower risk by trading on less
volatile markets and selections. This is achieved by choosing to trade on markets and
selections in which the odds do not move big amounts in any particular directions. Both
strategies are designed to only gain one point on the price a technique which is often
referred to as scalping Webb (2013).
Due to the design of these strategies it is proposed that it is possible to trade on
non volatile markets gaining a one point profit. Reverse buying and selling is also
introduced which shows that it is possible to trade gaining a one point profit without the
odds moving at all.
Reg: 84 17

CMPC3P2Y 6. Data Analysis
5.4. Volume Spikes
A volume spike is a large amount of money traded on a market selection in a short
amount of time, volume spikes are often one large trade. Although neither of the pro-
posed strategies directly rely or take advantage of volume spikes to make predictions,
it is proposed as a factor that affects market direction to bolster the weight of money
concept and show how large amounts of money affect market direction.
6. Data Analysis
This section shows analysis of how proposed factors such as weight of money and over-
rounds affect market direction and discusses whether they can be used to predict market
direction on live data. Also methods of lowering risk such as identifying and trading on
less volatile markets are explored as well as identifying risks such as volume spikes.
6.1. Methods of Analysis
In order to analyse the affect weight of money and over-rounds have on market direction
all points of price movement in the series are analysed. The mean of the ten closes points
to the movement are used obtain relevant values, this is shown in figure 6.1
Reg: 84 18

CMPC3P2Y 6. Data Analysis
Time series analysis methods
As can be seen in figure 6.1 the grey shaded areas are the areas of interest. In this
figure there are four price movements. For each of the movements the ten points of
interest before the movement occurs are analysed. When analysing the affects of weight
of money the mean weight of money percentage of these 10 points is calculated as a
representation of the value before the movement occurs. To fit hypothesis the weight of
money will be high when prices move down and low when prices move up. Therefore
to give a score of success when the movement is a price increase 100 is subtracted from
the weight of money so as to return a score of successful prediction. For example:
Mean weight of money before price increase = 30%
Score = 100 - 30 = 70
For downward movements the weight of money percentage is simply used. For ex-
ample:
Reg: 84 19

CMPC3P2Y 6. Data Analysis
Mean weight of money before price decrease = 70%
Score =70
This therefore shows that an equal score of correctly predicting movements in both di-
rections to fit the expected model. Similarly if the results do not fit the expected model
a low score will be awarded. For example:
Mean weight of money before price increase = 60%
Score = 100 - 60 = 40
After all movements scores have been calculated the mean score across the market is
calculated to give an overall measurement of fit to the expected model.
When analysing the affect back and lay over-rounds have on the market the same
method of selecting the ten points before every movement is used, with the mean value
used. As the expected model of this distribution follows the odds ie. When the odds
move down both the back and lay over-rounds move down, the mean over-rounds of
each market are calculated per up and down movement. This is shown per market as:
- Mean back over-round when the price decreases
- Mean back over-round when the price increases
- Mean lay over-round when the price decreases
- Mean lay over-round when the price increases
This allows the comparison between the values of the over-rounds when the prices
increase and decrease. The expected model shows that the mean back and lay over-
rounds when the price decrease should be lower than when the price increases.
As well as exploring factors that affect market direction, it is also necessary to explore
selecting and measuring volatility. Lowering risk is an important factor for both strate-
gies. To measure volatility the standard deviation of the series is calculated to measure
how much the price moves.
Reg: 84 20

CMPC3P2Y 6. Data Analysis
6.2. Results
6.2.1. Weight of Money
After running the analysis on all markets the following results can be observed.
As can be seen from the graph, all ten of the markets had a higher score than 50,
with the Arsenal vs Man Utd market achieving the highest score of 56.19264876633. If
the weight of money concept had no affect on the market direction then the distribution
would be centred more at around the 50 mark to suggest that there is an even probability
Reg: 84 21

CMPC3P2Y 6. Data Analysis
of market direction. In contrast we observe a distribution in favour of higher scores with
the mean score across all markets 52.922114579%. Overall it can be observed that all
markets fit the statistical model of inverse proportion reasonably well. However we do
notice throughout that in some cases movements are made in the unexpected direction.
For example in the Chelsea vs Man City market an upward price movement is made
when the weight of money percentage is as high as 67.7334382828% also a downward
movement is made when the weight of money percentage is just 46.1343916164%. Al-
though these are often rare throughout and this particular market achieved a reasonably
high score above the mean at 53.24720877% thanks to a lot of other movements fitting
the expected model, it is important to be aware that it is possible to move unexpectedly.
As is stated at the beginning the goal is not to find a sure fit way to make successful
trades every single time, it is simply to find an edge in order to make more successful
trades than unsuccessful.
Looking more in depth at the weight of money concept the above figure shows the
last price matched for the draw plotted against the weight of money percentage in the
Chelsea vs Galatasaray UEFA Champions league second round match. It can be ob-
Reg: 84 22

CMPC3P2Y 6. Data Analysis
served that the weight of money has a clear impact on market direction.
At the start of the series it can be seen that the weight of money initially starts rel-
atively high at 60% gradually dipping below the 50% mark down to 45%, this in turn
encourages a quick price increase by one point only to be struck back down again as the
weight of money rises back over 60%. The weight of money again drops below 50%
triggering the first solid price increase. After a period trading at the new higher odds
the odds begin to fall backed up by a high weight of money percentage peaking just
below the 70% mark. The odds drop and the weight of money continues to maintain
its high value, representing a high demand at the current price. As expected this pushes
the odds down yet again two more times until it finally bottoms out with the weight of
money dropping to just above 50%. The odds then move up one point which doesn’t
exactly fit the model because in order for the price to increase a value of less than 50%
is expected, however this could possibly be explained as a bounce back reaction to the
significantly big drop in the price in such a short period of time. Another rather long flat
stage proceeds with the weight of money continuing to stay high in the early stages an-
other dip in price is expected however the odds stay the same and the weight of money
drops slightly. Next another big price drop is observed with the weight of money in-
creasing dramatically back above 70% peaking at 80% at times. Similarly to the first
steep decrease when the movement ends the price bounces back up despite the weight
of money staying above 50%. This provides solid evidence that the odds and weight of
money are inversely proportional and contribute strongly to the market movements in
both directions.
6.2.2. Back and Lay Over-rounds
After running analysis on all of the markets the following results can be observed.
Reg: 84 23

CMPC3P2Y 6. Data Analysis
The above graph shows the results of analysis on the back and lay over-round. Each
market has a results set containing four results. This include the average back over-
round value when the price moves down. The average back over-round when the price
moves up, the average lay over-round when the price moves down and the average lay
over-round when the price moves up. In order to accept the alternative hypothesis that
both a lower back and lay over-round is more likely to lead to the market price moving
down the average back and lay over-rounds should reflect this in the results. As can
be seen in the results the overall mean back over-round is lower when the price moves
down and slightly higher for price increases. The same can be observed for the lay over-
round overall. However with mean results separated by only 0.0589309472% for the
back over-round and 0.0899720041% for the lay over-round the results remain slightly
in conclusive without a clear difference able to be seen. Also it can be seen on some
markets such as Tottenham vs Liverpool the complete opposite to the expected outcome
is observed, with a higher back and lay over-round leading to drops in the price. As
the over-round is a measure of the book percentage it is a measurement of the whole
Reg: 84 24

CMPC3P2Y 6. Data Analysis
market and not just a particular selection. Therefore this might explain some of the
unexpected results. For example movements on other selections will have an affect on
the over-round.
Looking more in depth at the affect book percentage has on market direction the above
graph shows the last price matched for the draw plotted against both back and lay over-
rounds in the AC Milan vs Roma match. It can be observed how both back and lay over-
rounds have an affect on market direction. This market is fairly non volatile throughout
with only three price movements the entire time. The first of which shows both back and
lay over-rounds reasonably low with the back over-round at approximately 100.6% and
the lay over-round at approximately 99.4%. The second movement is a price increase
in which it can be seen both over-rounds increase beforehand with the back over-round
exceeding 101% at times and the lay over-round exceeding 99.7%, however despite this
both over-rounds return to their original values just before the movement occurs. In the
final price movement towards the end the odds drop and yet again so do both the over-
rounds with the back over-round dropping below 100.2% as well as the lay over-round
dropping below 99%. The data shows clear evidence that in this market over-rounds
have an affect on market direction.
Reg: 84 25

CMPC3P2Y 6. Data Analysis
6.2.3. Trading In Non Volatile Markets
Both strategies that are proposed aim to reverse back and lay in non volatile markets,
meaning entering an unmatched back bet at the current lay price joining the queue of
money waiting to be traded at the higher price. If the price does not move in any direc-
tion then a reverse lay bet is fired meaning that an unmatched lay bet is entered at the
current back price again joining the queue of money waiting to be traded on the back
side of the market. Once both bets become matched this results in a one point profit
gain. This type of trading does not even require the market to move in any direction
therefore it has a very low risk association, which is exactly as planned per strategy.
The figure below shows how this is possible.
The figure shows the last price matched plotted against volume of money traded for
the AC Milan vs Roma match for the draw selection. As can be observed in the above
time period between 17:20 and 19:22 the odds stay the same with the back price at 3.45
and the lay price at 3.40. The columns along the bottom show amounts of money traded.
Throughout the series it can be seen large amounts of money being traded on both sides
of the market. In fact at the start of the series a total volume of £121,584.35 has been
traded on the selection, at the end of the series a total of £245,302.02 is traded showing
a total of £123,717.67 traded in the above time period whilst the market stays still. This
shows that there is enough traded volume throughout the series to queue on both sides
of the market, waiting for each bet to become matched. No movement is required.
In order to gauge how volatile a market is likely to be, working out the standard
deviation of the last price matched can be used. The standard deviation works out
Reg: 84 26

CMPC3P2Y 6. Data Analysis
how much the set of points deviate from the mean. Therefore if the market moves a
considerable amount the standard deviation value will be high, whereas if there is little
movement the standard deviation will be low. The formula used to work out standard
deviation is shown below.
Where n is the number of data points x bar is the mean of the data points and xi is
each individual point in the series. As the range between odds differ at different values
such as odds trading at 1.78 and 1.79 have an offset of just 0.01 whereas odds trading
at 4.2 and 4.3 have an offset of 0.1 the resulting standard deviation is divided by the
offset in each of the results. Applying this to all of the historic data set markets is shown
below:
The graph shows each markets standard deviation value after being divided by the
appropriate odds offset. It can be observed that non volatile markets such as the AC
Milan vs Roma match have a much lower value than more volatile markets such as
Reg: 84 27

CMPC3P2Y 6. Data Analysis
Everton vs Norwich and Man City vs Chelsea. AC Milan vs Roma shows a standard
deviation value of just 0.5799206691 whereas Everton vs Norwich and Man City vs
Chelsea show values of 1.48208257 and 1.932407519. The mean across all markets is
shown as 1.054980683. Working these values out during live analysis can be very useful
to provide a measure of volatility, limiting risk is very important for both strategies.
6.2.4. Volume Spikes
When large sums of money enter the market they represent a high demand, similar to on
a stock exchange if an organisation buys a large amount of shares in a particular stock,
this represents a demand at the current price and drives the share value higher. This can
also be seen on the betting exchange.
The above graph shows the last price matched plotted against the volume of money
traded on the Man City vs Chelsea match on the draw selection. The volume spikes are
shown by the tall grey columns. In this series there are three main price movements all
decreasing the price. Just before the first price drop a volume spike of just under £3000
is shown, resulting in the odds being forced down. Again just before the next price
drop another slightly smaller spike of just over £2000 forces the price down yet again.
Finally before the last dip yet another volume spike can be seen of just under £4000
forcing the price down even further. This shows that large amounts of money entering
the market can influence market direction. Volume spikes can be dangerous as they can
Reg: 84 28

CMPC3P2Y 6. Data Analysis
happen very suddenly shifting the market in either direction.
6.3. Conclusions
The historic data analyses has unearthed a variety of factors that influence market direc-
tion. The results of the analysis will be used in constructing rules in which to set when
analysing live data.
Firstly it is shown that the weight of money concept has an inverse relationship to
price, this means that when the weight of money increases the odds are likely to drop,
likewise if the weight of money decreases then it is likely that the odds will increase.
With all markets scoring higher than the 50 marker representing the even probability of
no relation and a mean score of 52.9221145 the hypothesis can be accepted.
The second factor identified as a market influence was the back and lay over-rounds,
although not as strong a relationship as the weight of money concept it is still observed in
the overall mean that a lower back and lay over-round lead to the odds decreasing while
a high back and lay over-round lead to an increase in price. However due to the over-
rounds being affected by other selections which in turn showed some markets showing
unexpected results where high back and lay over-rounds lead to price decreases and low
back and lay over-rounds lead to increases, the hypothesis can not be fully accepted as
a controllable factor.
It is confirmed and proven that trading in non volatile markets is possible even when
the odds do not change at all. A method of analysing the standard deviation on the last
price matched data points has been identified as a method to measure volatility. Trading
in less volatile markets means that the odds do not move much and therefore there is
less risk involved in trading on these markets.
Finally volume spikes were identified as another factor that influences market direc-
tion, the conclusions on this are some what of a warning moving ahead showing that
large amounts of money can move the market in either direction. Both strategies do not
use volume spikes as a method of predicting direction as volume spikes occur quickly
and have an immediate affect. Both the proposed strategies are grounded on long term
trading focusing on lowering risk which is not what volume spike trading provides.
Reg: 84 29
CMPC3P2Y 7. Implementation
7. Implementation
After carrying out extensive research and analysis on historic data markets, the findings
are used to construct a tool which interacts with the Betfair exchange via the API acting
on rule based thresholds. An Android application is also developed as a user interface
displaying existing trades. In order to communicate between the tool and the application
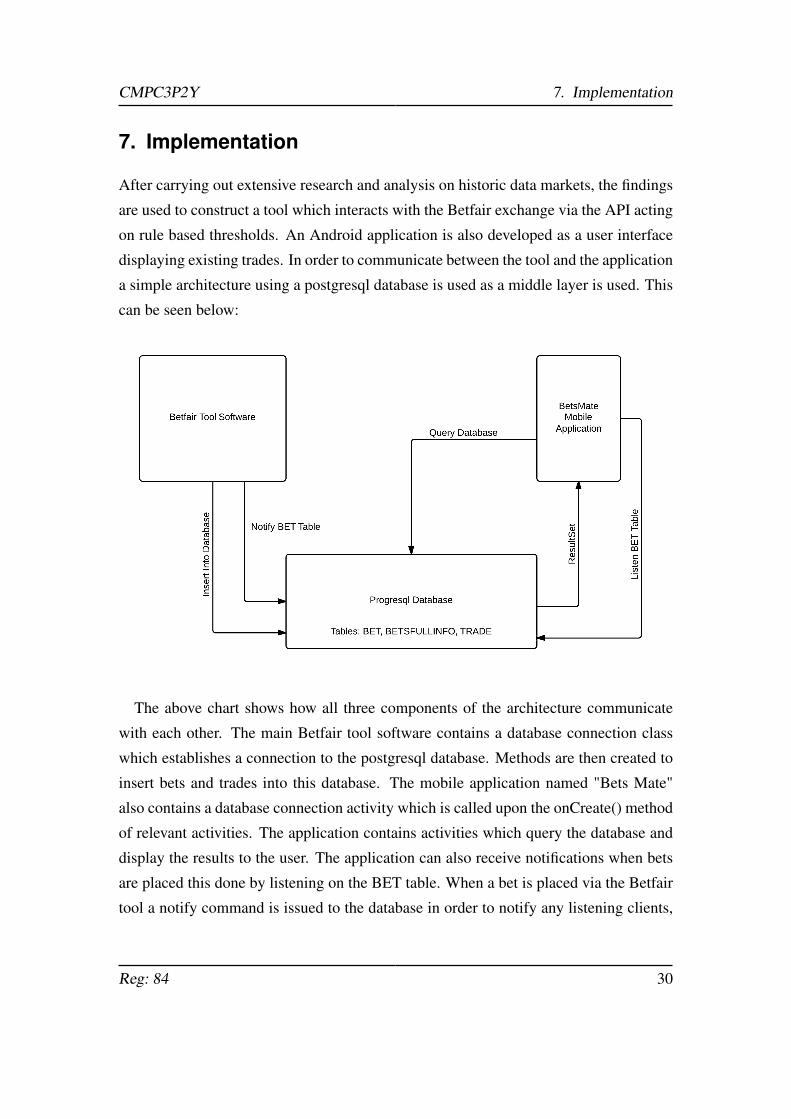
a simple architecture using a postgresql database is used as a middle layer is used. This
can be seen below:
The above chart shows how all three components of the architecture communicate
with each other. The main Betfair tool software contains a database connection class
which establishes a connection to the postgresql database. Methods are then created to
insert bets and trades into this database. The mobile application named "Bets Mate"
also contains a database connection activity which is called upon the onCreate() method
of relevant activities. The application contains activities which query the database and
display the results to the user. The application can also receive notifications when bets
are placed this done by listening on the BET table. When a bet is placed via the Betfair
tool a notify command is issued to the database in order to notify any listening clients,
Reg: 84 30
CMPC3P2Y 7. Implementation
in this case the application will acknowledge the notify and update via its notification
activity.
7.1. Automated Betfair Tool
For both strategies it was important to set up a framework to model both market and
selection data. To do so Java classes were set up to model a market and a second for
selection. This includes data such as current odds, amount of unmatched money, volume
statistics and other information. With this data key calculations such as working out the
weight of money and both back and lay over-rounds can be calculated. This data is also
stored in the Market and Selection classes as private fields. Market and Selection objects
can therefore be constructed to model the exchange data. The exchange framework is
modelled with 8 java classes which include:
• Market - Contains all information about a particular market such as market vol-
ume, back and lay over-rounds, market Id’s and names.
• Selection - Contains all information about a particular selection such as selection
volume, back and lay odds, available unmatched money, last price matched and
weight of money.
• MarketSelections - A MarketSelections Object contains a Market object and an
ArrayList of Selection objects that belong to the market.
• ExHeader - Sets up a connection to the exchange API by constructing an API
request header with a private session token.
• GlobHeader - Sets up a connection to the global API by constructing an global
API request header with a private session token.
• Bet - Stores information once a bet has been fired into the exchange, this contains
information such as the odds, volume, market and selection Id’s.
• Trade - Contains two Bet objects to model a trade. Trade objects are constructed
after a back and lay bet have been placed on the same selection.
Reg: 84 31

CMPC3P2Y 7. Implementation
• DatabaseConnect - Sets up a connection to the postgresql database.
In the main class targeted markets are selected to suit the proposed strategies, there-
fore they are required to have a reasonable market volume and be the match odds mar-
kets of football matches at least 3 hours before the kick-off. An ArrayList of Market
objects is used to store the relevant markets selected on the criteria. After the markets
have been selected the initial data is modelled into the Selection objects using various
API calls, finally when both market and selection data has been modelled a MarketS-
elections object can be constructed to represent a full model of the market. Once the
initial data has been modelled the market needs to be monitored for the purpose of
discovering the market volatility.
To do this a separate thread is launched which tracks the market prices and stores
them every 30 seconds. This thread is run for an hour in order to get a good idea of how
volatile the market and selections are. As was discovered in the data analysis in order
to work out a metric for volatility the standard deviation of the last price matched over
the hour is used. As well as the monitor thread another thread is launched to constantly
update the market and selection data, for both threads they are constructed with one
MarketSelections object, therefore multiple markets can be analysed at the same time to
increase ïnAnding optimum trading opportunities. The monitor and update threads are
run continuously, with the main thread set to sleep for 1 hour whilst the monitor thread
gathers market information.
The main thread is awoken when the monitor threads initial work is done, however
the monitor thread continues to record market prices and adjust the standard devia-
tion as appropriate. Meanwhile another thread is launched which is designed as an
entrance trigger. Again each MarketSelections object will construct an entrance trigger
thread called EntryTrigger, whose sole purpose is to wait until all the conditions of ei-
ther strategies are met, upon all conditions being met such as correct weight of money,
over-rounds, standard deviation and volume, a boolean variable is set to true and an
entrance bet is fired into the exchange at the current lay price as discussed in the strate-
gies. This is done using another call to the Betfair API. Once bets have been placed on
the exchange they are recorded and modelled by the Bet class. A row is also inserted
into the BET and BETSFULLINFO table in the database. Fiinally when a bet is placed
Reg: 84 32

CMPC3P2Y 7. Implementation
another thread is started called BetStatusUpdate whose sole purpose is to update the bet
status as unmatched or matched. This is very important as to switching between the two
exit triggers which are discussed below.
There are two exit triggers, the first of which is designed to either cancel unmatched
bets if conditions deteriorate to a point where the trade no longer looks appealing or to
fire a counter lay bet if the entry bet becomes matched. If the counter bet is fired then the
second exit trigger becomes active whose purpose is to either attempt to sell for a scratch
trade if available or cut losses at a 1 point loss if the open position deteriorates. This is
launched as soon as the entry bet becomes matched as a separate thread called StopLoss,
the StopLoss thread constantly checks the current lay price and if it slips by one point
in the wrong direction it will sell the bet immediately incurring a 1 point loss. This is to
ensure that no big losses are incurred. As soon as the counter lay bet becomes matched
the trade is complete, another row is inserted into the BET and BETSFULLINFO tables
as the lay bet. A Trade object is constructed and sent to the TRADE table in the database
containing information of both the back and lay bets. Finally as the trade is complete
the associated threads are killed.
7.1.1. Trading Thresholds and Rules
Using the findings from the data analysis a set of rules and thresholds can be set in order
to predict market direction. Focusing only on price decreases the following rules were
used.
Entering the exchange:
• Weight of Money - Due to discovering a strong relation between market direction
and weight of money this was set fairly high at 65% or higher.
• Immediate Weight of Money - The immediate weight of money is defined by
the weight of money just of the current back and lay prices. This threshold is set
to greater than 60% but no more than 90%. The reason for this is that because
when reverse backing at the lay price if the immediate weight of money is above
90% then it is unlikely that the unmatched bet will get matched in time before the
price moves. This is also a sign of a volatile market which is not the target.
Reg: 84 33

CMPC3P2Y 7. Implementation
• Back Over-round - A back over-round percentage of less than or equal to 100.6%
due to a slight correlation between low over-rounds and prices decreasing found
in the earlier analysis. As well as the slight correlation found during analysis,
due to the book percentage being capped at 100% due to arbitrage rules the closer
the over-round is to 100% the more this reflects that odds can not get any higher,
therefore one selection will have to move down.
• Lay Over-round - A lay over-round percentage of less than or equal to 99.5%.
Again due to a slight correlation between low over-rounds and prices decreasing
found during analysis, and book percentage rules.
• Standard Deviation - A standard deviation of less than or equal to 0.9. As has
been mentioned lowering the risk and trading on less volatile markets is key to
both strategies so a fairly stern threshold is used here, 0.154980683 below the
mean values found during analysis.
• Volume - It is important that the market and selection have enough liquidity to
trade on, this is to both push trades through and also stabilise the market. For this
reason the final rule is that there must be at least £200 on each side of the market
on the current back and lay prices.
Cancelling unmatched Bets:
Cancelling an unmatched bet was dependent on the position in the queue of money
waiting to be matched. For example if the money is right at the back of the queue and
the position deteriorates then it is more worthwhile cancelling the bet. Whereas if the
money is near the front of the queue then it is more likely to become matched sooner
inviting leniency in case the position materialises again. Also if the money is near the
front of the queue this means that there is money behind the current bet which means
even if the bet gets matched and the position deteriorates there is still money available
at the same price to scratch the trade immediately for no loss. In order to calculate the
position in queue the amounts of money traded and waiting are stored in the Bet class
when a bet is placed. This can then be checked against the current amounts matched
Reg: 84 34

CMPC3P2Y 7. Implementation
and waiting to work out position. For example:
difference = current total matched - bet total matched
If the current amount waiting is less than the amount available when the bet was made
take the difference from the amount waiting currently.
position = current amount waiting - difference
Else the current amount available must be more than the amount available when the
bet was made so take the difference from the amount waiting at the start of the bet as
more money has come on top, therefore the money is further down the queue.
position = amount waiting when bet was placed - difference
The percentage distance to the front can then be calculated as:
percentage distance to the front = 100 - ((position/current amount waiting)*100)
Therefore depending on the position in the queue cancelling an unmatched bet looks
at the immediate weight of money to asses whether the bet needs to be cancelled. If the
percentage distance in queue is less than 20% then if the immediate weight of money
drops below 30% it is cancelled. If the position in queue is between 20% and 50% a
threshold of 20% is used, and a position above 50% a threshold of 10% is used.
Scratch Trade:
In order to fulfil a scratch trade the same concept of queueing is used as for cancelling
an unmatched bet. However this time when the thresholds are exceeded a lay bet is
placed at the same odds as the matched back bet which therefore lays the bet for the
same as what it was backed at resulting in a scratch trade, no profit and no loss.
Stop Loss:
Reg: 84 35

CMPC3P2Y 7. Implementation
The stop loss is triggered if the price exceeds one point above the odds the back bet
was matched at. As soon as this occurs an immediate lay bet is fired into the exchange
cutting losses to one point.
7.2. User Interface
In addition to the software, a mobile application is also used as the main user interface.
The application is to be run on android devices. The application uses the Android 8
API. The purpose of the application is to display information to the user on any existing
or new trades that the tool is working on, as well as an overall profit/loss figure based
on previous trades. The app consists of 5 activities which include:
• MainActivity - The main activity is the main screen which is loaded upon open-
ing the application. This activity is fairly simple and contains two buttons, the first
of which takes the user to the ShowBetsActivity which displays current trades in
progress, the second of which takes the user to the ShowProfitLossActivity which
shows the user their current profit /loss figure on screen. The main activity also
establishes a connection to the postgresql database using a database connection
class called DBHelper. This in turn issues the LISTEN command on the BET
table in order to receive notifications on new bets.
• ShowBetsActivity - This activity is started by the main activity and shows the
user a list of current bets in progress on the exchange. The activity queries the
BET table to receive a results set of the bets stored in the table. Bets are displayed
on screen to the user showing which market the bet was placed on, whether it is
matched or unmatched, and the odds at which it was placed. If the bet is a back
bet it is displayed in light blue whereas if it is a lay bet it is displayed in light pink
as to fit with the Betfair colour scheme. Each bet is displayed in a table which
is click-able, clicking on an entry takes the user to the BetDetailsActivity which
shows more information about the bet.
• BetDetailsActivity - This activity is started by the ShowBetsActivity and shows
more information about the bet which was selected by the user. The id of the bet
Reg: 84 36

CMPC3P2Y 8. Results
is parsed to the activity via an Intent which can then be received to and used to
query the BETSFULLINFO table which returns more detailed information about
the bet including, weight of money, immediate weight of money, back and lay
over-rounds, standard deviation and links to both the market and selection on the
Betfair exchange.
• NotificationsActivity - This activity is started when the application receives a
NOTIFY command from the Betfair tool. The activity displays a pop up on screen
showing the new bet that has been placed.
• ShowProfitLossActivity - This activity is started by the main activity when the
user clicks the show profit/loss button. The activity simply shows the user their
current profit/loss figure on screen by querying the TRADE table in the database.
8. Results
Because of the API limits restricting access to the API by a maximum of 10 requests per
minute for a free access account in order to gather a good set of results the full personal
access account was purchased. This allows unlimited API calls therefore multiple mar-
ket analysis was possible. The tool was run for 20 days starting 19th April and ending
8th May. Trades where limited to £2 each meaning profits and losses were limited to a
few pence. A total of 39 trades where completed during this period. A table of results
are shown below:
Reg: 84 37

CMPC3P2Y 8. Results
The results show that over the 20 day period 39 trades were entered with an overall
cumulative profit of 42 pence. Only 4 of the 39 trades resulted in a loss the biggest of
which -7 pence in the Manchester United vs Sunderland match in which the stop loss
was triggered. The total of the four losses accumulates to 17 pence. 18 of the 40 trades
were successful the largest of which was in the Norwich vs Liverpool match for 6 pence.
The total of the profit accumulated by the 18 successful trades was 59 pence. 2 of the
trades were cancelled before they became matched due to the position deteriorating. It
is possible that more trades did this as an unmatched bet is not recorded in the database
observing this behaviour first hand was the only way in which they these types of trades
were recorded. 6 of the trades were cancelled at in play, this was most commonly
because the odds moved down before the entrance bet became matched. Finally 9 of the
trades resulted in a scratch trade where the bet was sold for the same odds as the back
price resulting in no profit and no loss.
Reg: 84 38

CMPC3P2Y 9. Conclusion
8.1. Strategy Success
Of the 39 trades the most commonly triggered strategy was strategy A with 32 trades
compared to only 7 which were triggered by strategy B. In comparison just 1 of strategy
B trades was unsuccessful, 4 were successful, 1 were cancelled and 1 was a scratch
trade. 3 of strategy A trades were unsuccessful 14 were successful 7 were cancelled
and 8 were scratch trades. Both strategies faired very well with strategy A profiting 37
pence and strategy B profiting 5 pence.
The overall results can be seen to steadily increase in profit shown in the graph below:
9. Conclusion
To conclude, based mainly on the work by Goncalves (2013) and Nordsted (2009) as
well as Webb (2013) and Heathcote (2012) four main factors of market influence have
successfully been identified and tested with extensive data analysis. Weight of money,
book percentage, market volatility and volume spikes were all shown to have an af-
fect on market direction. Integrating these factors a multithreaded automated peice of
software was developed. Live market data was able to be monitored and scouted for a
combination of the four influencing factors to predict market movements. The results
Reg: 84 39

CMPC3P2Y 9. Conclusion
show both strategies were very successful, such that only 12.5% of the trades resulted
in a loss in turn resulting in a 21% cummulative profit on stake over the 20 day period.
Reg: 84 40

CMPC3P2Y REFERENCES
References
Alberola, M. J. and Garcia-Fornes, A. (2013). Using a case-based reasoning approach
for trading in sports betting markets. Springer US.
Betfair (2013a). Betfair developers program. http:// bdp.betfair.com/ index.php?option=
com_frontpage&Itemid=1.
Betfair (2013b). Betfair developers program - compare access types. http:// bdp.betfair.
com/ index.php?option=com_content&task=view&id=36&Itemid=64.
Bets, . L. C. (2012). Betfair scalping trading techniques explained. http:// latest.
letscomparebets.com/ betfair-scalping-trading-techniques-explained/ .
Blincoe, R. (2010). How i went from punting pcs to betting a quarter billion
on betfair. http:// www.channelregister.co.uk/ 2010/ 12/ 06/ channel_man_turns_over_
quarter_billion_on_betfair/ .
Caudill, M. (1987). Neural networks primer, part 1. AI Expert Volume 2.
Christiansen, J. (2007). Prediction markets practical experiments in small markets and
behaviours observed. The Journal of Prediction.
Constantinou, A. and Fenton, N. (2012). Profiting from arbitrage and odds biases of
the european football gambling market. The Journal of Gambling Business and Eco-
nomics.
D.C. Edelman, N. O. (2004). Tote arbitrage and lock opportunities in racetrack betting.
The European Journal of Finance.
Docherty, P. and Eastion, S. (2011). Market efficiency and continuous information ar-
rival: evidence from prediction markets, pages 2461–2471. Routledge.
E. Franck, E. Verbeek, S. N. (2009). Inter-market arbitrage in sports betting. Technical
report, University of Zurich.
Goncalves, R. (2013). High Level Architecture for Trading Agents in Betting Exchange
Markets. Springer Berlin Heidelberg.
Reg: 84 41

CMPC3P2Y REFERENCES
Guttman, S. . (1983). Handbook for human-reliability analysis with emphasis on
nuclear-power-plant applications. Technical report, U.S. Nuclear Regulatory Com-
mission.
Heathcote, A. (2012). Horse racing trader [ £0 - £350,000 challenge ]. http://
adamheathcote.blogspot.co.uk/ .
J.E. Berg, F.D. Nelson, T. R. (2008). Prediction market accuracy in the long run. Inter-
national Journal of Forecasting.
Lawler, G. (2006). Introduction to Stochastic Processes, Second Edition. Chapman and
Hall/CRC.
Liu, B. and Lai, P. (2010). Beating the ncaa football point spread. Technical report,
Stanford University.
Lo, Repin, S. (2005). Fear and greed in financial markets: A clinical study of day-
traders, national bureau of economic research. Technical report, NATIONAL BU-
REAU OF ECONOMIC RESEARCH.
Mason, R. (2014). ’fat finger’ spike the latest market mishap. http:// www.smh.com.au/
business/ markets/ fat-finger-spike-the-latest-market-mishap-20140319-35171.html .
M.B. Kim, J. Choe, C. E. H. (2008). A compound framework for sports prediction: The
case study of football, knowledge-based systems.
Nordsted, P. (2009). Mastering Betfair: How to Make Serious Money Trading Betting
Exchanges. Harriman House Limited.
O’Connor, N. (2013). Betting market lessons no 1: Understanding the overround. http:
// www.bettingmarket.com/ overround.htm.
Odean, B. . (2001). Boys will be boys: Gender, overconfidence, and common stock
investment. QUARTERLY JOURNAL OF ECONOMICS.
Ovregard, O. N. (2008). Trading "in-play" betting exchange markets with artificial
neural networks. Technical report, Norweigian University of Science and Technology.
Reg: 84 42

CMPC3P2Y REFERENCES
Pissarenko, D. (2001 - 2002). Neural networks for financial time series prediction:
Overview over recent research. Technical report, Unknown.
S.J. Hardiman, S.T. Tobin, P. R. S. H. (2011). Distributions of certain market observ-
ables in an on-line betting exchange. Technical report, University College Dublin.
Webb, P. (2013). Author archive: Peter webb. http:// www.betangel.com/ blog_wp/
author/ admin/ .
Wolfers, J. and Zitzewitz, E. (2004). Prediction markets. Technical report, NATIONAL
BUREAU OF ECONOMIC RESEARCH.
Wozniak, J. (2011). Inferring tennis match progress from in-play betting odds.
Reg: 84 43

CMPC3P2Y A. Other Examples to Show Weight of Money Affect
A. Other Examples to Show Weight of Money Affect
Reg: 84 44

CMPC3P2Y B. Example Green Screens
B. Example Green Screens
Reg: 84 45