Embed Size (px)
Citation preview

METHODOLOGY Open Access
Automated 4D analysis of dendritic spinemorphology: applications to stimulus-inducedspine remodeling and pharmacological rescue ina disease modelSharon A Swanger1, Xiaodi Yao1, Christina Gross1 and Gary J Bassell1,2*
Abstract
Uncovering the mechanisms that regulate dendritic spine morphology has been limited, in part, by the lack ofefficient and unbiased methods for analyzing spines. Here, we describe an automated 3D spine morphometrymethod and its application to spine remodeling in live neurons and spine abnormalities in a disease model. Weanticipate that this approach will advance studies of synapse structure and function in brain development,plasticity, and disease.
Keywords: dendritic spine morphology, fragile X syndrome, automated image analysis, BDNF, dendritic spineremodeling, live cell imaging, 3D reconstruction, synapse, FMRP, PI3K inhibitor
BackgroundDendritic spines are dynamic, actin-rich protrusions thatform the postsynaptic compartment at most glutamater-gic synapses [1]. Synapse strength is closely correlatedwith dendritic spine morphology, and synaptic activityregulates spine number and shape during brain develop-ment, behavioral learning, and aging [2-4]. In addition,abnormal spine morphology is prevalent in neurologicaldiseases such as intellectual disabilities, autism spectrumdisorders, schizophrenia, mood disorders, and Alzhei-mer’s disease [5-7]. Although many details regarding thespine structure-synapse function relationship remainunclear, it is evident that spine morphology can impactexcitatory neurotransmission and is an important aspectof neuronal development, plasticity, and disease [6,8-10].The lack of automated methods for quantifying spine
number and geometry has hindered analysis of themechanisms linking spine structure to synapse function[11]. Cultured neurons are the primary model systemfor studying the basic mechanisms regulating neuronalstructure and function as these mechanistic studies
require complex designs and large sample sizes in orderto produce meaningful results. While several recentreports have described automated algorithms for analyz-ing neuron morphology in vivo [12-18], few independentstudies have validated these methods [19,20] and thereare no established methods for automated 3D spine ana-lysis in cultured neurons. Son et al. developed an auto-mated spine analysis algorithm using 2D images ofcultured neurons, but 2D analyses do not consider a sig-nificant amount of information including all protrusionsextending into the z-plane [21]. The majority of spinemorphology studies have relied on manual measure-ments, which are time consuming, often biased byexperimenter error and fatigue, and have limited repro-ducibility [14].Here, we present, validate, and apply an automated 3D
approach using the commercially available software pro-gram Filament Tracer (Imaris, Bitplane, Inc.). FilamentTracer has been used for automated spine detection invivo, but geometric measurements were limited to spinehead width [22,23]. Also, we have used Filament Tracerto facilitate spine density calculations in cultured neu-rons, but this analysis required manual validation andextensive editing of false-positive spines [24]. Now, ourimproved approach generates an accurate 3D
* Correspondence: [email protected] of Cell Biology, Emory University, 615 Michael St. NE, Atlanta,GA 30322, USAFull list of author information is available at the end of the article
Swanger et al. Molecular Brain 2011, 4:38http://www.molecularbrain.com/content/4/1/38
© 2011 Swanger et al; licensee BioMed Central Ltd. This is an Open Access article distributed under the terms of the CreativeCommons Attribution License (http://creativecommons.org/licenses/by/2.0), which permits unrestricted use, distribution, andreproduction in any medium, provided the original work is properly cited.

reconstruction without any manual validation. More-over, our approach can be applied to either fixed or liveneurons as well as images acquired using either wide-field fluorescence or confocal microscopy.To demonstrate the applicability of our approach, we
analyzed changes in spine morphology following acutebrain-derived neurotrophic factor (BDNF) application inlive hippocampal neurons. We verified our method byshowing that acute BDNF treatment increased spinehead volume, as was previously published [25]. Further-more, we demonstrated that BDNF application inducedrapid alterations in spine neck and length geometry andresulted in an overall maturation of the dendritic spinepopulation within 60 minutes. We also applied ourmethod to the study of aberrant spine morphology in amouse model of fragile X syndrome (FXS), an inheritedintellectual disability [26]. We not only accuratelydetected the established spine abnormalities in culturedneurons from this mouse model, but we also demon-strated that these abnormalities were rescued by inhibit-ing phosphoinositide-3 kinase activity, a potentialtherapeutic strategy for FXS [24]. These findingsdemonstrate that our approach is an efficient and accu-rate method for investigating dendritic spine develop-ment and plasticity as well as neurological diseasemechanisms and therapies.
Results and discussionAutomated detection and 3D measurement of dendriticspinesThe accurate study of dendritic spine morphologyrequires a method that incorporates effective neuronlabeling with unbiased spine detection and measure-ment. To establish the most effective method for label-ing and detecting spines in cultured hippocampalneurons, we tested several fluorescent markers includingthe lipophilic dye DiI and plasmids encoding solubleeGFP, membrane-tagged eGFP, and mRFPruby-taggedLifeact, a small actin binding peptide [27]. The labeledneurons were fixed, and z-series images were acquiredusing a widefield fluorescence microscope. Followingdeconvolution, the images were analyzed with two dif-ferent software programs: NeuronStudio, a programused for automated 3D neuron tracing in vivo [12], andFilament Tracer (Imaris, Bitplane, Inc.), a commerciallyavailable 3D tracing software. Universal parameters foraccurate automated tracing of a large dataset could notbe identified using NeuronStudio with any fluorescentlabel or using Filament Tracer with DiI-labeled or GFP-expressing neurons (data not shown). However, accurate3D traces were automatically generated from images ofLifeact-ruby-expressing neurons (Figure 1a). While GFPis commonly used for morphological analyses, we foundthat generating accurate traces of GFP-expressing
neurons required extensive manual editing of false-posi-tive spines. Images of Lifeact-expressing neurons couldbe used to generate automated traces with universalparameters and no manual editing. Of note, Lifeact-expressing neurons have been previously shown to exhi-bit normal actin dynamics and dendritic spine morphol-ogy [27,28]. Consequently, we describe here thevalidation and application of an automated spine analy-sis method using Filament Tracer and images of Lifeact-expressing neurons.To generate the 3D reconstructions for spine analysis,
we selected a dendritic region that was 40 - 60 μm inlength and void of dendritic branch points and crossingneurites. A point within the dendrite and at the edge ofthe selected region was assigned as the dendrite startingpoint, and the following parameters were set: minimumdendrite end diameter (0.75 μm; empirically determinedto be the minimum dendritic width enabling accuratetracing), minimum spine end diameter (0.215 μm; 2times the pixel width), and maximum spine length (5μm) [29]. The dendritic segment was then traced andvolume rendered using automatic thresholds withoutany additional manual input or editing. On occasion thealgorithm inappropriately assigned dendritic protrusionsas dendrites instead of spines, so we applied a mathema-tical filter that selected all dendritic protrusions ≤ 5 μmin length and assigned them as spines. To validate theautomated spine detection, spine density was calculatedwithin the same dendritic regions using manual andautomated analyses (Figure 1b). The automated mea-sures accurately predicted the manual spine counts asdetermined by linear regression analysis (Figure 1c) [30].The mean spine density (spines per 10 μm) did not sig-nificantly differ between the manual (4.36 ± 0.46) andautomated (4.47 ± 0.41) analyses (Student’s t-test, P =0.836), but there was a consistent trend toward higherspine density using the automated method. The coeffi-cient of variation was lower for the automated results(0.9) as compared to the manual measurements (0.11),suggesting that automated spine detection was slightlymore reproducible than manual detection.While spine number reflects the quantity of excitatory
synapses, spine geometry is linked with excitatorysynapse function and is also an important outcomemeasure in dendritic spine studies [10]. Spine head sizeis positively correlated with postsynaptic density (PSD)size, cell surface GluA receptor number, and synapticvesicle content in the associated presynaptic terminal[31,32]. Spine length and neck width likely affect cal-cium signaling within spines as well as signaling fromthe spine to the dendrite shaft [33-35]. To evaluate howeffectively our approach measured spine geometry, auto-mated measurements of spine head width, neck width,and length were compared to manual measurements
Swanger et al. Molecular Brain 2011, 4:38http://www.molecularbrain.com/content/4/1/38
Page 2 of 14
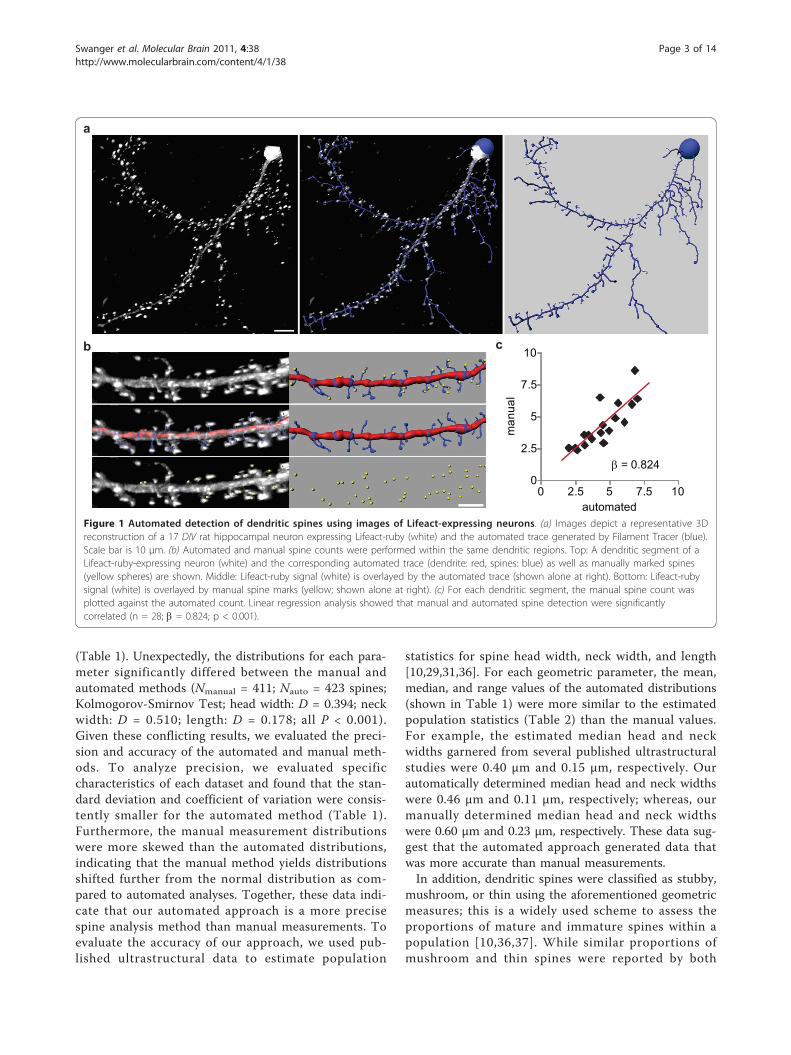
(Table 1). Unexpectedly, the distributions for each para-meter significantly differed between the manual andautomated methods (Nmanual = 411; Nauto = 423 spines;Kolmogorov-Smirnov Test; head width: D = 0.394; neckwidth: D = 0.510; length: D = 0.178; all P < 0.001).Given these conflicting results, we evaluated the preci-sion and accuracy of the automated and manual meth-ods. To analyze precision, we evaluated specificcharacteristics of each dataset and found that the stan-dard deviation and coefficient of variation were consis-tently smaller for the automated method (Table 1).Furthermore, the manual measurement distributionswere more skewed than the automated distributions,indicating that the manual method yields distributionsshifted further from the normal distribution as com-pared to automated analyses. Together, these data indi-cate that our automated approach is a more precisespine analysis method than manual measurements. Toevaluate the accuracy of our approach, we used pub-lished ultrastructural data to estimate population
statistics for spine head width, neck width, and length[10,29,31,36]. For each geometric parameter, the mean,median, and range values of the automated distributions(shown in Table 1) were more similar to the estimatedpopulation statistics (Table 2) than the manual values.For example, the estimated median head and neckwidths garnered from several published ultrastructuralstudies were 0.40 μm and 0.15 μm, respectively. Ourautomatically determined median head and neck widthswere 0.46 μm and 0.11 μm, respectively; whereas, ourmanually determined median head and neck widthswere 0.60 μm and 0.23 μm, respectively. These data sug-gest that the automated approach generated data thatwas more accurate than manual measurements.In addition, dendritic spines were classified as stubby,
mushroom, or thin using the aforementioned geometricmeasures; this is a widely used scheme to assess theproportions of mature and immature spines within apopulation [10,36,37]. While similar proportions ofmushroom and thin spines were reported by both
a
c
= 0.8240
2.5
5
7.5
10
0 2.5 5 7.5 10m
anua
lautomated
b
Figure 1 Automated detection of dendritic spines using images of Lifeact-expressing neurons. (a) Images depict a representative 3Dreconstruction of a 17 DIV rat hippocampal neuron expressing Lifeact-ruby (white) and the automated trace generated by Filament Tracer (blue).Scale bar is 10 μm. (b) Automated and manual spine counts were performed within the same dendritic regions. Top: A dendritic segment of aLifeact-ruby-expressing neuron (white) and the corresponding automated trace (dendrite: red, spines: blue) as well as manually marked spines(yellow spheres) are shown. Middle: Lifeact-ruby signal (white) is overlayed by the automated trace (shown alone at right). Bottom: Lifeact-rubysignal (white) is overlayed by manual spine marks (yellow; shown alone at right). (c) For each dendritic segment, the manual spine count wasplotted against the automated count. Linear regression analysis showed that manual and automated spine detection were significantlycorrelated (n = 28; b = 0.824; p < 0.001).
Swanger et al. Molecular Brain 2011, 4:38http://www.molecularbrain.com/content/4/1/38
Page 3 of 14

methods, the manual method reported a significantlylower proportion of stubby spines than the automatedmethod (Table 3). On close examination, we observedthat spines classified as stubby by the automatedmethod were often manually classified as thin, due to anincreased length measurement, or were manually deter-mined to be a region of the dendrite shaft rather than aprotrusion. In agreement with these observations, it isevident from the literature that manual spine analysesconsistently underestimate the proportion of stubbyspines and overestimate spine length at the low end ofthe distribution when compared to automated andsemi-automated methods [12,17,38,39]. It is importantto note that, given the resolution limit of light micro-scopy, some spine heads may not be distinguishablefrom short and wide spine necks. While electron micro-scopy affords the resolution to make such distinctions,light microscopy is a more versatile and practicalapproach for mechanistic studies of dendritic spinestructure. Altogether, these results indicate that ourmethod accurately and precisely reports spine numberand geometry in cultured neurons. Moreover, ourmethod is a significant advance over current spine ana-lysis methods as dendritic spine detection and 3D
measurements are entirely automated, thus greatly redu-cing the time burden and removing experimenter biases.
Automated tracking of dendritic spines in live neuronsDendritic spine density and morphology are dynamicallyregulated by many extracellular cues and neurotransmit-ters. For example, many more dendritic protrusions areformed during development than remain into adulthood,indicating that spine formation and morphogenesis arehighly regulated processes; yet, the mechanisms deter-mining which spines become stabilized remain unclear.In the adult brain, stimulus induced potentiation of thepostsynaptic response can convert spines with smallheads to large spines, whereas large spines can shrink inresponse to long-term depression of the postsynapticresponse [40,41]. However, the detailed mechanismsgoverning these differential responses remain poorlyunderstood. Therefore, time-lapse imaging in living neu-rons is an essential tool for studying stimulus-inducedsynapse development and plasticity.To test how effectively our automated approach
tracked dendritic protrusions in live hippocampal neu-rons, 12 DIV neurons expressing Lifeact-ruby wereimaged at 5 min intervals for 1 hr. The 3D reconstruc-tions were generated as described above with a fewmodifications. A dendrite starting point was defined foreach time point using the AutoDepth mode in ImarisFilament Tracer. The automated trace was built usingthese existing dendrite start points and the followinggeometric parameters: minimum dendrite end diameter(0.75 μm), minimum spine end diameter (0.3 μm;empirically determined to be the minimum end dia-meter allowing accurate spine detection), and maximumspine length (15.0 μm). The maximum spine length wasset at 15 μm to include dendritic filopodia, which arelong and dynamic protrusions involved in spine anddendrite development [42,43]. Filopodia are included inthis analysis because they are abundant on the 12 DIVneurons used for these experiments, whereas they arenearly absent on the mature neurons (17 DIV) used for
Table 2 Estimated population statistics based onpublished electron microscopy studies
Head width Neck width Length
Median 0.40 0.15 1.36
Mean 0.46 0.15 1.50
Range 0.84 0.42 4.80
Geometric spine measurements (μm) from previously published electronmicroscopy studies were pooled to generate estimated median, mean, andrange values for the population of dendritic spines on hippocampal neurons[10,29,31,36,77].
Table 3 Statistical comparison of spine shapeclassification
Stubby Mushroom Thin
Manual Auto Manual Auto Manual Auto
Median 7.0% 13.5% 65.5% 59.4% 11.7% 9.3%
SD ±11.4 ±7.1 ±20.0 ±10.9 ±15.5 ±10.1
CV 1.10 0.49 0.33 0.18 0.99 0.80
P 0.033* 0.895 0.346
Dendritic spines were classified as stubby, mushroom, or thin using themanually or automatically generated geometric measurements. P: TheKolmogorov Smirnov test was used to compare the manual and automateddistributions (*significant difference between the manual and automatedmeasures).
Table 1 Statistical comparison of geometric spinemeasurements
Head width Neck width Length
Manual Auto Manual Auto Manual Auto
Neurons
Mean (μm) 0.67 0.40 0.27 0.17 1.91 1.73
SD ±0.22 ±0.08 ±0.07 ±0.03 ±0.73 ±0.26
CV 0.32 0.20 0.27 0.20 0.38 0.15
Spines
Median (μm) 0.60 0.44 0.23 0.11 1.50 1.33
Range (μm) 2.36 0.79 1.50 0.57 4.60 4.85
Skewness 1.25 0.10 2.66 2.09 1.03 0.84
The mean, standard deviation (SD), and coefficient of variation (CV) werecalculated for the manual and automated measurements of average spinehead width, neck width, and length per neuron (μm; N = 28 neurons). Themedian, range, and skewness were calculated for the distributions of spinehead width, neck width, and length determined using the manual (N = 411spines) and automated methods (N = 423 spines) on the same 28 neurons.
Swanger et al. Molecular Brain 2011, 4:38http://www.molecularbrain.com/content/4/1/38
Page 4 of 14

the fixed neuron experiments described in Figure 1 andTable 1. The proportions of stable, new, and pruneddendritic protrusions (spines and filopodia) measuredwith the automated method were similar to those deter-mined manually, suggesting that our automatedapproach allows detection and tracking of individualspines across time (Figure 2a). Moreover, we demon-strated that the morphology of individual spines can betracked (Figure 2b) and quantified (Figure 2c and 2d)over time using our automated approach. Takentogether, these data indicate that Lifeact-expressing neu-rons combined with this automated spine analysisapproach is a valid method for the 4D tracking of den-dritic protrusions in live neurons.
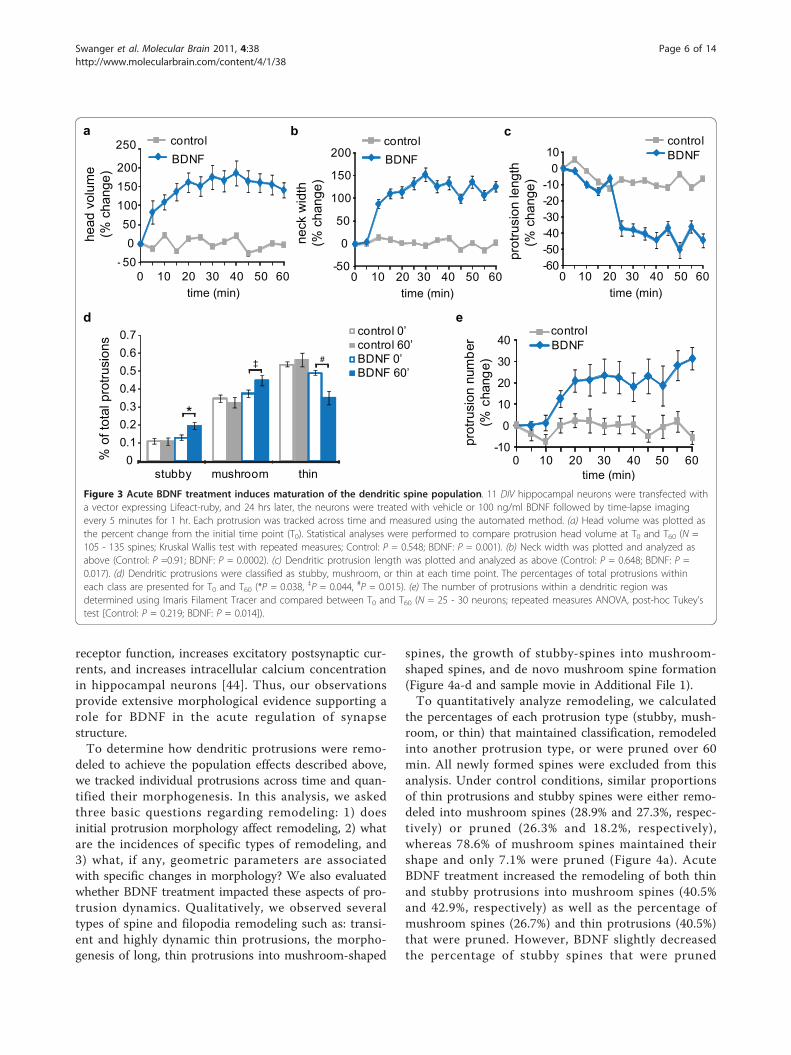
Acute BDNF treatment induces synapse maturationthrough spine remodelingTo test the usefulness of our approach, we analyzed theacute effects of BDNF on spine morphology in live neu-rons (Figure 3a). BDNF is a neurotrophin that not onlysupports neuron differentiation and survival, but it isalso an important regulator of synaptic signaling andplasticity [44]. The canonical mechanism for BDNF-induced synapse maturation is through chronic exposureand a transcription-dependent pathway [45]. However,BDNF also enhances glutamatergic neurotransmissionthrough rapid, local signaling events [44], and recentlyTanaka et al. showed that acute BDNF treatmentincreased dendritic spine head volume by ~150% within25 minutes [25]. Here, we used cultured hippocampalneurons and our automated 4D approach to investigatethe effects of acute BDNF application on dendritic spinemorphology. Similar to the previous study, BDNFincreased mean head volume by ~160% within 20 min,and this effect was maintained for 60 min (Figure 3a).In addition, we found that BDNF increased mean neckwidth by 125% (Figure 3b) and decreased mean protru-sion length by 45% (Figure 3c). Spine classification ana-lysis revealed significant increases in stubby andmushroom spine proportions and a decrease in the pro-portion of thin protrusions following BDNF treatment(Figure 3d). Finally, BDNF increased protrusion numberby ~25% (Figure 3e). Together, these findings indicatethat acute BDNF treatment leads to an overall matura-tion of the dendritic spine population in a manner con-sistent with enhanced synaptic efficacy.In support of the above assertion, the observed
increases in head and neck width and the decrease inprotrusion length are associated with increased signalingbetween the dendritic spine and shaft, which promotesgreater signal integration within the neuron [33-35].Furthermore, we observed an increased proportion ofmushroom-shaped spines, which have many GluAreceptors and large PSDs; whereas, BDNF decreased the
proportion of thin protrusions, which often lack surfaceGluA receptors and have less defined PSDs [46]. Impor-tantly, our results agree with previous studies showingthat acute BDNF enhances postsynaptic glutamate
b
c
0 min a
0
10
20
30
40
50
60
70
80
stable new pruned
% to
tal p
rotru
sion
s
manual
auto
60 min
12
34
0.0
0.2
0.4
0.6
0.8
1.0
1.2
0 10 20 30 40 50 60
1234
02468
1012141618
0 10 20 30 40 50 60
1234
prot
rusi
on le
ngth
(m
)he
ad w
idth
(m
)
time (min)
time (min)
d
12
34
Figure 2 Automated tracking of dendritic protrusions in liveneurons. 11 DIV hippocampal neurons were transfected with avector expressing Lifeact-ruby, and 24 hrs later were imaged at 5min intervals for 1 hr. (a) Individual protrusions were tracked acrossthe time series manually and with our automated method. Thishistogram shows the percentages of stable, new, and prunedprotrusions for both methods. (b) Images depict 12 DIV neuronsexpressing Lifeact-ruby (white; top) overlayed with automated 3Dreconstructions (bottom). The dendrite shaft is red and each trackedprotrusion is labeled 1 through 4 (shades of blue and green).Images from t = 0 and 60 min are shown, and the scale bar is 5μm. (c) Head width and (d) protrusion length were plotted versustime for each protrusion; the labels 1 through 4 in the legendcorrespond to the labels 1 through 4 in panel (b).
Swanger et al. Molecular Brain 2011, 4:38http://www.molecularbrain.com/content/4/1/38
Page 5 of 14
receptor function, increases excitatory postsynaptic cur-rents, and increases intracellular calcium concentrationin hippocampal neurons [44]. Thus, our observationsprovide extensive morphological evidence supporting arole for BDNF in the acute regulation of synapsestructure.To determine how dendritic protrusions were remo-
deled to achieve the population effects described above,we tracked individual protrusions across time and quan-tified their morphogenesis. In this analysis, we askedthree basic questions regarding remodeling: 1) doesinitial protrusion morphology affect remodeling, 2) whatare the incidences of specific types of remodeling, and3) what, if any, geometric parameters are associatedwith specific changes in morphology? We also evaluatedwhether BDNF treatment impacted these aspects of pro-trusion dynamics. Qualitatively, we observed severaltypes of spine and filopodia remodeling such as: transi-ent and highly dynamic thin protrusions, the morpho-genesis of long, thin protrusions into mushroom-shaped
spines, the growth of stubby-spines into mushroom-shaped spines, and de novo mushroom spine formation(Figure 4a-d and sample movie in Additional File 1).To quantitatively analyze remodeling, we calculated
the percentages of each protrusion type (stubby, mush-room, or thin) that maintained classification, remodeledinto another protrusion type, or were pruned over 60min. All newly formed spines were excluded from thisanalysis. Under control conditions, similar proportionsof thin protrusions and stubby spines were either remo-deled into mushroom spines (28.9% and 27.3%, respec-tively) or pruned (26.3% and 18.2%, respectively),whereas 78.6% of mushroom spines maintained theirshape and only 7.1% were pruned (Figure 4a). AcuteBDNF treatment increased the remodeling of both thinand stubby protrusions into mushroom spines (40.5%and 42.9%, respectively) as well as the percentage ofmushroom spines (26.7%) and thin protrusions (40.5%)that were pruned. However, BDNF slightly decreasedthe percentage of stubby spines that were pruned
prot
rusi
on n
umbe
r(%
cha
nge)
control
00.10.20.30.40.50.60.7
stubby mushroom thin
control 0’control 60’BDNF 0’BDNF 60’
a
-10
0
10
20
30
40
0 10 20 30 40 50 60time (min)
-60-50-40-30-20-10
010
prot
rusi
on le
ngth
(% c
hang
e)
c
d
% o
f tot
al p
rotru
sion
s
*
#
- 500
50100150200
250
0 10 20 30 40 50 60time (min)
head
vol
ume
(% c
hang
e)
-50
0
50
100
150
200
neck
wid
th(%
cha
nge)
BDNFcontrol
b
e
BDNFcontrol
BDNFcontrol
0 10 20 30 40 50 60time (min)
0 10 20 30 40 50 60time (min)
BDNF‡
Figure 3 Acute BDNF treatment induces maturation of the dendritic spine population. 11 DIV hippocampal neurons were transfected witha vector expressing Lifeact-ruby, and 24 hrs later, the neurons were treated with vehicle or 100 ng/ml BDNF followed by time-lapse imagingevery 5 minutes for 1 hr. Each protrusion was tracked across time and measured using the automated method. (a) Head volume was plotted asthe percent change from the initial time point (T0). Statistical analyses were performed to compare protrusion head volume at T0 and T60 (N =105 - 135 spines; Kruskal Wallis test with repeated measures; Control: P = 0.548; BDNF: P = 0.001). (b) Neck width was plotted and analyzed asabove (Control: P =0.91; BDNF: P = 0.0002). (c) Dendritic protrusion length was plotted and analyzed as above (Control: P = 0.648; BDNF: P =0.017). (d) Dendritic protrusions were classified as stubby, mushroom, or thin at each time point. The percentages of total protrusions withineach class are presented for T0 and T60 (*P = 0.038, ‡P = 0.044, #P = 0.015). (e) The number of protrusions within a dendritic region wasdetermined using Imaris Filament Tracer and compared between T0 and T60 (N = 25 - 30 neurons; repeated measures ANOVA, post-hoc Tukey’stest [Control: P = 0.219; BDNF: P = 0.014]).
Swanger et al. Molecular Brain 2011, 4:38http://www.molecularbrain.com/content/4/1/38
Page 6 of 14

Figure 4 Acute BDNF induces specific types of spine remodeling. 12 DIV hippocampal neurons expressing Lifeact-ruby were treated withvehicle or 100 ng/ml BDNF and imaged at 5 min intervals for 1 hr. Each protrusion was classified as stubby, mushroom, or thin at t = 0 and 60min. (a-d) At left, each each time series (0 - 60 min) depicts a representative type of dendritic protrusion remodeling observed during ouranalysis. At right, the automated 3D reconstructions illustrate the classification of each protrusion at t = 0 and 60 min (stubby: yellow,mushroom: green, thin: blue). (e) The diagram shows the percentages of pre-existing stubby, mushroom, and thin protrusions that wereremodeled (to stubby, to mushroom, to thin) or pruned under control and BDNF-treated conditions. (f) Using the same dataset as in (e), wecalculated the total incidence for each type of remodeling under control and BDNF-treated conditions. The histogram depicts the percentagesof total protrusions that were initially stubby, mushroom, or thin and were either remodeled (to stubby, to mushroom, or to thin) or pruned. (g)The initial (t = 0) mean protrusion head width, neck width and length as well as the head width/neck width ratio were determined formushrooms spines that were either stable (maintained mushroom morphology), remodeled into thin protrusions, or pruned within the 60 minimaging period following BDNF treatment (N = 24 - 32 spines; ANOVA, post-hoc Tukey’s test; head width: ‡P = 0.032, *P = 0.017; neck width: *P= 0.020, ‡P = 0.037; length: ‡P = 0.032, *P = 0.017; head/neck ratio: *P = 0.002, ‡P = 0.001). (h) The group means listed above were determinedfor thin protrusions (t = 0) that were stable (maintained thin morphology), remodeled into mushroom spines, or pruned during 30 min. BDNFtreatment (N = 36 - 47 spines; ANOVA, post-hoc Tukey’s test; length: *P = 0.002; head/neck ratio: *P = 0.037).
Swanger et al. Molecular Brain 2011, 4:38http://www.molecularbrain.com/content/4/1/38
Page 7 of 14

(14.3%). Interestingly, thin- and mushroom-shaped pro-trusions rarely morphed into stubby spines, and stubbyspines were never observed to remodel into thin protru-sions. These observations suggest that stubby and thinprotrusions have similar propensities for remodelinginto mushroom spines, but they likely do so throughdistinct mechanisms.Among the total spine population, thin protrusions
had the highest incidence of remodeling, and mushroomspines showed the lowest incidence of remodeling (Fig-ure 4b). Following BDNF treatment, stubby spines hadthe lowest incidence of remodeling (see sample movie inAdditional File 2), suggesting that stubby spines maynot be simply a transitional structure, but that theymight have an important end function as a stable struc-ture under certain conditions. The BDNF-inducedincreases in the proportion and stability of stubbyspines, reported in Figure 3, are difficult to interpret,because the role of stubby spines in neuronal functionremains controversial. Stubby spines do not maintain orrecruit GluA receptors as efficiently as mushroomspines, nor do they form synapses as often [47-50]. Onthe other hand, stubby spines might have enhanced cou-pling to the dendritic shaft as compared to the otherspine types [51]. Also, stubby spine incidence isincreased during learning in vivo, and it has been theo-rized that they are transitional structures that will beenlarged/stabilized or have undergone shrinkage due tosynaptic weakening [2,6,41,46,52,53]. Our data suggestthat it is unlikely for an increase in stubby spines toresult from the weakening of mushroom spines or theretraction of thin protrusions, but it is possible that theincrease in stubby spines is linked to the increase intotal protrusion number following BDNF stimulation.Future studies in systems having a higher overall inci-dence of stubby spines, perhaps neurons in an earlierdevelopmental stage, will be important for advancingour understanding stubby spine formation, remodeling,and function.These results also have implications regarding spine
formation. Several mechanisms have been proposed forhow stable, mushroom-shaped spines are formed,including growth of mushroom spines from the dendri-tic shaft, morphogenesis of a filopodia into a mushroomspine, and retraction of filopodia into the dendritic shaftresulting in a shaft or stubby spine synapse followed bygrowth of a mushroom spine at the same location[47,54-56]. Our data clearly support the formation ofmushroom spines de novo and through morphogenesisof an existing filopodia (Figure 4) as has been previouslyobserved in vitro and in vivo [53,55-63]. However, ourdata suggest that mushroom spine formation via filopo-dia retraction into a stubby spine followed by re-growthis not a common occurrence, at least in this model
system, as we rarely observed morphogenesis of a filopo-dia into a stubby spine. Whether filopodia wereretracted fully into the shaft and re-emerged as mush-room spines at the same locus was not evaluated in thecurrent study, but this analysis is possible using ourautomated method and can be investigated in futurestudies.To investigate whether any geometric parameters were
associated with BDNF-induced remodeling, the initial (t= 0) mean head width, neck width, and protrusionlength were compared among stable, remodeled, andpruned mushroom spines or stable, remodeled, andpruned thin protrusions (Figure 4g,h). Large neck widthwas the best predictor of mushroom spine stability,whereas head width was not significantly differentbetween stable and remodeled mushroom spines (Figure4g). Mushroom spine pruning was associated withreduced head and neck width and increased length com-pared to the other two groups (Figure 4g). For thin pro-trusions, a high ratio of head width to neck width wasthe best indicator of stability (see Figure 4d and thesample movie in Additional File 3). Interestingly, thesedata are consistent with functional studies reporting thatlarge neck width is associated with greater synapticstrength [33] and synaptic potentiation of thin protru-sions is promoted by maintaining high concentrations ofsignaling molecules within the head, which might bedue to a high ratio of head width to neck width [46,64].An interesting observation was that BDNF decreased
the percentage of mushroom spines that remained asmushroom spines from 79% to 53% (Figure 4e). More-over, 26% of mushroom spines were pruned followingBDNF. Both observations imply BDNF-induced turnoverof mushroom spines, suggesting that the overall net gainin spine maturation (increased density and spine width,reduced length) (Figure 3) involves extensive remodel-ing. This process may involve pruning of mushroomspines that passed certain thresholds approaching imma-ture phenotypes (e.g. low head or neck width, orincreased length), which are apparently replaced bymore mature mushroom spines developed from otherless mature populations (thin, stubby).In the future, it will be important to study the differ-
ent mechanisms underlying specific types of spine for-mation and remodeling, such as the distinctionsbetween stubby and thin protrusion remodeling intomushroom spines. Furthermore, there is still muchdebate regarding the functional significance of differentspine morphologies in brain development, plasticity, anddisease. One necessary step towards understanding thestructure-function relationship of dendritic spines isgenerating reproducible and interpretable spine mor-phology data. The accuracy and speed of our methodmakes it well-suited for studies of this type, and we
Swanger et al. Molecular Brain 2011, 4:38http://www.molecularbrain.com/content/4/1/38
Page 8 of 14

anticipate that our approach will facilitate studies onspine structure and its relation to synapse function.In addition to advancing morphological studies, the
described technique has the potential to facilitate studiesevaluating the synaptic localization of specific molecules.The fluorescence intensity of multiple channels can beautomatically quantified within each dendritic spine;thus, one could evaluate whether a particular fluores-cently tagged or stained molecule is differentially loca-lized between spine types or shows altered localizationfollowing a pharmacological, molecular, or geneticmanipulation. Therefore, the combination our optimizedspine analysis method with automated quantification ofspine fluorescence creates a powerful and efficient tech-nique for simultaneously studying spine morphologyand the molecules regulating synapse structure andfunction.
Inhibiting PI3 kinase activity rescues dendritic spinedefects in neurons from Fmr1 KO miceThe importance of dendritic spine morphology isemphasized by the fact that spine abnormalities areassociated with varied neurological diseases such asintellectual disabilities, neurodegenerative diseases, andpsychiatric disorders [5]. Cultured neurons are a valu-able model system for studying the mechanisms under-lying brain diseases; as such, it is critical that spineanalysis methods effectively detect aberrant spine phe-notypes in disease models and identify treatments thatameliorate disease phenotypes. Here, we used ourapproach to study spine morphology in neurons fromFmr1 knockout mice, a mouse model of fragile X syn-drome (FXS).FXS is an inherited intellectual disability caused by the
loss of fragile X mental retardation protein (FMRP), anRNA binding protein that regulates mRNA transportand local protein synthesis at synapses [26]. Patientswith FXS display increased dendritic spine density, anincreased incidence of thin spines, and increased meanspine length, and these abnormalities are recapitulatedin neurons from Fmr1 knockout mice [65-68]. In a pre-vious study, we detected increased spine density in cul-tured hippocampal neurons from Fmr1 knockout miceusing a semi-automated spine analysis method in whichthe experimenter manually edited an automated trace;however, we were unable to detect any other defects inspine morphology with this method [[27], and unpub-lished observations]. Using our fully automated method,we accurately detected the established spine phenotypesin 18 DIV hippocampal neurons from Fmr1 knockoutmice: increased spine density, decreased spine headwidth, increased spine length, and decreased spinevolume (Figure 5). Furthermore, there were less mush-room-shaped spines and more thin spines in FMRP-
deficient neurons, which is in line with previous reports[66,69-71]. These data further demonstrate the validityof our approach as well as its usefulness for studyingneurological diseases.Next, we investigated whether treating hippocampal
neurons with a phosphoinositide-3-kinase (PI3K) inhibi-tor affected spine morphology. Previously, we discoveredthat inhibiting PI3K activity is a potential therapeuticstrategy for FXS. We showed that the loss of FMRPleads to excess PI3K activity and treatment with a PI3Kinhibitor, LY294002, rescues several neuronal pheno-types in Fmr1 knockout mice, including aberrant synap-tic protein synthesis, GluA receptor internalization, anddendritic spine density [24]. Here, using our automatedapproach, we reproduced our previous findings bydemonstrating that LY294002 treatment (10 μM for 72hrs) reduced spine density in hippocampal neuronsfrom Fmr1 knockout mice to wild type levels (Figure5b). Furthermore, our analysis revealed that LY294002treatment significantly increased spine head width,decreased spine length, and increased spine volume inneurons from Fmr1 KO mice (Figure 5c-e). Additionally,LY294002 significantly increased mushroom-shapedspines and decreased thin spines in FMRP-deficient neu-rons such that all spine proportions were similar tothose of wild type neurons (Figure 5f). These data indi-cate that inhibiting PI3K activity not only rescuesincreased spine density in a mouse model of FXS, butalso restores aberrant spine shape to the wild type mor-phology. These findings are an important advance ofour previous findings and further support the pharma-cological inhibition of PI3K as a potential FXS treatmentstrategy [72]. More broadly, these data demonstrate thatour automated approach can be used to study dendriticspine abnormalities and potential pharmacotherapeuticsin neurological disorders.Although spine defects are apparent in many brain
diseases, a vital unanswered question is whether alteredspine morphology contributes to disease onset and pro-gression or is secondary to disordered neuronal activity[5,73]. Of note, cortical neurons in a mouse model ofAlzheimer’s disease exhibit reduced spine density, a phe-notype evident in patients with Alzheimer’s disease, butthese neurons do not show overt electrophysiologicalimpairments; whereas, other mouse models of Alzhei-mer’s disease show both structural and functional phe-notypes in cortical neurons [74]. In addition, it ispossible to alter synaptic efficacy without inducing long-term changes in spine morphology, and altering spinemorphology through manipulating the neuronal cytoske-leton is not always sufficient to alter synapse function[4]. These data highlight the complexity inherent in thespine structure-synapse function relationship andemphasize the importance of developing powerful
Swanger et al. Molecular Brain 2011, 4:38http://www.molecularbrain.com/content/4/1/38
Page 9 of 14

techniques for studying the mechanisms regulating spinemorphology in brain development, plasticity, anddisease.
ConclusionsWe have developed an automated 3D approach for den-dritic spine analysis using neurons expressing fluorescently
labeled Lifeact. This versatile method can be applied toimages of either fixed or live cultured neurons that werecollected using widefield fluorescence or confocal micro-scopy. The increased speed and accuracy of our automatedspine analysis, as compared to manual spine assessments,is critical for uncovering the complicated mechanismsunderlying normal and aberrant dendritic spine formation
0
1
2
3
4
5
6
Vehicle LY294
spin
es p
er 1
0m
WTKO
* #
0
0.2
0.4
0.6
0.8
1.0
0 1.0 2.0 3.0 4.0 5.0
0.2
0.4
0.6
0.8
1.0
0 0.5 1.0 1.5
cum
ulat
ive
dist
ribut
ion
spine head width ( m) spine length ( m)2.0
0
0.2
0.4
0.6
0.8
1.0
spine volume ( m )3
cum
ulat
ive
dist
ribut
ion
a b
e
c
cum
ulat
ive
dist
ribut
ion
f
0 0.5 1.0 1.5 2.0 2.5
WTKOWT LY294KO LY294
0
10
20
30
40
50
60
70
stubby mushroom thin
% to
tal s
pine
s
WTKOWT LY294KO LY294
*
# ++
WTKOWT LY294KO LY294
WTKOWT LY294KO LY 294
0
d
WT
KO
Vehicle LY294
Figure 5 A PI3 kinase inhibitor rescues spine morphology in neurons from Fmr1 knockout mice. (a) Hippocampal neurons cultured fromwild type (WT) or Fmr1 knockout (KO) mice were treated with vehicle or a PI3 kinase inhibitor (LY294, 10 μM) for 72 hours starting at 15 DIV.Neurons were transfected with a plasmid encoding Lifeact-ruby at 17 DIV and fixed 24 hours later. The images depict representative dendriticregions from deconvolved z-series images (scale bar is 5 μm). (b) Spine density was measured using our automated approach for WT and KOneurons treated with either vehicle or LY294 (n = 55-60 neurons; ANOVA [F = 3.996, P = 0.009]; post-hoc Fisher’s LSD: *P = 0.017, #P = 0.028).Cumulative distributions of (c) spine head width, (d) length, and (e) volume were plotted for each group (Kolmogorov-Smirnov test: head width[WT vs. KO: P = 0.002, WT vs. WT LY294: P = 0.235, KO vs. KO LY294: P = 0.009], spine length [WT vs. KO: P = 0.009, WT vs. WT LY294: P = 0.537,KO vs. KO LY294: P = 0.014], spine volume [WT vs. KO: P < 0.001, WT vs. WT LY294: P = 0.158, KO vs. KO LY294: P < 0.001]). (f) Spines wereclassified as stubby, mushroom, and thin based on the automated geometric measurement, and the values were plotted as percentage of totalspines per treatment group (n = 55 - 60 neurons; ANOVA with post-hoc Fisher’s LSD: *P = 0.043, #P = 0.006, ‡P = 0.043).
Swanger et al. Molecular Brain 2011, 4:38http://www.molecularbrain.com/content/4/1/38
Page 10 of 14
and remodeling. Using our automated approach, weshowed that acute BDNF treatment leads to rapid spineremodeling consistent with enhanced synaptic efficacy.We also found that inhibiting PI3 kinase activity rescuesaberrant spine shape in neurons from a mouse model ofFXS. We predict that this method will significantlyadvance studies of glutamatergic synapse structure andfunction in neuronal health and disease.
MethodsNeuron culture, transfection, and drug treatmentsHippocampal neurons were isolated from embryos atE18 (rat) or E17 (mouse) and cultured at high-density aspreviously described with minor modifications [75]. Rathippocampal neurons were cultured in Neurobasal med-ium (Invitrogen) supplemented with NS21 [76]. Neuronswere either plated on 15 mm glass coverslips and co-cultured with glia, or plated on 35 mm MatTek glassbottom dishes in glia-conditioned media that wasexchanged every 2 days with new glia-conditionedmedia.Fixed neuron experiments: 16-17 DIV neurons were
transfected with plasmids encoding Lifeact-ruby (a gen-erous gift from Dr. Roland Wedlich-Soldner, MaxPlanck Institute, Martinsried, Germany), Lifeact-GFP,GFP, or membrane-tagged GFP using NeuroMag(OZBiosciences). DiI labeling was performed on 16 DIVneurons by incubating the coverslips covered with asmall volume of neuronal culture media containingVybrant DiI solution (Invitrogen) for 25 min at 37°C.For LY294002 experiments, 15 DIV neurons were trea-ted with 10 μM LY294002 or an equivalent volume ofDMSO for 72 hrs total; the culture media wasexchanged with conditioned media containing freshlyprepared drug (or vehicle) after 24 and 48 hrs.Live neuron experiments: 11 DIV rat hippocampal
neurons were transfected with a plasmid encoding Life-act-ruby using Lipofectamine 2000 and used for imaging24 hrs later. Thirty minutes prior to imaging, neuronswere equilibrated to glia-conditioned imaging media(phenol red-free Neurobasal media supplemented withHEPES, sodium pyruvate, NS21, and Glutamax). ForBDNF experiments: One hour prior to imaging, neuronswere starved in glia-conditioned imaging media withoutNS21, and immediately prior to time lapse imaging neu-rons were treated with BDNF (100 ng/ml; Peprotech) orvehicle (H2O).
MicroscopyWidefield fluorescence: Twenty-four hours after trans-fection, hippocampal neurons were fixed with 4% paraf-ormaldehyde in 1x phosphate-buffered saline (PBS),washed 3 times with 1x PBS, and the coverslips weremounted on microscope slides with propyl gallate-
containing polyvinyl alcohol. Neurons were imaged on aNikon Eclipse Ti microscope with a Nikon Intensilightand Photometrics Coolsnap HQ2 camera. GFP wasimaged using a 480/40 excitation filter, a 535/50 emis-sion filter, and a 505 dichroic (Nikon), and ruby and DiIwere imaged using a 545/30 excitation filter, a 620/60emission filter, and a 570 dichroic. Images wereacquired using a 60X oil-immersion objective (NikonPlan Apo, N.A. 1.40). Z-series images were acquired at0.15 μm increments through the entire visible dendrite.Confocal laser scanning: Time lapse imaging was per-
formed on a Nikon A1R confocal encased in a plexiglasshumidified chamber maintained at 37°C and 5% CO2
using a 60X oil immersion objective (Nikon Plan Apo,N.A. 1.40). Images of Lifeact-ruby were collected using a561 nm laser for excitation and a 650 emission filter. Z-series were acquired at 0.15 μm increments, and aNikon Perfect Focus system was enabled for the dura-tion of the experiment.
Image processingImages were deconvolved in AutoQuant X (MediaCy-bernetics) using the blind algorithm, which employs aniteratively refined theoretical PSF. No further processingwas performed prior to image analysis. For preparationof figures, maximum intensity Z-projections were cre-ated in Imaris (Figures 1 and 5) or average intensity Z-projections were created using ImageJ (Figures 2 and 4).For visualization, brightness and contrast levels wereadjusted using ImageJ.
Automated image analysisIn Imaris Surpass mode, a new filament was createdusing the Autopath mode and a region of interest (ROI)was selected. To select an ROI, we identified a dendriticregion 40 - 60 μm length that was distal to a dendriticbranch point and void of crossing neurites or any addi-tional dendritic branch points. A minimum dendrite enddiameter of 0.75 μm was entered and a single dendritestarting point was assigned at the edge of the ROI. Fortime-lapse image series, a single dendrite starting pointwas assigned at each timepoint by using the AutoDepthmode. Automatic thresholds were used for assigningdendrite end points and dendrite surface rendering. Totrace spines, the maximum spine length and minimumspine end diameter were set at 5 μm and 0.215 μm,respectively, for fixed neuron experiments and 15 μmand 0.3 μm, respectively, for live imaging experiments.Automatic thresholds were used for generating spineseed points and surface rendering. After generating thetrace, a filter was applied to ensure all dendritic protru-sions ≤ 5 μm (or 15 μm) were assigned as spines; to doso, we created a filter that selected all dendritic seg-ments with “Branch level” = 2 and “length” ≤ 5 (or 15)
Swanger et al. Molecular Brain 2011, 4:38http://www.molecularbrain.com/content/4/1/38
Page 11 of 14

and the selected segments were assigned as spines bychoosing “Assign as spine” under the Edit tab. All of thegeometric parameters and filters were set, or loadedfrom a previously analyzed image, at the start of theanalysis session after which the software maintainedthese values. For each subsequent image processed, anROI was selected, a dendrite starting point was assigned,and then the trace was built by clicking “Finish”. Toapply the filter, the Filter tab was opened (which auto-matically selected the appropriate segments), then byclicking on the Edit tab followed by “Assign as spine”the final 3D trace was generated. Filament statisticswere exported into Excel (Microsoft), where they werecompiled and graphed.
Manual image analysisManual analyses were performed in Imaris Surpassmode using the same dendritic ROIs as above. The den-drite length was measured using Measurement Pointsand each spine was marked using Spots (Imaris). UsingMeasurement Points, head width was measured at themaximum width of the spine tip, neck width was mea-sured at the minimum point along the spine length, andspine length was measured from the dendrite shaft tothe spine tip. Each ROI was processed in duplicate andthe values were averaged.
Spine classificationsSpines were classified into groups termed stubby, mush-room, and thin. These groups were established as fol-lows: stubby (length ≤1 μm and neck width/head width< 1.5), mushroom (neck width/head width ≥ 1.5 andlength ≤5 μm), and thin (1 < length ≤ 5 μm and neckwidth/head width < 1.5) [36]. Classification for bothmanual and Filament Tracer, were computed in Excelusing the following formulas:
Stubby : = F(AND(length ≤ 5, head/neck ≤ 1.5
), 1, 0)
Mushroom : = IF(AND(length ≤ 5, head/neck ≥ 1.5
), 1, 0)
Thin : = IF(AND(length ≤ 5, length > 1, head/neck ≤ 1.5
), 1, 0)
These logic statements return a value of 1 if true and0 if false. The total number of spines in each class wastallied by summing the results of the logic statements.For live imaging experiments, a maximum length of 15μm was used instead of 5 μm.
StatisticsUnless otherwise noted, statistics were completed usingPASW Statistics 18 (SPSS, Inc). All datasets were ana-lyzed for equal variance using Levene’s test and normalityusing the Kolmogorov Smirnov test. Normally distributeddatasets were compared using either Student’s t-test oran ANOVA followed by post-hoc tests as noted in figurelegends. Non-normal datasets were compared using the
Mann-Whitney U test or Kruskal Wallis test. Cumulativedistributions were compared using the Kolmogorov-Smirnov test. Alpha was set at 0.05 for all comparisons.Power analysis was performed using G*Power 3.1.2 (Uni-versity of Kiel, Germany) with b = 0.8 and a = 0.05, andeffect size and standard deviation were determined usingpilot experiment results. The experimenter was blind totreatment and genotype during all image analysis.
Additional material
Additional file 1: Individual dendritic spines undergo remodelingthat can be tracked across time. A 12 DIV hippocampal neuronexpressing Lifeact-ruby was treated with BDNF (100 ng/ml) and image at5 in intervals for 1 hr. In this representative neuron, a thin protrusionundergoes extensive remodeling (blue) and a newly formed spineemerges from the dendritic shaft (red) and morphs into a mushroom-shaped spine.
Additional file 2: Stubby spines are highly stable following BDNFstimulation. A 12 DIV hippocampal neuron expressing Lifeact-ruby wastreated with BDNF (100 ng/ml) and imaged at 5 min intervals for 1 hr.The stubby spine (center) remains stable for the duration of theexperiment; whereas, neighboring thin protrusions can be seenextending and retracting.
Additional file 3: Thin protrusions with a high head/neck widthratio remain stable. A 12 DIV hippocampal neuron expressing Lifeact-ruby was treated with 100 ng/ml BDNF and imaged at 5 min intervalsfor 1 hr. The long protrusion with a defined head that is much widerthan the neck (at right) remains stable throughout the experiment;whereas, neighboring protrusions, which do not exhibit increased widthat the tip, undergo dynamic structural changes and/or are pruned.
AcknowledgementsThe authors would like to thank Dr. Alexa Mattheyses for technical assistanceand critically reading the manuscript and Andrew Swanson for technicalassistance and helpful discussions. SAS was supported by predoctoralfellowships from the NIH (F31NS063668, T32GM0860512 and T32NS007480)and the Epilepsy Foundation and Lennox & Lombroso Trust Fund. CG wassupported by a Basic Science Grant from NFXF. This work was supported byNIH MH085617 and NARSAD Investigator Award to GJB, the Emory/BaylorFragile X Center (P30HD024064) and the Neuronal Imaging Core of theEmory Neuroscience NINDS Core Facility (P30NS055077).
Author details1Department of Cell Biology, Emory University, 615 Michael St. NE, Atlanta,GA 30322, USA. 2Department of Neurology, Emory University, 615 Michael St.NE, Atlanta, GA 30322, USA.
Authors’ contributionsSAS contributed to the conception and design of the study, tested andvalidated the method, performed and analyzed the live imagingexperiments, performed the statistical analyses, and drafted the manuscript.XY performed the mouse neuron culture, transfection, and imaging for theLY294002 experiments. CG participated in the design and analysis of theLY294002 experiments. GJB contributed to the conception, analysis, andcoordination of the study, and edited the manuscript. All authors have readand approved the final manuscript.
Competing interestsCG and GJB declare that they are inventors on patent application PCT/US2010/055387.
Received: 29 August 2011 Accepted: 7 October 2011Published: 7 October 2011
Swanger et al. Molecular Brain 2011, 4:38http://www.molecularbrain.com/content/4/1/38
Page 12 of 14

References1. Edwards FA: Anatomy and electrophysiology of fast central synapses
lead to a structural model for long-term potentiation. Physiol Rev 1995,75:759-787.
2. Holtmaat A, Svoboda K: Experience-dependent structural synapticplasticity in the mammalian brain. Nat Rev Neurosci 2009, 10:647-658.
3. Kasai H, Fukuda M, Watanabe S, Hayashi-Takagi A, Noguchi J: Structuraldynamics of dendritic spines in memory and cognition. Trends Neurosci2010, 33:121-129.
4. Alvarez VA, Sabatini BL: Anatomical and physiological plasticity ofdendritic spines. Annu Rev Neurosci 2007, 30:79-97.
5. Penzes P, Cahill ME, Jones KA, Vanleeuwen JE, Woolfrey KM: Dendriticspine pathology in neuropsychiatric disorders. Nat Neurosci 2011,14:285-293.
6. Lee KJ, Kim H, Rhyu IJ: The roles of dendritic spine shapes in Purkinjecells. Cerebellum 2005, 4:97-104.
7. Glantz LA, Lewis DA: Dendritic spine density in schizophrenia anddepression. Arch Gen Psychiatry 2001, 58:203.
8. Hayashi Y, Majewska AK: Dendritic spine geometry: functional implicationand regulation. Neuron 2005, 46:529-532.
9. Bourne JN, Harris KM: Coordination of size and number of excitatory andinhibitory synapses results in a balanced structural plasticity alongmature hippocampal CA1 dendrites during LTP. Hippocampus 2010.
10. Bourne JN, Harris KM: Balancing structure and function at hippocampaldendritic spines. Annu Rev Neurosci 2008, 31:47-67.
11. Svoboda K: The past, present, and future of single neuronreconstruction. Neuroinformatics 2011, 9:97-98.
12. Rodriguez A, Ehlenberger DB, Dickstein DL, Hof PR, Wearne SL: Automatedthree-dimensional detection and shape classification of dendritic spinesfrom fluorescence microscopy images. PLoS One 2008, 3:e1997.
13. Rodriguez A, Ehlenberger DB, Hof PR, Wearne SL: Rayburst sampling, analgorithm for automated three-dimensional shape analysis from laserscanning microscopy images. Nature protocols 2006, 1:2152-2161.
14. Wearne SL, Rodriguez A, Ehlenberger DB, Rocher AB, Henderson SC, Hof PR:New techniques for imaging, digitization and analysis of three-dimensional neural morphology on multiple scales. Neuroscience 2005,136:661-680.
15. Janoos F, Mosaliganti K, Xu X, Machiraju R, Huang K, Wong ST: Robust 3Dreconstruction and identification of dendritic spines from opticalmicroscopy imaging. Med Image Anal 2009, 13:167-179.
16. Zhang Y, Chen K, Baron M, Teylan MA, Kim Y, Song Z, Greengard P,Wong ST: A neurocomputational method for fully automated 3Ddendritic spine detection and segmentation of medium-sized spinyneurons. Neuroimage 2010, 50:1472-1484.
17. Zhang Y, Zhou X, Witt RM, Sabatini BL, Adjeroh D, Wong ST: Dendriticspine detection using curvilinear structure detector and LDA classifier.Neuroimage 2007, 36:346-360.
18. Mukai H, Hatanaka Y, Mitsuhashi K, Hojo Y, Komatsuzaki Y, Sato R,Murakami G, Kimoto T, Kawato S: Automated Analysis of Spines fromConfocal Laser Microscopy Images: Application to the Discrimination ofAndrogen and Estrogen Effects on Spinogenesis. Cerebral cortex 2011.
19. Bloss EB, Janssen WG, Ohm DT, Yuk FJ, Wadsworth S, Saardi KM,McEwen BS, Morrison JH: Evidence for reduced experience-dependentdendritic spine plasticity in the aging prefrontal cortex. J Neurosci 2011,31:7831-7839.
20. Scotto-Lomassese S, Nissant A, Mota T, Neant-Fery M, Oostra BA, Greer CA,Lledo PM, Trembleau A, Caille I: Fragile X mental retardation proteinregulates new neuron differentiation in the adult olfactory bulb. JNeurosci 2011, 31:2205-2215.
21. Stevens JK, Trogadis J: Reconstructive three-dimensional electronmicroscopy. A routine biologic tool. Anal Quant Cytol Histol 1986,8:102-107.
22. Shen H, Sesack SR, Toda S, Kalivas PW: Automated quantification ofdendritic spine density and spine head diameter in medium spinyneurons of the nucleus accumbens. Brain Struct Funct 2008, 213:149-157.
23. Staffend NA, Loftus CM, Meisel RL: Estradiol reduces dendritic spinedensity in the ventral striatum of female Syrian hamsters. Brain StructFunct 2011, 215:187-194.
24. Gross C, Nakamoto M, Yao X, Chan CB, Yim SY, Ye K, Warren ST, Bassell GJ:Excess phosphoinositide 3-kinase subunit synthesis and activity as a
novel therapeutic target in fragile X syndrome. J Neurosci 2010,30:10624-10638.
25. Tanaka J, Horiike Y, Matsuzaki M, Miyazaki T, Ellis-Davies GC, Kasai H: Proteinsynthesis and neurotrophin-dependent structural plasticity of singledendritic spines. Science 2008, 319:1683-1687.
26. Bassell GJ, Warren ST: Fragile X syndrome: loss of local mRNA regulationalters synaptic development and function. Neuron 2008, 60:201-214.
27. Riedl J, Crevenna AH, Kessenbrock K, Yu JH, Neukirchen D, Bista M,Bradke F, Jenne D, Holak TA, Werb Z, et al: Lifeact: a versatile marker tovisualize F-actin. Nat Methods 2008, 5:605-607.
28. Riedl J, Flynn KC, Raducanu A, Gartner F, Beck G, Bosl M, Bradke F,Massberg S, Aszodi A, Sixt M, Wedlich-Soldner R: Lifeact mice for studyingF-actin dynamics. Nat Methods 2010, 7:168-169.
29. Papa M, Bundman MC, Greenberger V, Segal M: Morphological analysis ofdendritic spine development in primary cultures of hippocampalneurons. J Neurosci 1995, 15:1-11.
30. Ludbrook J: Linear regression analysis for comparing two measurers ormethods of measurement: but which regression? Clin Exp PharmacolPhysiol 2010, 37:692-699.
31. Harris KM, Stevens JK: Dendritic spines of CA 1 pyramidal cells in the rathippocampus: serial electron microscopy with reference to theirbiophysical characteristics. J Neurosci 1989, 9:2982-2997.
32. Kasai H, Matsuzaki M, Noguchi J, Yasumatsu N, Nakahara H: Structure-stability-function relationships of dendritic spines. Trends Neurosci 2003,26:360-368.
33. Noguchi J, Matsuzaki M, Ellis-Davies GC, Kasai H: Spine-neck geometrydetermines NMDA receptor-dependent Ca2+ signaling in dendrites.Neuron 2005, 46:609-622.
34. Korkotian E, Holcman D, Segal M: Dynamic regulation of spine-dendritecoupling in cultured hippocampal neurons. Eur J Neurosci 2004,20:2649-2663.
35. Biess A, Korkotian E, Holcman D: Diffusion in a dendritic spine: the role ofgeometry. Phys Rev E Stat Nonlin Soft Matter Phys 2007, 76:021922.
36. Harris KM, Jensen FE, Tsao B: Three-dimensional structure of dendriticspines and synapses in rat hippocampus (CA1) at postnatal day 15 andadult ages: implications for the maturation of synaptic physiology andlong-term potentiation. J Neurosci 1992, 12:2685-2705.
37. Peters A, Kaiserman-Abramof IR: The small pyramidal neuron of the ratcerebral cortex. The perikaryon, dendrites and spines. Am J Anat 1970,127:321-355.
38. Fan J, Zhou X, Dy JG, Zhang Y, Wong ST: An automated pipeline fordendrite spine detection and tracking of 3D optical microscopy neuronimages of in vivo mouse models. Neuroinformatics 2009, 7:113-130.
39. Koh IY, Lindquist WB, Zito K, Nimchinsky EA, Svoboda K: An image analysisalgorithm for dendritic spines. Neural Comput 2002, 14:1283-1310.
40. Matsuzaki M, Honkura N, Ellis-Davies GC, Kasai H: Structural basis of long-term potentiation in single dendritic spines. Nature 2004, 429:761-766.
41. Zhou Q, Homma KJ, Poo MM: Shrinkage of dendritic spines associatedwith long-term depression of hippocampal synapses. Neuron 2004,44:749-757.
42. Yoshihara Y, De Roo M, Muller D: Dendritic spine formation andstabilization. Current opinion in neurobiology 2009, 19:146-153.
43. Heiman MG, Shaham S: Twigs into branches: how a filopodium becomesa dendrite. Current opinion in neurobiology 2010, 20:86-91.
44. Gottmann K, Mittmann T, Lessmann V: BDNF signaling in the formation,maturation and plasticity of glutamatergic and GABAergic synapses. ExpBrain Res 2009, 199:203-234.
45. Chapleau CA, Larimore JL, Theibert A, Pozzo-Miller L: Modulation ofdendritic spine development and plasticity by BDNF and vesiculartrafficking: fundamental roles in neurodevelopmental disordersassociated with mental retardation and autism. J Neurodev Disord 2009,1:185-196.
46. Bourne J, Harris KM: Do thin spines learn to be mushroom spines thatremember? Curr Opin Neurobiol 2007, 17:381-386.
47. Fiala JC, Feinberg M, Popov V, Harris KM: Synaptogenesis via dendriticfilopodia in developing hippocampal area CA1. J Neurosci 1998,18:8900-8911.
48. Matsuo N, Reijmers L, Mayford M: Spine-type-specific recruitment ofnewly synthesized AMPA receptors with learning. Science 2008,319:1104-1107.
Swanger et al. Molecular Brain 2011, 4:38http://www.molecularbrain.com/content/4/1/38
Page 13 of 14
49. Ashby MC, Maier SR, Nishimune A, Henley JM: Lateral diffusion drivesconstitutive exchange of AMPA receptors at dendritic spines and isregulated by spine morphology. J Neurosci 2006, 26:7046-7055.
50. Harris KM: Structure, development, and plasticity of dendritic spines. CurrOpin Neurobiol 1999, 9:343-348.
51. Richardson RJ, Blundon JA, Bayazitov IT, Zakharenko SS: Connectivitypatterns revealed by mapping of active inputs on dendrites ofthalamorecipient neurons in the auditory cortex. J Neurosci 2009,29:6406-6417.
52. Holtmaat AJ, Trachtenberg JT, Wilbrecht L, Shepherd GM, Zhang X,Knott GW, Svoboda K: Transient and persistent dendritic spines in theneocortex in vivo. Neuron 2005, 45:279-291.
53. Zuo Y, Lin A, Chang P, Gan WB: Development of long-term dendriticspine stability in diverse regions of cerebral cortex. Neuron 2005,46:181-189.
54. Yuste R, Bonhoeffer T: Genesis of dendritic spines: insights fromultrastructural and imaging studies. Nature reviews Neuroscience 2004,5:24-34.
55. Papa M, Segal M: Morphological plasticity in dendritic spines of culturedhippocampal neurons. Neuroscience 1996, 71:1005-1011.
56. Ziv NE, Smith SJ: Evidence for a role of dendritic filopodia insynaptogenesis and spine formation. Neuron 1996, 17:91-102.
57. Marrs GS, Green SH, Dailey ME: Rapid formation and remodeling ofpostsynaptic densities in developing dendrites. Nat Neurosci 2001,4:1006-1013.
58. Okabe S, Miwa A, Okado H: Spine formation and correlated assembly ofpresynaptic and postsynaptic molecules. J Neurosci 2001, 21:6105-6114.
59. Knott GW, Holtmaat A, Wilbrecht L, Welker E, Svoboda K: Spine growthprecedes synapse formation in the adult neocortex in vivo. Nat Neurosci2006, 9:1117-1124.
60. Nagerl UV, Kostinger G, Anderson JC, Martin KA, Bonhoeffer T: Protractedsynaptogenesis after activity-dependent spinogenesis in hippocampalneurons. J Neurosci 2007, 27:8149-8156.
61. Kwon HB, Sabatini BL: Glutamate induces de novo growth of functionalspines in developing cortex. Nature 2011, 474:100-104.
62. Konur S, Yuste R: Imaging the motility of dendritic protrusions and axonterminals: roles in axon sampling and synaptic competition. Molecularand cellular neurosciences 2004, 27:427-440.
63. Lohmann C, Finski A, Bonhoeffer T: Local calcium transients regulate thespontaneous motility of dendritic filopodia. Nat Neurosci 2005, 8:305-312.
64. Grunditz A, Holbro N, Tian L, Zuo Y, Oertner TG: Spine neck plasticitycontrols postsynaptic calcium signals through electricalcompartmentalization. J Neurosci 2008, 28:13457-13466.
65. Irwin SA, Patel B, Idupulapati M, Harris JB, Crisostomo RA, Larsen BP, Kooy F,Willems PJ, Cras P, Kozlowski PB, et al: Abnormal dendritic spinecharacteristics in the temporal and visual cortices of patients withfragile-X syndrome: a quantitative examination. Am J Med Genet 2001,98:161-167.
66. Irwin SA, Idupulapati M, Gilbert ME, Harris JB, Chakravarti AB, Rogers EJ,Crisostomo RA, Larsen BP, Mehta A, Alcantara CJ, et al: Dendritic spine anddendritic field characteristics of layer V pyramidal neurons in the visualcortex of fragile-X knockout mice. Am J Med Genet 2002, 111:140-146.
67. Antar LN, Li C, Zhang H, Carroll RC, Bassell GJ: Local functions for FMRP inaxon growth cone motility and activity-dependent regulation offilopodia and spine synapses. Molecular and cellular neurosciences 2006,32:37-48.
68. Cruz-Martin A, Crespo M, Portera-Cailliau C: Delayed stabilization ofdendritic spines in fragile X mice. J Neurosci 2010, 30:7793-7803.
69. Bilousova TV, Dansie L, Ngo M, Aye J, Charles JR, Ethell DW, Ethell IM:Minocycline promotes dendritic spine maturation and improvesbehavioural performance in the fragile X mouse model. J Med Genet2009, 46:94-102.
70. Galvez R, Greenough WT: Sequence of abnormal dendritic spinedevelopment in primary somatosensory cortex of a mouse model of thefragile X mental retardation syndrome. American journal of medicalgenetics Part A 2005, 135:155-160.
71. de Vrij FM, Levenga J, van der Linde HC, Koekkoek SK, De Zeeuw CI,Nelson DL, Oostra BA, Willemsen R: Rescue of behavioral phenotype andneuronal protrusion morphology in Fmr1 KO mice. Neurobiology ofdisease 2008, 31:127-132.
72. Gross C, Berry-Kravis EM, Bassell GJ: Therapeutic Strategies in Fragile XSyndrome: Dysregulated mGluR Signaling and Beyond.Neuropsychopharmacology 2011.
73. Portera-Cailliau C: Which Comes First in Fragile X Syndrome, DendriticSpine Dysgenesis or Defects in Circuit Plasticity? Neuroscientist 2011.
74. Rocher AB, Kinson MS, Luebke JI: Significant structural but notphysiological changes in cortical neurons of 12-month-old Tg2576 mice.Neurobiology of disease 2008, 32:309-318.
75. Tiruchinapalli DM, Oleynikov Y, Kelic S, Shenoy SM, Hartley A, Stanton PK,Singer RH, Bassell GJ: Activity-dependent trafficking and dynamiclocalization of zipcode binding protein 1 and beta-actin mRNA indendrites and spines of hippocampal neurons. J Neurosci 2003,23:3251-3261.
76. Chen Y, Stevens B, Chang J, Milbrandt J, Barres BA, Hell JW: NS21: re-defined and modified supplement B27 for neuronal cultures. J NeurosciMethods 2008, 171:239-247.
77. Sorra KE, Harris KM: Overview on the structure, composition, function,development, and plasticity of hippocampal dendritic spines.Hippocampus 2000, 10:501-511.
doi:10.1186/1756-6606-4-38Cite this article as: Swanger et al.: Automated 4D analysis of dendriticspine morphology: applications to stimulus-induced spine remodelingand pharmacological rescue in a disease model. Molecular Brain 20114:38.
Submit your next manuscript to BioMed Centraland take full advantage of:
• Convenient online submission
• Thorough peer review
• No space constraints or color figure charges
• Immediate publication on acceptance
• Inclusion in PubMed, CAS, Scopus and Google Scholar
• Research which is freely available for redistribution
Submit your manuscript at www.biomedcentral.com/submit
Swanger et al. Molecular Brain 2011, 4:38http://www.molecularbrain.com/content/4/1/38
Page 14 of 14


![Dendritic evolution during coarsening of Mg-Zn alloys via 4D ......on dendritic coarsening [14e16] found that the most useful quan-tifiable parameter was the secondary dendrite arm](https://img.pdfslide.us/doc/110x75/60d1e8a28729ff32b1361e1c/dendritic-evolution-during-coarsening-of-mg-zn-alloys-via-4d-on-dendritic.jpg)

![Modulation of dendritic spine development and plasticity ... · [24, 26, 53]. Dendritic pathologies in neurodevelopmental disorders associated with mental retardation Neurodevelopmental](https://img.pdfslide.us/doc/110x75/5fb97ad8bd70563f8e7e4027/modulation-of-dendritic-spine-development-and-plasticity-24-26-53-dendritic.jpg)