Embed Size (px)
Citation preview
1
Hogarth 2014: Supplementary note 1: Australian, New Zealand and Tasmanian tide gauge data
Introduction
Data from tide gauges in Australia and New Zealand give us some of the very few longer tidal time
series from the Southern Hemisphere for both Western Pacific and Eastern Indian Oceans which
extend into the 19th century. Extending these further or extending other regional time series to
cover similar century scale time periods is important for climate and sea level studies. This
document briefly summarises work on extended PSMSL (Permanent Service for Mean Sea Level)
data series from Australia using published but largely overlooked data from 19th and early 20th
Century documents (which has therefore been un-cited in recent studies, Watson 2012), as well as
extended data using overlapping time series from nearby stations and other long published data
series not as yet in the standard PSMSL dataset. These notes give details of regional information
which contributed to the results in Hogarth (2014), which discusses global sea level acceleration
based on a larger extended dataset.
This document focusses on data from several Australian ports where preliminary progress has been
made on extending time series. These are Sydney, Port Adelaide, Newcastle NSW, and Williamstown
(Melbourne). The long record from Fremantle (Perth) is also discussed. Other small amounts of
early data is noted (and some is recorded in this document) from Ballina, Yamba, Port Augusta, Port
Pirie, Port Darwin (Chapman 1903), Brisbane, and Port Hedland, but in these cases either gaps are
too large to satisfy acceptance criteria or datum issues remain unresolved. However they may be
useful as near neighbour checks to help identify outliers, datum shifts or fill gaps in the longer series.
A brief comparison is also made between Port Arthur, Tasmania, using the data from Hunter (2003),
Mault (1889), Hobart and other Tasmanian sites from the PSMSL, and data from the nearest
Australian extended time series. The four long extended annual data series from New Zealand
(Hannah 2010, 2012) are also not all in the standard PSMSL data set but are updated to 2013 and
covered briefly here.
Sydney
Spada et al (2012) opted not to include the monthly PSMSL Sydney data (one data series starting
1886) in their global analysis, as the linear SLR (Sea Level Rise) trends from the two almost co-
located Fort Denison gauges are statistically different over their respective full spans. However an
analysis of the trends limited to the overlap period 1915 to 1993 shows they are statistically
identical, and annual and monthly differences between the gauges are small (figure 3). The
difference in overall trends is most likely due to the lower rate of sea level rise in the earlier 1886 to
1915 period compared to the post 1993 period at this location. An annual time series using data
from both temporally overlapping gauges has been created. This has been extended further back by
13 years to 1873 using “forgotten” published data (table 8, Russell 1885). This data appears to be a
first hand corrected version of that reported by Darwin (1889), transmitted via Captain Wharton,
originally from Russell, and recorded in the PSMSL ancillary time series (Spencer et al 1986). The
version reported by Darwin would give anomalously high MSL values at the start of the series,
(which Darwin comments upon) which if accepted would lead to much higher centennial
acceleration values (figure 1). The values reported directly from Russell resolve this apparent
anomaly, but caution should be exercised as other contemporary notes also indicate possible issues
with the gauge leading up to 1886. Russell himself seems satisfied with the accuracy of the data,
2
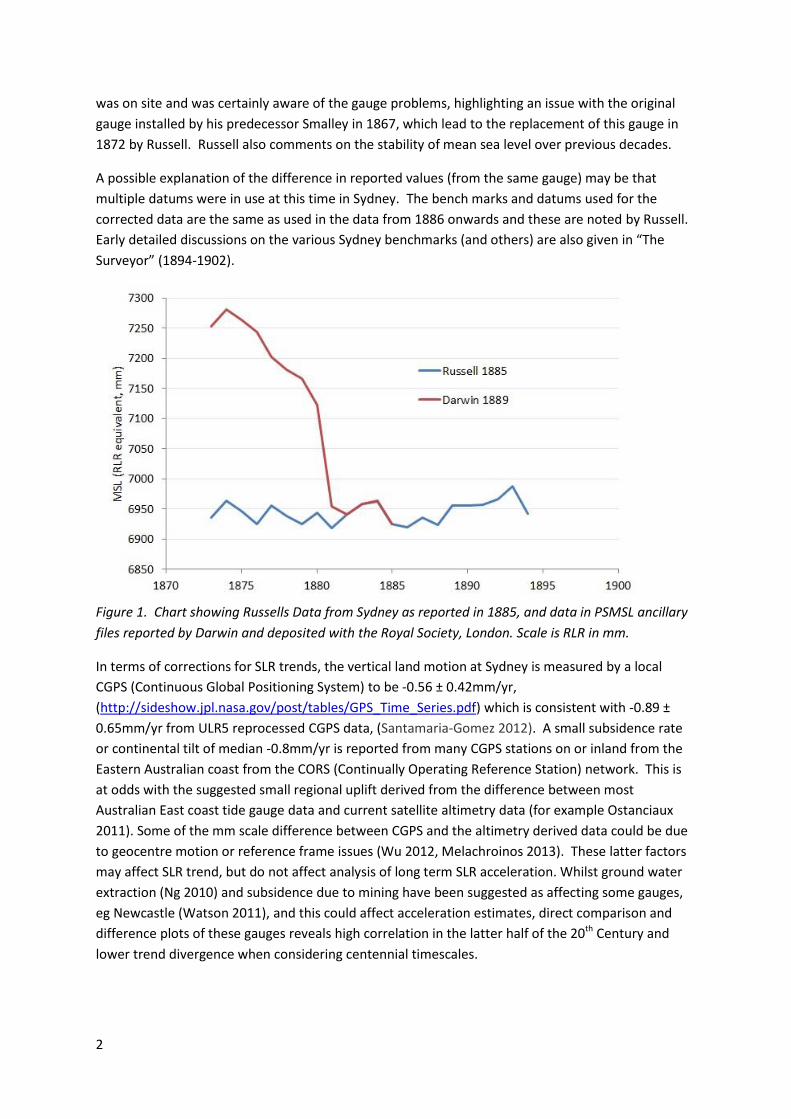
was on site and was certainly aware of the gauge problems, highlighting an issue with the original
gauge installed by his predecessor Smalley in 1867, which lead to the replacement of this gauge in
1872 by Russell. Russell also comments on the stability of mean sea level over previous decades.
A possible explanation of the difference in reported values (from the same gauge) may be that
multiple datums were in use at this time in Sydney. The bench marks and datums used for the
corrected data are the same as used in the data from 1886 onwards and these are noted by Russell.
Early detailed discussions on the various Sydney benchmarks (and others) are also given in “The
Surveyor” (1894-1902).
Figure 1. Chart showing Russells Data from Sydney as reported in 1885, and data in PSMSL ancillary
files reported by Darwin and deposited with the Royal Society, London. Scale is RLR in mm.
In terms of corrections for SLR trends, the vertical land motion at Sydney is measured by a local
CGPS (Continuous Global Positioning System) to be -0.56 ± 0.42mm/yr,
(http://sideshow.jpl.nasa.gov/post/tables/GPS_Time_Series.pdf) which is consistent with -0.89 ±
0.65mm/yr from ULR5 reprocessed CGPS data, (Santamaria-Gomez 2012). A small subsidence rate
or continental tilt of median -0.8mm/yr is reported from many CGPS stations on or inland from the
Eastern Australian coast from the CORS (Continually Operating Reference Station) network. This is
at odds with the suggested small regional uplift derived from the difference between most
Australian East coast tide gauge data and current satellite altimetry data (for example Ostanciaux
2011). Some of the mm scale difference between CGPS and the altimetry derived data could be due
to geocentre motion or reference frame issues (Wu 2012, Melachroinos 2013). These latter factors
may affect SLR trend, but do not affect analysis of long term SLR acceleration. Whilst ground water
extraction (Ng 2010) and subsidence due to mining have been suggested as affecting some gauges,
eg Newcastle (Watson 2011), and this could affect acceleration estimates, direct comparison and
difference plots of these gauges reveals high correlation in the latter half of the 20th Century and
lower trend divergence when considering centennial timescales.
3
Newcastle NSW
The data from Newcastle NSW consists of several time series from successive and overlapping
gauges each with their own zero points, but all of the “metric” data in the PSMSL are referred back
to bench mark PM 60000 (for Newcastle V), which is the same as BM No. 1 (Modra 2013), the
original harbour bench mark at the Customs house (for Newcastle II and III), and therefore can be
connected and reduced to a common RLR datum. The earliest PSMSL monthly data extends back to
1925, but the series finishes in 1988. This data is used to create a longer composite time series up to
2012 using overlapping data from another nearby gauge. In addition, earlier data is also included.
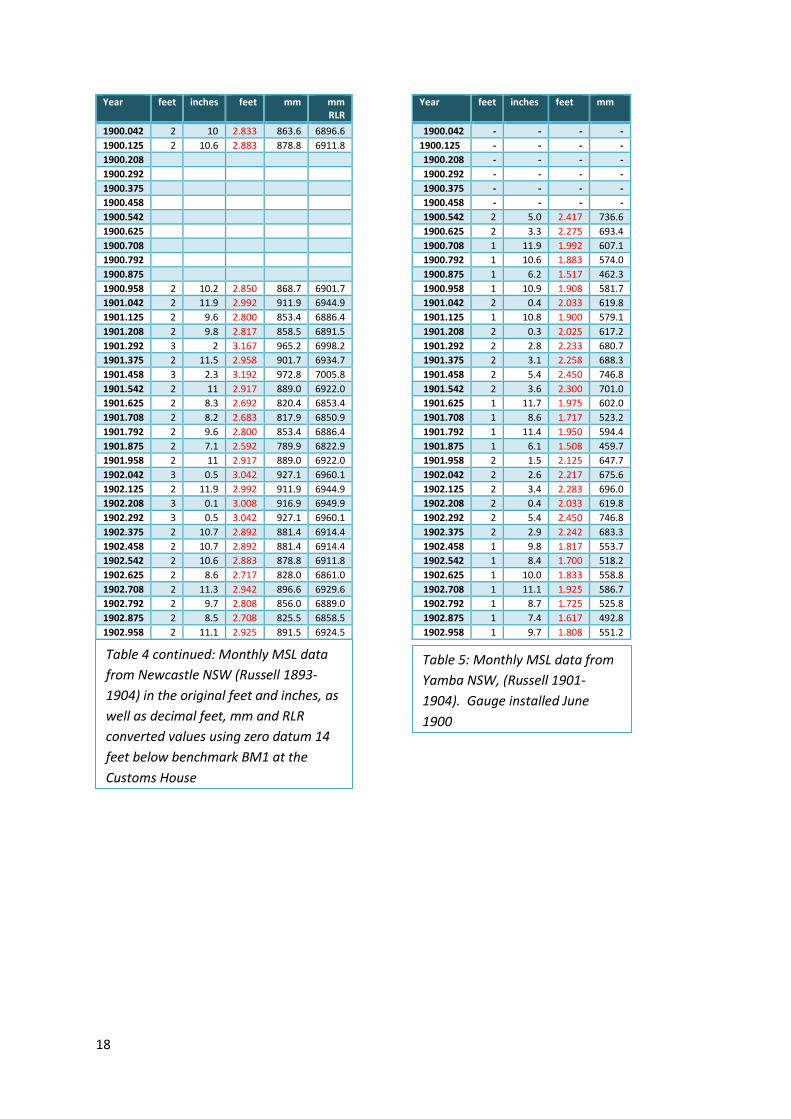
The PSMSL ancillary data includes one annual data point for 1900 (originally from Wright 1902), but
a local newspaper article (Anon. 1951) refers to the Newcastle tide gauge installed by Russell in 1890
still working 60 years later. Further research uncovered some of this data, with a monthly time
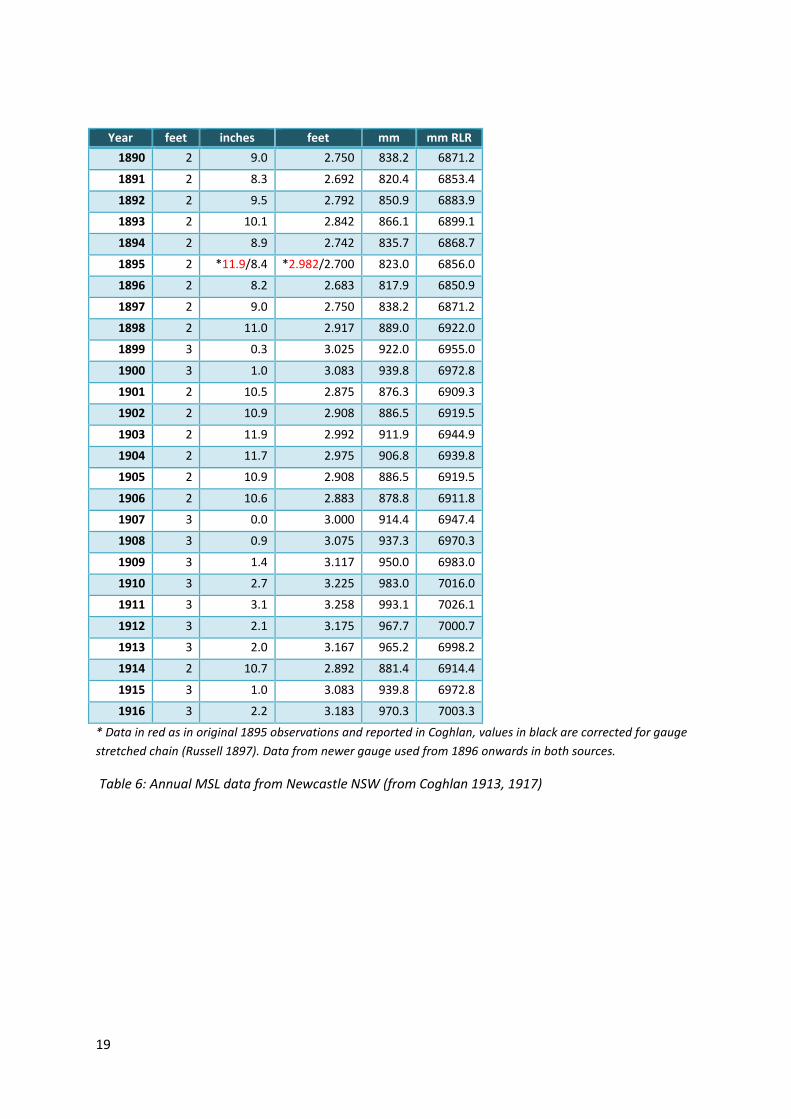
series for the years 1890 to 1902 (Russell 1893-1904, table 4), as well as a complete annual series
from 1892 to 1916 (Coghlan 1914, Coghlan 1917, table 6) leaving only a nine year gap in the 122
year long record (figure 3). The early data is referred to the same zero datum 14 feet below
benchmark BM No. 1. The tide gauge which Russell fitted in 1890 replaced an earlier one he installed
around 1870. A third gauge was installed in 1896 after it was noticed that the float chain on the
second gauge appeared to have stretched around 1895. The data for 1895 was corrected (the
increase in length of chain was known) in a subsequent 1897 update, but the Coghlan data table
retains the uncorrected values for 1895. As it stands, the available data from Newcastle broadly
matches the Sydney data, although caution should be observed as there are significant interannual
differences in the early data and subsidence is suspected close to the gauge sites (Watson 2011).
Further monthly MSL data from Ballina (18th March 1897 to 1902) and Yamba (July 1900 to 1902) can
be linked with later data from both locations and these extended series can be “buddy checked”
against both Sydney and Newcastle.
Williamstown
The PSMSL records from Williamstown, Geelong, and Point Lonsdale were compared. These series
were then used to create a more continuous composite series from late 1927 onwards, although still
with some gaps, and then extended using corrected earlier data (e.g. Ellery 1879). Some gaps were
partially filled with data published by the International Association for Physical Oceanography
(IAPO).
The literature suggests that long records existed for Williamstown, where a gauge was operating as
early as 1858 (Ellery 1879). Ellery states that he was unable to find datum information for the
earliest data from the late 1850s. The LWST (Low Water Spring Tides) datum of 9.84 feet below the
sill of the Williamstown Lighthouse reported by Captain Cox on the 1865 chart of Hobson’s Bay was
subject to an offset error caused by referencing to the zero of the gauge rather than to the Low
Water mark (Stanley 1875). This LWST datum of Cox was corrected to 7.62 feet below B.M., (Stanley
1875, Ellery 1879, it should be noted that the value of 5.95 ft in Ellery should probably read 4.95ft
and mean tide should therefore be 6.285 ft below B.M.). The high and low water levels would then
be consistent with the reported tidal range. The responsibility for the gauge was handed over to the
Melbourne Observatory under Ellery in 1874. From this time data was recorded in the observatory
tidal ledger up to 1916 (e.g. Visitors report 1881). LWST was determined again in 1884 as 7.81 feet
below the same benchmark. This value became adopted as State Datum and was used until 1970,
4
although the Harbour authority continued to refer tidal levels to a zero value at 7.62 feet below the
B.M. This means that 0.19 feet needs to be subtracted from any state datum referenced annual MSL
values, e.g. the 1909 to 1911 averaged MSL values (Bradley 1949) using 1908, 1909, and 1910 data
sent from the Melbourne Observatory, in order to reduce to the 7.62 ft datum used in the PSMSL
“metric” data (Association d'Oceanographie Physique 1950). A value of 2.387 ft should be
subtracted from the 1931 to 1939 monthly data (Association d'Oceanographie Physique, 1939) as
this is referenced to the “new” datum of 10.00 feet below the same bench-mark. The tide gauge for
the early 1930s is believed to have been affected by silting problems outside of the tide gauge well,
which reduced the total tidal range reported (Bradley 1949), but this should have a lesser impact on
derived monthly MSL values. Silting inside the tide gauge well was also reported in 1881 and 1894.
Although much of the early 1874 to 1916 data has yet to be digitised, we do have an annual MSL
(Mean Sea Level) value for 1864, average low water values for various dates, complete monthly MSL
values from July 1894 to December 1895 and some annual and longer period averaged values
(Bradley 1949, Mackenzie 1939) which are referenced to known benchmarks. These values help to
constrain trend values for the overall time series. Although Bradley questioned the reliability of the
early data due to large differences in MSL, a comparison with Sydney, Port Adelaide and Newcastle
shows that these differences most likely reflect real decadal variations in MSL. The extended series
also show that previous comments (Mackenzie 1939) about periods between the 1870s and 1930s
having similar averaged MSL values “within 0.01 of a foot” are also consistent with the recorded MSL
values for these periods in the region.
Port Adelaide
For Port Adelaide the PSMSL monthly RLR data from the outer harbour (completed around 1907)
reaches back to 1940. It is offset by an arbitrary 5616mm from the post 1971 LAT (Lowest
Astronomical Tide) datum of the PSMSL metric “outer harbour” data. This metric data is partially
derived from (and includes some corrections for) the “outer harbour II” metric series which is
referenced to the older LWST (Low Water Spring Tides) datum (270mm below LAT at this location).
The PSMSL metric data from the inner harbour also has an updated version with the (somewhat
gappy) data from 1933 onwards referenced to LAT. The earlier monthly automatic tide gauge data
from 1882 to 1891 is referred to a different datum, described in the original reference (Chapman
and Inglis 1896) as that selected by Lieut. Goalen in his survey of 1875. This datum was stated as
differing by “about 3 inches” from the Surveyor Generals City survey datum. A datum defined by
Goalen was used in early hydrographic charts (eg chart of the river 1884). His report of 1875 refers
to a low water datum 15 feet 8 inches below the deck surface above the tide gauge at the far end of
the Semaphore Jetty (Proceedings of the Parliament of South Australia, 1875). This benchmark was
destroyed when the jetty was damaged by storms in the 1930s. The inner harbour II metric data is
simply the pre LAT adjusted 1933 onwards inner harbour data referred to the same original LW
datum as the original outer harbour data. From 1921 onwards the tide gauge zero was described as
12.73 feet below a permanent “iron rail” benchmark DMH (Department of Marine and Harbors) BM1
(113.53 feet R.L.) at the Glanville Docks (Admiralty 1922) which still exists. Prior to 1921 (eg in the
1920 Admiralty tide tables) the datum was 13.5 feet below the deck of the government wharf
(possibly on North Parade) for the inner harbour, and approximated to LWST. This same 13.5 ft
government wharf datum was mentioned in Lieut. Goalens survey report of 1875 as equivalent to
the Semaphore LW datum. In an article in “Surveyor” of 1894 relative elevations of various datums
5
for Port Adelaide are again given, including the one 13.5 ft below the government wharf. In this
article, however, the mean tide level of 10 years of inner harbour data is stated to be 4.79 ft above
the Admiralty chart datum established by Goalen in 1867-1868. This was also stated to be the
Marine Board datum. The average MSL over the same 10 years from the same tide gauge tabulated
in Chapman and Inglis, referenced to the 1875 Goalen Datum is 4.179 ft. This datum discrepancy of
0.611 ft requires investigation.
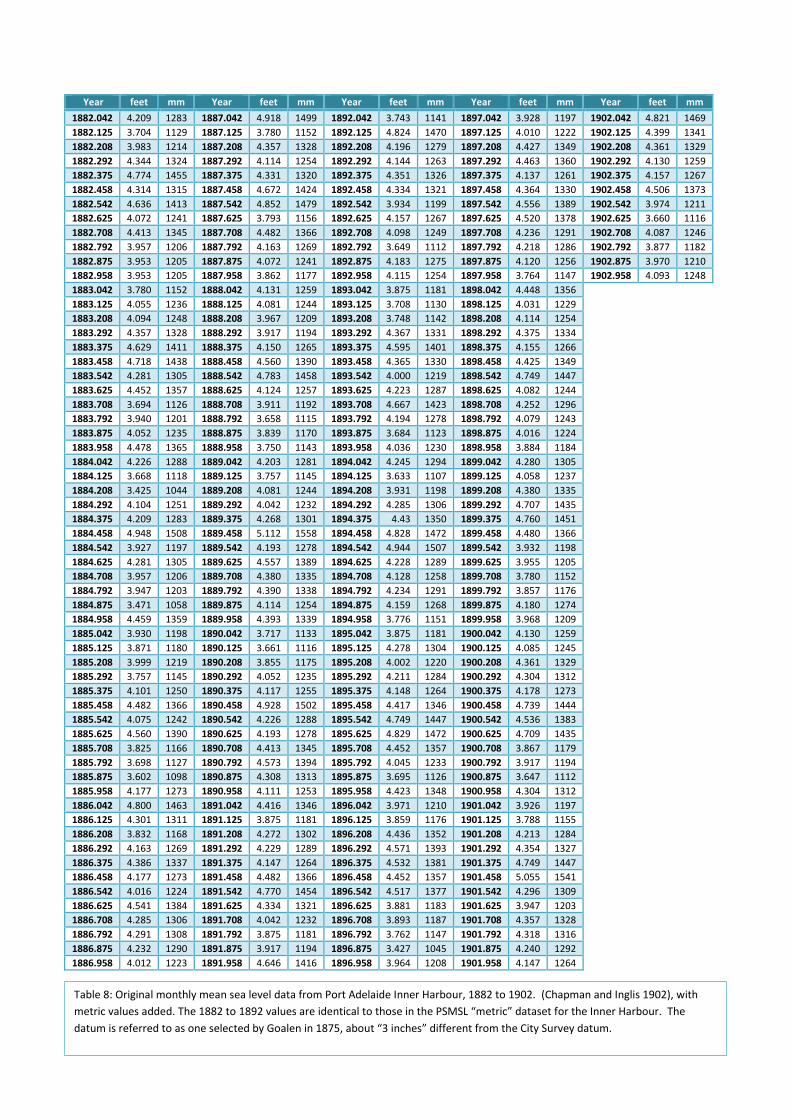
The 1882 to 1891 monthly time series (Chapman and Inglis 1894) can be extended continuously to
1902 adding an additional published, but often overlooked, complete 11 years of monthly data
(Chapman and Inglis 1902). The same 1875 datum is used. The Inner Harbour datum was also stated
to be the same as the Semaphore datum in a report from a committee including Chapman and Inglis
(Bragg et al 1892) contemporary with publication of the monthly results. This current work (Hogarth
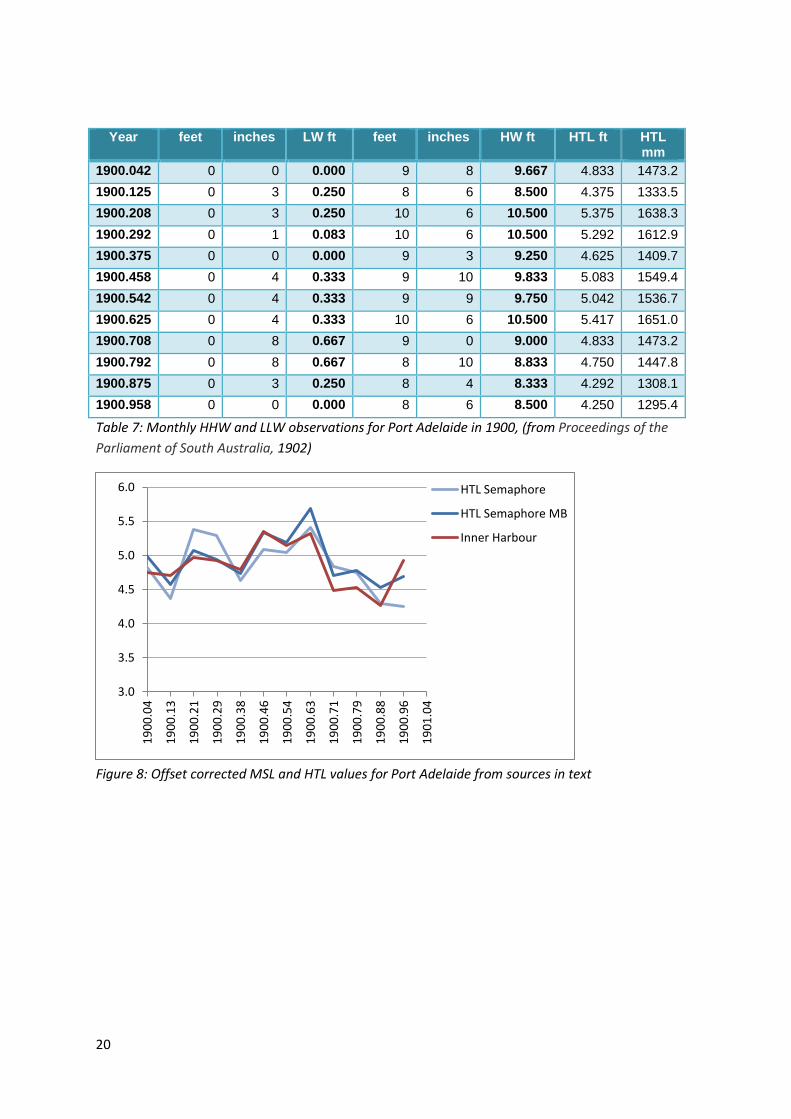
2014) has also recovered published monthly HHW (Higher High Water) and LLW (Lower Low Water)
tide gauge records (Proceedings of the Parliament of South Australia, 1902) from the year 1900
(figure 8). These records give a mean HTL (Half Tide Level) of 4.847 ft referenced to the MLLWST
(Mean Lower Low Water Spring Tides). This allows the two sets of monthly series from 1900 to be
compared. The monthly data from Chapman and Inglis (1902) averaged over the year 1900 gives
4.231 ft. The difference of 0.616 ft is almost identical to the 0.611 ft difference derived above. It
would therefore appear that the original harbour datum was MLLWST at the inner harbour, and this
would be different from an equivalent low water datum at the Semaphore.
The Admiralty tide tables also provide evidence of different datums being used. For each year from
at least as far back as 1891 to 1902 they list an approximate MSL value of 4.7 ft above chart datum
at the Semaphore and the Inner Harbour. Between 1903 and 1920 the MSL height above datum for
Port Adelaide is listed as 4.2 ft. In the 1969 tide tables the MSL at both the Inner and Outer Harbours
is listed as 4.9ft, referenced to a datum 0.6 ft below local LAT at the Inner Harbour (not the later
Australian LAT) from one years observations in 1939, and 1 ft below local LAT from 1 years
observations in 1945 at the Outer Harbour. Between 1939 and 1945 the difference in MSL from the
annual records is only around 5 to 8mm, the larger difference between LAT at the two locations is
down to the different tidal range. It would appear that sometime around 1903 the datum was
changed. The authority referred to in the tide tables for the years either side of this change is
Chapman. The Semaphore and Inner harbour elevations were frequently tied together by levelling
in the 19th Century, going as far back as 1856. The main tidal planes are also compared in the 1902
Proceedings, the measured tidal range was known to be greater in the Inner Harbour than at the
Semaphore by around 3 to 4 inches.
The datum issue across the 1902 to 1933 gap is therefore resolved using the 1892 to 1902 data, as
well as levelling information from benchmarks from the tide stations, and other historic
documentation. This allows a preliminary correction for the different datums, and a connection
between the original mean tide level (1882 datum) and MSL values referred to the modern LAT. This
is estimated by least squares to be 186mm. We can then sanity check the datum shift result against
old and new bench mark elevations. Lt. Goalens survey of 1875 used a datum (Lowest Low Water
datum) 15 feet 8 inches below the top of the deck of the Semaphore jetty, and modern
measurements of the elevation of a newer survey mark on the deck of the jetty of 15.87 ft to LAT,
would give a difference of 62mm between these “bench-marks”. This is 22mm short of the 84 mm
difference (270 -186mm) estimated from the tidal data, an error of less than 1 inch – the resolution
6
of the original imperial datum measurement, whilst the “three inches” or approximately 76mm, falls
somewhere between 62 and 84mm. This datum offset should remain preliminary until the
benchmark data can be further verified, although it appears virtually identical to the offset used by
the DMH to connect the early and later data as reported by Wynne et al (1984).
This result highlights issues with a previous study using the old inner harbour data (Culver 1970).
This study is known to have datum errors, and the derived SLR of 2.4mm/yr for Port Adelaide
between 1882 and 1968 from Culver is therefore most likely an overestimate. As this anomalously
high long term relative SLR rate was partly attributed to an assumed extension of the subsidence in
the Northern Plain to the area near the tide gauges (Belperio 1993), this interpretation must be re-
evaluated. The value derived from DMH of 1.5mm/yr (and 1.41mm/yr from this study) is more
consistent with long term regional SLR over this timescale.
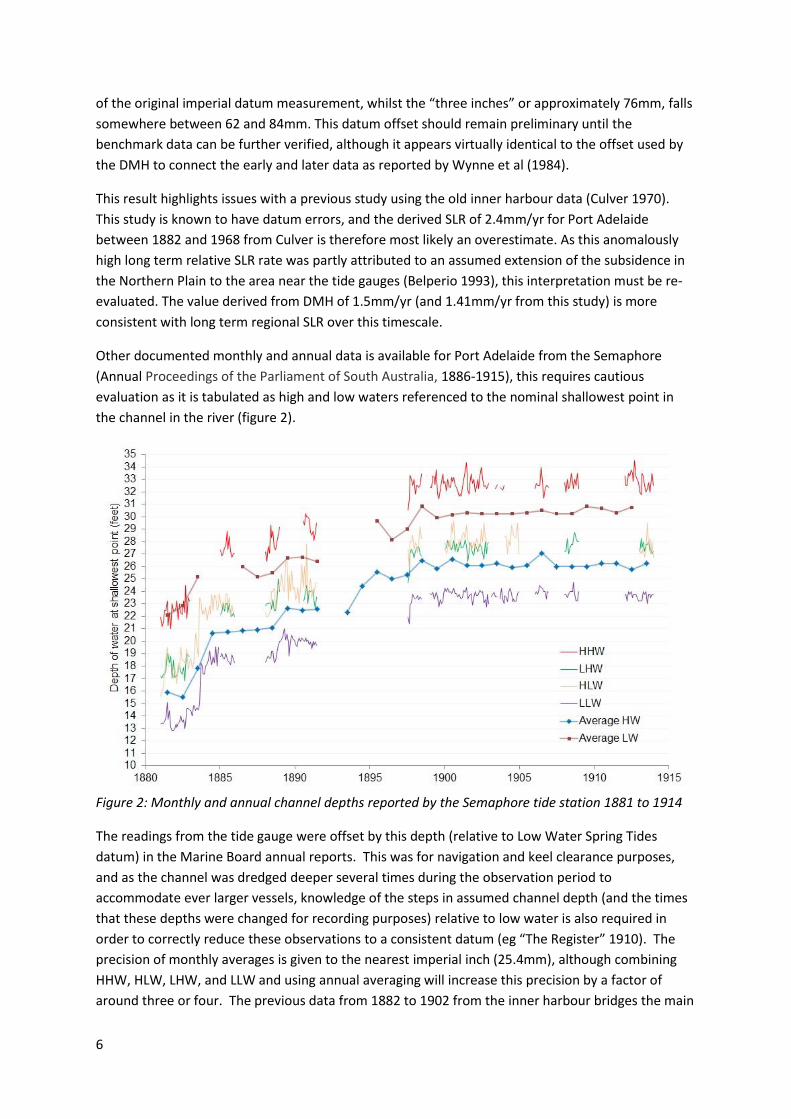
Other documented monthly and annual data is available for Port Adelaide from the Semaphore
(Annual Proceedings of the Parliament of South Australia, 1886-1915), this requires cautious
evaluation as it is tabulated as high and low waters referenced to the nominal shallowest point in
the channel in the river (figure 2).
Figure 2: Monthly and annual channel depths reported by the Semaphore tide station 1881 to 1914
The readings from the tide gauge were offset by this depth (relative to Low Water Spring Tides
datum) in the Marine Board annual reports. This was for navigation and keel clearance purposes,
and as the channel was dredged deeper several times during the observation period to
accommodate ever larger vessels, knowledge of the steps in assumed channel depth (and the times
that these depths were changed for recording purposes) relative to low water is also required in
order to correctly reduce these observations to a consistent datum (eg “The Register” 1910). The
precision of monthly averages is given to the nearest imperial inch (25.4mm), although combining
HHW, HLW, LHW, and LLW and using annual averaging will increase this precision by a factor of
around three or four. The previous data from 1882 to 1902 from the inner harbour bridges the main
7
period of dredging activity from start to finish and allows cross checking and reduction of this data to
a common datum. This allows monthly and annual Half Tide Level data from 1881 and from 1902 to
1914 to be added to the Port Adelaide time series. It is fortuitous that these years were outside the
main channel deepening operations. Similar old data is available for Port Augusta and Port Pirie.
Other changes associated with the Inner Harbour involved using the more permanent “iron rail”
benchmark at the Glanville Docks from 1921 (Anon 1922) which still exists (TGZ is 12.73 feet below
this BM, originally referred to as DMH BM1), and the official Australia wide datum changes from
local LW (Low Water) to AHD (Australian Height Datum, approximate MSL) in 1971 and then LAT in
2001. The offset metric PSMSL values for 1933 to 1940 appear to give anomalously low values which
are not apparent in the data for the inner harbour from DMH (Wynne et al 1984). These low values,
if included, would increase the overall sea level acceleration values. In this study the DMH
observations are used. The final acceleration value is still slightly outside the error limits of the
global average (0.01 ± 0.008 mm/yr2), and this is consistent with possible contribution from
groundwater extraction in recent decades.
Subsidence due to water extraction has certainly been observed in Northern parts of Adelaide. This
subsidence may extend far enough to influence the Port Adelaide tide gauges (Belperio 1993, King
2008), although the situation and geology, and actual aquifer recharge rates near the port area are
complex (Lamontagne 2005). Third order re-levelling in 1969 gave estimates of around -1.8mm/yr
relative land motion in the Port Adelaide area (Culver 1970) based on the differentials between an
1880 survey of the old EWS (Engineering and Water Supply) department benchmarks and the 1969
elevations. More accurate repeat levelling work in the 1980s and 1990s has confirmed and refined
the estimates of relative subsidence in the North Plain area where industrial scale water extraction is
ongoing, but as yet no information has been found about further studies at the tide gauge sites. The
earliest EWS cast iron benchmarks, set after 1872, were marked with height in feet above EWS low
water datum of the time. Some of these still exist. A brief examination of three of these could be
interpreted as settling in the vicinity of Glenelg relative to Central Adelaide at a rate around 1mm/yr,
although the stability of the benchmarks over this period should be considered (Filmer et al 2007),
and individual variations were noted in the report by Culver, which used 42 benchmarks in total.
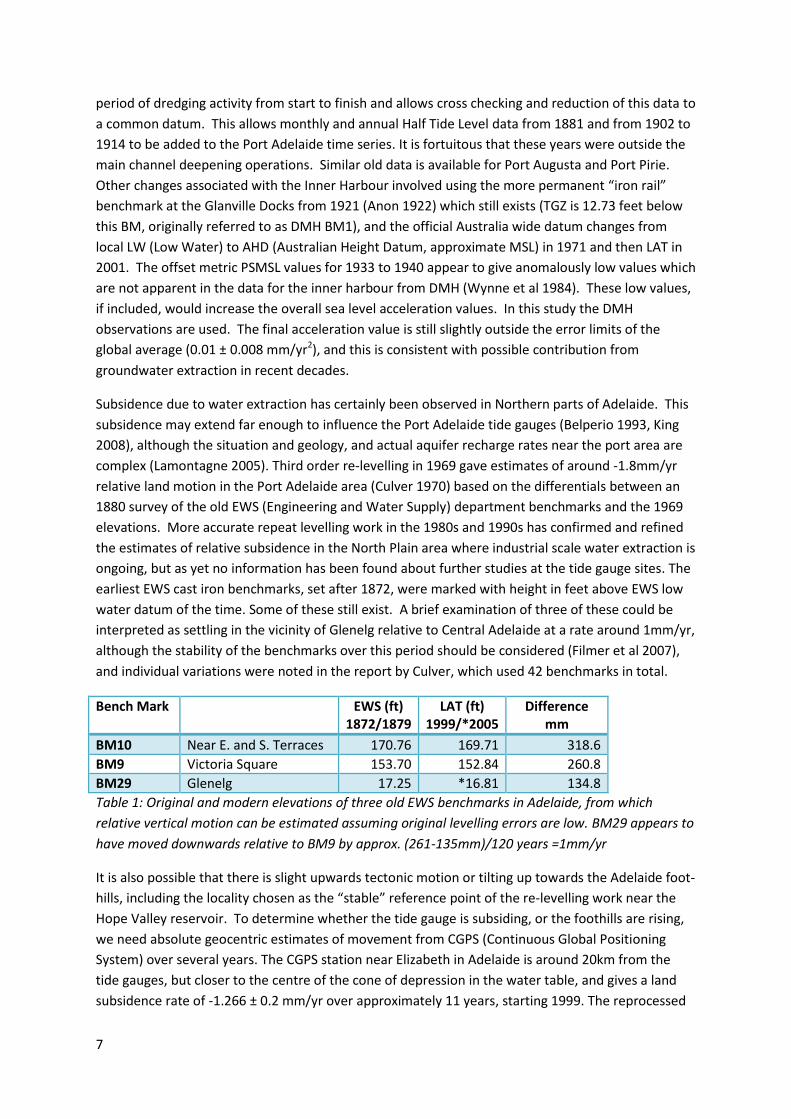
Bench Mark EWS (ft) 1872/1879
LAT (ft) 1999/*2005
Difference mm
BM10 Near E. and S. Terraces 170.76 169.71 318.6
BM9 Victoria Square 153.70 152.84 260.8
BM29 Glenelg 17.25 *16.81 134.8
Table 1: Original and modern elevations of three old EWS benchmarks in Adelaide, from which
relative vertical motion can be estimated assuming original levelling errors are low. BM29 appears to
have moved downwards relative to BM9 by approx. (261-135mm)/120 years =1mm/yr
It is also possible that there is slight upwards tectonic motion or tilting up towards the Adelaide foot-
hills, including the locality chosen as the “stable” reference point of the re-levelling work near the
Hope Valley reservoir. To determine whether the tide gauge is subsiding, or the foothills are rising,
we need absolute geocentric estimates of movement from CGPS (Continuous Global Positioning
System) over several years. The CGPS station near Elizabeth in Adelaide is around 20km from the
tide gauges, but closer to the centre of the cone of depression in the water table, and gives a land
subsidence rate of -1.266 ± 0.2 mm/yr over approximately 11 years, starting 1999. The reprocessed
8
ULR5 solution gives -0.95 ± 0.29 mm/yr over the same period (Santa Maria Gomez et al 2012). The
CORS CGPS sites in central Adelaide and at Port Stanvac give vertical motion of 0.6mm/yr (4.5 years
record) and -0.1 mm/yr (four years record) respectively, but these time periods are short, so these
rates should be regarded as indicative only. However, whilst an analysis of differences in tide gauge
data between the outer Harbour and either Port Victor or Port Lincoln between 1965 and 1995 do
reveal interannual variations, no significant secular trends are apparent that could be attributed to
longer term relative differences in land motion. At Port Stanvac, which is considerably closer to the
Adelaide tide gauges, but where only 20 years of overlapping data are available, the differential
values do suggest a difference in relative SLR (most likely due to relative land subsidence) of around
1mm/yr at the Outer Harbour. Comparing with Port Pirie, where 50 years of overlapping data are
available, the trend difference is around +3mm/yr, which is consistent with the tectonic uplift and
tilting towards Port Augusta at the head of the bay reported in geological studies of the area. As yet
there are not enough long term records from CGPS stations that could help fully clarify the situation,
and we must rely on the tide gauge, benchmark and levelling information. These suggest a long
term (centennial) SLR of around 1.5mm/yr at Port Adelaide, in line with global estimates, and an
acceleration value slightly higher than the global average, any small difference possibly due to
localised subsidence in recent decades.
Fremantle
The long record from Fremantle on the West Coast of Australia was also used in the overall global
analysis. There is significant and variable recorded subsidence in nearby urban areas over past
decades due to ground water extraction (Belperio 1993) as measured using bench marks and
levelling. The rate of extraction and water table measurements correlate with subsidence rates as
measured directly by CGPS (Featherstone 2012), and the long (14 yr) GPS record (TIGA ULR5) gives -
2.99 ± 0.39 mm/yr although this station is not co-located with the gauge. Whilst increased
subsidence at the tide gauge would have the effect of increasing the rate of Relative Sea Level rise,
the Fremantle gauge is slightly outside the probable radius of influence of subsidence, and is
situated on bedrock. Feng (2004) also links the multidecadal variations in the Fremantle tide gauge
data to phases of the SOI, and this would help explain the relatively low average rate of sea level rise
in the second half of the 20th Century at this location. The recent decade has seen acceleration in SLR
to values much higher than the global average, which is probably linked to a change in phase of SOI.
If this is the case, then this excess rise is a regional effect which is temporary at multi-decadal
timescales. The ongoing water extraction rate is certainly implicated in the higher relative rise at the
Hillary gauge (Burgette 2013), much closer to the GPS station.
9
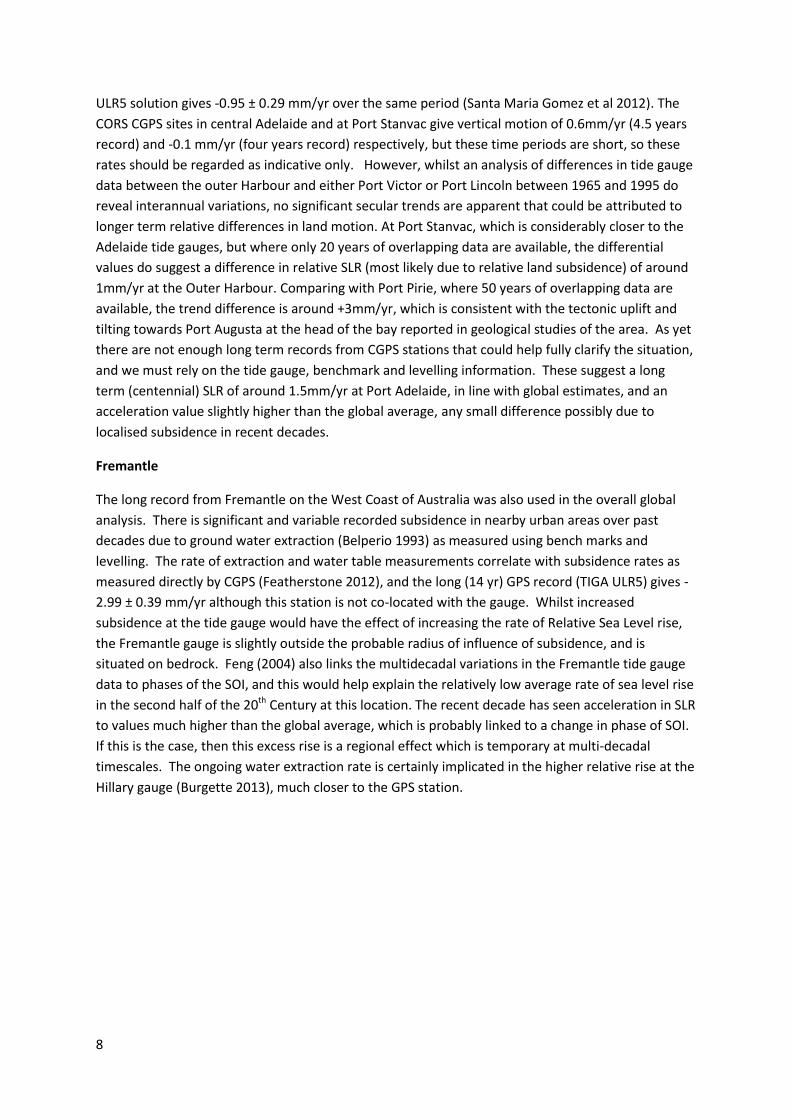
Summary of results
Figure 3: Annual MSL time series from five Australian ports showing extended data at four locations.
Time series have been offset for clarity.
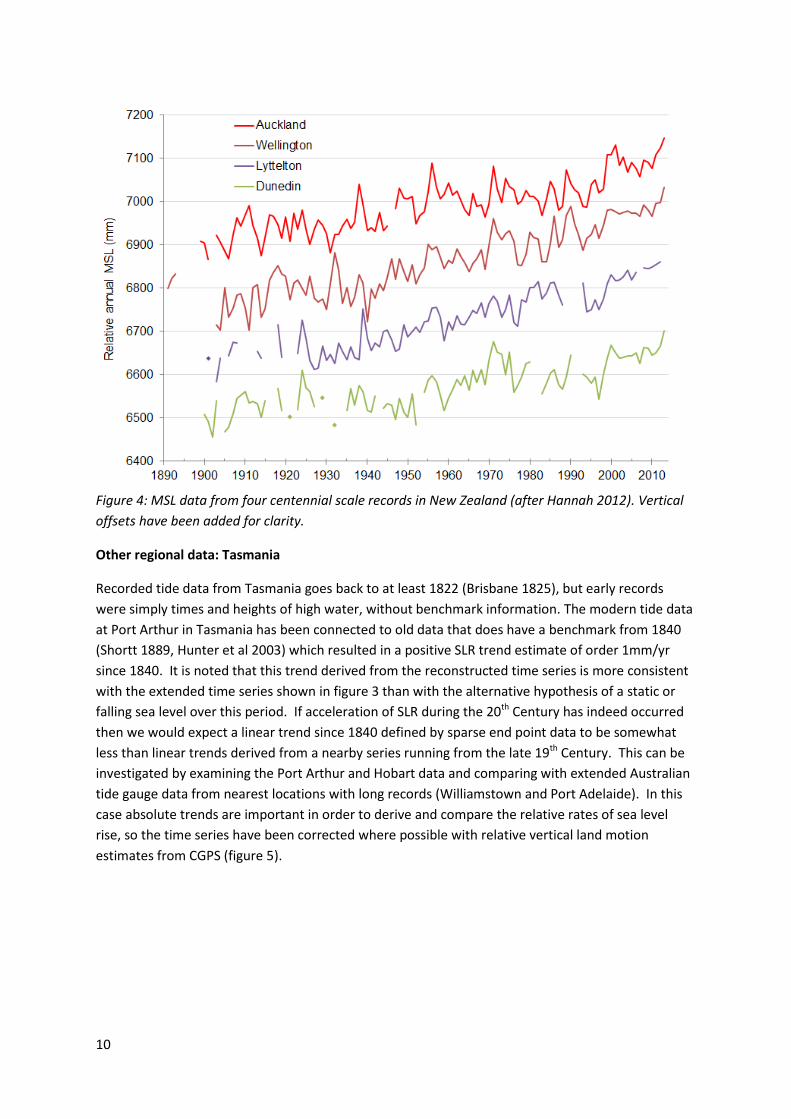
Other regional data: New Zealand
PSMSL data with the corrections, extensions and updates as suggested by Hannah (2010, 2012) from
the four longest tide gauge series in New Zealand was also used, these were further updated as far
as possible to 2013 (figure 4), and checked against results of Cole (2011). The work of Hannah in
terms of data recovery is comprehensive, and only very sparse additional documentary evidence
leading to one or two years of time series extension has been found to date. Recent attempts have
been made to correct the trends with vertical land motion from altimetry and CGPS (Fadil et al 2013,
Tenzer et al 2014), however in figure 3 no vertical land motion corrections are applied. The early
data 1891 to 1893 from Wellington is not used in deriving acceleration for this station as the datum
information is unclear.
10
Figure 4: MSL data from four centennial scale records in New Zealand (after Hannah 2012). Vertical
offsets have been added for clarity.
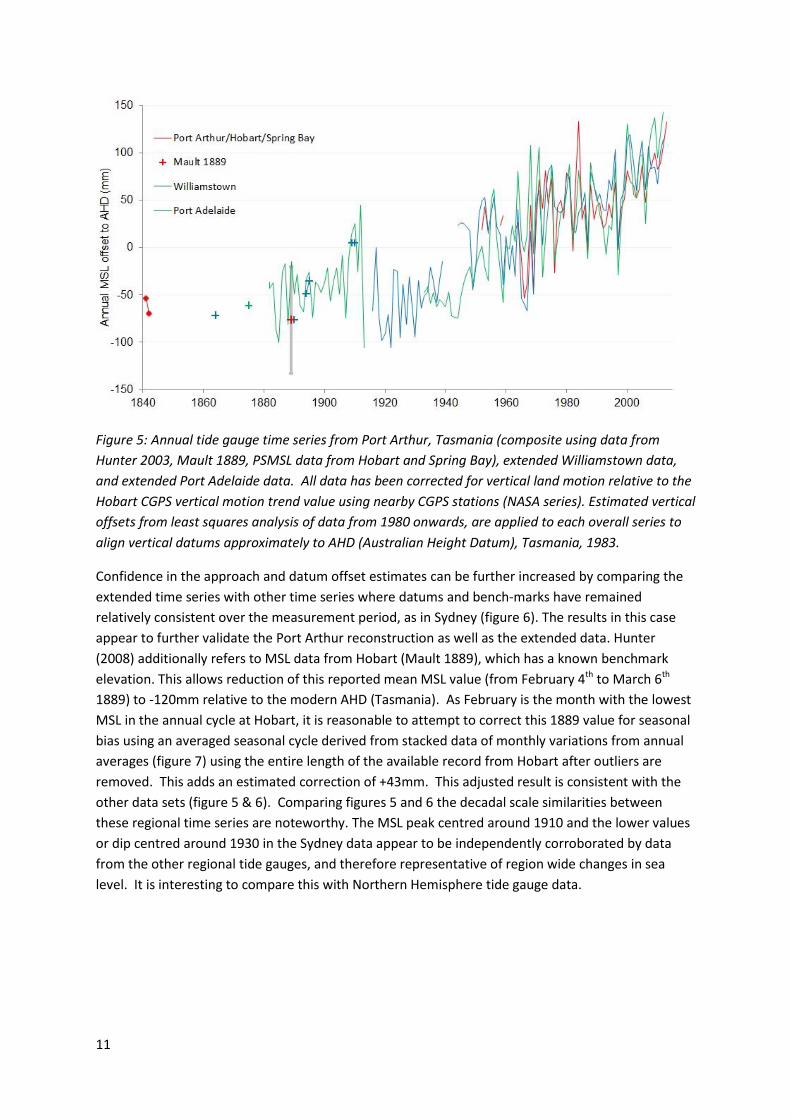
Other regional data: Tasmania
Recorded tide data from Tasmania goes back to at least 1822 (Brisbane 1825), but early records
were simply times and heights of high water, without benchmark information. The modern tide data
at Port Arthur in Tasmania has been connected to old data that does have a benchmark from 1840
(Shortt 1889, Hunter et al 2003) which resulted in a positive SLR trend estimate of order 1mm/yr
since 1840. It is noted that this trend derived from the reconstructed time series is more consistent
with the extended time series shown in figure 3 than with the alternative hypothesis of a static or
falling sea level over this period. If acceleration of SLR during the 20th Century has indeed occurred
then we would expect a linear trend since 1840 defined by sparse end point data to be somewhat
less than linear trends derived from a nearby series running from the late 19th Century. This can be
investigated by examining the Port Arthur and Hobart data and comparing with extended Australian
tide gauge data from nearest locations with long records (Williamstown and Port Adelaide). In this
case absolute trends are important in order to derive and compare the relative rates of sea level
rise, so the time series have been corrected where possible with relative vertical land motion
estimates from CGPS (figure 5).
11
Figure 5: Annual tide gauge time series from Port Arthur, Tasmania (composite using data from
Hunter 2003, Mault 1889, PSMSL data from Hobart and Spring Bay), extended Williamstown data,
and extended Port Adelaide data. All data has been corrected for vertical land motion relative to the
Hobart CGPS vertical motion trend value using nearby CGPS stations (NASA series). Estimated vertical
offsets from least squares analysis of data from 1980 onwards, are applied to each overall series to
align vertical datums approximately to AHD (Australian Height Datum), Tasmania, 1983.
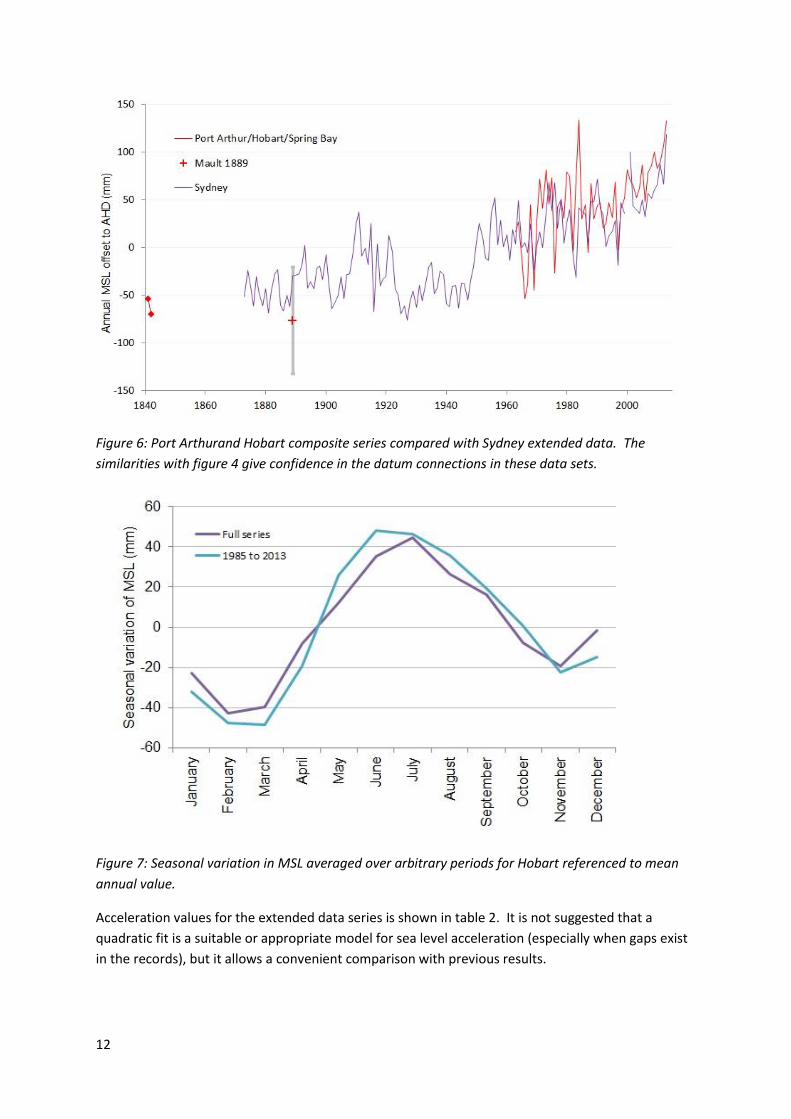
Confidence in the approach and datum offset estimates can be further increased by comparing the
extended time series with other time series where datums and bench-marks have remained
relatively consistent over the measurement period, as in Sydney (figure 6). The results in this case
appear to further validate the Port Arthur reconstruction as well as the extended data. Hunter
(2008) additionally refers to MSL data from Hobart (Mault 1889), which has a known benchmark
elevation. This allows reduction of this reported mean MSL value (from February 4th to March 6th
1889) to -120mm relative to the modern AHD (Tasmania). As February is the month with the lowest
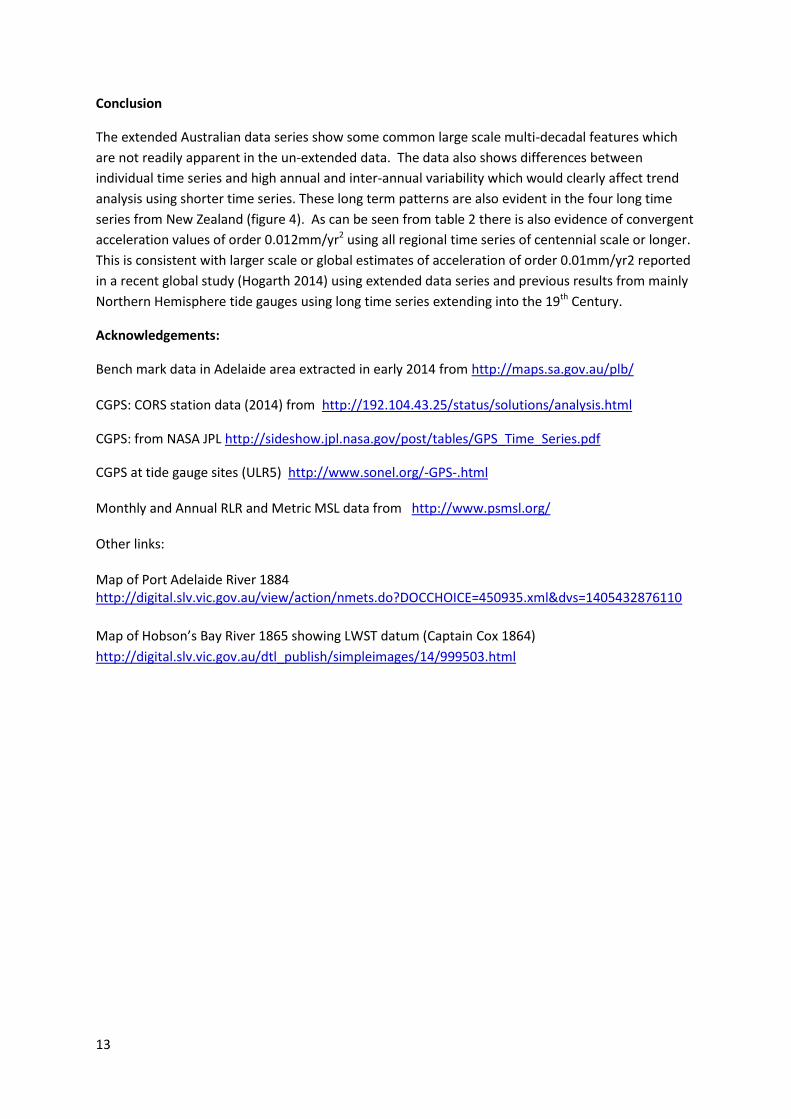
MSL in the annual cycle at Hobart, it is reasonable to attempt to correct this 1889 value for seasonal
bias using an averaged seasonal cycle derived from stacked data of monthly variations from annual
averages (figure 7) using the entire length of the available record from Hobart after outliers are
removed. This adds an estimated correction of +43mm. This adjusted result is consistent with the
other data sets (figure 5 & 6). Comparing figures 5 and 6 the decadal scale similarities between
these regional time series are noteworthy. The MSL peak centred around 1910 and the lower values
or dip centred around 1930 in the Sydney data appear to be independently corroborated by data
from the other regional tide gauges, and therefore representative of region wide changes in sea
level. It is interesting to compare this with Northern Hemisphere tide gauge data.
12
Figure 6: Port Arthurand Hobart composite series compared with Sydney extended data. The
similarities with figure 4 give confidence in the datum connections in these data sets.
Figure 7: Seasonal variation in MSL averaged over arbitrary periods for Hobart referenced to mean
annual value.
Acceleration values for the extended data series is shown in table 2. It is not suggested that a
quadratic fit is a suitable or appropriate model for sea level acceleration (especially when gaps exist
in the records), but it allows a convenient comparison with previous results.
13
Conclusion
The extended Australian data series show some common large scale multi-decadal features which
are not readily apparent in the un-extended data. The data also shows differences between
individual time series and high annual and inter-annual variability which would clearly affect trend
analysis using shorter time series. These long term patterns are also evident in the four long time
series from New Zealand (figure 4). As can be seen from table 2 there is also evidence of convergent
acceleration values of order 0.012mm/yr2 using all regional time series of centennial scale or longer.
This is consistent with larger scale or global estimates of acceleration of order 0.01mm/yr2 reported
in a recent global study (Hogarth 2014) using extended data series and previous results from mainly
Northern Hemisphere tide gauges using long time series extending into the 19th Century.
Acknowledgements:
Bench mark data in Adelaide area extracted in early 2014 from http://maps.sa.gov.au/plb/ CGPS: CORS station data (2014) from http://192.104.43.25/status/solutions/analysis.html
CGPS: from NASA JPL http://sideshow.jpl.nasa.gov/post/tables/GPS_Time_Series.pdf
CGPS at tide gauge sites (ULR5) http://www.sonel.org/-GPS-.html Monthly and Annual RLR and Metric MSL data from http://www.psmsl.org/ Other links: Map of Port Adelaide River 1884 http://digital.slv.vic.gov.au/view/action/nmets.do?DOCCHOICE=450935.xml&dvs=1405432876110
Map of Hobson’s Bay River 1865 showing LWST datum (Captain Cox 1864)
http://digital.slv.vic.gov.au/dtl_publish/simpleimages/14/999503.html
14
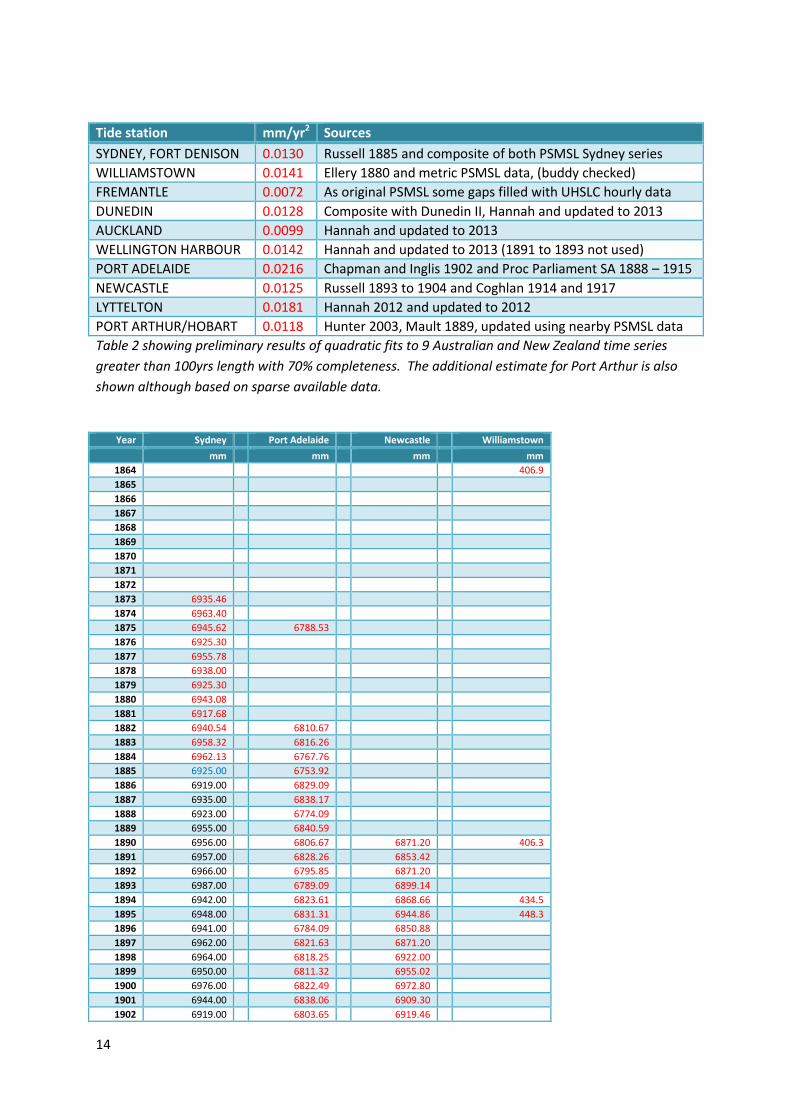
Tide station mm/yr2 Sources
SYDNEY, FORT DENISON 0.0130 Russell 1885 and composite of both PSMSL Sydney series
WILLIAMSTOWN 0.0141 Ellery 1880 and metric PSMSL data, (buddy checked)
FREMANTLE 0.0072 As original PSMSL some gaps filled with UHSLC hourly data
DUNEDIN 0.0128 Composite with Dunedin II, Hannah and updated to 2013
AUCKLAND 0.0099 Hannah and updated to 2013
WELLINGTON HARBOUR 0.0142 Hannah and updated to 2013 (1891 to 1893 not used)
PORT ADELAIDE 0.0216 Chapman and Inglis 1902 and Proc Parliament SA 1888 – 1915
NEWCASTLE 0.0125 Russell 1893 to 1904 and Coghlan 1914 and 1917
LYTTELTON 0.0181 Hannah 2012 and updated to 2012
PORT ARTHUR/HOBART 0.0118 Hunter 2003, Mault 1889, updated using nearby PSMSL data
Table 2 showing preliminary results of quadratic fits to 9 Australian and New Zealand time series
greater than 100yrs length with 70% completeness. The additional estimate for Port Arthur is also
shown although based on sparse available data.
Year Sydney Port Adelaide Newcastle Williamstown
mm mm mm mm
1864 406.9
1865
1866
1867
1868
1869
1870
1871
1872
1873 6935.46
1874 6963.40
1875 6945.62 6788.53
1876 6925.30
1877 6955.78
1878 6938.00
1879 6925.30
1880 6943.08
1881 6917.68
1882 6940.54 6810.67
1883 6958.32 6816.26
1884 6962.13 6767.76
1885 6925.00 6753.92
1886 6919.00 6829.09
1887 6935.00 6838.17
1888 6923.00 6774.09
1889 6955.00 6840.59
1890 6956.00 6806.67 6871.20 406.3
1891 6957.00 6828.26 6853.42
1892 6966.00 6795.85 6871.20
1893 6987.00 6789.09 6899.14
1894 6942.00 6823.61 6868.66 434.5
1895 6948.00 6831.31 6944.86 448.3
1896 6941.00 6784.09 6850.88
1897 6962.00 6821.63 6871.20
1898 6964.00 6818.25 6922.00
1899 6950.00 6811.32 6955.02
1900 6976.00 6822.49 6972.80
1901 6944.00 6838.06 6909.30
1902 6919.00 6803.65 6919.46
15
Year Sydney Port Adelaide Newcastle Williamstown
mm mm mm mm
1903 6925.00 6844.87 6944.86
1904 6933.00 6857.57 6939.78
1905 6952.00 6825.82 6919.46
1906 6929.00 6856.94 6911.84
1907 6954.00 6800.42 6947.40
1908 6955.00 6853.76 6970.26
1909 6978.00 6889.32 6982.96 490.7
1910 7007.00 6902.02 7015.98 490.7
1911 7019.00 6851.22 7026.14
1912 6973.00 6911.97 7000.74
1913 6981.00 6776.61 6998.20
1914 6964.00 6914.38
1915 7007.00 6972.80
1916 6914.00 7003.28 419.4
1917 6985.00 486.8
1918 6941.00 413.4
1919 6948.00 388.7
1920 6950.00 396.8
1921 6993.00 417.1
1922 6976.00 381.8
1923 6937.00 464.8
1924 6931.00 463.0
1925 6911.00 392.8
1926 6919.00 6996.00 449.5
1927 6904.00 6972.00 407.0
1928 6924.00 6937.00 457.3
1929 6934.00 6918.00 427.0
1930 6917.00 6906.00 394.0
1931 6940.00 6948.00 454.3
1932 6923.00 6883.00 425.1
1933 6938.00 6820.50 6879.00 438.3
1934 6958.00 6827.00 6917.00 442.6
1935 6963.00 6810.42 6861.00 469.2
1936 6930.00 6721.33 6801.00 455.3
1937 6936.00 6806.92 6834.00 432.2
1938 6954.00 6899.00 455.8
1939 6950.00 6970.00 475.6
1940 6919.00 6914.00
1941 6916.00 6899.00
1942 6937.00 6939.00
1943 6938.00 6837.42 6945.00
1944 6914.00 6863.08 6953.00 514.7
1945 6940.00 6820.00 6917.00 517.8
1946 6939.00 6835.00 6907.00 516.9
1947 6922.00 6845.00 6868.00 514.1
1948 6943.00 6853.00 6845.00 508.8
1949 6957.00 6834.00 6945.00 447.5
1950 6982.00 6854.00 7005.00 469.3
1951 7002.00 6867.00 7018.00 528.3
1952 6987.00 6876.00 6971.00 541.6
1953 6965.00 6854.00 6944.00 545.6
1954 6963.00 6840.00 6976.00 510.3
1955 7012.00 6925.00 7037.00 529.1
1956 7028.00 6938.00 7005.00 546.4
1957 6979.00 6885.00 6978.00 515.6
1958 7004.00 6852.00 7005.00 506.7
1959 6976.00 6819.00 7016.00 454.4
1960 6989.00 6879.00 7042.00 505.5
1961 6962.00 6876.00 6992.00 471.2
1962 6994.00 6901.00 7006.00 496.2
1963 6979.00 6884.00 7007.00 463.5
1964 7024.00 6959.00 7030.00 534.4
16
Year Sydney Port Adelaide Newcastle Williamstown
mm mm mm mm
1965 6975.00 6887.00 6967.00 440.8
1966 6980.00 6875.00 6994.00 435.3
1967 6969.00 6893.00 6990.00 427.4
1968 6999.00 6988.00 7030.00 512.3
1969 6951.00 6873.00 6978.00 446.0
1970 6976.00 6944.00 6967.00 544.7
1971 6990.00 6987.00 7016.00 556.3
1972 6974.00 6850.00 7013.00 498.3
1973 7010.00 6891.00 7005.00 551.3
1974 7041.00 6926.00 7046.00 576.3
1975 7012.00 6967.00 7016.00 583.2
1976 7041.00 6867.00 7065.00 539.3
1977 6993.00 6890.00 7004.00 535.2
1978 7024.00 6921.00 7046.00 533.3
1979 6977.00 6923.00 6998.00 537.9
1980 6999.00 6942.00 7014.00 574.8
1981 7012.00 6972.00 7051.00 568.8
1982 6962.00 6890.00 6967.00 516.1
1983 6941.00 6919.00 6951.00 512.8
1984 7014.00 6966.00 6967.00 534.2
1985 7010.00 6925.00 7047.00 541.7
1986 7007.00 6919.00 7019.00 556.3
1987 6975.00 6874.00 6983.00 502.1
1988 7020.00 6976.00 7042.00 578.2
1989 7019.00 6951.00 7063.00 563.7
1990 7043.00 6942.00 7053.00 547.8
1991 7012.00 6922.00 7018.00 555.2
1992 7005.00 6908.00 7038.00 539.0
1993 6972.00 6880.00 6980.00 537.6
1994 6983.00 6911.00 6996.00 570.7
1995 6988.00 6907.00 7001.00 560.0
1996 6999.00 6979.00 7035.00 603.3
1997 6952.00 6860.00 6989.00 497.8
1998 7017.00 6913.00 7057.00 550.8
1999 7006.00 6966.00 7048.00 561.1
2000 7021.00 7064.00 614.7
2001 7070.00 6993.00 7114.00 619.3
2002 7013.00 6947.00 7045.00 590.3
2003 7009.00 6943.00 7031.00 561.1
2004 7005.00 6987.00 7020.00 592.6
2005 7019.00 6990.00 7031.00 613.4
2006 7001.00 6917.00 7043.00 562.0
2007 7026.00 6993.00 7057.00 607.9
2008 7020.00 7016.00 7065.00 585.1
2009 7029.00 7030.00 7045.00 586.3
2010 7034.00 6988.00 7046.00 568.8
2011 7056.00 7013.00 7086.00 603.1
2012 7035.00 7037.00 7076.00 615.9
2013 7087.00 634.3
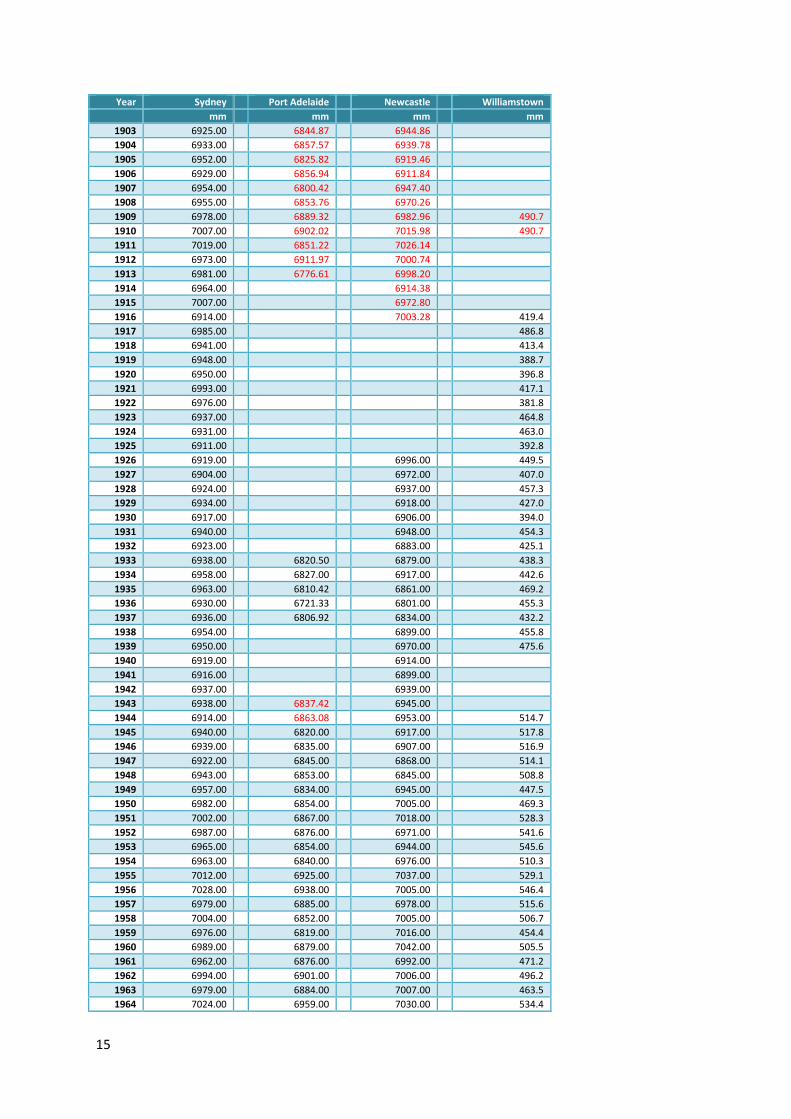
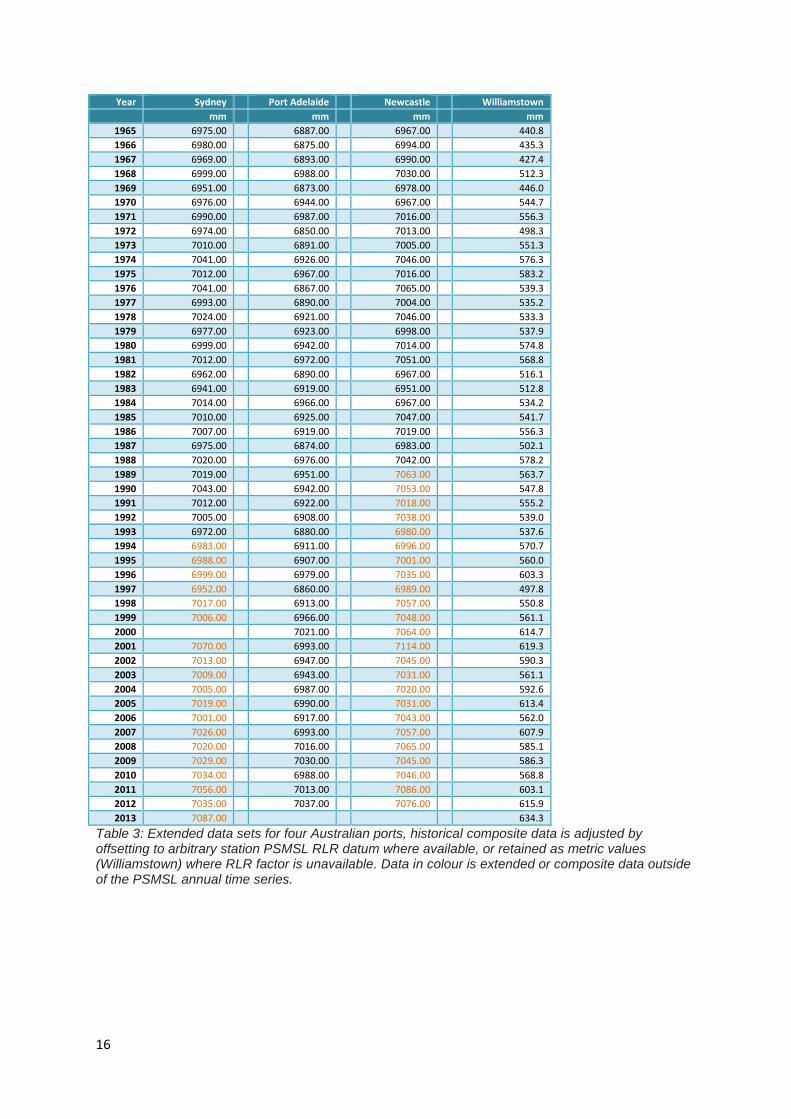
Table 3: Extended data sets for four Australian ports, historical composite data is adjusted by offsetting to arbitrary station PSMSL RLR datum where available, or retained as metric values (Williamstown) where RLR factor is unavailable. Data in colour is extended or composite data outside of the PSMSL annual time series.
17
Year feet inches feet mm mm RLR
Year feet inches feet mm mm RLR
1890.042 2 4.2 2.350 716.3 6749.3 1895.042 2 11.1 2.925 891.5 6924.5
1890.125 2 8.3 2.692 820.4 6853.4 1895.125 3 1.1 3.092 942.3 6975.3
1890.208 2 11 2.917 889.0 6922.0 1895.208 2 11.1 2.925 891.5 6924.5
1890.292 1895.292 2 10.4 2.867 873.8 6906.8
1890.375 1895.375 2 11.9 2.992 911.9 6944.9
1890.458 1895.458 3 0.8 3.067 934.7 6967.7
1890.542 1895.542 2 10.4 2.867 873.8 6906.8
1890.625 1895.625 2 8.2 2.683 817.9 6850.9
1890.708 1895.708 2 10.4 2.867 873.8 6906.8
1890.792 1895.792 3 0.1 3.008 916.9 6949.9
1890.875 1895.875 3 1.5 3.125 952.5 6985.5
1890.958 1895.958 3 4.4 3.367 1026.2 7059.2
1891.042 2 7.6 2.633 802.6 6835.6 1896.042 2 9.4 2.783 848.4 6881.4
1891.125 2 7.3 2.608 795.0 6828.0 1896.125 2 7.3 2.608 795.0 6828.0
1891.208 2 8.8 2.733 833.1 6866.1 1896.208 2 10.4 2.867 873.8 6906.8
1891.292 2 7.7 2.642 805.2 6838.2 1896.292
1891.375 2 5.8 2.483 756.9 6789.9 1896.375
1891.458 3 2.1 3.175 967.7 7000.7 1896.458
1891.542 2 10.6 2.883 878.8 6911.8 1896.542
1891.625 2 7.7 2.642 805.2 6838.2 1896.625
1891.708 2 8.3 2.692 820.4 6853.4 1896.708
1891.792 2 5.6 2.467 751.8 6784.8 1896.792
1891.875 2 6.2 2.517 767.1 6800.1 1896.875
1891.958 2 9.5 2.792 850.9 6883.9 1896.958
1892.042 1897.042 2 11.6 2.967 904.2 6937.2
1892.125 1897.125 2 6.7 2.558 779.8 6812.8
1892.208 1897.208 2 10.9 2.908 886.5 6919.5
1892.292 3 2.8 3.233 985.5 7018.5 1897.292 2 10.4 2.867 873.8 6906.8
1892.375 2 9.2 2.767 843.3 6876.3 1897.375 2 8.6 2.717 828.0 6861.0
1892.458 3 0.1 3.008 916.9 6949.9 1897.458 2 6.7 2.558 779.8 6812.8
1892.542 2 7.4 2.617 797.6 6830.6 1897.542 2 10.7 2.892 881.4 6914.4
1892.625 2 8.3 2.692 820.4 6853.4 1897.625 2 8.8 2.733 833.1 6866.1
1892.708 2 8.6 2.717 828.0 6861.0 1897.708 2 7.7 2.642 805.2 6838.2
1892.792 2 7.5 2.625 800.1 6833.1 1897.792 2 8.3 2.692 820.4 6853.4
1892.875 2 9.2 2.767 843.3 6876.3 1897.875 2 9 2.750 838.2 6871.2
1892.958 2 11.2 2.933 894.1 6927.1 1897.958 2 8.8 2.733 833.1 6866.1
1893.042 3 0 3.000 914.4 6947.4 1898.042
1893.125 3 0.4 3.033 924.6 6957.6 1898.125
1893.208 3 0.4 3.033 924.6 6957.6 1898.208 2 10.7 2.892 881.4 6914.4
1893.292 3 0.7 3.058 932.2 6965.2 1898.292 2 11.7 2.975 906.8 6939.8
1893.375 3 0 3.000 914.4 6947.4 1898.375 3 3.7 3.308 1008.4 7041.4
1893.458 2 10.5 2.875 876.3 6909.3 1898.458 3 0.1 3.008 916.9 6949.9
1893.542 2 10.2 2.850 868.7 6901.7 1898.542 2 11.8 2.983 909.3 6942.3
1893.625 2 7.7 2.642 805.2 6838.2 1898.625 2 6.9 2.575 784.9 6817.9
1893.708 2 6.8 2.567 782.3 6815.3 1898.708 2 11.3 2.942 896.6 6929.6
1893.792 2 7.2 2.600 792.5 6825.5 1898.792 2 9.9 2.825 861.1 6894.1
1893.875 2 7.8 2.650 807.7 6840.7 1898.875 3 0.8 3.067 934.7 6967.7
1893.958 2 9.1 2.758 840.7 6873.7 1898.958 2 10.3 2.858 871.2 6904.2
1894.042 2 6.5 2.542 774.7 6807.7 1899.042 3 1 3.083 939.8 6972.8
1894.125 2 7 2.583 787.4 6820.4 1899.125 2 8.3 2.692 820.4 6853.4
1894.208 2 11.2 2.933 894.1 6927.1 1899.208 2 10.4 2.867 873.8 6906.8
1894.292 2 7.8 2.650 807.7 6840.7 1899.292 3 3.3 3.275 998.2 7031.2
1894.375 3 0.6 3.050 929.6 6962.6 1899.375 3 2.9 3.242 988.1 7021.1
1894.458 2 11 2.917 889.0 6922.0 1899.458 3 1.1 3.092 942.3 6975.3
1894.542 2 10.3 2.858 871.2 6904.2 1899.542 2 11.9 2.992 911.9 6944.9
1894.625 2 8.6 2.717 828.0 6861.0 1899.625 3 2.1 3.175 967.7 7000.7
1894.708 2 6.7 2.558 779.8 6812.8 1899.708 2 9.8 2.817 858.5 6891.5
1894.792 2 6.2 2.517 767.1 6800.1 1899.792 2 11.8 2.983 909.3 6942.3
1894.875 2 10.9 2.908 886.5 6919.5 1899.875 3 0 3.000 914.4 6947.4
1894.958 2 7.6 2.633 802.6 6835.6 1899.958 3 0.5 3.042 927.1 6960.1
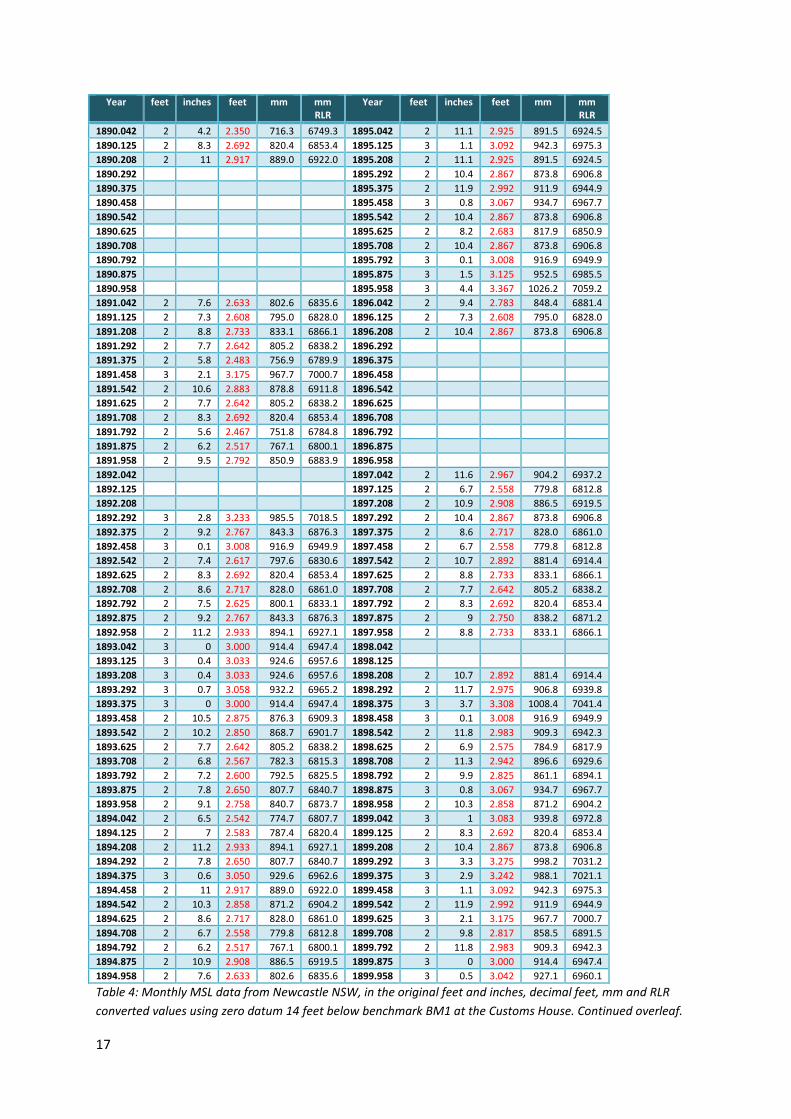
Table 4: Monthly MSL data from Newcastle NSW, in the original feet and inches, decimal feet, mm and RLR
converted values using zero datum 14 feet below benchmark BM1 at the Customs House. Continued overleaf.
18
Year feet inches feet mm mm RLR
1900.042 2 10 2.833 863.6 6896.6
1900.125 2 10.6 2.883 878.8 6911.8
1900.208
1900.292
1900.375
1900.458
1900.542
1900.625
1900.708
1900.792
1900.875
1900.958 2 10.2 2.850 868.7 6901.7
1901.042 2 11.9 2.992 911.9 6944.9
1901.125 2 9.6 2.800 853.4 6886.4
1901.208 2 9.8 2.817 858.5 6891.5
1901.292 3 2 3.167 965.2 6998.2
1901.375 2 11.5 2.958 901.7 6934.7
1901.458 3 2.3 3.192 972.8 7005.8
1901.542 2 11 2.917 889.0 6922.0
1901.625 2 8.3 2.692 820.4 6853.4
1901.708 2 8.2 2.683 817.9 6850.9
1901.792 2 9.6 2.800 853.4 6886.4
1901.875 2 7.1 2.592 789.9 6822.9
1901.958 2 11 2.917 889.0 6922.0
1902.042 3 0.5 3.042 927.1 6960.1
1902.125 2 11.9 2.992 911.9 6944.9
1902.208 3 0.1 3.008 916.9 6949.9
1902.292 3 0.5 3.042 927.1 6960.1
1902.375 2 10.7 2.892 881.4 6914.4
1902.458 2 10.7 2.892 881.4 6914.4
1902.542 2 10.6 2.883 878.8 6911.8
1902.625 2 8.6 2.717 828.0 6861.0
1902.708 2 11.3 2.942 896.6 6929.6
1902.792 2 9.7 2.808 856.0 6889.0
1902.875 2 8.5 2.708 825.5 6858.5
1902.958 2 11.1 2.925 891.5 6924.5
Year feet inches feet mm
1900.042 - - - -
1900.125 - - - -
1900.208 - - - -
1900.292 - - - -
1900.375 - - - -
1900.458 - - - -
1900.542 2 5.0 2.417 736.6
1900.625 2 3.3 2.275 693.4
1900.708 1 11.9 1.992 607.1
1900.792 1 10.6 1.883 574.0
1900.875 1 6.2 1.517 462.3
1900.958 1 10.9 1.908 581.7
1901.042 2 0.4 2.033 619.8
1901.125 1 10.8 1.900 579.1
1901.208 2 0.3 2.025 617.2
1901.292 2 2.8 2.233 680.7
1901.375 2 3.1 2.258 688.3
1901.458 2 5.4 2.450 746.8
1901.542 2 3.6 2.300 701.0
1901.625 1 11.7 1.975 602.0
1901.708 1 8.6 1.717 523.2
1901.792 1 11.4 1.950 594.4
1901.875 1 6.1 1.508 459.7
1901.958 2 1.5 2.125 647.7
1902.042 2 2.6 2.217 675.6
1902.125 2 3.4 2.283 696.0
1902.208 2 0.4 2.033 619.8
1902.292 2 5.4 2.450 746.8
1902.375 2 2.9 2.242 683.3
1902.458 1 9.8 1.817 553.7
1902.542 1 8.4 1.700 518.2
1902.625 1 10.0 1.833 558.8
1902.708 1 11.1 1.925 586.7
1902.792 1 8.7 1.725 525.8
1902.875 1 7.4 1.617 492.8
1902.958 1 9.7 1.808 551.2
Table 4 continued: Monthly MSL data
from Newcastle NSW (Russell 1893-
1904) in the original feet and inches, as
well as decimal feet, mm and RLR
converted values using zero datum 14
feet below benchmark BM1 at the
Customs House
Table 5: Monthly MSL data from
Yamba NSW, (Russell 1901-
1904). Gauge installed June
1900
19
Year feet inches feet mm mm RLR
1890 2 9.0 2.750 838.2 6871.2
1891 2 8.3 2.692 820.4 6853.4
1892 2 9.5 2.792 850.9 6883.9
1893 2 10.1 2.842 866.1 6899.1
1894 2 8.9 2.742 835.7 6868.7
1895 2 *11.9/8.4 *2.982/2.700 823.0 6856.0
1896 2 8.2 2.683 817.9 6850.9
1897 2 9.0 2.750 838.2 6871.2
1898 2 11.0 2.917 889.0 6922.0
1899 3 0.3 3.025 922.0 6955.0
1900 3 1.0 3.083 939.8 6972.8
1901 2 10.5 2.875 876.3 6909.3
1902 2 10.9 2.908 886.5 6919.5
1903 2 11.9 2.992 911.9 6944.9
1904 2 11.7 2.975 906.8 6939.8
1905 2 10.9 2.908 886.5 6919.5
1906 2 10.6 2.883 878.8 6911.8
1907 3 0.0 3.000 914.4 6947.4
1908 3 0.9 3.075 937.3 6970.3
1909 3 1.4 3.117 950.0 6983.0
1910 3 2.7 3.225 983.0 7016.0
1911 3 3.1 3.258 993.1 7026.1
1912 3 2.1 3.175 967.7 7000.7
1913 3 2.0 3.167 965.2 6998.2
1914 2 10.7 2.892 881.4 6914.4
1915 3 1.0 3.083 939.8 6972.8
1916 3 2.2 3.183 970.3 7003.3
* Data in red as in original 1895 observations and reported in Coghlan, values in black are corrected for gauge
stretched chain (Russell 1897). Data from newer gauge used from 1896 onwards in both sources.
Table 6: Annual MSL data from Newcastle NSW (from Coghlan 1913, 1917)
20
Year feet inches LW ft feet inches HW ft HTL ft HTL mm
1900.042 0 0 0.000 9 8 9.667 4.833 1473.2
1900.125 0 3 0.250 8 6 8.500 4.375 1333.5
1900.208 0 3 0.250 10 6 10.500 5.375 1638.3
1900.292 0 1 0.083 10 6 10.500 5.292 1612.9
1900.375 0 0 0.000 9 3 9.250 4.625 1409.7
1900.458 0 4 0.333 9 10 9.833 5.083 1549.4
1900.542 0 4 0.333 9 9 9.750 5.042 1536.7
1900.625 0 4 0.333 10 6 10.500 5.417 1651.0
1900.708 0 8 0.667 9 0 9.000 4.833 1473.2
1900.792 0 8 0.667 8 10 8.833 4.750 1447.8
1900.875 0 3 0.250 8 4 8.333 4.292 1308.1
1900.958 0 0 0.000 8 6 8.500 4.250 1295.4
Table 7: Monthly HHW and LLW observations for Port Adelaide in 1900, (from Proceedings of the
Parliament of South Australia, 1902)
Figure 8: Offset corrected MSL and HTL values for Port Adelaide from sources in text
3.0
3.5
4.0
4.5
5.0
5.5
6.0
19
00
.04
19
00
.13
19
00
.21
19
00
.29
19
00
.38
19
00
.46
19
00
.54
19
00
.63
19
00
.71
19
00
.79
19
00
.88
19
00
.96
19
01
.04
HTL Semaphore
HTL Semaphore MB
Inner Harbour
21
Year feet mm Year feet mm Year feet mm Year feet mm Year feet mm
1882.042 4.209 1283 1887.042 4.918 1499 1892.042 3.743 1141 1897.042 3.928 1197 1902.042 4.821 1469
1882.125 3.704 1129 1887.125 3.780 1152 1892.125 4.824 1470 1897.125 4.010 1222 1902.125 4.399 1341
1882.208 3.983 1214 1887.208 4.357 1328 1892.208 4.196 1279 1897.208 4.427 1349 1902.208 4.361 1329
1882.292 4.344 1324 1887.292 4.114 1254 1892.292 4.144 1263 1897.292 4.463 1360 1902.292 4.130 1259
1882.375 4.774 1455 1887.375 4.331 1320 1892.375 4.351 1326 1897.375 4.137 1261 1902.375 4.157 1267
1882.458 4.314 1315 1887.458 4.672 1424 1892.458 4.334 1321 1897.458 4.364 1330 1902.458 4.506 1373
1882.542 4.636 1413 1887.542 4.852 1479 1892.542 3.934 1199 1897.542 4.556 1389 1902.542 3.974 1211
1882.625 4.072 1241 1887.625 3.793 1156 1892.625 4.157 1267 1897.625 4.520 1378 1902.625 3.660 1116
1882.708 4.413 1345 1887.708 4.482 1366 1892.708 4.098 1249 1897.708 4.236 1291 1902.708 4.087 1246
1882.792 3.957 1206 1887.792 4.163 1269 1892.792 3.649 1112 1897.792 4.218 1286 1902.792 3.877 1182
1882.875 3.953 1205 1887.875 4.072 1241 1892.875 4.183 1275 1897.875 4.120 1256 1902.875 3.970 1210
1882.958 3.953 1205 1887.958 3.862 1177 1892.958 4.115 1254 1897.958 3.764 1147 1902.958 4.093 1248
1883.042 3.780 1152 1888.042 4.131 1259 1893.042 3.875 1181 1898.042 4.448 1356
1883.125 4.055 1236 1888.125 4.081 1244 1893.125 3.708 1130 1898.125 4.031 1229
1883.208 4.094 1248 1888.208 3.967 1209 1893.208 3.748 1142 1898.208 4.114 1254
1883.292 4.357 1328 1888.292 3.917 1194 1893.292 4.367 1331 1898.292 4.375 1334
1883.375 4.629 1411 1888.375 4.150 1265 1893.375 4.595 1401 1898.375 4.155 1266
1883.458 4.718 1438 1888.458 4.560 1390 1893.458 4.365 1330 1898.458 4.425 1349
1883.542 4.281 1305 1888.542 4.783 1458 1893.542 4.000 1219 1898.542 4.749 1447
1883.625 4.452 1357 1888.625 4.124 1257 1893.625 4.223 1287 1898.625 4.082 1244
1883.708 3.694 1126 1888.708 3.911 1192 1893.708 4.667 1423 1898.708 4.252 1296
1883.792 3.940 1201 1888.792 3.658 1115 1893.792 4.194 1278 1898.792 4.079 1243
1883.875 4.052 1235 1888.875 3.839 1170 1893.875 3.684 1123 1898.875 4.016 1224
1883.958 4.478 1365 1888.958 3.750 1143 1893.958 4.036 1230 1898.958 3.884 1184
1884.042 4.226 1288 1889.042 4.203 1281 1894.042 4.245 1294 1899.042 4.280 1305
1884.125 3.668 1118 1889.125 3.757 1145 1894.125 3.633 1107 1899.125 4.058 1237
1884.208 3.425 1044 1889.208 4.081 1244 1894.208 3.931 1198 1899.208 4.380 1335
1884.292 4.104 1251 1889.292 4.042 1232 1894.292 4.285 1306 1899.292 4.707 1435
1884.375 4.209 1283 1889.375 4.268 1301 1894.375 4.43 1350 1899.375 4.760 1451
1884.458 4.948 1508 1889.458 5.112 1558 1894.458 4.828 1472 1899.458 4.480 1366
1884.542 3.927 1197 1889.542 4.193 1278 1894.542 4.944 1507 1899.542 3.932 1198
1884.625 4.281 1305 1889.625 4.557 1389 1894.625 4.228 1289 1899.625 3.955 1205
1884.708 3.957 1206 1889.708 4.380 1335 1894.708 4.128 1258 1899.708 3.780 1152
1884.792 3.947 1203 1889.792 4.390 1338 1894.792 4.234 1291 1899.792 3.857 1176
1884.875 3.471 1058 1889.875 4.114 1254 1894.875 4.159 1268 1899.875 4.180 1274
1884.958 4.459 1359 1889.958 4.393 1339 1894.958 3.776 1151 1899.958 3.968 1209
1885.042 3.930 1198 1890.042 3.717 1133 1895.042 3.875 1181 1900.042 4.130 1259
1885.125 3.871 1180 1890.125 3.661 1116 1895.125 4.278 1304 1900.125 4.085 1245
1885.208 3.999 1219 1890.208 3.855 1175 1895.208 4.002 1220 1900.208 4.361 1329
1885.292 3.757 1145 1890.292 4.052 1235 1895.292 4.211 1284 1900.292 4.304 1312
1885.375 4.101 1250 1890.375 4.117 1255 1895.375 4.148 1264 1900.375 4.178 1273
1885.458 4.482 1366 1890.458 4.928 1502 1895.458 4.417 1346 1900.458 4.739 1444
1885.542 4.075 1242 1890.542 4.226 1288 1895.542 4.749 1447 1900.542 4.536 1383
1885.625 4.560 1390 1890.625 4.193 1278 1895.625 4.829 1472 1900.625 4.709 1435
1885.708 3.825 1166 1890.708 4.413 1345 1895.708 4.452 1357 1900.708 3.867 1179
1885.792 3.698 1127 1890.792 4.573 1394 1895.792 4.045 1233 1900.792 3.917 1194
1885.875 3.602 1098 1890.875 4.308 1313 1895.875 3.695 1126 1900.875 3.647 1112
1885.958 4.177 1273 1890.958 4.111 1253 1895.958 4.423 1348 1900.958 4.304 1312
1886.042 4.800 1463 1891.042 4.416 1346 1896.042 3.971 1210 1901.042 3.926 1197
1886.125 4.301 1311 1891.125 3.875 1181 1896.125 3.859 1176 1901.125 3.788 1155
1886.208 3.832 1168 1891.208 4.272 1302 1896.208 4.436 1352 1901.208 4.213 1284
1886.292 4.163 1269 1891.292 4.229 1289 1896.292 4.571 1393 1901.292 4.354 1327
1886.375 4.386 1337 1891.375 4.147 1264 1896.375 4.532 1381 1901.375 4.749 1447
1886.458 4.177 1273 1891.458 4.482 1366 1896.458 4.452 1357 1901.458 5.055 1541
1886.542 4.016 1224 1891.542 4.770 1454 1896.542 4.517 1377 1901.542 4.296 1309
1886.625 4.541 1384 1891.625 4.334 1321 1896.625 3.881 1183 1901.625 3.947 1203
1886.708 4.285 1306 1891.708 4.042 1232 1896.708 3.893 1187 1901.708 4.357 1328
1886.792 4.291 1308 1891.792 3.875 1181 1896.792 3.762 1147 1901.792 4.318 1316
1886.875 4.232 1290 1891.875 3.917 1194 1896.875 3.427 1045 1901.875 4.240 1292
1886.958 4.012 1223 1891.958 4.646 1416 1896.958 3.964 1208 1901.958 4.147 1264
Table 8: Original monthly mean sea level data from Port Adelaide Inner Harbour, 1882 to 1902. (Chapman and Inglis 1902), with
metric values added. The 1882 to 1892 values are identical to those in the PSMSL “metric” dataset for the Inner Harbour. The
datum is referred to as one selected by Goalen in 1875, about “3 inches” different from the City Survey datum.
22
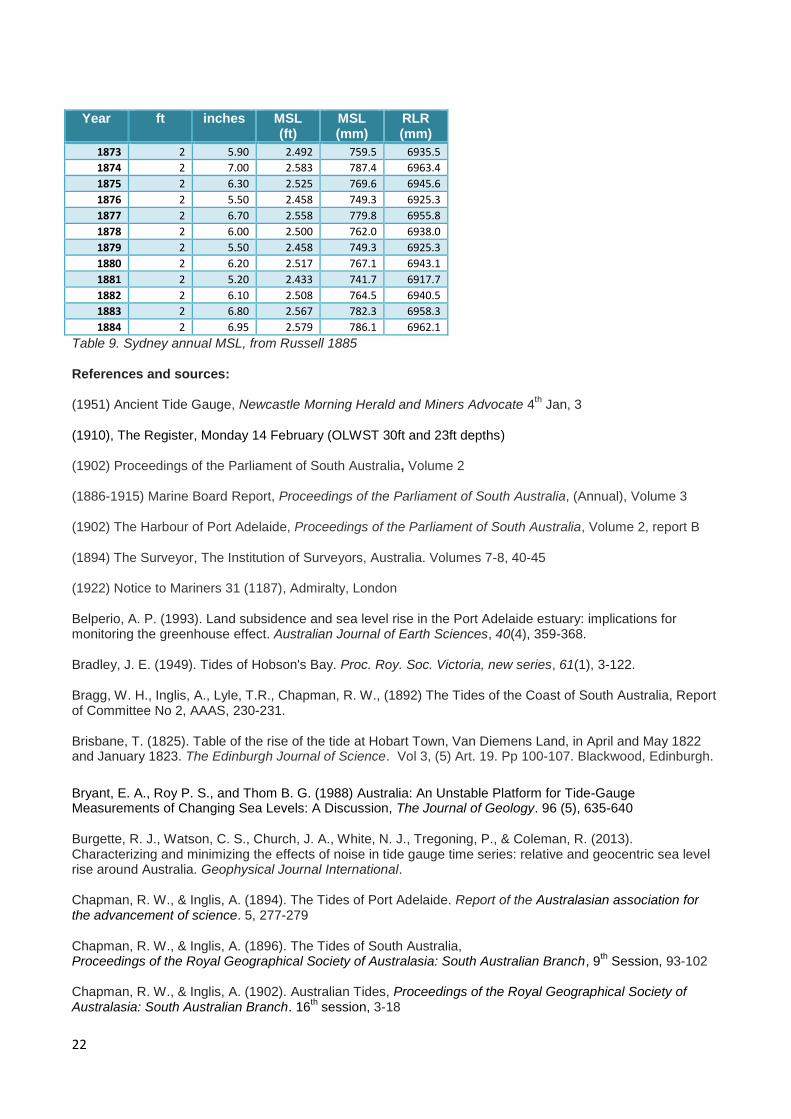
Year ft inches MSL (ft)
MSL (mm)
RLR (mm)
1873 2 5.90 2.492 759.5 6935.5
1874 2 7.00 2.583 787.4 6963.4
1875 2 6.30 2.525 769.6 6945.6
1876 2 5.50 2.458 749.3 6925.3
1877 2 6.70 2.558 779.8 6955.8
1878 2 6.00 2.500 762.0 6938.0
1879 2 5.50 2.458 749.3 6925.3
1880 2 6.20 2.517 767.1 6943.1
1881 2 5.20 2.433 741.7 6917.7
1882 2 6.10 2.508 764.5 6940.5
1883 2 6.80 2.567 782.3 6958.3
1884 2 6.95 2.579 786.1 6962.1
Table 9. Sydney annual MSL, from Russell 1885 References and sources: (1951) Ancient Tide Gauge, Newcastle Morning Herald and Miners Advocate 4
th Jan, 3
(1910), The Register, Monday 14 February (OLWST 30ft and 23ft depths) (1902) Proceedings of the Parliament of South Australia, Volume 2 (1886-1915) Marine Board Report, Proceedings of the Parliament of South Australia, (Annual), Volume 3 (1902) The Harbour of Port Adelaide, Proceedings of the Parliament of South Australia, Volume 2, report B (1894) The Surveyor, The Institution of Surveyors, Australia. Volumes 7-8, 40-45 (1922) Notice to Mariners 31 (1187), Admiralty, London Belperio, A. P. (1993). Land subsidence and sea level rise in the Port Adelaide estuary: implications for monitoring the greenhouse effect. Australian Journal of Earth Sciences, 40(4), 359-368. Bradley, J. E. (1949). Tides of Hobson's Bay. Proc. Roy. Soc. Victoria, new series, 61(1), 3-122. Bragg, W. H., Inglis, A., Lyle, T.R., Chapman, R. W., (1892) The Tides of the Coast of South Australia, Report of Committee No 2, AAAS, 230-231. Brisbane, T. (1825). Table of the rise of the tide at Hobart Town, Van Diemens Land, in April and May 1822 and January 1823. The Edinburgh Journal of Science. Vol 3, (5) Art. 19. Pp 100-107. Blackwood, Edinburgh.
Bryant, E. A., Roy P. S., and Thom B. G. (1988) Australia: An Unstable Platform for Tide-Gauge Measurements of Changing Sea Levels: A Discussion, The Journal of Geology. 96 (5), 635-640 Burgette, R. J., Watson, C. S., Church, J. A., White, N. J., Tregoning, P., & Coleman, R. (2013). Characterizing and minimizing the effects of noise in tide gauge time series: relative and geocentric sea level rise around Australia. Geophysical Journal International. Chapman, R. W., & Inglis, A. (1894). The Tides of Port Adelaide. Report of the Australasian association for the advancement of science. 5, 277-279 Chapman, R. W., & Inglis, A. (1896). The Tides of South Australia, Proceedings of the Royal Geographical Society of Australasia: South Australian Branch, 9
th Session, 93-102
Chapman, R. W., & Inglis, A. (1902). Australian Tides, Proceedings of the Royal Geographical Society of Australasia: South Australian Branch. 16
th session, 3-18
23
Chapman, R. W. (1903). Tides at Port Darwin. Nature, 68, 295. Coghlan, T. A. (1914). Table 47-Tides-Newcastle-1892-1912, New South Wales Statistical Register for 1912. Commonwealth Bureau of Census and Statistics. New South Wales Office, 146 Coghlan, T. A. (1917). Table 47-Tides-Newcastle-1906-1916, New South Wales Statistical Register for 1916. Commonwealth Bureau of Census and Statistics. New South Wales Office, 480 Cole, T. N. (2011). An acceleration in New Zealand’s sea level record? (Thesis, Master of Science). University of Otago. Retrieved from http://hdl.handle.net/10523/628 Cooper, J. A. G., & Pilkey, O. H. (Eds.). (2012). Pitfalls of Shoreline Stabilization: Selected Case Studies (Vol. 3). Springer. Culver, R. (1970). Final Summary Report on Beach Erosion Studies. University of Adelaide, Dept. of Civil Eng. A report commissioned by the Seaside Councils Committee and the State Government of Sth. Aust. Darwin, G. H. (1889) Second series of Results of the Harmonic Analysis of Tidal Data, Proceedings of the Royal Society, 556-611 Easton, A. K. (1970). The tides of the continent of Australia (No. 37). Horace Lamb Centre for Oceanographical Research, Flinders University of South Australia. Ellery, R. L. J. (1879). The Tidal Datum of Hobson’s Bay. Transactions and Proceedings of the Royal Society of Victoria, 16, 146-148. Fadil, A., Denys, P., Tenzer, R., Grenfell, H. R., & Willis, P. (2013). New Zealand 20th century sea level rise: Resolving the vertical land motion using space geodetic and geological data. Journal of Geophysical Research: Oceans, 118(11), 6076-6091. Featherstone, W. E., Filmer, M. S., Penna, N. T., Morgan, L. M., & Schenk, A. (2012). Anthropogenic land subsidence in the Perth Basin: Challenges for its retrospective geodetic detection. Journal of the Royal Society of Western Australia, 95(1), 53-62. Filmer, M.S. and Sandford, G. (2007). An investigation into the displacement of Permanent Survey Marks in the Hillcrest area resulting from reactive soils. Journal of Spatial Science. 52 (1): pp. 183-192. Gehrels, W. R., Callard, S. L., Moss, P. T., Marshall, W. A., Blaauw, M., Hunter, J., ... & Garnett, M. H. (2012). Nineteenth and twentieth century sea-level changes in Tasmania and New Zealand. Earth and Planetary Science Letters, 315, 94-102. Hannah J., Bell, R. G., (2012) Regional sea level trends in New Zealand, Journal of Geophysical Research, 117, C01004, doi:10.1029/2011JC007591 Holbrook, N. J., Goodwin, I. D., McGregor, S., Molina, E., & Power, S. B. (2011). ENSO to multi-decadal time scale changes in East Australian Current transports and Fort Denison sea level: Oceanic Rossby waves as the connecting mechanism. Deep Sea Research Part II: Topical Studies in Oceanography, 58(5), 547-558. Hunter, J., Coleman, R., & Pugh, D. (2003). The sea level at Port Arthur, Tasmania, from 1841 to the present. Geophysical Research Letters, 30(7). Hunter, J. R. (2008). Historical and Projected Sea-Level Extremes for Hobart and Burnie, Tasmania. Department of Primary Industries and Water. Association d'Oceanographie Physique (1939). Monthly and Annual Mean Heights of Sea-level up to and including the year 1936. Publication Scientifique No. 5. 224 & 226. Association d'Oceanographie Physique (1950). Monthly and Annual Mean Heights of Sea-level 1937 to 1946, and unpublished data for earlier years. Publication Scientifique No. 10. 16 & 68.
24
King, R., (2008) Port Adelaide seawater & stormwater flood risk treatment. Conference Papers: IPWEA National Conference on Climate Change 'Responding to Sea Level Rise' Coffs Harbour, NSW 3 - 5 August 2008 Lamontagne, S., Le Gal La Salle, C., Simmons, C., James-Smith, J., Harrington, N., Love, A., Smith, A., Hancock, G. and H. Fallowfield. (2005) “Estimation of groundwater and groundwater N discharge to the Adelaide Coastal Waters Study area”. ACWS Technical Report No. 4 prepared for the Adelaide Coastal Waters Study Steering Committee by the Flinders Centre for Coastal and Catchment Environments. Mault, A. (1889). On some tide observations at Hobart during February and March, 1889. In Papers & Proceedings of the Royal Society of Tasmania (pp. 8-12). Mackenzie, A. D. (1939). Coastal Erosion in Victoria. Journal of Institute of Engineering. Australia. 11, 229-236. Modra, B. (2013) Tide Gauge Histories. Metadata for National and NSW Tide Gauges. Report MHL2179 October 2013, Manly Hydraulics Lab. NSW. Russell, H. C. (1885) Anniversary Address, J. & Proc. Roy. Soc. New South Wales, 19, 1-27 Russell, H. C. (1898) Meteorology of New South Wales. Results of Rain, River, and Evaporation Observations Made in New South Wales xxx-xxxii Russell, H. C. (1904) Meteorology of New South Wales. Results of Rain, River, and Evaporation Observations Made in New South Wales Shortt, J. (1889). Notes on the possible oscillation of levels of land and sea in Tasmania during recent years. In Papers & Proceedings of the Royal Society of Tasmania (pp. 18-20). Spada G, Gallassi G, (2012). New estimates of secular sea level rise from tide gauge data and GIA modelling Geophys. J. Int. 191, 1067–1094, doi: 10.1111/j.1365-246X.2012.05663.x Stanley, H. J., (1875). The Silting up of Hobsons Bay. The Argus, Melbourne, 29
th April 1875, 6-7.
Tenzer, R., & Gladkikh, V. (2014). Analysis of the Sea Level Change in New Zealand. In Earth on the Edge: Science for a Sustainable Planet (pp. 135-139). Springer Berlin Heidelberg. Watson, P. J. (2011). Is there evidence yet of acceleration in mean sea level rise around mainland Australia?. Journal of Coastal Research, 27(2), 368-377. Watson, P. J., Commins, R., Janssen, V., McElroy, S., Batman, G., & Connors, D. (2012). Augmenting the utility of NSW longest tide gauge records with continuous GNSS technology. Wright, T. (1909). Harmonic Tidal Constants for Certain Chinese and New Zealand Ports. Proceedings of the Royal Society of London. Series A, 83(560), 127-130. Wright, T. (1902). Harmonic Tidal Constants for Certain Australian and Chinese Ports. Proceedings of the Royal Society of London Series A. 71:91–96 Wynne, A. A., Fotheringham, D. G., Freeman, R., Moulds, B., Penney, S. W., Petrusevics, P., Tucker, R., Ellis, D. P. (1984) Adelaide Coast Protection Strategy Review 1984 Report prepared for The Coast Protection
Board South Australia